
Explainable Artificial Intelligence Paves the Way in Precision Diagnostics and Biomarker Discovery for the Subclass of Diabetic Retinopathy in Type 2 Diabetics

 ,
,  , ,
, ,  and
and 
Abstract
1. Introduction
2. Materials and Methods
2.1. Study Design, Ethical Approval, and Data Features
2.2. Classification Algorithms
2.3. Feature Selection Algorithms
2.4. Validation Method and Performance Metrics
3. Results
3.1. Dataset Preparation
3.2. Classification Using All Features
3.3. Feature Selection
4. Discussion
5. Limitation and Future Works
6. Conclusions
Supplementary Materials
Author Contributions
Funding
Institutional Review Board Statement
Informed Consent Statement
Data Availability Statement
Conflicts of Interest
References
- Cheung, N.; Wong, T.Y. Diabetic retinopathy and systemic vascular complications. Prog. Retin. Eye Res. 2008, 27, 161–176. [Google Scholar] [CrossRef] [PubMed]
- Cade, W.T. Diabetes-related microvascular and macrovascular diseases in the physical therapy setting. Phys. Ther. 2008, 88, 1322–1335. [Google Scholar] [CrossRef]
- Fong, D.S.; Aiello, L.; Gardner, T.W.; King, G.L.; Blankenship, G.; Cavallerano, J.D.; Ferris III, F.L.; Klein, R.; Association, A.D. Retinopathy in diabetes. Diabetes Care 2004, 27, s84–s87. [Google Scholar] [CrossRef] [PubMed]
- Cabrera, A.P.; Monickaraj, F.; Rangasamy, S.; Hobbs, S.; McGuire, P.; Das, A. Do genomic factors play a role in diabetic retinopathy? J. Clin. Med. 2020, 9, 216. [Google Scholar] [CrossRef] [PubMed]
- Seo, D.H.; Kim, S.H.; Song, J.H.; Hong, S.; Suh, Y.J.; Ahn, S.H.; Woo, J.-T.; Baik, S.H.; Park, Y.; Lee, K.W. Presence of carotid plaque is associated with rapid renal function decline in patients with type 2 diabetes mellitus and normal renal function. Diabetes Metab. J. 2019, 43, 840–853. [Google Scholar] [CrossRef] [PubMed]
- Bi, H.; Guo, Z.; Jia, X.; Liu, H.; Ma, L.; Xue, L. The key points in the pre-analytical procedures of blood and urine samples in metabolomics studies. Metabolomics 2020, 16, 68. [Google Scholar] [CrossRef] [PubMed]
- Liew, G.; Lei, Z.; Tan, G.; Joachim, N.; Ho, I.-V.; Wong, T.Y.; Mitchell, P.; Gopinath, B.; Crossett, B. Metabolomics of diabetic retinopathy. Curr. Diabetes Rep. 2017, 17, 102. [Google Scholar] [CrossRef]
- Chen, L.; Cheng, C.-Y.; Choi, H.; Ikram, M.K.; Sabanayagam, C.; Tan, G.S.; Tian, D.; Zhang, L.; Venkatesan, G.; Tai, E.S. Plasma metabonomic profiling of diabetic retinopathy. Diabetes 2016, 65, 1099–1108. [Google Scholar] [CrossRef]
- Bansal, G.; Wu, T.; Zhou, J.; Fok, R.; Nushi, B.; Kamar, E.; Ribeiro, M.T.; Weld, D. Does the whole exceed its parts? the effect of ai explanations on complementary team performance. In Proceedings of the 2021 CHI Conference on Human Factors in Computing Systems, Yokohama, Japan, 8–13 May 2021; pp. 1–16. [Google Scholar]
- Ribeiro, M.T.; Singh, S.; Guestrin, C. “Why should i trust you?” Explaining the predictions of any classifier. In Proceedings of the 22nd ACM SIGKDD International Conference on Knowledge Discovery and Data Mining, San Francisco, CA, USA, 13–17 August 2016; pp. 1135–1144. [Google Scholar]
- Utomo, S.; John, A.; Pratap, A.; Jiang, Z.-S.; Karthikeyan, P.; Hsiung, P.-A. AIX Implementation in Image-Based PM2. 5 Estimation: Toward an AI Model for Better Understanding. In Proceedings of the 2023 15th International Conference on Knowledge and Smart Technology (KST), Phuket, Thailand, 21–24 February 2023; pp. 1–6. [Google Scholar]
- Pratap, A.; Sardana, N.; Utomo, S.; John, A.; Karthikeyan, P.; Hsiung, P.-A. Analysis of Defect Associated with Powder Bed Fusion with Deep Learning and Explainable AI. In Proceedings of the 2023 15th International Conference on Knowledge and Smart Technology (KST), Phuket, Thailand, 21–24 February 2023; pp. 1–6. [Google Scholar]
- Joseph, L.P.; Joseph, E.A.; Prasad, R. Explainable diabetes classification using hybrid Bayesian-optimized TabNet architecture. Comput. Biol. Med. 2022, 151, 106178. [Google Scholar] [CrossRef]
- Alicioglu, G.; Sun, B. A survey of visual analytics for Explainable Artificial Intelligence methods. Comput. Graph. 2022, 102, 502–520. [Google Scholar] [CrossRef]
- Ren, Z.; Qian, K.; Dong, F.; Dai, Z.; Nejdl, W.; Yamamoto, Y.; Schuller, B.W. Deep attention-based neural networks for explainable heart sound classification. Mach. Learn. Appl. 2022, 9, 100322. [Google Scholar] [CrossRef]
- Kumari, S.; Kumar, D.; Mittal, M. An ensemble approach for classification and prediction of diabetes mellitus using soft voting classifier. Int. J. Cogn. Comput. Eng. 2021, 2, 40–46. [Google Scholar] [CrossRef]
- Meena, J.; Hasija, Y. Application of explainable artificial intelligence in the identification of Squamous Cell Carcinoma biomarkers. Comput. Biol. Med. 2022, 146, 105505. [Google Scholar] [CrossRef] [PubMed]
- Ogunleye, A.; Wang, Q.-G. XGBoost model for chronic kidney disease diagnosis. IEEE/ACM Trans. Comput. Biol. Bioinform. 2019, 17, 2131–2140. [Google Scholar] [CrossRef] [PubMed]
- Ma, B.; Meng, F.; Yan, G.; Yan, H.; Chai, B.; Song, F. Diagnostic classification of cancers using extreme gradient boosting algorithm and multi-omics data. Comput. Biol. Med. 2020, 121, 103761. [Google Scholar] [CrossRef] [PubMed]
- Sodmann, P.; Vollmer, M.; Nath, N.; Kaderali, L. A convolutional neural network for ECG annotation as the basis for classification of cardiac rhythms. Physiol. Meas. 2018, 39, 104005. [Google Scholar] [CrossRef] [PubMed]
- Sarica, A.; Quattrone, A.; Quattrone, A. Explainable boosting machine for predicting Alzheimer’s disease from MRI hippocampal subfields. In Proceedings of the International Conference on Brain Informatics, 14th International Conference Sep., Virtual, 14–19 September 2021; pp. 341–350. [Google Scholar]
- Obayya, M.; Nemri, N.; Nour, M.K.; Al Duhayyim, M.; Mohsen, H.; Rizwanullah, M.; Sarwar Zamani, A.; Motwakel, A. Explainable Artificial Intelligence Enabled TeleOphthalmology for Diabetic Retinopathy Grading and Classification. Appl. Sci. 2022, 12, 8749. [Google Scholar] [CrossRef]
- Lalithadevi, B.; Krishnaveni, S.; Gnanadurai, J.S.C. A Feasibility Study of Diabetic Retinopathy Detection in Type II Diabetic Patients Based on Explainable Artificial Intelligence. J. Med. Syst. 2023, 47, 85. [Google Scholar] [CrossRef]
- Cansel, N.; Hilal Yagin, F.; Akan, M.; Ilkay Aygul, B. Interpretable estimation of suicide risk and severity from complete blood count parameters with explainable artificial intelligence methods. Psychiatr. Danub. 2023, 35, 62–72. [Google Scholar] [CrossRef]
- Yun, J.H.; Kim, J.-M.; Jeon, H.J.; Oh, T.; Choi, H.J.; Kim, B.-J. Metabolomics profiles associated with diabetic retinopathy in type 2 diabetes patients. PLoS ONE 2020, 15, e0241365. [Google Scholar] [CrossRef]
- Muthukumarasamy, S.; Tamilarasan, A.K.; Ayeelyan, J.; Adimoolam, M. Machine learning in healthcare diagnosis. Blockchain Mach. Learn. E-Healthc. Syst. 2020, 343–366. [Google Scholar]
- Chen, T.; Guestrin, C. Xgboost: A scalable tree boosting system. In Proceedings of the 22nd Acm Sigkdd International Conference on Knowledge Discovery and Data Mining, San Francisco, CA, USA, 13–17 August 2016; pp. 785–794. [Google Scholar]
- Duan, T.; Anand, A.; Ding, D.Y.; Thai, K.K.; Basu, S.; Ng, A.; Schuler, A. Ngboost: Natural gradient boosting for probabilistic prediction. In Proceedings of the International Conference on Machine Learning, Proceedings of the 37th International Conference on Machine Learning, PMLR, Virtual, 13–18 July 2020; pp. 2690–2700. [Google Scholar]
- Maxwell, A.E.; Sharma, M.; Donaldson, K.A. Explainable boosting machines for slope failure spatial predictive modeling. Remote Sens. 2021, 13, 4991. [Google Scholar] [CrossRef]
- Ding, C.; Peng, H. Minimum redundancy feature selection from microarray gene expression data. J. Bioinform. Comput. Biol. 2005, 3, 185–205. [Google Scholar] [CrossRef] [PubMed]
- Aydin, Z.; Kaynar, O.; Görmez, Y. Dimensionality reduction for protein secondary structure and solvent accesibility prediction. J. Bioinform. Comput. Biol. 2018, 16, 1850020. [Google Scholar] [CrossRef] [PubMed]
- Kursa, M.B.; Rudnicki, W.R. Feature selection with the Boruta package. J. Stat. Softw. 2010, 36, 1–13. [Google Scholar] [CrossRef]
- Maurya, N.S.; Kushwah, S.; Kushwaha, S.; Chawade, A.; Mani, A. Prognostic model development for classification of colorectal adenocarcinoma by using machine learning model based on feature selection technique boruta. Sci. Rep. 2023, 13, 6413. [Google Scholar] [CrossRef] [PubMed]
- Yadav, S.; Shukla, S. Analysis of k-fold cross-validation over hold-out validation on colossal datasets for quality classification. In Proceedings of the 2016 IEEE 6th International Conference on Advanced Computing (IACC), Bhimavaram, India, 27–28 February 2016; pp. 78–83. [Google Scholar]
- Rastogi, D.; Johri, P.; Tiwari, V.; Elngar, A.A. Multi-class classification of brain tumour magnetic resonance images using multi-branch network with inception block and five-fold cross validation deep learning framework. Biomed. Signal Process. Control 2024, 88, 105602. [Google Scholar] [CrossRef]
- Anderson, D.; Burnham, K. Model Selection and Multi-Model Inference; Springer: Second, NY, USA, 2004; Volume 63, p. 10. [Google Scholar]
- Müller, A.C.; Guido, S. Introduction to Machine Learning with Python: A Guide for Data Scientists; O’Reilly Media, Inc.: Sebastopol, CA, USA, 2016. [Google Scholar]
- Japkowicz, N.; Shah, M. Evaluating Learning Algorithms: A Classification Perspective; Cambridge University Press: New York, NY, USA, 2011. [Google Scholar]
- Güneş, S.; Polat, K.; Yosunkaya, Ş. Multi-class f-score feature selection approach to classification of obstructive sleep apnea syndrome. Expert Syst. Appl. 2010, 37, 998–1004. [Google Scholar] [CrossRef]
- Stern, R.H. Interpretation of the Area Under the ROC Curve for Risk Prediction Models. arXiv 2021, arXiv:2102.11053. [Google Scholar]
- Demircioğlu, A. Measuring the bias of incorrect application of feature selection when using cross-validation in radiomics. Insights Into Imaging 2021, 12, 1–10. [Google Scholar] [CrossRef]
- Hendry, D.F.; Nielsen, B. Econometric Modeling: A Likelihood Approach; Princeton University Press: Princeton, NJ, USA, 2007. [Google Scholar]
- Hekimoğlu, C.H. Vaccine epidemiology: Epidemiologic study designs for vaccine effectiveness. Turk. Bull. Hyg. Exp. Biol. 2016, 73, 161–174. [Google Scholar] [CrossRef]
- Lindley, D.V. A statistical paradox. Biometrika 1957, 44, 187–192. [Google Scholar]
- Zhang, C.; Ma, Y. Ensemble Machine Learning: Methods and Applications; Springer: Berlin/Heidelberg, Germany, 2012. [Google Scholar]
- Lunneborg, C. Ansari-Bradley Test. In Encyclopedia of Statistics in Behavioral Science; Wiley: Hoboken, NJ, USA, 2005. [Google Scholar]
- Attfield, C.L. A Bartlett adjustment to the likelihood ratio test for a system of equations. J. Econom. 1995, 66, 207–223. [Google Scholar]
- Hsieh, S.-L.; Hsieh, S.-H.; Cheng, P.-H.; Chen, C.-H.; Hsu, K.-P.; Lee, I.-S.; Wang, Z.; Lai, F. Design ensemble machine learning model for breast cancer diagnosis. J. Med. Syst. 2012, 36, 2841–2847. [Google Scholar] [CrossRef] [PubMed]
- Frolov, A.A.; Husek, D.; Muraviev, I.P.; Polyakov, P.Y. Boolean factor analysis by attractor neural network. IEEE Trans. Neural Netw. 2007, 18, 698–707. [Google Scholar] [CrossRef] [PubMed][Green Version]
- Tilahun, M.; Gobena, T.; Dereje, D.; Welde, M.; Yideg, G. Prevalence of Diabetic retinopathy and its associated factors among diabetic patients at Debre Markos referral hospital, Northwest Ethiopia, 2019: Hospital-based cross-sectional study. Diabetes Metab. Syndr. Obes. 2020, 13, 2179–2187. [Google Scholar] [CrossRef] [PubMed]
- Cheloni, R.; Gandolfi, S.A.; Signorelli, C.; Odone, A. Global prevalence of diabetic retinopathy: Protocol for a systematic review and meta-analysis. BMJ Open 2019, 9, e022188. [Google Scholar] [CrossRef]
- Galal, A.; Talal, M.; Moustafa, A. Applications of machine learning in metabolomics: Disease modeling and classification. Front. Genet. 2022, 13, 1017340. [Google Scholar] [CrossRef]
- Cai, J.; Luo, J.; Wang, S.; Yang, S. Feature selection in machine learning: A new perspective. Neurocomputing 2018, 300, 70–79. [Google Scholar] [CrossRef]
- Li, J.; Guo, C.; Wang, T.; Xu, Y.; Peng, F.; Zhao, S.; Li, H.; Jin, D.; Xia, Z.; Che, M. Interpretable machine learning-derived nomogram model for early detection of diabetic retinopathy in type 2 diabetes mellitus: A widely targeted metabolomics study. Nutr. Diabetes 2022, 12, 36. [Google Scholar] [CrossRef]
- Peiyu, L.; Wang, H.; Fan, Z.; Tian, G. Identification of Key Biomarkers for Early Warning of Diabetic Retinopathy Using BP Neural Network Algorithm and Hierarchical Clustering Analysis. medRxiv 2023. [Google Scholar] [CrossRef]
- Schwarcz, R. The kynurenine pathway of tryptophan degradation as a drug target. Curr. Opin. Pharmacol. 2004, 4, 12–17. [Google Scholar] [CrossRef] [PubMed]
- Andrzejewska-Buczko, J.; Pawlak, D.; Tankiewicz, A.; Matys, T.; Buczko, W. Possible involvement of kynurenamines in the pathogenesis of cataract in diabetic patients. Med. Sci. Monit. 2001, 7, CR742–CR745. [Google Scholar]
- Fiedorowicz, M.; Choragiewicz, T.; Thaler, S.; Schuettauf, F.; Nowakowska, D.; Wojtunik, K.; Reibaldi, M.; Avitabile, T.; Kocki, T.; Turski, W.A. Tryptophan and kynurenine pathway metabolites in animal models of retinal and optic nerve damage: Different dynamics of changes. Front. Physiol. 2019, 10, 1254. [Google Scholar] [CrossRef] [PubMed]
- Kong, L.; Sun, Y.; Sun, H.; Zhang, A.-H.; Zhang, B.; Ge, N.; Wang, X.-J. Chinmedomics strategy for elucidating the pharmacological effects and discovering bio active compounds from keluoxin against diabetic retinopathy. Front. Pharmacol. 2022, 13, 728256. [Google Scholar] [CrossRef]
- Cole, L.K.; Vance, J.E.; Vance, D.E. Phosphatidylcholine biosynthesis and lipoprotein metabolism. Biochim. Et Biophys. Acta (BBA)-Mol. Cell Biol. Lipids 2012, 1821, 754–761. [Google Scholar] [CrossRef]
- Van Der Veen, J.N.; Lingrell, S.; Vance, D.E. The membrane lipid phosphatidylcholine is an unexpected source of triacylglycerol in the liver. J. Biol. Chem. 2012, 287, 23418–23426. [Google Scholar] [CrossRef]
- Hou, X.-W.; Wang, Y.; Pan, C.-W. Metabolomics in diabetic retinopathy: A systematic review. Investig. Ophthalmol. Vis. Sci. 2021, 62, 4. [Google Scholar] [CrossRef]
- Kang, Q.; Yang, C. Oxidative stress and diabetic retinopathy: Molecular mechanisms, pathogenetic role and therapeutic implications. Redox Biol. 2020, 37, 101799. [Google Scholar] [CrossRef]
- Fort, P.E.; Rajendiran, T.M.; Soni, T.; Byun, J.; Shan, Y.; Looker, H.C.; Nelson, R.G.; Kretzler, M.; Michailidis, G.; Roger, J.E. Diminished retinal complex lipid synthesis and impaired fatty acid β-oxidation associated with human diabetic retinopathy. JCI Insight 2021, 6, e152109. [Google Scholar] [CrossRef]
- Zong, G.-W.; Wang, W.-Y.; Zheng, J.; Zhang, W.; Luo, W.-M.; Fang, Z.-Z.; Zhang, Q. A Metabolism-Based Interpretable Machine Learning Prediction Model for Diabetic Retinopathy Risk: A Cross-Sectional Study in Chinese Patients with Type 2 Diabetes. J. Diabetes Res. 2023, 2023, 3990035. [Google Scholar] [CrossRef] [PubMed]
- Wang, W.-Y.; Liu, X.; Gao, X.-Q.; Li, X.; Fang, Z.-Z. Relationship between acylcarnitine and the risk of retinopathy in type 2 diabetes mellitus. Front. Endocrinol. 2022, 13, 834205. [Google Scholar] [CrossRef] [PubMed]
- Luo, H.-H.; Li, J.; Feng, X.-F.; Sun, X.-Y.; Li, J.; Yang, X.; Fang, Z.-Z. Plasma phenylalanine and tyrosine and their interactions with diabetic nephropathy for risk of diabetic retinopathy in type 2 diabetes. BMJ Open Diabetes Res. Care 2020, 8, e000877. [Google Scholar] [CrossRef] [PubMed]
- Reverter, J.L.; Nadal, J.; Ballester, J.; Ramió-Lluch, L.; Rivera, M.M.; Fernández-Novell, J.M.; Elizalde, J.; Abengoechea, S.; Rodriguez, J.-E. Diabetic retinopathy is associated with decreased tyrosine nitrosylation of vitreous interleukins IL-1α, IL-1β, and IL-7. Ophthalmic Res. 2011, 46, 169–174. [Google Scholar] [CrossRef] [PubMed]
- Kowluru, R.A. Cross talks between oxidative stress, inflammation and epigenetics in diabetic retinopathy. Cells 2023, 12, 300. [Google Scholar] [CrossRef]
- Chen, C.; Ding, P.; Yan, W.; Wang, Z.; Lan, Y.; Yan, X.; Li, T.; Han, J. Pharmacological roles of lncRNAs in diabetic retinopathy with a focus on oxidative stress and inflammation. Biochem. Pharmacol. 2023, 214, 115643. [Google Scholar] [CrossRef]
- Andrés-Blasco, I.; Gallego-Martínez, A.; Machado, X.; Cruz-Espinosa, J.; Di Lauro, S.; Casaroli-Marano, R.; Alegre-Ituarte, V.; Arévalo, J.F.; Pinazo-Durán, M.D. Oxidative Stress, Inflammatory, Angiogenic, and Apoptotic molecules in Proliferative Diabetic Retinopathy and Diabetic Macular Edema Patients. Int. J. Mol. Sci. 2023, 24, 8227. [Google Scholar] [CrossRef]
- Rodríguez, M.L.; Pérez, S.; Mena-Mollá, S.; Desco, M.C.; Ortega, Á.L. Oxidative stress and microvascular alterations in diabetic retinopathy: Future Therapies. Oxidative Med. Cell. Longev. 2019, 2019, 4940825. [Google Scholar] [CrossRef]


| Dataset | Number of NDR Samples | Number of NPDR Samples | Number of PDR Samples | Total Number of Samples |
|---|---|---|---|---|
| All | 143 | 123 | 51 | 317 |
| Discovery | 129 | 111 | 46 | 286 |
| Validation | 14 | 12 | 5 | 31 |
| Model | Hyper-Parameter | Hyper-Parameter Space Low Value | Hyper-Parameter Space High Value | Optimum Value |
|---|---|---|---|---|
| XGBoost | Learning rate | 10−8 | 10−1 | 0.02419 |
| Number of estimator | 50 | 1000 | 487 | |
| Maximum depth | 1 | 8 | 5 | |
| NGBoost | Number of estimator | 50 | 1000 | 128 |
| Learning rate | 10−8 | 10−1 | 0.089765 |
| Model | Accuracy (%) | Precision (%) | Recall (%) | FI-Score (%) | AUCROC (%) |
|---|---|---|---|---|---|
| XGBoost | 86.36 ± 1.91 | 86.33 ± 1.90 | 86.36 ± 1.75 | 86.34 ± 1.84 | 95 ± 0.19 |
| NGBoost | 85.31 ± 1.38 | 85.86 ± 1.37 | 85.82 ± 1.27 | 85.84 ± 1.32 | 95 ± 0.21 |
| EBM | 89.51 ± 1.65 | 89.45 ± 1.64 | 89.51 ± 1.83 | 89.48 ± 1.73 | 97 ± 0.18 |
| Model/Algorithm | Selected Biomarker Lists |
|---|---|
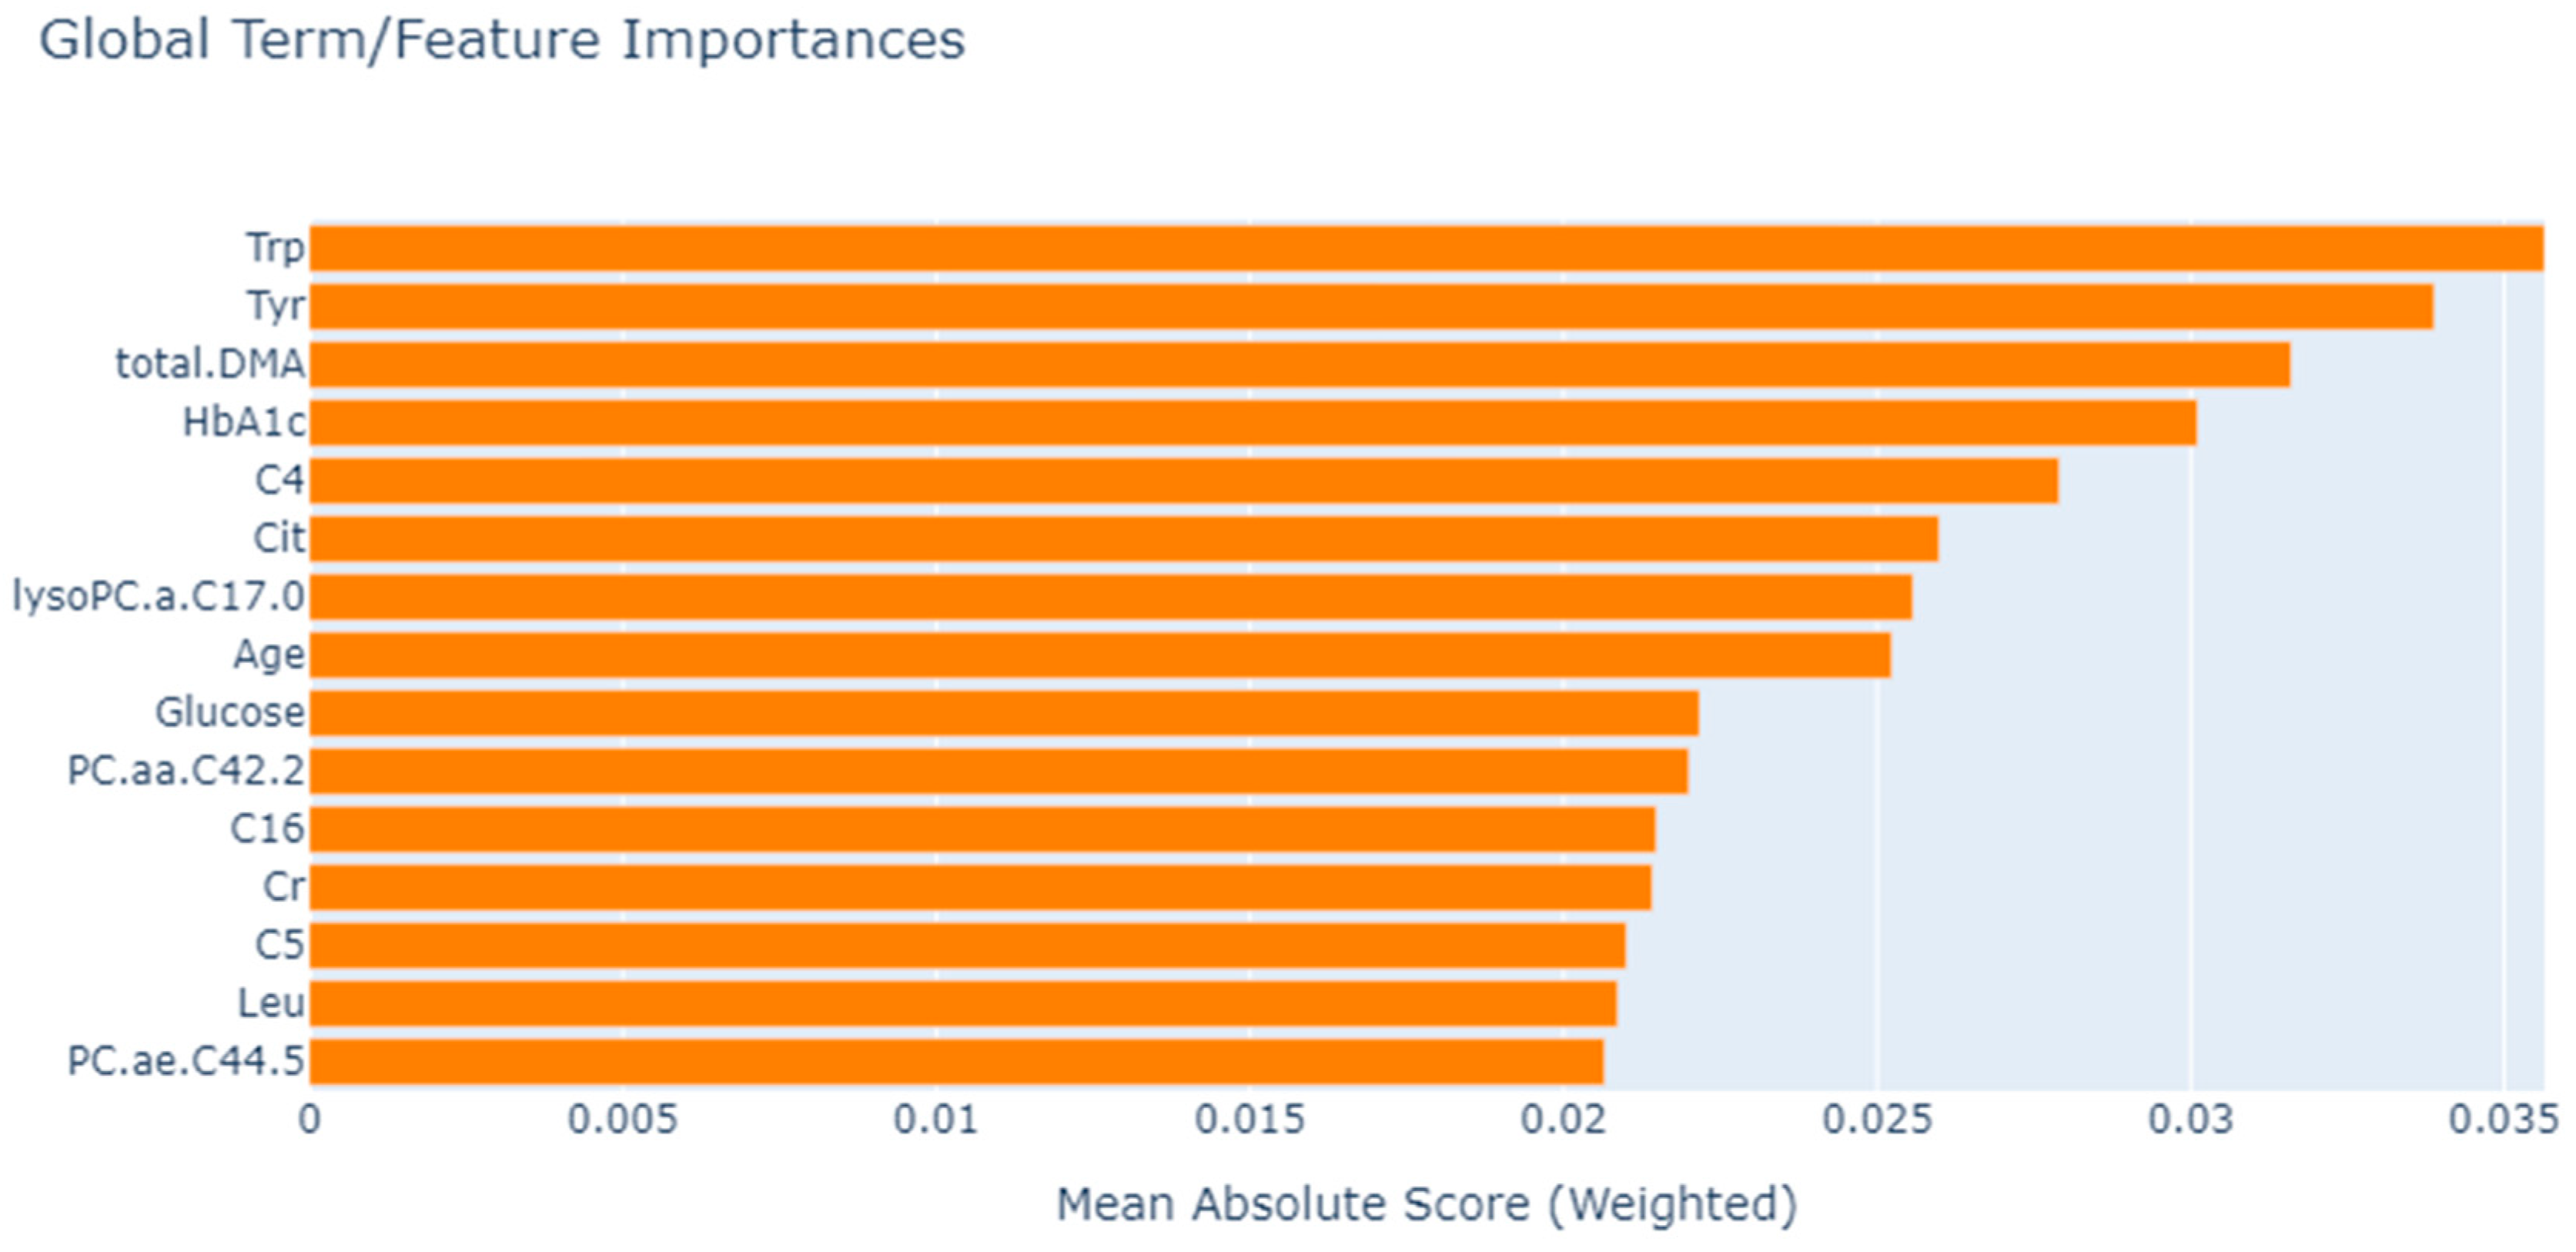
| EBM | Trp, Tyr, total.DMA, HbA1c, C4, Cit, lysoPC.a.C17.0, Age, Glucose, PC.aa.C42.2, C16, Cr, C5, Leu, PC.ae.C44.5 |
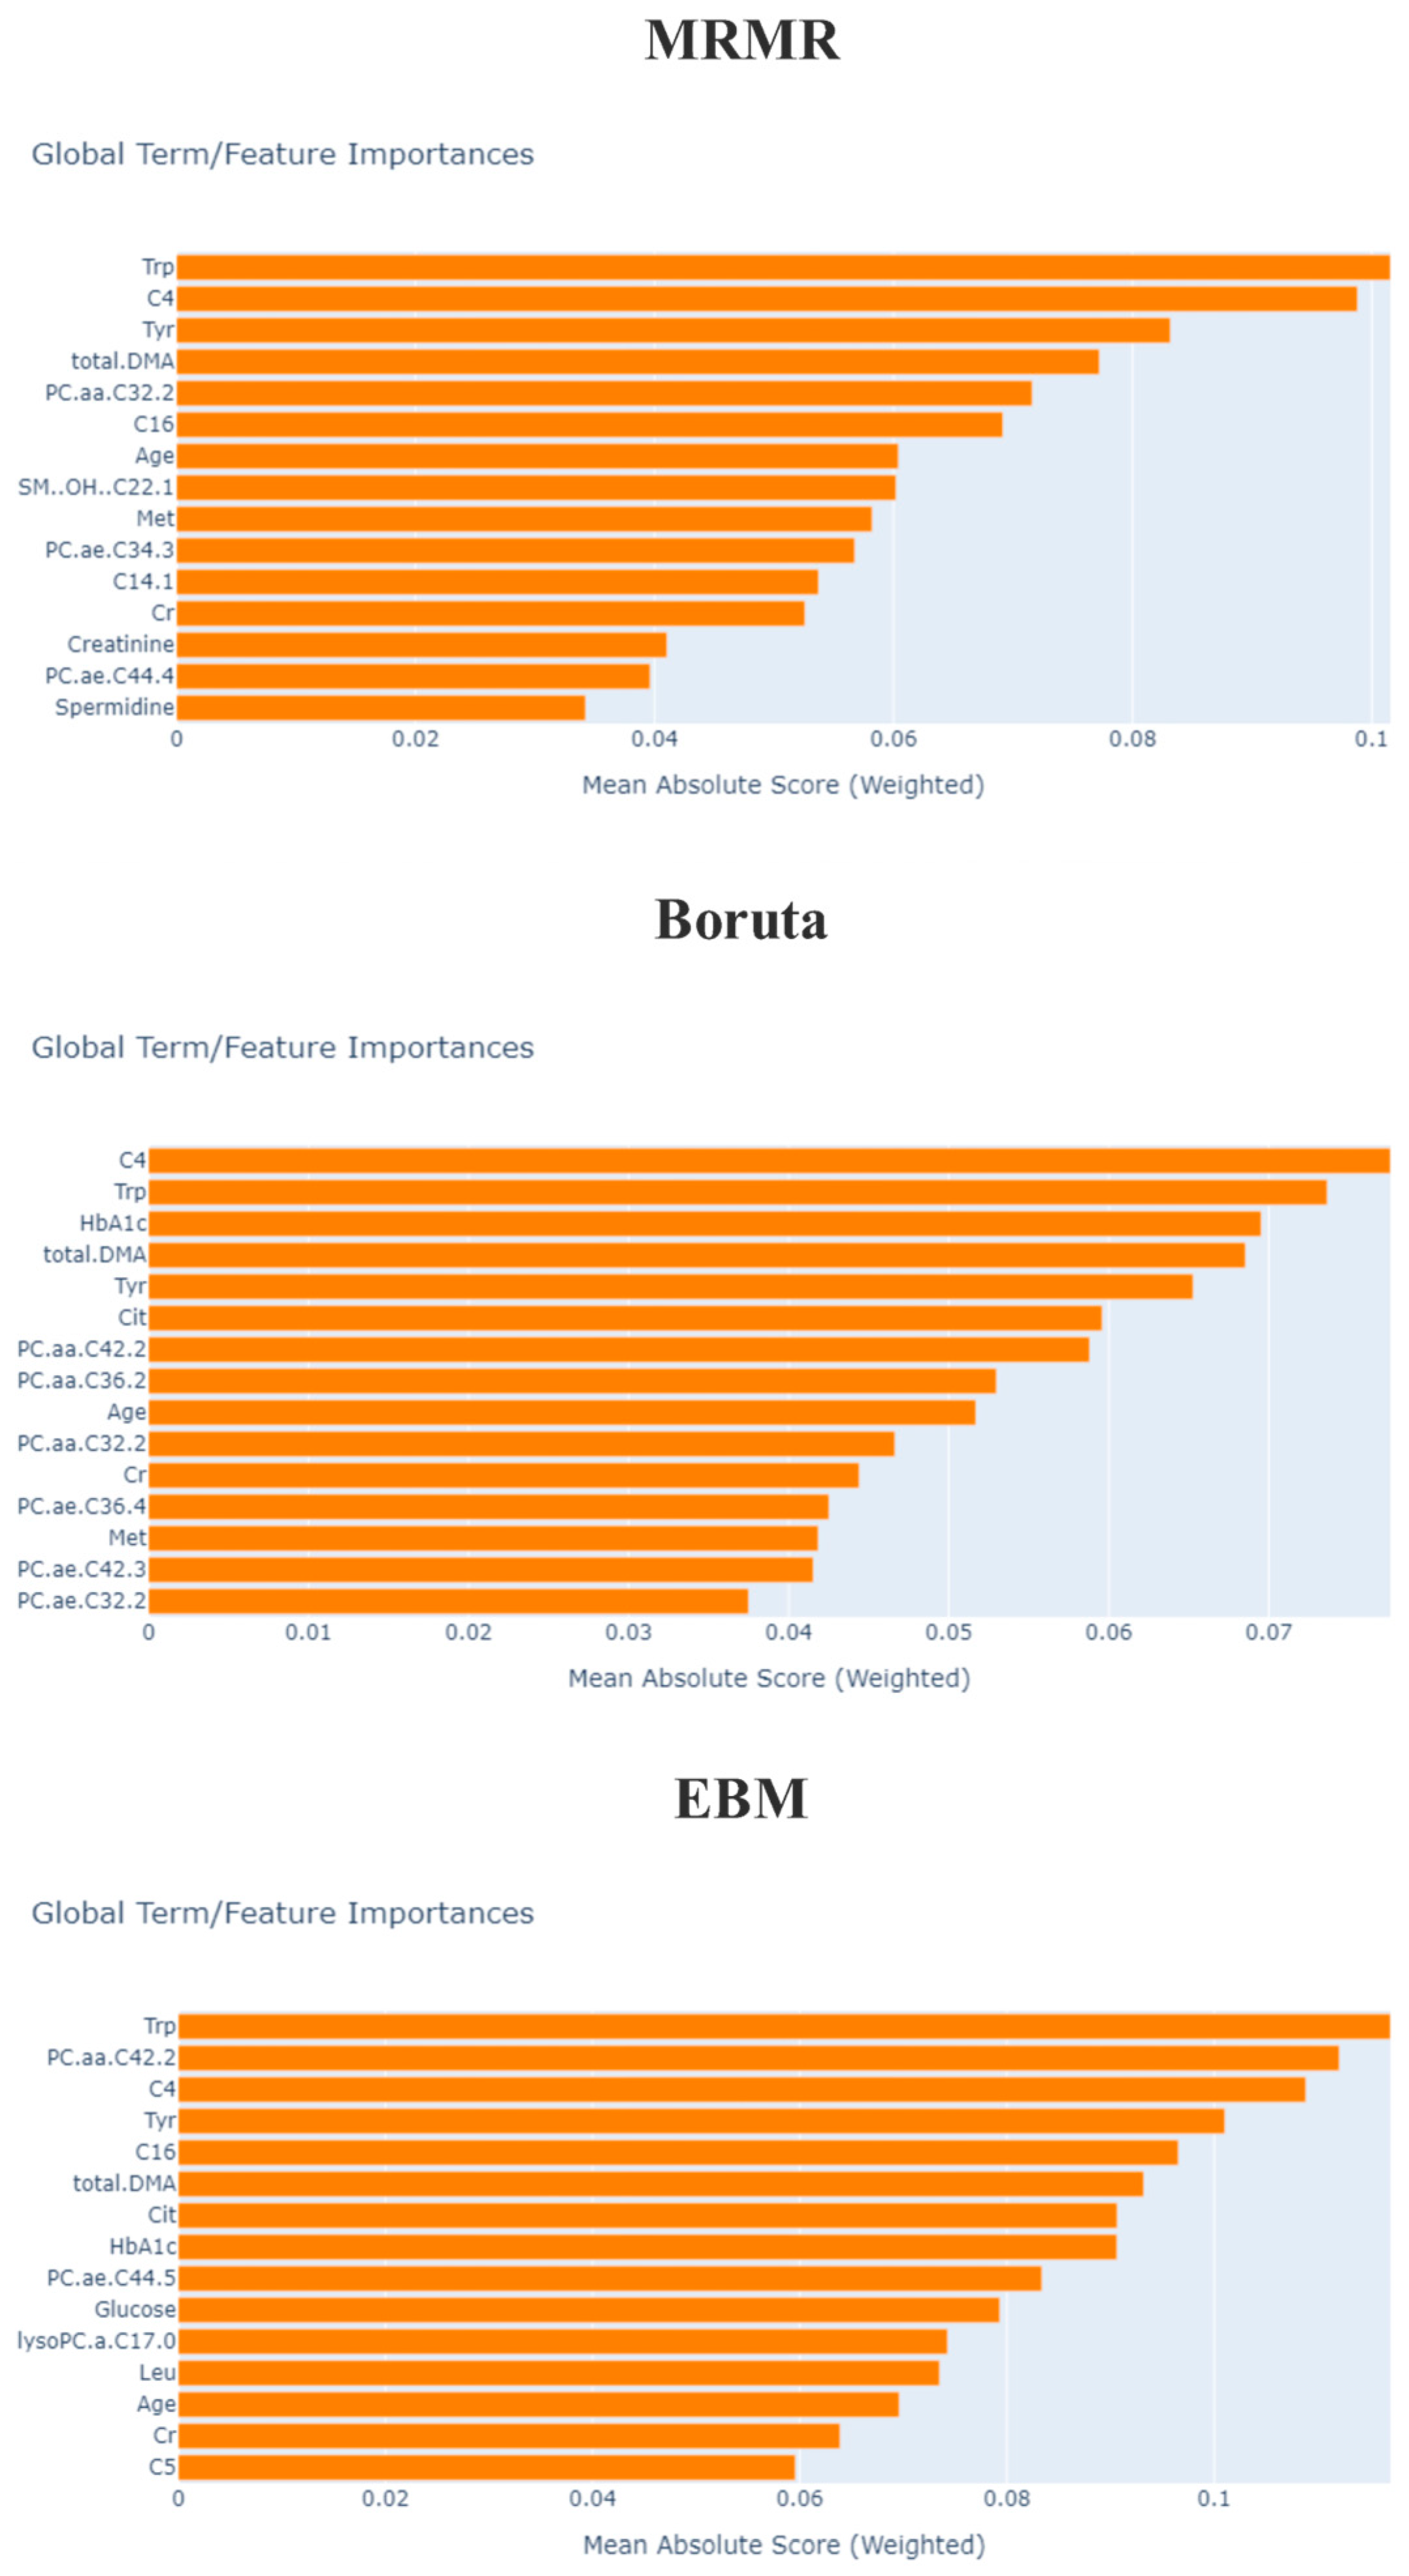
| mRMR | Trp, PC.ae.C44.4, Spermidine, C4, C14.1, total.DMA, Tyr, PC.aa.C32.2, Cr, Age, PC.ae.C34.3, Met, C16, SM..OH..C22.1 |
| Boruta | Age, HbA1c, Cr, C4, Cit, Met, Trp, Tyr, Creatinine, total.DMA, PC.aa.C32.2, PC.aa.C34.2, PC.aa.C36.2, PC.aa.C42.2, PC.ae.C32.1, PC.ae.C32.2, PC.ae.C34.2, PC.ae.C34.3, PC.ae.C36.4, PC.ae.C42.3, SM.C24.0 |
| Classification Method | Feature Selection Method | Accuracy (%) | Precision (%) | Recall (%) | FI-Score (%) | AUROC (%) |
|---|---|---|---|---|---|---|
| XGBoost | mRMR | 82.16 ± 1.71 | 82.47 ± 1.61 | 82.16 ± 1.61 | 82.32 ± 1.86 | 89 ± 0.17 |
| Boruta | 87.41 ± 1.29 | 87.30 ± 1.39 | 87.40 ± 1.73 | 87.35 ± 1.84 | 92 ± 028 | |
| EBM | 91.25 ± 1.88 | 89.33 ± 1.80 | 91.24 ± 1.67 | 89.37 ± 1.52 | 97 ± 0.25 | |
| NGBoost | mRMR | 81.81 ± 1.22 | 81.57 ± 1.73 | 81.80 ± 1.22 | 81.69 ± 1.49 | 88 ± 0.29 |
| Boruta | 86.01 ± 1.80 | 86.18 ± 1.71 | 86.02 ± 1.23 | 86.09 ± 1.29 | 93 ± 0.14 | |
| EBM | 88.11 ± 1.41 | 88.08 ± 1.86 | 88.10 ± 1.52 | 88.09 ± 1.21 | 96 ± 0.25 | |
| EBM | mRMR | 82.51 ± 1.24 | 82.41 ± 1.37 | 82.50 ± 1.57 | 82.46 ± 1.26 | 89 ± 0.20 |
| Boruta | 83.91 ± 1.66 | 83.14 ± 1.29 | 83.90 ± 1.48 | 84.51 ± 1.25 | 90 ± 0.17 | |
| EBM | 87.76 ± 1.47 | 87.72 ± 1.47 | 87.75 ± 1.62 | 87.74 ± 1.43 | 94 ± 0.23 |
Disclaimer/Publisher’s Note: The statements, opinions and data contained in all publications are solely those of the individual author(s) and contributor(s) and not of MDPI and/or the editor(s). MDPI and/or the editor(s) disclaim responsibility for any injury to people or property resulting from any ideas, methods, instructions or products referred to in the content. |
© 2023 by the authors. Licensee MDPI, Basel, Switzerland. This article is an open access article distributed under the terms and conditions of the Creative Commons Attribution (CC BY) license (https://creativecommons.org/licenses/by/4.0/).
Share and Cite
Yagin, F.H.; Yasar, S.; Gormez, Y.; Yagin, B.; Pinar, A.; Alkhateeb, A.; Ardigò, L.P. Explainable Artificial Intelligence Paves the Way in Precision Diagnostics and Biomarker Discovery for the Subclass of Diabetic Retinopathy in Type 2 Diabetics. Metabolites 2023, 13, 1204. https://doi.org/10.3390/metabo13121204
Yagin FH, Yasar S, Gormez Y, Yagin B, Pinar A, Alkhateeb A, Ardigò LP. Explainable Artificial Intelligence Paves the Way in Precision Diagnostics and Biomarker Discovery for the Subclass of Diabetic Retinopathy in Type 2 Diabetics. Metabolites. 2023; 13(12):1204. https://doi.org/10.3390/metabo13121204
Chicago/Turabian StyleYagin, Fatma Hilal, Seyma Yasar, Yasin Gormez, Burak Yagin, Abdulvahap Pinar, Abedalrhman Alkhateeb, and Luca Paolo Ardigò. 2023. "Explainable Artificial Intelligence Paves the Way in Precision Diagnostics and Biomarker Discovery for the Subclass of Diabetic Retinopathy in Type 2 Diabetics" Metabolites 13, no. 12: 1204. https://doi.org/10.3390/metabo13121204
APA StyleYagin, F. H., Yasar, S., Gormez, Y., Yagin, B., Pinar, A., Alkhateeb, A., & Ardigò, L. P. (2023). Explainable Artificial Intelligence Paves the Way in Precision Diagnostics and Biomarker Discovery for the Subclass of Diabetic Retinopathy in Type 2 Diabetics. Metabolites, 13(12), 1204. https://doi.org/10.3390/metabo13121204