Article

UPLC-QTOF-MS Based Comparison of Rotundic Acid Metabolic Profiles in Normal and NAFLD Rats

1
MOE Joint International Research Laboratory of Synthetic Biology and Medicine, School of Biology and Biological Engineering, South China University of Technology, Guangzhou 510006, China
2
Guangdong Provincial Key Laboratory of New Drug Design and Evaluation, Guangzhou 510407, China
*
Author to whom correspondence should be addressed.
Metabolites 2023, 13(1), 38; https://doi.org/10.3390/metabo13010038
Submission received: 9 November 2022 / Revised: 13 December 2022 / Accepted: 22 December 2022 / Published: 26 December 2022

Abstract

:
Rotundic acid, the principal bioactive constituent of the herbal remedy “Jiubiying”, has been considered as a candidate compound for treating non-alcoholic fatty liver disease (NAFLD). However, the in vivo and in vitro metabolism of rotundic acid has remained unclear. With the aim of elucidating its metabolic profile, a reliable approach that used ultra-high performance liquid chromatography combined with quadrupole time-of-flight mass spectrometry (UPLC-QTOF-MS) was applied for screening and identifying rotundic acid in vivo (plasma, feces, urine, and liver tissue of normal and NAFLD model rats) and in vitro (rat liver microsomes) metabolites. Herein, 26 metabolites of rotundic acid were identified, including 22 metabolites in normal rats, 20 metabolites in NAFLD model rats, and eight metabolites in rat liver microsomes. Among them, 17 metabolites were identified for the first time. These data illustrate that the pathological status of NAFLD affects the metabolism of rotundic acid. Furthermore, the major pathways of metabolism included phase Ⅰ (demethylation, desaturation, etc.) and phase Ⅱ (sulfation and glucuronidation) reactions, as well as a combined multiple-step metabolism. This work provides important information on the metabolism of rotundic acid and lays the foundation for its future clinical application.

1. Introduction

Non-alcoholic fatty liver disease (NAFLD), featured by liver macrovesicular steatosis caused by factors other than excessive alcohol use, is a chronic liver disease that affects people worldwide [1,2]. NAFLD is highly correlated with obesity, cardiovascular disease, and insulin resistance, and is a vital predisposing element for cirrhosis and hepatocellular carcinoma pathogenesis [3]. The latest data shows that over 25% of the population suffers from NAFLD globally, and the incidence is gradually growing year after year [4]. Due to its uncertain pathogenesis, no effective drugs have been approved by the Food and Drug Administration (FDA) for treating NAFLD [5]. Hence, it is critical to develop safe and effective drugs to treat NAFLD.
Natural products are an excellent source modern drug development. Between 1981 and 2019, almost 70% of drugs approved by the FDA were natural products or corresponding derivatives [6]. “Jiubiying” is the dry leaf and bark of Ilex rotunda Thumb, which is often used to treat diarrhea, metaphysitis, bruises, colds, fever, and rheumatism [7,8]. Furthermore, it is currently included in the Chinese Pharmacopoeia. Rotundic acid (RA) is the main bioactive component in “Jiubiying” and belongs to the pentacyclic triterpenoids [9]. Increasing reports have demonstrated that Rotundic acid (RA) possesses many pharmacological functions, including, but not limited to, anti-cancer and anti-inflammatory activities [10,11,12,13]. Additionally, it has been revealed that RA can prevent and alleviate hepatic disorders [12,14,15]. Yuan-Man Hsu and co-workers [12] have found that RA has a significant lipid-lowering effect, with mild anti-inflammatory activity in diabetic mice, while reducing liver lipid droplets. Our previous study, which aimed to evaluate the pharmacological effect and mechanism of action of RA on NAFLD, illustrated that RA effectively alleviated hepatic lipid accumulation in the NAFLD rat model [16]. These findings make RA a promising candidate compound for treating NAFLD.
Drug metabolism plays a vital role in explaining and predicting efficacy and toxicity [17,18]. Hence, a thorough study of metabolic fate becomes an integral part of drug discovery. So far, the information on RA metabolism is limited to only one study, and only 11 metabolites of RA have been identified in normal rats [19]. The comprehensive metabolic pathways of RA have not been fully elucidated. Moreover, because of its important role in drug metabolism, changes in liver function under pathological states, such as NAFLD, are bound to affect certain enzymes and transporters which are related to the internal metabolism and transportation of drugs. It was reported that RA is a substrate of P-glycoprotein and can be substantially metabolized by Cytochrome P450 (CYP) 3A4 [20], which explains its relatively low oral bioavailability in rats (16–19%) [21]. Moreover, our previous study into the pharmacological effect of RA on NAFLD showed that RA had no effect on the oleic acid-induced rat primary hepatocyte in vitro model, but effectively ameliorated non-alcoholic steatohepatitis after oral administration in rats [16]. This suggests that the effect in the rats may be attributed to the metabolites of RA in vivo, other than its prototype. Thus, it is necessary to study the metabolism of RA in NAFLD. In this study, we induced a rat NAFLD model by feeding animals with a high-fat diet. Next, we employed the ultra-performance liquid chromatography combined a with quadrupole time-of-flight tandem mass spectrometry (UPLC-QTOF-MS) approach under automatic MSE mode to determine RA metabolites both in normal and NAFLD rats, as well as in rat liver microsomes, which helped us to propose the pathways of metabolism of RA underlying normal and pathological states.

2. Materials and Methods

2.1. Material and Chemicals

The reference standard of RA (purity > 98%) was purchased from the Nanjing Spring & Autumn Biotech Co., Ltd (Nanjing, China). Liver microsomes of SD rat (20 mg/mL) were purchased from the Research Institute for Liver Diseases Co., Ltd. (Shanghai, China). Ethyl acetate, methanol, and acetonitrile (Fisher Scientific, Hampton, NH, USA) were all HPLC grade, and formic acid (Fluka, Radnor, PA, USA) was LC-MS grade. A Milli-Q system (Billerica USA) was utilized to prepare the deionized water. The high-fat diet (HFD) encompassed 78% primary feed, 10% egg yolk powder, 10% lard, 2% cholesterol, and 0.5% sodium cholate, and was acquired from the Trophic Animal Feed High-Tech CO., Ltd. (Nantong, China). The colorimetric assay kits for malondialdehyde (MDA) and superoxide dismutase (SOD) were bought from the Nanjing Jiancheng Bioengineering Institute (Nanjing, China).

2.2. Animals Experiments

2.2.1. Modeling of NAFLD Rats

The Committee of Ethics of Animal Experimentation of Guangdong Pharmaceutical University approved the animal experiments (Ref:2017226). All animal experiments were accomplished in rigorous accordance with the Guide for the Care and Use of Laboratory Animals.
Sprague-Dawley rats (male and 180–200 g) were supplied by the Laboratory Animal Center of the Guangzhou University of Chinese Medicine (Guangzhou, China) and kept in environmentally controlled circumstances including a 12 h light/12 h dark cycle and a stable room temperature (25 ± 2 °C). The NAFLD rats model was induced using a 5-week high-fat diet according to the literature [1,22] and our preliminary experiments. Meanwhile, rats in the normal group were fed a regular diet during the experimental period. After overnight fasting, RA (60 mg/kg prepared in 0.5% CMC-Na) was administrated orally to both normal and NAFLD rats. Metabolic cages were utilized to maintain the rats for urine and feces collection within 0–24 h. Blood samples were obtained at 30 min, 2 h, 6 h, 12 h and 24 h, and were spun at 5000 rpm for 10 min to separate the plasma. After 24 h blood sampling, liver tissue samples were obtained under anesthesia to analyze metabolites and confirm the success of NAFLD modeling. The blank plasma, urine, feces, and liver tissue were collected in the same procedure described above after vehicle treatment. The biological samples were kept at −80 °C.

2.2.2. Pathological Staining

Liver samples were secured in paraformaldehyde (4%) and addressed for dehydration, paraffin embedding, and were sectioned (4 μm). The sections were then deparaffinized and stained with hematoxylin and eosin. An upright optical microscope (Nikon, NIKON ECLIPSE E100) was employed to observe the results.
Frozen liver sections, which were stained with Oil Red solution (Servicebio G1016) for 10 min and immersed in hematoxylin (Servicebio G1004) for counterstaining for 5 min, were observed under a microscope (LEICA DM 4000 B LED). The lipid accumulation area was analyzed by Image-Pro Plus 6.0 by evaluating integrated optical density (IOD).
The above staining procedure referred to the reported method with some modification [23]. The histological evaluation of liver slices was random.

2.2.3. Biochemical Detection

According to the proportion of 1:9 (W/V), a 0.2 g liver sample was added into ice-cold 0.9% NaCl, ground to make a 10% homogenate, and spun for 10 min at 4 °C (5000 rpm). The supernatant was then gathered. The concentration of hepatic cholesterol (CHOL) and triglycerides (TG) was determined by an automatic biochemical analyzer (Hitachi 7180, Hitachi High-Tech Corp., Ibaraki, Japan). The serum SOD and MDA were determined by the commercial kits under the instruction of the manufacturer.

2.3. Preparations of Biological Samples

Referring to our previously published method with a slight modification, the preparation of biological samples was executed [17].
  • Plasma
The plasma samples, which were obtained from individual rats, were mixed in equal amounts into 200 μL, and then treated to precipitate proteins with 600 μL acetonitrile. The procedure included centrifugation (12,000 rpm, 10 min), the collection of supernatants, drying at room temperature by a vacuum concentrator (Eppendorf, Hamburg, Germany), and the reconstitution of the residue in 100 μL diluent containing methanol and water (1:1, v/v).
  • Urine
A 200 μL urine sample was precipitated with 400 μL methanol and mixed thoroughly. The other procedure was the same as that of plasma samples.
  • Feces
The freeze-dried feces were ground into powder. Next, 4 mL methanol was used to immerse the fecal powder (0.4 g), and the metabolites in the solution underwent a 30-min extraction by ultrasound. After centrifugation (8000 rpm, 10 min), the collected upper layer was dried by evaporation at room temperature. A 200 μL diluent containing a mixture (1:1, v/v) of methanol and water was then employed to reconstitute the residue.
  • Liver tissues
One gram of liver sample and 1 mL of 0.9% sodium chloride solution were mixed and thoroughly ground. In order to precipitate proteins in the liver sample mixture, the acetonitrile was added to the liver sample at a ratio of 4:1, then vortexed for 3 min. The rest of the procedure was similar to the method used for feces, except that the volume of reconstituted solution was 300 μL.
Prior to UPLC-QTOF-MS analysis, all samples were spun for 10 min at 4 °C (12,000 rpm).

2.4. RA Metabolism In Vitro

For in vitro metabolism, according to a previous report [24], RA (200 ng/mL, dissolved in methanol) was incubated in rat liver microsomal incubation solution (200 μL) consisting of hepatic microsomes [1.0 mg (protein)/mL], phosphate-buffered saline (0.1 M PBS, pH 7.4) and nicotinamide adenine dinucleotide phosphate (NADPH, 1 mM). The mixture of rat hepatic microsomes, phosphate-buffered saline, and RA was preincubated at 37 °C for 5 min before the addition of 1 mM NADPH. After that, the system was incubated at 37 °C for 30 min to address the reaction. Next, 1 mL ice-cold ethyl acetate solution was added to bring the reaction to an end. The collection and drying of the upper organic layer were conducted by centrifugation (12,000 rpm, 10 min) and evaporation, respectively. Thereafter, 50 μL acetonitrile-water solution (1:1, v/v) was applied to dissolve the residue. The blank control samples were prepared without RA. After centrifugation (12,000 rpm, 10 min), 5 μL supernatant was subjected to analysis. The incubation was conducted in triplicate.

2.5. UPLC-QTOF-MS Conditions

Based on our previously instrumental methodology [17], a UPLC system (Waters ACQUITY) fitted with a reverse-phase UPLC BEH C18 column (Waters Acquity, 100 × 2.1 mm2, i.d. 1.7 μm) with an in-line filter at 40 °C was utilized to chromatographically separate the metabolites. A linear gradient elution consisting of mobile phase A (0.1% formic acid) and mobile phase B (acetonitrile) was employed: maintained 5% B at 0–2 min, 5–50% B at 2–7 min, maintained 50% B at 7–11 min, 50–85% B at 11–18 min, maintained 85% B at 18–20 min, 85–5% B at 20–20.5 min and held for 2 min. The velocity of flow and the run time were 0.4 mL/min and 22.5 min for each sample, respectively. The injection volume was 5 µL.
A Waters Q-TOF SYNAPT G2 Spectrometer equipped with ESI source under negative ion mode was utilized to conduct mass spectrometry detection, for which the full scan mode was set at the mass range of 100–1200 Da. The superlative parameters of MS for maximum sensitivity were set: the cone voltage was 30 V and capillary voltage was 3.0 kV; the desolvation temperature was 550 °C and source temperature was 120 °C; the desolvation gas (N2) flow rate was 700 L/h and the cone gas flow rate was 50 L/h. In MSE centroid mode, the MS data were acquired with the low energy function in the trap collision energy (6 eV), and the tandem mass data were acquired with the high energy function in the ramp trap collision energy (20–50 eV). During MS analysis, in order to acquire accurate mass, the Leucine enkephalin was used as the lock mass of m/z 554.2615 ([M-H]). The instrument operation and data acquisition were monitored by Masslynx NT 4.1 (Waters, Milford, MA, USA).

2.6. Data Analysis

The Metabolynx XS software (Waters, MA, USA) with the mass defect filter (MDF) was utilized to process the metabolism data. The MDF window was ±0.1 Da, 5 ppm was used as the maximum tolerance for mass error, and the spectrum was 2% higher than the relative intensity. The data of pathological and biochemical changes are presented as mean ± standard deviation (SD), and were analyzed by Student’s t-test. p < 0.05 was considered as statistically significant.

3. Results

3.1. Establishment of NAFLD Model

The liver pathological sections were evaluated by H&E stain, a “gold standard” for the diagnosis of NAFLD, which provided reliable evidence on the establishment of the NAFLD model. As illustrated in Figure 1A, significant microvesicular steatosis and the inflammatory changes of hepatic lobules were observed in the NAFLD group when compared to the normal group, which is the typical NAFLD feature. This suggested the success of the establishment of the NAFLD rat model in the current study. Similarly, in the oil red staining (Figure 1B,C), high-fat diet feeding resulted in an elevated area of lipid accumulation and aggravated steatosis in the model group, while there was no significant change in the control group.
Matching the pathological outcomes, the concentrations of the hepatic CHOL and TG (Figure 1D) in the model groups was obviously higher than those in the control groups. Malondialdehyde (MDA) is the main product of lipid peroxidation in the body, while superoxide dismutase (SOD) exerts its function to improve the oxidative stress state of the body and inhibit lipid peroxidation. As indicated in Figure 1E,F, the level of MDA in the NAFLD group was substantially increased, whereas the content of SOD reduced, indicating that lipid metabolism in the body was disordered.

3.2. The Characteristic Fragmentation of RA

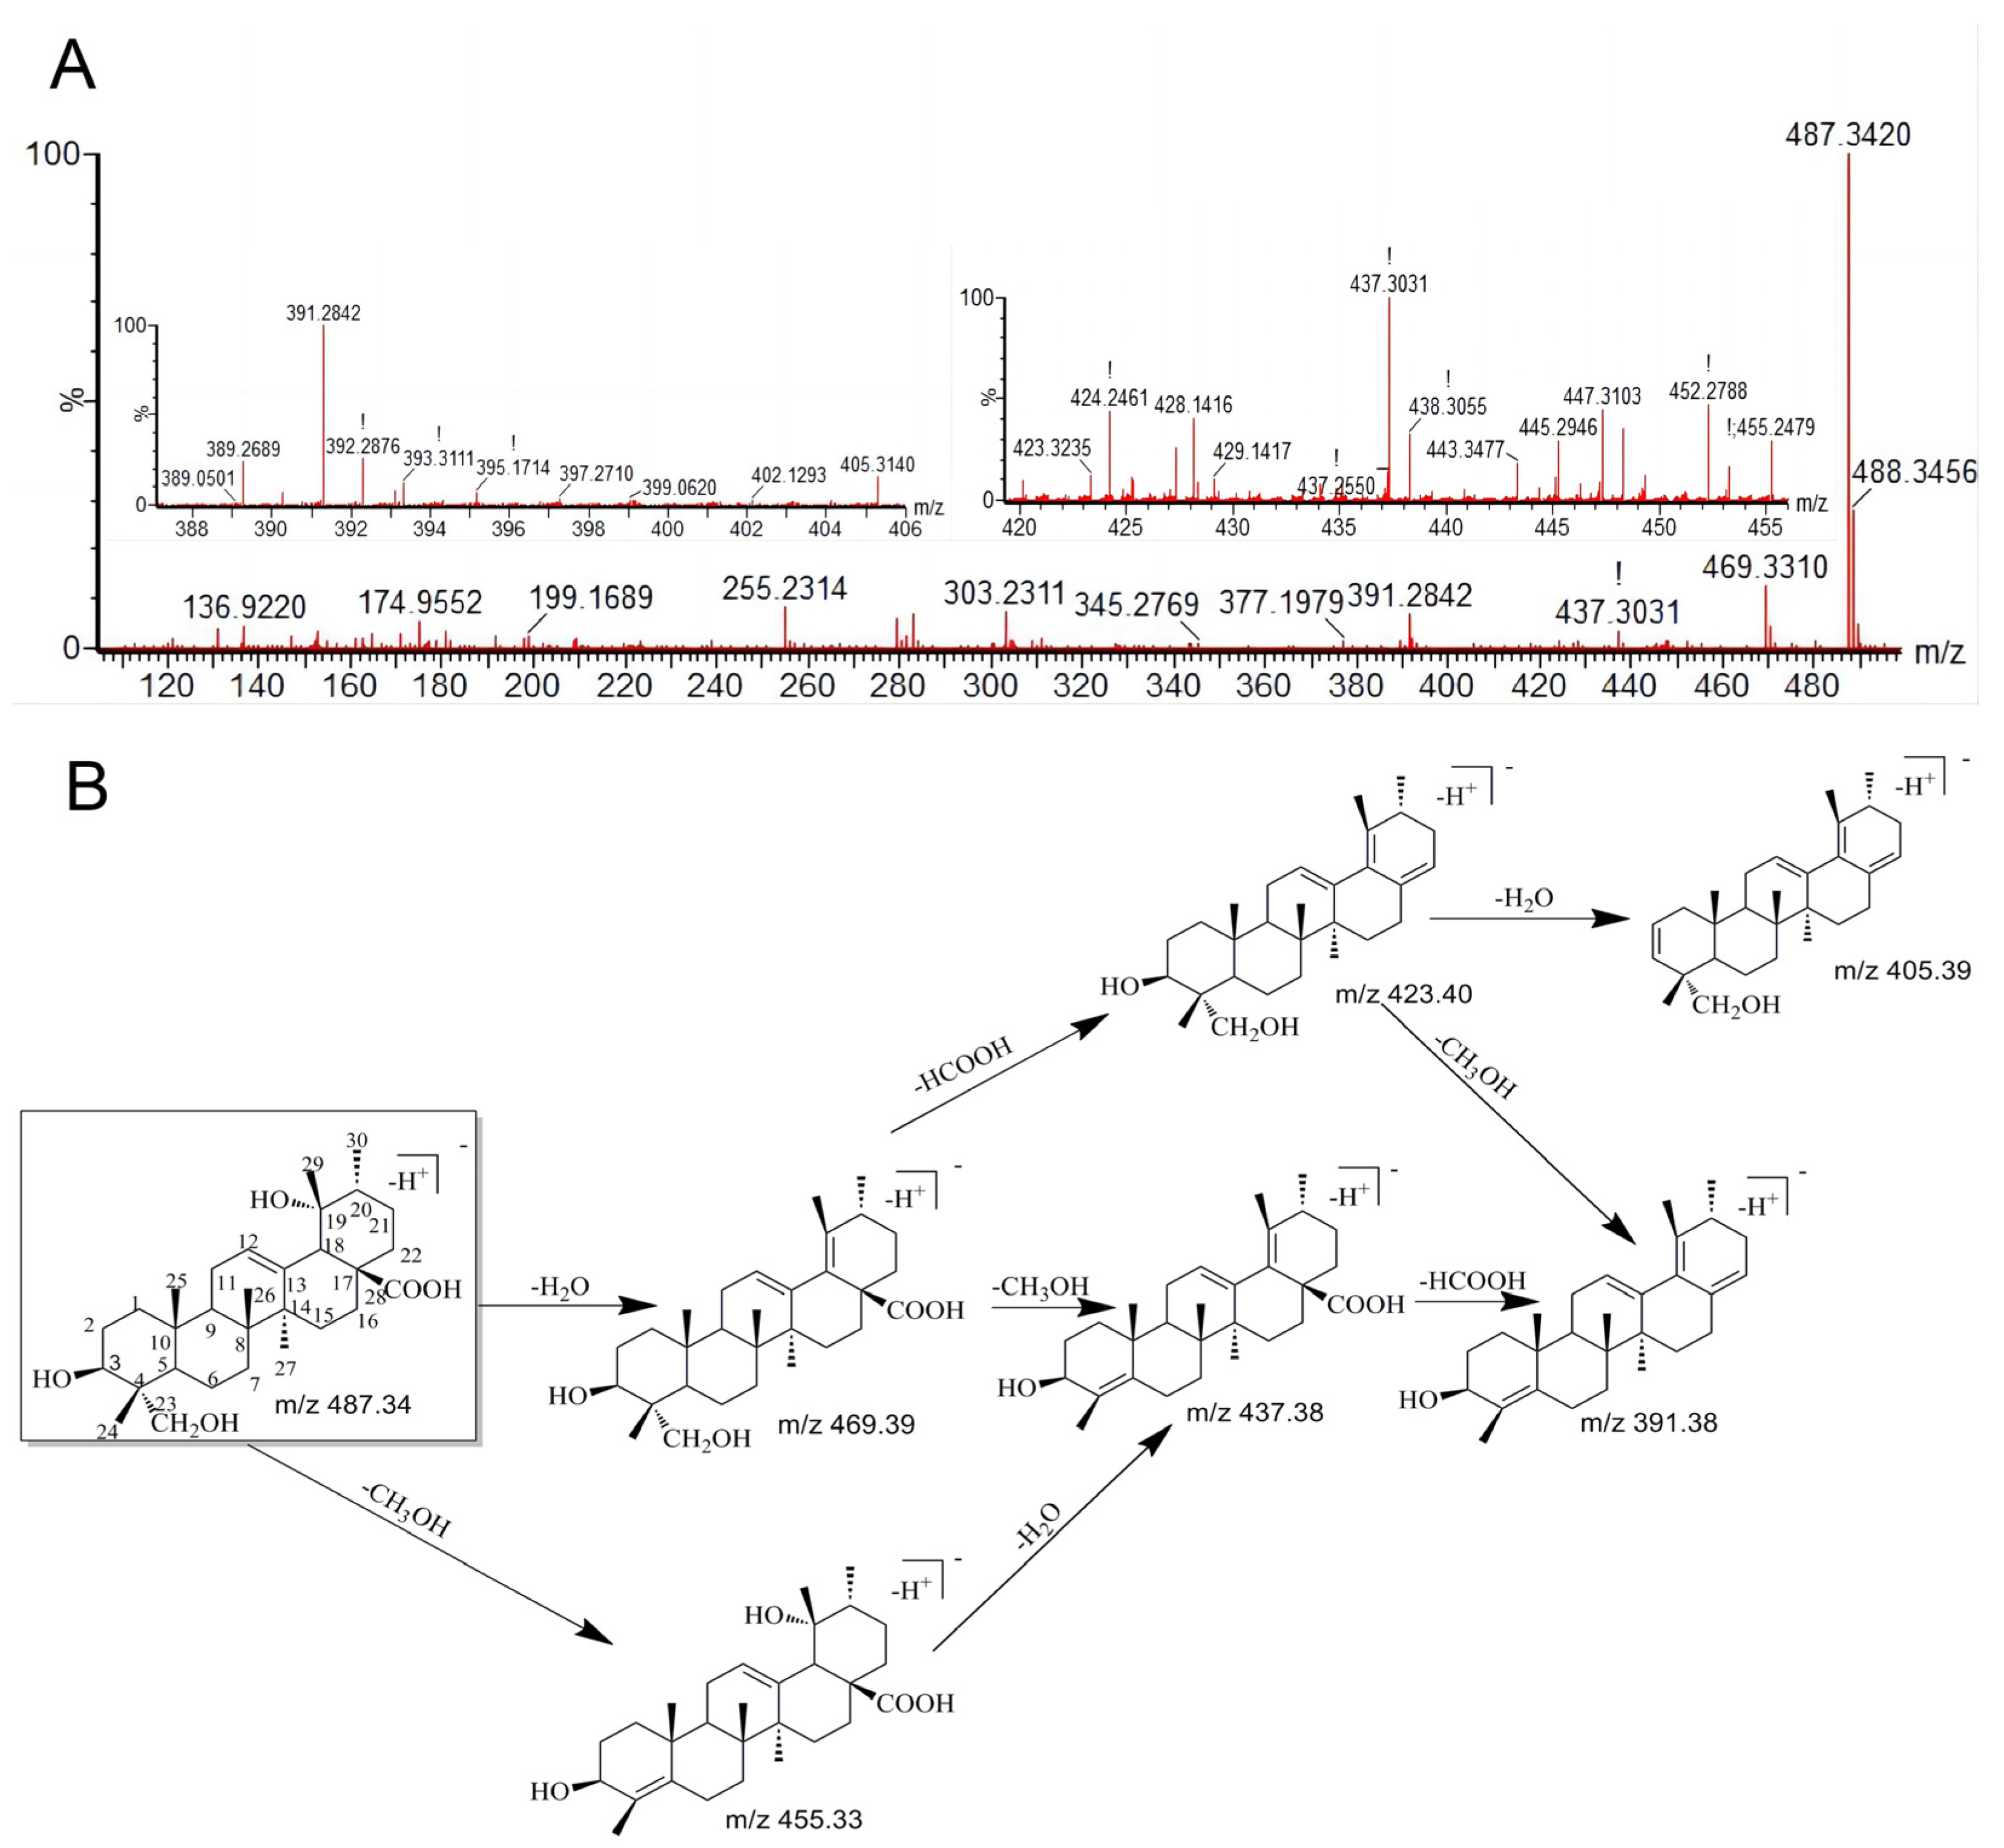
It is confirmed that metabolites and parent compounds share the same splitting properties. Thus, the analysis of the fragmentation characteristics of RA is helpful and crucial to deduce and recognize RA (M0) and its metabolites [17,25]. In this study, the RA standard was assessed under both positive and negative modes of the ESI source. RA gave a higher signal intensity under the negative mode. In addition, RA was eluted at 8.04 min under the analysis conditions, and the deprotonated mass [M-H] was 487.3420 (C30H47O5).
The incorporation of the MS2 fragment information with the previous reports [26,27,28] and the fragment ions of RA observed were mostly constituted by the continuing losses of neutral molecules, involving CO2, which is 44 Da, CH4O, which is 32 Da, H2O, which is 18 Da, and HCOOH, which is 46 Da. In its MS/MS fragmentation pattern (Figure 2A), RA provided ample fragment ions at m/z 469.3310 produced by a reduction of H2O (18 Da) and at m/z 437.3031 constituted through the successive neutral cleavages of H2O and CH4O (32 Da). Furthermore, the daughter product at m/z 455.2479 was formed by the fragmentation of CH4O, m/z 423.3235 was generated by the consecutive losses of H2O and HCOOH, m/z 405.3140 was via the successive eliminations of H2O, HCOOH, and H2O, m/z 393.3111 was obtained by the consecutive cleavages of H2O, CH4O, and CO2, and m/z 391.3871 was formed through the successive losses of H2O, HCOOH, and CH4O. The detailed formation pathway of RA fragmentation ions, which is based on the structural properties and MS/MS fragment ions, is proposed in Figure 2.

3.3. Identification of the Metabolites of RA

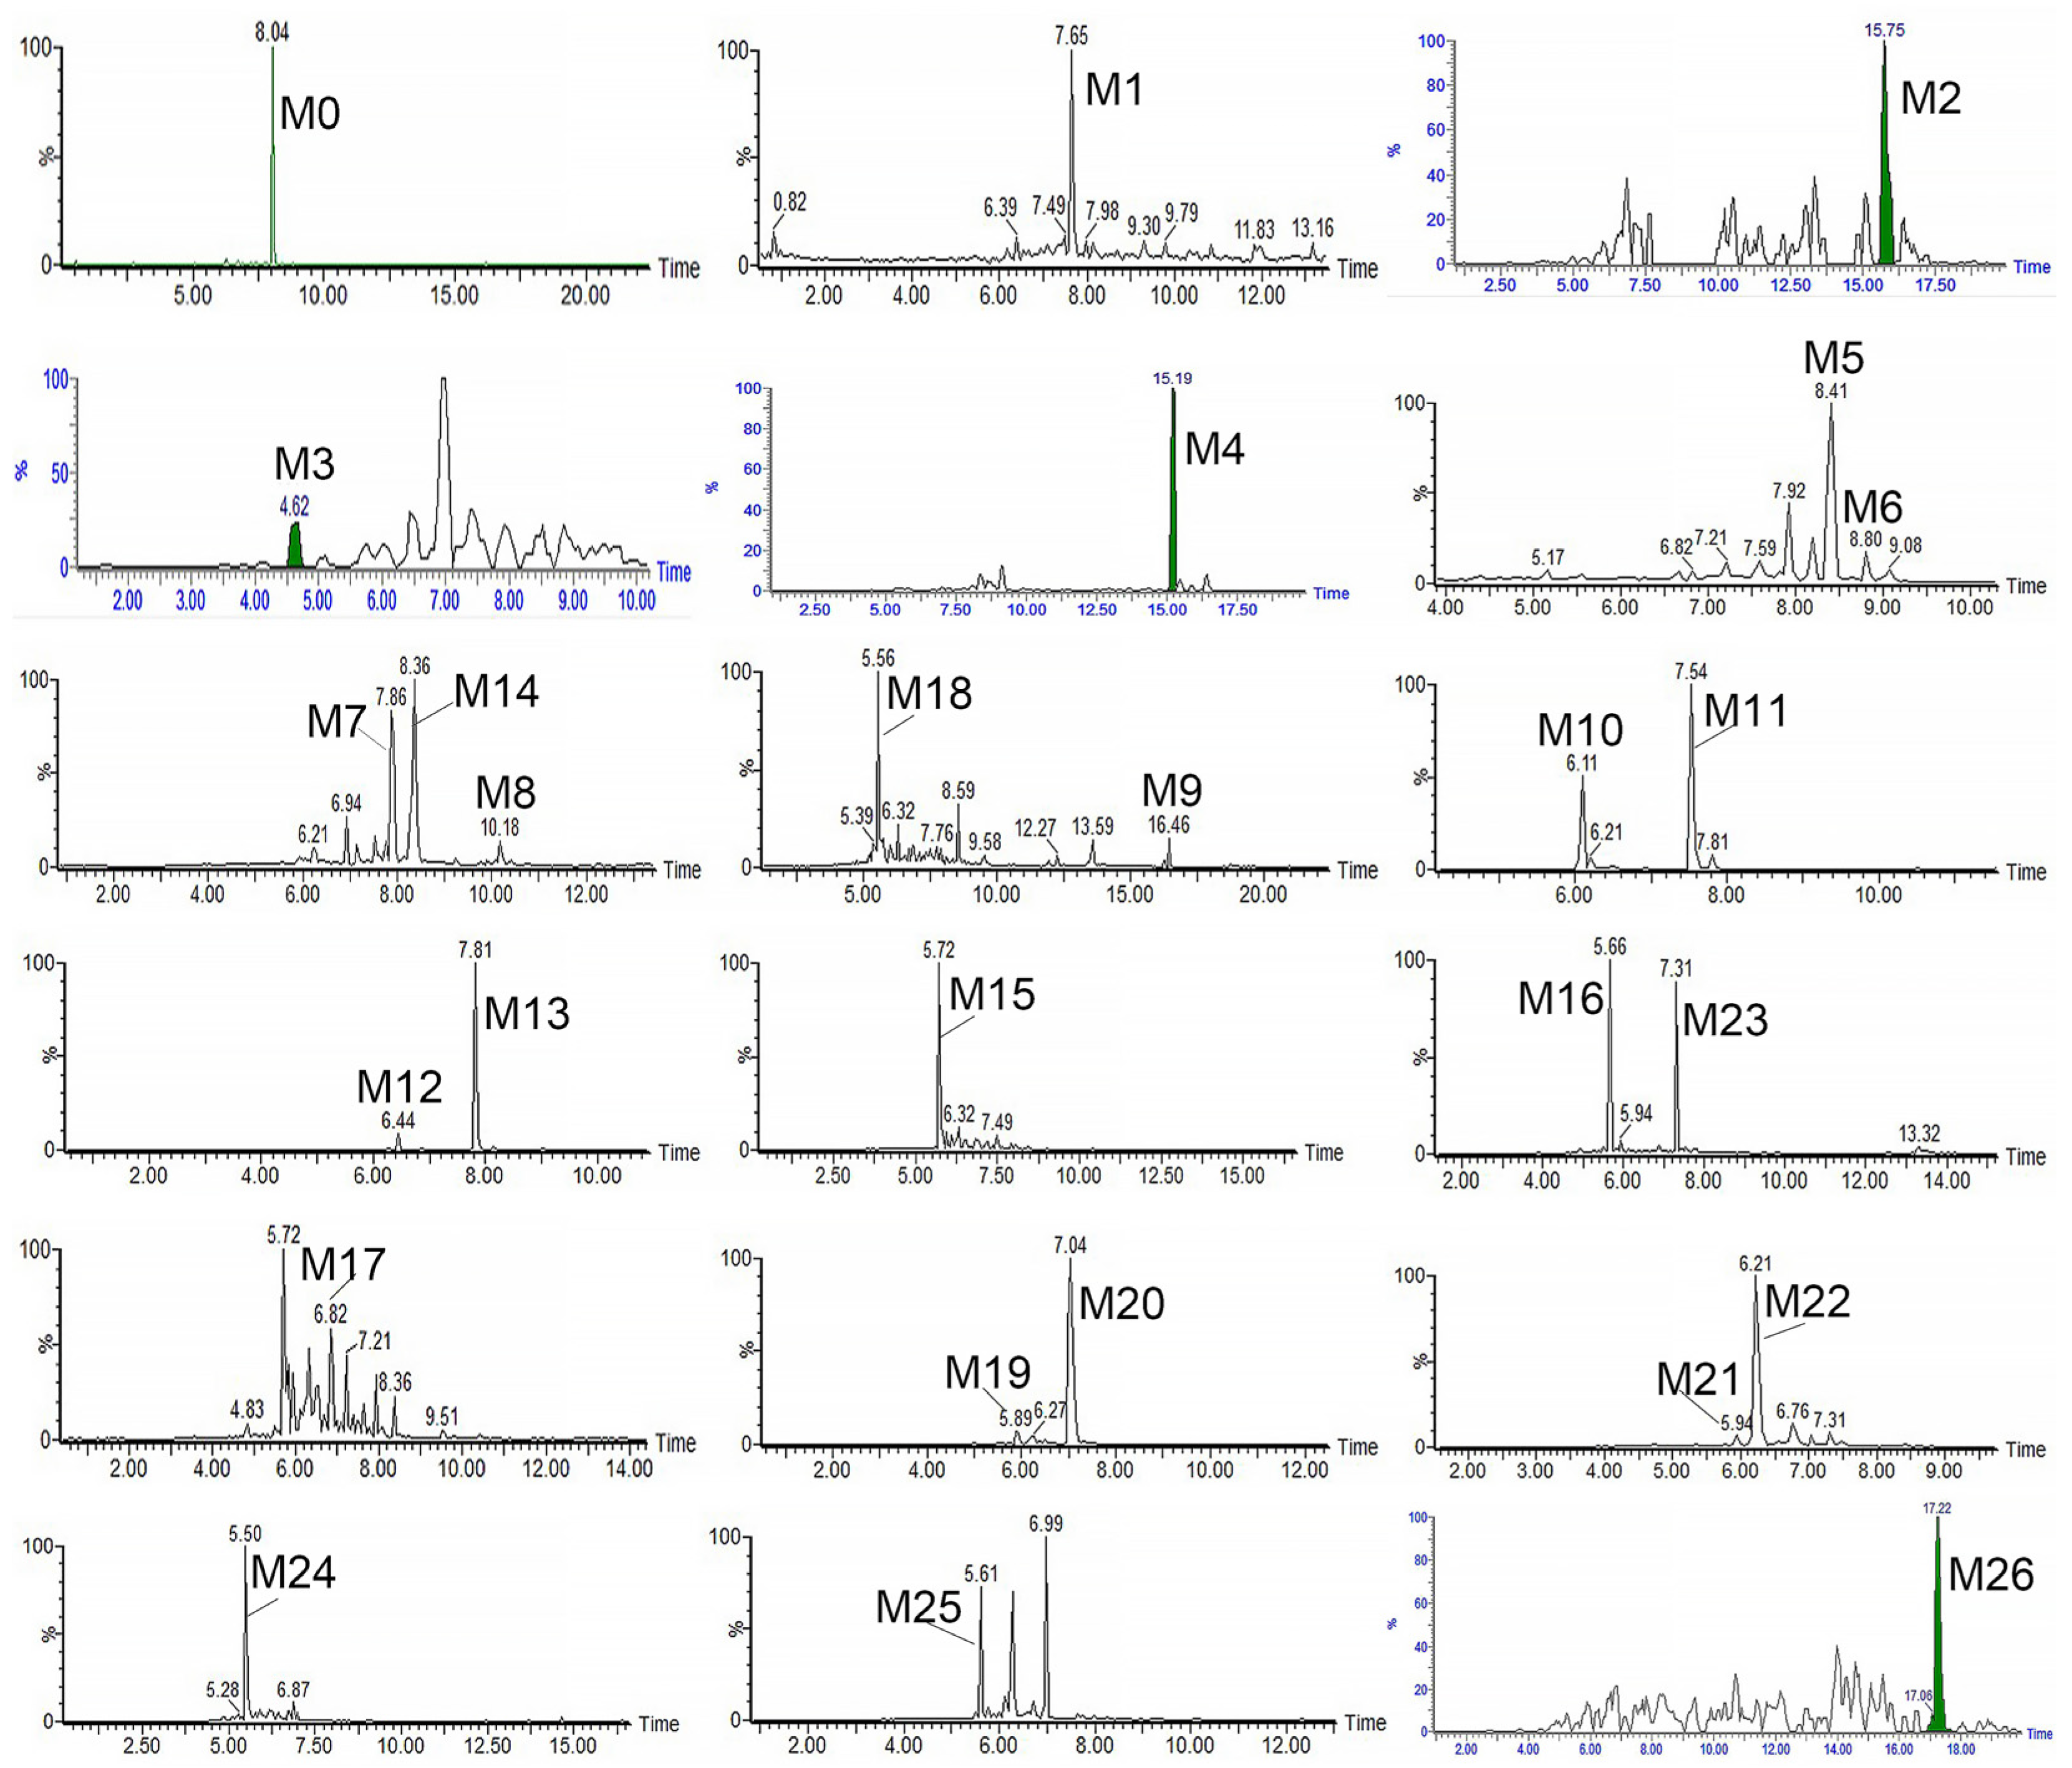
In this study, compared with blank samples, parent compound RA (M0) and its 26 metabolites were determined both in vivo and in vitro, and were identified by accurate mass, elemental compositions, MS/MS fragment information, and reference literature information. An overview of the characteristics of all metabolites is listed (Table 1). The total ion chromatograms are shown in Figure S1. The extracted ion chromatograms of the metabolites are presented (Figure 3), and the MS2 spectra of the metabolites are displayed in Figure S2.
Metabolite M1 (tR = 7.65 min) showed the [M-H] ion at m/z 473.3260 (C29H46O5). Compared with M0, the reduced 14 Da mass change indicated the cleavage of CH2 from M0. In its MS/MS spectrum, the daughter ions of M1 at m/z 455.2859, 423.2159 were formed by the continuous eliminations of H2O and CH4O, respectively. Furthermore, the product ions at m/z 409.2301, 405.2641, 391.2842 were generated by further losses of H2O and HCOOH. The fragmentation behavior of M1 was similar to that of RA. Based on this evidence and the literature [19], M1 was appraised as the demethylation metabolite of M0.
M2 (tR = 15.75 min), which exhibited the [M-H] ion at m/z 445.3348 (C28H46O4), was 42 Da (with the cleavages of CH2 and CO) lighter than M0. The primary fragmentation ions at 427.35 and m/z 395.35 in its MS/MS spectrum matched the consecutively neutral cleavages of H2O and CH4O. Meanwhile, the product ions at m/z 427.35 and 395.35 were 28 Da less than the typical product ions of M1 (m/z 455.2859 and 423.2159), suggesting that M2 was formed by the decarbonylation of M1.
M3 (tR = 4.62 min) showed the [M-H] ion at m/z 649.3563 (C35H54O11) and was 176 Da heavier than the prototype of M1 and 162 Da heavier than the prototype of RA. The daughter ions were at 631.21 [M-H-H2O], 599.20 [M-H-H2O-CH4O] and 423.20 [M-H-H2O-CH4O-glcUA] in its MS/MS spectrum, which indicated that M3 corresponded to the glucuronide conjugate of M1.
M4 (tR = 15.19 min) displayed the deprotonated [M-H] ion at m/z 621.3605 (C34H54O10). It was 176 Da (the addition of C6H8O6) heavier than M2. The fragmentation ions at m/z 603.43 [M-H-H2O], 553.31 [M-H-2H2O-CH4O], 445.39 [M-H-glcUA], and 395.34 [M-H-H2O-CH4O-glcUA], suggested that M4 was the glucuronide conjugate of M2.
M5 (tR = 8.41 min) and M6 (tR = 8.80 min), with 2 Da less than M0, exhibited the same deprotonated molecular [M-H] ion at m/z 485.3267 (C30H46O5). In their MS/MS spectra, M5 and M6 displayed the same product ion at m/z 467.3573 [M-H-H2O], which was also 2 Da lighter than the product ion (m/z 469.3310) of RA. Moreover, the representative fragmentation ions of M5 were at m/z 455.3588 [M-H-2CH3], 437.3543 [M-H-2CH3-H2O], 411.3806 [M-H-2CH3-CO2], and 389.3309 [M-H-H2O-HCOOH-CH4O]. According to the tandem mass behavior and the previous reports [19,27], M5 could be confirmed as rotundanonic acid. The daughter ion at m/z 405.3729, discovered in the MS/MS spectrum of M6, was consistent with [M-H-2H2O-CO2]. Finally, according to the above results and the literature [19], M5 and M6 were speculated to be the isomers of the dehydrogenation metabolites of RA.
M7 (tR = 7.86 min) and M8 (tR = 10.18 min), which was 14 Da (with the addition of CH2) heavier that of M5 and M6, displayed the same deprotonated formula of C31H48O5 ([M-H], m/z 499.3423). The product ions, m/z 481.3273 [M-H-H2O], 469.3383 [M-H-2CH3], and 419.3471 [M-H-2H2O-CO2], were also 14 Da heavier than the corresponding product ions of M5 and M6 (m/z 467.3573, 455.3588, 405.3729),which indicated the presence of methylation. Other fragmentation ions, m/z 485.3659 [M-H-CH2] and 439.3662 [M-H-CH2-HCOOH], were found in their MS/MS spectra as well. Hence, M7 and M8 were tentatively elucidated as the methylation products of dehydrogenation M0.
M9 (tR = 16.46min) presented a [M-H] ion at m/z 661.3616 (C36H54O11) and was 176 Da (the addition of C6H8O6) heavier than M5 and M6. The daughter ions at m/z 643.39 [M-H-H2O] and 581.44 [M-H-2H2O-CO2] were 176 Da heavier than the corresponding daughter ions of M6 (m/z 467.3567 and 405.3729). This suggested that M9 was the glucuronide conjugate of dehydrogenated M0.
M10 (tR = 6.11 min) and M11 (tR = 7.54 min) displayed the identical molecular ion [M-H] at m/z 503.3372 (C30H48O6). The 16 Da mass addition suggested an oxygen atom introduction of M0 (503 − 487 = 16). In their MS/MS spectra, the product ions at m/z 485.3713 (through the elimination of an H2O), 453.3587 (through the losses of H2O and CH4O), and 407.3573 (through the sequentially neutral cleavages of H2O, CH4O and HCOOH) were shown. The tandem mass behaviors were similar to M0. Thus, it was proposed that M10 and M11 were the isomers of hydroxylation products of RA. The literature [19] supports this speculation.
M12 (tR = 6.44 min) and M13 (tR = 7.81 min), which displayed the identical deprotonated molecule of C30H46O6 ([M-H], m/z 501.3216), were 14 Da heavier than M0, indicating one oxygen atom addition and two hydrogen atoms loss of M0 (501 − 487 = 14). The product ions of M12 and M13 shown at m/z 483.3675 [M-H-H2O], 469.3797 [M-H-CH4O], 451.2440 [M-H-H2O-CH4O] and 405.3373 [M-H-H2O-CH4O-HCOOH], were 2 Da less than the product ions at m/z 485.3713, 471.3570, 453.3587 and 407.3552 of M10 and M11, suggesting the occurrence of dehydrogenation. Accordingly, M12 and M13 were diagnosed as the isomers of hydroxylated and dehydrogenated products of RA.
M14 (tR = 8.36 min) presented the [M-H] ion at m/z 499.3107 (C30H44O6). It was 2 Da lighter than M12 and M13. The fragmentation ions at m/z 481.3325 [M-H-H2O] and 449.3637[M-H-H2O-CH4O], was also 2 Da lighter than the fragmentation ions of M12 (m/z 483.3675, 451.2440), indicating that M14 was the dehydrogenation product of M12.
M15 (tR = 5.72 min) displayed the deprotonated molecule of C29H46O6. Compared with M0, the [M-H] ion of M15 at m/z 489.3261 was 2 Da (489 − 487 = 2) heavier than that of RA, indicating an oxygen atom addition and a methyl group cleavage of RA’s molecular formula. The primary daughter ions exhibited at m/z 471.3112 [M-H-H2O], 439.2938 [M-H-H2O-CH4O] and 421.2827 [M-H-2H2O-CH4O], were also 2 Da heavier than the correlated product ions of RA. As a consequence, M15 was determined as the demethylation and oxidation metabolites of RA, which was also reported in Li’s work [19].
M16 (tR = 5.66 min, m/z 519.3369), which exhibited the molecular formula of C30H48O7, consisted of the introduction of two oxygen atoms (32 Da) of RA. The product ions at m/z 501.2282 [M-H-H2O], 469.2262 [M-H-H2O-CH4O] and 423.3068 [M-H-H2O-CH4O-HCOOH] found in its MS/MS spectrum, corresponding to the sequential cleavages of H2O, CH4O, and HCOOH, were 32 Da heavier than those of RA. Thus, M16 was proposed as the di-hydroxylated product of RA. This metabolite was detected in normal rats reported by Li et al. [19]. However, we only detected it in NAFLD rats.
M17(tR = 6.82 min) showed the deprotonated molecular [M-H] ion at m/z 489.3506 (C30H50O5). It was 2 Da (with the addition of two hydrogens) heavier than M0. The main fragmentation ions were at m/z 471.2795 [M-H-H2O] and 407.3333 [M-H-2H2O-HCOOH]. Thus, M17 was determined as the reduction of M0.
M18 (tR = 5.56 min) displayed the deprotonated formula of C30H50O6 ([M-H], m/z 505.3398). It was 16 Da (the addition of one oxygen) heavier than the molecular weight of M17. The [M-H] ion gave rise to the daughter ions at m/z 487.3348 [M-H-H2O], 423.3238 [M-H-2H2O-HCOOH] and 391.2398 [M-H-2H2O-HCOOH-CH4O], indicating that M18 was the hydroxylation of M17.
M19 (tR = 5.89 min) and M20 (tR = 7.04 min) displayed the identical deprotonated formula of C30H48O8S ([M-H], m/z 567.2737), which were 80 Da (with the introduction of SO3) higher than the molecular weight of RA. In their MS/MS spectra, M19 showed fragmentation ions at m/z 549.3577 [M-H-H2O], 503.2623 [M-H-H2O-HCOOH], 489.3547 [M-H-HCOOH-CH4O], and 485.2561 [M-H-2H2O-HCOOH], which were similar to the fragmentation behaviors of M0. However, the position of sulfate conjugation for M19 remained inconclusive. In comparison, M20 showed fragmentation ions at m/z 523.3328 [M-H-CO2], 487.3748 [M-H-SO3], 453.2393 [M-H-2H2O-CH4O-HCOOH] and 407.3369 [M-H-2H2O-CO2-SO3], which were consistent with the previous report [25,28,29], suggesting that sulfate conjugation presented at C-3. Thus, M19 and M20 were tentatively elucidated as the sulfate conjugate product of RA.
M21 (tR = 5.94 min) and M22 (tR = 6.21 min) shared the same molecular formula of C29H46O8S with the deprotonated ion at m/z 553.2967. The product ion at 473.2652 [M-H-SO3], indicated that M21 and M22 corresponded to the sulfate conjugate of M1. Meanwhile, other product ions such as m/z 503.3317 [M-H-H2O-CH4O], 489.3580 [M-H-H2O-HCOOH], 485.2623 [M-H-2H2O-CH4O], 429.2460 [M-H-CO2-SO3] and 379.3122 [M-H-H2O-CH4O-CO2-SO3] were also found. Thus, M21 and M22 were diagnosed as the sulfate conjugate and demethylated products of RA.
M23 (tR = 7.31 min) showed the deprotonated ion at m/z 565.2891 (C30H46O8S). It was 80 Da (the addition of SO3, 565 − 485 = 80) heavier than the molecular weight of M5 and M6 (485.3267). Furthermore, it also gave rise to daughter ions at m/z 515.3238 [M-H-H2O-CH4O], 501.3277 [M-H-H2O-HCOOH], 485.3311 [M-H-SO3], 439.3272 [M-H-HCOOH-SO3], and 421.3105 [M-H-H2O-HCOOH-SO3]. Similar to M20, it was speculated that the sulfate conjugation occurred at C-3 based on the previous report [25,28]. Therefore, M23 was proposed as the sulfate conjugate product of dehydrogenated RA.
M24 (tR = 5.50 min) was characterized as the deprotonated quasi-molecular ion at m/z 583.2958 ([M-H], C30H48O9S), which was 80 Da (the addition of SO3, 583 − 503 = 80) heavier than that at m/z 503.3372 (M10, M11). Meanwhile, it also generated product ions at m/z 565.2947 [M-H-H2O], 533.3004 [M-H-H2O-CH4O], 467.2841 [M-H-2H2O-SO3], and 439.3002 [M-H-H2O-HCOOH-SO3]. Accordingly, M24 was proposed to be the sulfate conjugate product of hydroxylated RA.
M25 (tR = 5.61 min) was characterized with the [M-H] ion at m/z 581.2805(C30H46O9S), which was 80 Da (581 − 501 = 80) heavier than M12 and M13. The daughter ions at m/z 563.2995 [M-H-H2O], 517.2929 [M-H-H2O-HCOOH-SO3], 501.2476 [M-H-SO3], 487.2725 [M-H-H2O-CH4O-CO2], and 467.2502[M-H-2H2O-CH4O-HCOOH] were showed in its MS/MS spectrum. Thus, M25 was identified to be the sulfate conjugate of M12 or M13.
M26 (tR = 17.22 min) displayed the prototype formula of C36H56O11 with the [M-H] ion at m/z 663.3741. It was 176 Da (with the introduction of glcUA) heavier than the molecular weight of M0. The daughter ions of M26 showed at m/z 549.22 [M-H-2H2O-CH4O-HCOOH], 487.22 [M-H-glcUA], and 437.31 [M-H-H2O-CH4O-glcUA]. Therefore, M26 was diagnosed as the C-3 glucuronide conjugate product of RA, which is consistent with a previous study [19].
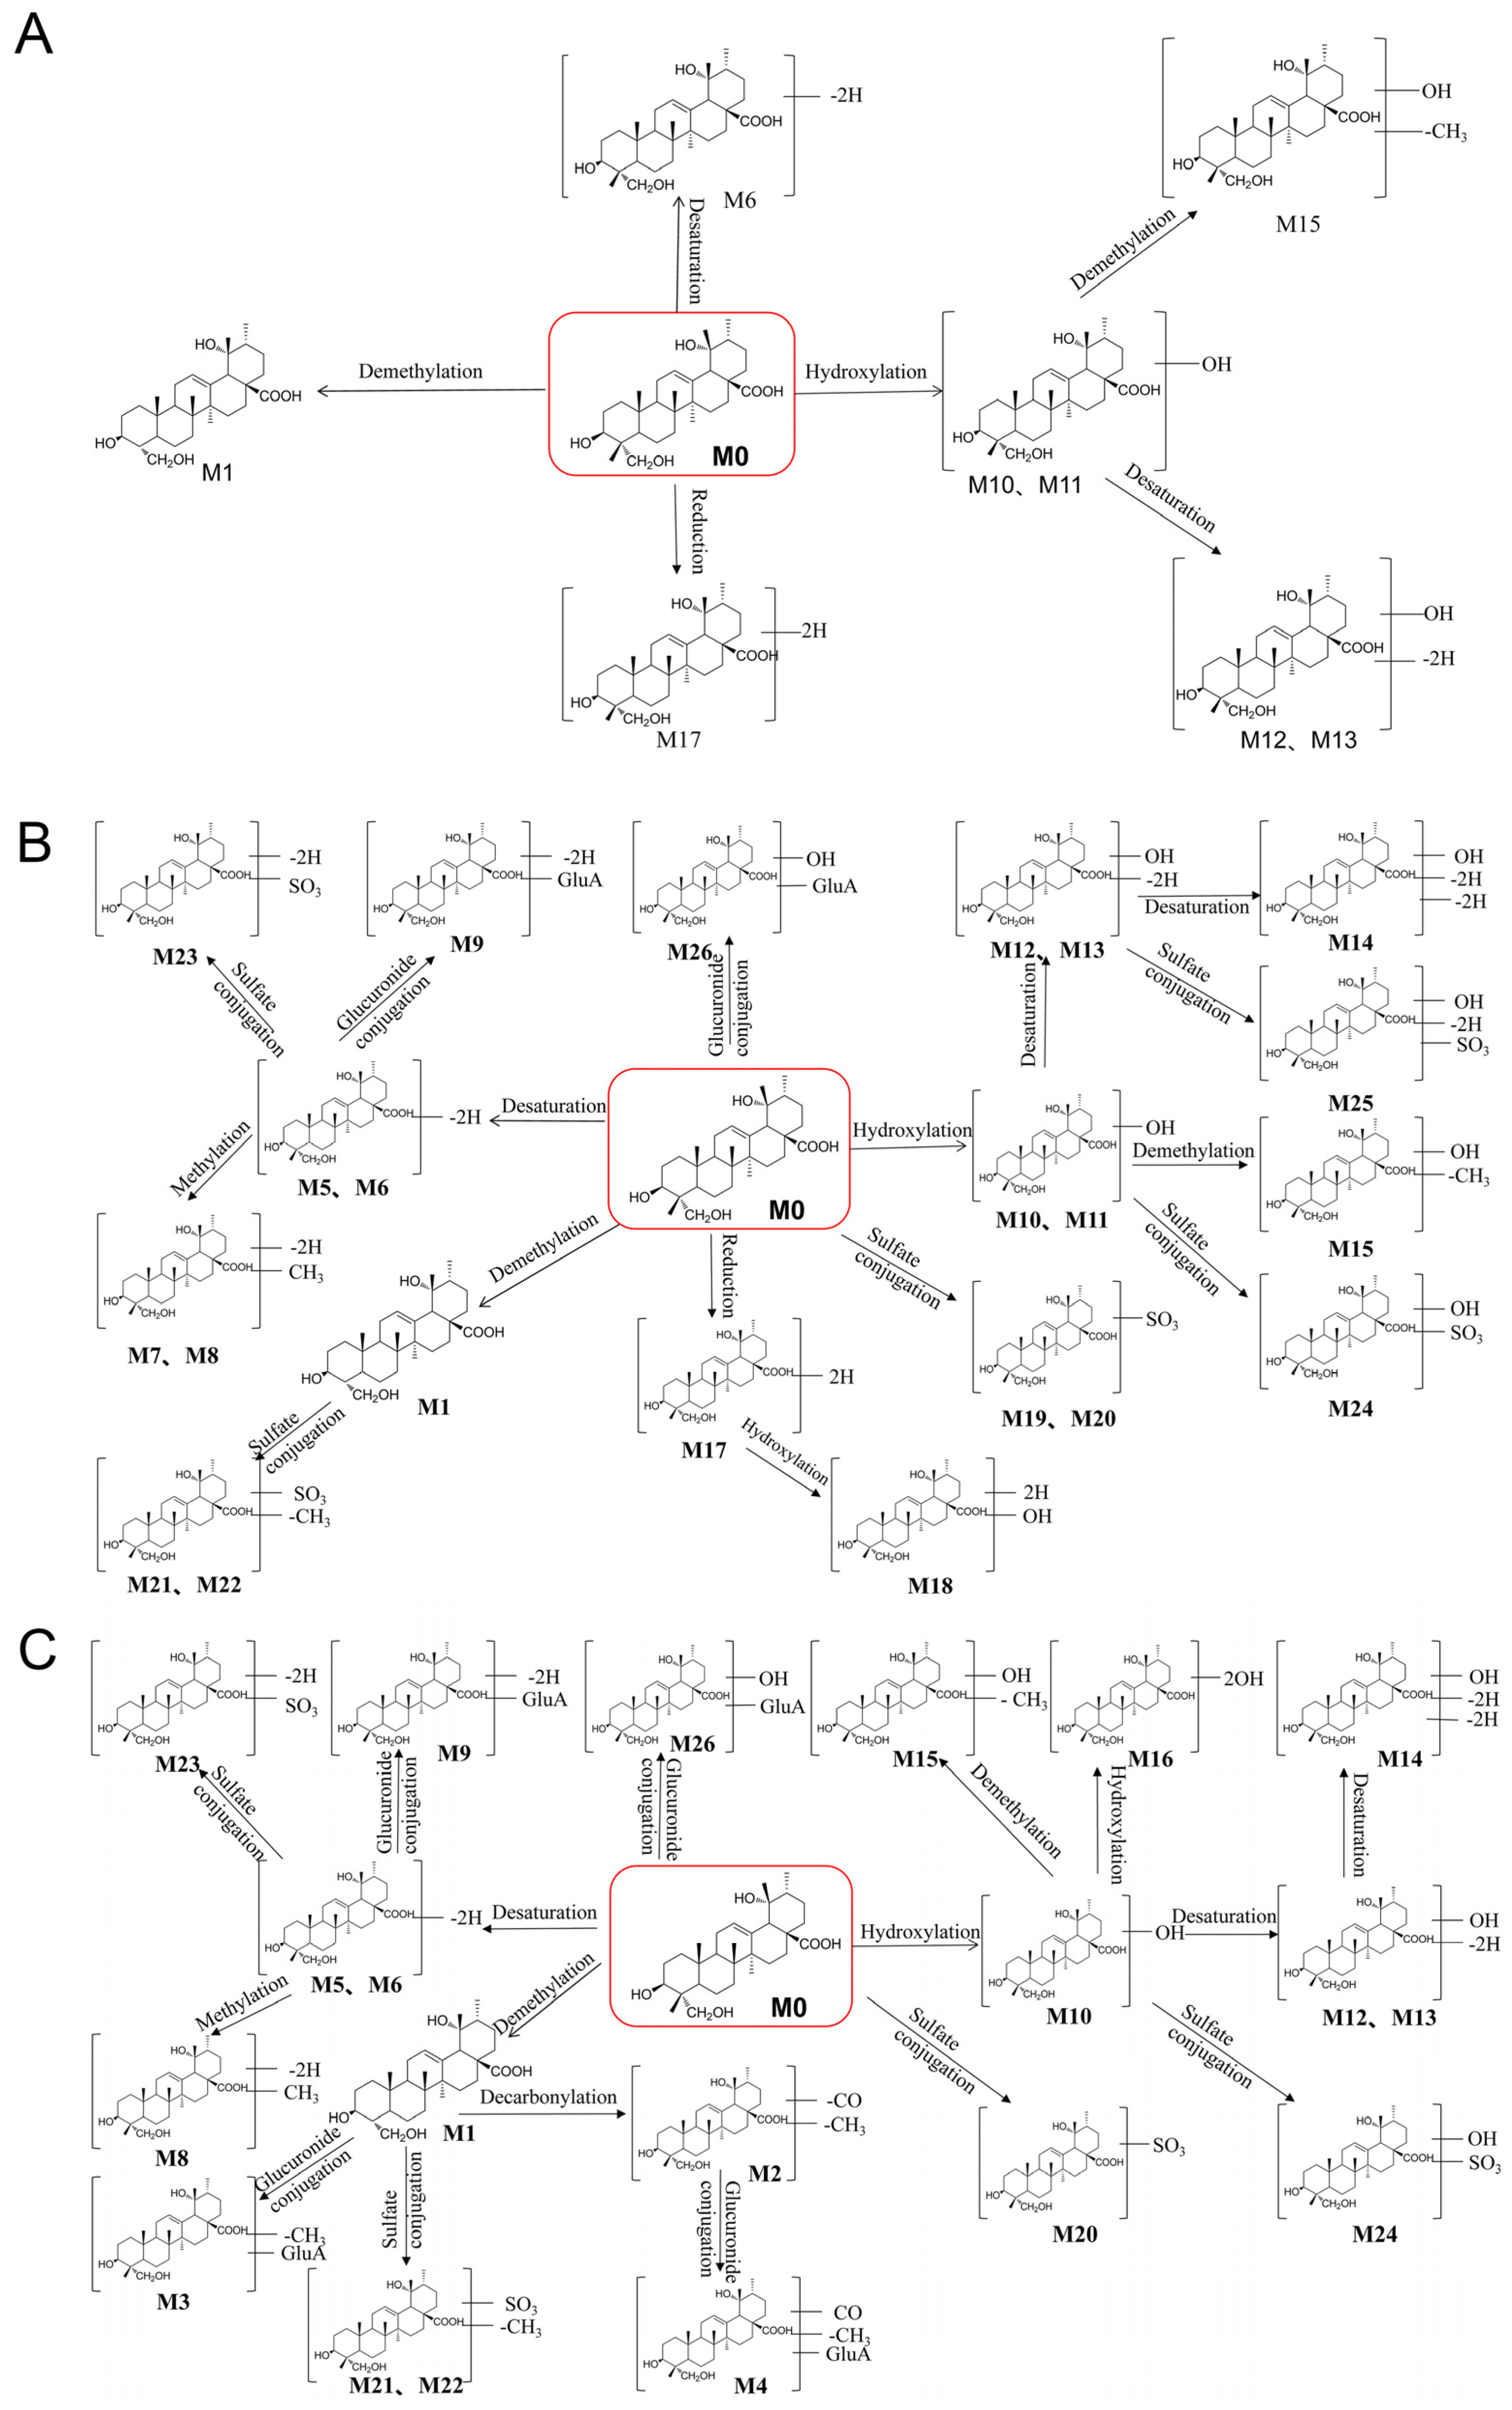
In summary, 26 metabolites were detected and identified, including eight metabolites in vitro, and 26 metabolites in vivo. Among them, compared with previous reports [19], 17 metabolites (except for M1, M5, M6, M10, M11, M15, M16, M20, M26) were detected for the first time. According to the above analyses, the possible metabolic profiles for RA in vivo (normal and NAFLD rats) and in vitro rat liver microsome incubation were proposed (Figure 4). As shown in Figure 4, RA underwent extensive metabolism including phase Ⅰ reactions (desaturation, demethylation, reduction, and hydroxylation), phase Ⅱ reactions (methylation, sulfation, and glucuronidation), as well as multiple-step metabolism, which may explain the low bioavailability of RA. However, the exact structure of the metabolites needs to be confirmed by further study due to the lack of standards.

4. Discussion

The in vitro metabolism of RA was performed in a rat liver microsome incubation system. Rat liver microsomes are an excellent model in vitro for drug metabolism due to the low cost, high-throughput and high efficiency [29]. The cytochrome P450 enzymes (Phase I reactions) markedly expressed in rat liver microsome offer predictive value for in vivo drug metabolism. In the current study, eight metabolites of RA (M1, M6, M10–M13, M15, M17) were detected in rat liver microsomes, all of which were also found in the in vivo metabolism of RA in normal rats. However, this conclusion is limited by the lack of phase II reactions in the liver microsome. This requires further detailed study.
Furthermore, after the oral administration of RA, 22 metabolites were detected in normal rat samples, including 22 in feces, 12 in plasma, 14 in urine, and 13 in the liver. To better understand the influence of NAFLD’s pathological status on in vivo RA metabolism, the metabolic profile in NAFLD rats was conducted and compared with that in normal rats. In total, 20 metabolites were detected in NAFLD rat samples, comprising 16 in feces, 9 in plasma, 12 in urine, and 12 in the liver. From these results, obvious differences were observed in normal and NAFLD model rats. Six metabolites (M7, M11, M17–M19, M25) were only detected in the normal rats, while four metabolites (M2–M4, M16) were only detected in NAFLD model rat samples. There were fewer classes of metabolites determined in NAFLD rats, and the reduction of RA only occurred in normal rats. It was reported that NAFLD’s physiological status could affect the quantity and function of hepatic drug metabolism enzymes [30]. In this study, the liver suffered some damage in NAFLD rats. Therefore, the divergent metabolism between normal and NAFLD rats was possibly owing to changes in drug metabolism enzymes under the pathological condition. In this study, after the oral administration of RA, most metabolites were detected in feces, which was consistent with Li’s report [19], suggesting that feces are the main metabolic clearance way of RA and its metabolites. In addition, according to previous reports [31,32,33], the gut microbiome may change dramatically in NAFLD rats. Thus, the alteration of the gut microbiome in NAFLD rats was proposed as another reason for the metabolic differences. The speculation that the altered liver function and gut microbiome led to the changed metabolic profile of RA was supported by the fact that in the current study, the feces of normal rats contained all metabolites, while the feces of NAFLD rats lacked some metabolites.

5. Conclusions

In conclusion, a comprehensive metabolic profile of RA in vivo and in vitro was elucidated utilizing UPLC-Q/TOF-MS. Taken together, 26 metabolites were determined, including 22 metabolites in normal rats, 20 metabolites in NAFLD rats, and eight metabolites in vitro. Among them, 17 metabolites were identified for the first time. The major metabolic reactions of RA included demethylation, desaturation, hydroxylation, reduction, sulfation, and glucuronidation. There are differences regarding the metabolite types between the normal and NAFLD model rats, which suggested that the pathological status of NAFLD may affect the RA metabolism. This study offers reliable scientific evidence for a comprehensive understanding of the mechanism of RA regarding efficacy and side effects, which will eventually benefit the clinical application of RA.

Supplementary Materials

The following supporting information can be downloaded at: https://www.mdpi.com/article/10.3390/metabo13010038/s1, Figure S1: Typical chromatograms of rat plasma, urine, fecal and liver, as well as liver microsomal samples. N–F: Fecal sample from normal rats; M–F: Fecal sample from model rats; N–P: Plasma sample from normal rats; M–P: Plasma sample from model rats; N–U: Urine sample from normal rats; M–U: Urine sample from model rats; N–L: Liver sample from normal rats; M–L: Liver sample from model rats; LM: Liver microsomal samples; Figure S2: The MS/MS spectra of metabolites M1–M26.

Author Contributions

Conceptualization, S.G., methodology, L.W. and Y.Z.; formal analysis, L.Z.; investigation, L.W., L.X., Z.W. and L.Z.; data curation, L.W.; writing—original draft preparation, L.W.; writing—review and editing, Y.G. and S.G.; supervision, S.G.; funding acquisition, S.G. All authors have read and agreed to the published version of the manuscript.

Funding

This study was financially supported by the Opening Project of Guangdong Provincial Key Laboratory of New Drug Design and Evaluation (Grant Number 2017B030314030) and the Guangdong Provincial Medical Products Administration (No. 2023ZDZ02).

Institutional Review Board Statement

The animal research protocol was confirmed by the Committee of Ethics of Animal Experimentation of Guangdong Pharmaceutical University (approval number 2017226 and approved on 26 February 2017).

Informed Consent Statement

Not applicable.

Data Availability Statement

The data submitted in this study are available within this article and in the Supplementary Materials.

Conflicts of Interest

The authors declare that they have no conflicts of interest.

References

  1. Zhu, H.; Wang, Z.J.; Wu, Y.L.; Jiang, H.T.; Zhou, F.; Xie, X.H.; Wang, R.L.; Hua, C. Untargeted Metabonomics Reveals Intervention Effects of Chicory Polysaccharide in a Rat Model of Non-Alcoholic Fatty Liver Disease. Int. J. Biol. Macromol. 2019, 128, 363–375. [Google Scholar] [CrossRef] [PubMed]
  2. Farzanegi, P.; Dana, A.; Ebrahimpoor, Z.; Asadi, M.; Azarbayjani, M.A. Mechanisms of Beneficial Effects of Exercise Training on Non-Alcoholic Fatty Liver Disease (NAFLD): Roles of Oxidative Stress and Inflammation. Eur. J. Sport Sci. 2019, 19, 994–1003. [Google Scholar] [CrossRef] [PubMed]
  3. Shulman, G.I. Ectopic Fat in Insulin Resistance, Dyslipidemia, and Cardiometabolic Disease. N. Engl. J. Med. 2014, 371, 2237–2238. [Google Scholar] [CrossRef]
  4. Chen, K.; Ma, J.B.; Jia, X.Y.; Ai, W.; Ma, Z.R.; Pan, Q.W. Advancing the Understanding of NAFLD to Hepatocellular Carcinoma Development: From Experimental Models to Humans. Biochim. Biophys. Acta-Rev. Cancer 2019, 1871, 117–125. [Google Scholar] [CrossRef]
  5. Leoni, S.; Tovoli, F.; Napoli, L.; Serio, I.; Ferri, S.; Bolondi, L. Current Guidelines for the Management of Non-Alcoholic Fatty Liver Disease: A Systematic Review with Comparative Analysis. World J. Gastroenterol. 2018, 24, 3361–3373. [Google Scholar] [CrossRef] [PubMed]
  6. Newman, D.J.; Cragg, G.M. Natural Products as Sources of New Drugs from 1981 to 2014. J. Nat. Prod. 2016, 79, 629–661. [Google Scholar] [CrossRef] [PubMed] [Green Version]
  7. Fan, Z.; Zhou, L.; Xiong, T.Q.; Zhou, J.S.; Li, Q.G.; Tan, Q.L.; Zhao, Z.X.; Jin, J. Antiplatelet Aggregation Triterpene Saponins from the Barks of Ilex Rotunda. Fitoterapia 2015, 101, 19–26. [Google Scholar] [CrossRef]
  8. Liu, W.J.; Peng, Y.Y.; Chen, H.; Liu, X.F.; Liang, J.Y.; Sun, J.B. Triterpenoid Saponins with Potential Cytotoxic Activities from the Root Bark of Ilex Rotunda Thunb. Chem. Biodivers. 2017, 14, e1600209. [Google Scholar] [CrossRef]
  9. Wang, Z.F.; Sun, W.Y.; Yu, D.H.; Zhao, Y.; Xu, H.M.; He, Y.F.; Li, H.J. Rotundic Acid Enhances the Impact of Radiological Toxicity on MCF-7 Cells through the ATM/P53 Pathway. Int. J. Oncol. 2018, 53, 2269–2277. [Google Scholar] [CrossRef] [Green Version]
  10. He, Y.F.; Nan, M.L.; Sun, J.M.; Meng, Z.J.; Li, W.; Zhang, M. Design, Synthesis and Cytotoxicity of Cell Death Mechanism of Rotundic Acid Derivatives. Bioorg. Med. Chem. Lett. 2013, 23, 2543–2547. [Google Scholar] [CrossRef]
  11. He, Y.F.; Nan, M.L.; Sun, J.M.; Meng, Z.J.; Yue, F.G.; Zhao, Q.C.; Yang, X.H.; Wang, H. Synthesis, Characterization and Cytotoxicity of New Rotundic Acid Derivatives. Molecules 2012, 17, 1278–1291. [Google Scholar] [CrossRef] [PubMed] [Green Version]
  12. Hsu, Y.M.; Hung, Y.C.; Hu, L.H.; Lee, Y.J.; Yin, M.C. Anti-Diabetic Effects of Madecassic Acid and Rotundic Acid. Nutrients 2015, 7, 10065–10075. [Google Scholar] [CrossRef] [PubMed] [Green Version]
  13. Roy, G.; Guan, S.; Liu, H.X.; Zhang, L. Rotundic Acid Induces DNA Damage and Cell Death in Hepatocellular Carcinoma Through AKT/MTOR and MAPK Pathways. Front. Oncol. 2019, 9, 545. [Google Scholar] [CrossRef]
  14. Chen, S.; Zhao, Q.; He, Y.; Nan, M. Use of Rotundic Acid in Preparing Medicine, e.g., Tablet for Regulating Blood Fat. CN101849950-A, 6 October 2010. [Google Scholar]
  15. Li, G.; Zhao, Q.; He, Y.; Nan, M.; Wang, L.; Zhao, Y. Preparation of Medicine Composition, e.g., for Preventing and Treating Alcoholic Liver Injury, by Crushing Cortex Ilicis Rotundae, Extracting with Ethanol, Filtering, Passing through Processed Macroporous Resin Column, Eluting, and Drying. CN102058632-A, 30 May 2012. [Google Scholar]
  16. Liu, H.J.; Cao, S.T.; Wen, B.Y.; Han, X.; Li, Y.; Li, S.; Li, J.; Zhang, L. Rotundic Acid Ameliorates Non-Alcoholic Steatohepatitis via SREBP-1c/SCD1 Signaling Pathway and Modulating Gut Microbiota. Int. Immunopharmacol. 2021, 99, 108065. [Google Scholar] [CrossRef] [PubMed]
  17. Guan, S.; Zou, Y.K.; Jia, B.J.; Wu, L.; Yang, Z.C.; Yuan, F.; Zhang, L. Pharmacokinetic and Metabolic Studies of Vortioxetine in Rats Using Ultra High Performance Liquid Chromatography with Tandem Mass Spectrometry. J. Sep. Sci. 2018, 41, 4469–4479. [Google Scholar] [CrossRef] [PubMed]
  18. Song, G.S.; Jin, M.M.; Du, Y.F.; Cao, L.; Xu, H.J. UPLC-QTOF-MS/MS Based Screening and Identification of the Metabolites in Rat Bile after Oral Administration of Imperatorin. J. Chromatogr. B-Anal. Technol. Biomed. Life Sci. 2016, 1022, 21–29. [Google Scholar] [CrossRef] [PubMed]
  19. Li, H.; Yang, B.; Cao, D.; Zhou, L.; Wang, Q.; Rong, L.; Zhou, X.H.; Jin, J.; Zhao, Z.X. Identification of Rotundic Acid Metabolites after Oral Administration to Rats and Comparison with the Biotransformation by Syncephalastrum Racemosum AS 3.264. J. Pharm. Biomed. Anal. 2018, 150, 406–412. [Google Scholar] [CrossRef]
  20. Shang, H.H.; Wang, Z.; Ma, H.; Sun, Y.H.; Ci, X.Y.; Gu, Y.; Liu, C.X.; Si, D.Y. Influence of Verapamil on the Pharmacokinetics of Rotundic Acid in Rats and Its Potential Mechanism. Pharm. Biol. 2021, 59, 200–208. [Google Scholar] [CrossRef]
  21. Shang, H.H.; Dai, X.H.; Li, M.; Kai, Y.Y.; Liu, Z.R.; Wang, M.; Li, Q.S.; Gu, Y.; Liu, C.X.; Si, D.Y. Absolute Bioavailability, Dose Proportionality, and Tissue Distribution of Rotundic Acid in Rats Based on Validated LC-QqQ-MS/MS Method. J. Pharm. Anal. 2022, 12, 278–286. [Google Scholar] [CrossRef]
  22. Yang, Z.; Zhu, M.Z.; Zhang, Y.B.; Wen, B.B.; An, H.M.; Ou, X.C.; Xiong, Y.F.; Lin, H.Y.; Liu, Z.H.; Huang, J.A. Coadministration of Epigallocatechin-3-Gallate (EGCG) and Caffeine in Low Dose Ameliorates Obesity and Nonalcoholic Fatty Liver Disease in Obese Rats. Phyther. Res. 2019, 33, 1019–1026. [Google Scholar] [CrossRef]
  23. Zhao, H.; Luo, Y.E.; Zhang, Y.A.; Chen, X.X.; Wang, H.; Guo, D.Y.; Wu, Z.X. Effects of Bacillus Subtilis on Hepatic Lipid Metabolism and Oxidative Stress Response in Grass Carp (Ctenopharyngodon Idellus) Fed a High-Fat Diet. Mar. Life Sci. Technol. 2020, 2, 50–59. [Google Scholar] [CrossRef] [Green Version]
  24. Yang, Q.C.; Wu, W.H.; Han, F.M.; Chen, Y. Identification of In-Vivo and in-Vitro Metabolites of Palmatine by Liquid Chromatography-Tandem Mass Spectrometry. J. Pharm. Pharmacol. 2009, 61, 647–652. [Google Scholar] [CrossRef] [PubMed]
  25. Xia, B.B.; Bai, L.; Li, X.R.; Xiong, J.; Xu, P.X.; Xue, M. Structural Analysis of Metabolites of Asiatic Acid and Its Analogue Madecassic Acid in Zebrafish Using LC/IT-MSn. Molecules 2015, 20, 3001–3019. [Google Scholar] [CrossRef] [PubMed] [Green Version]
  26. Yang, B.; Li, H.; Ruan, Q.F.; Tong, Y.; Liu, Z.Q.; Xuan, S.X.; Jin, J.; Zhao, Z.X. Rapid Profiling and Pharmacokinetic Studies of Multiple Potential Bioactive Triterpenoids in Rat Plasma Using UPLC/Q-TOF-MS/MS after Oral Administration of Ilicis Rotundae Cortex Extract. Fitoterapia 2018, 129, 210–219. [Google Scholar] [CrossRef] [PubMed]
  27. Yang, B.; Li, H.; Ruan, Q.F.; Xue, Y.Y.; Cao, D.; Zhou, X.H.; Jiang, S.Q.; Yi, T.; Jin, J.; Zhao, Z.X. A Facile and Selective Approach to the Qualitative and Quantitative Analysis of Triterpenoids and Phenylpropanoids by UPLC/Q-TOF-MS/MS for the Quality Control of Ilex Rotunda. J. Pharm. Biomed. Anal. 2018, 157, 44–58. [Google Scholar] [CrossRef]
  28. Cao, D.; Wang, Q.; Jin, J.; Qiu, M.S.; Zhou, L.; Zhou, X.H.; Li, H.; Zhao, Z.X. Simultaneous Qualitative and Quantitative Analyses of Triterpenoids in Ilex Pubescens by Ultra-High-Performance Liquid Chromatography Coupled with Quadrupole Time-of-Flight Mass Spectrometry. Phytochem. Anal. 2018, 29, 168–179. [Google Scholar] [CrossRef] [PubMed]
  29. Zhang, H.Z.; Jiang, Y.M.; Wu, J.J.; Zheng, C.Q.; Ran, X.R.; Li, D.S.; Huang, M.; Bi, H.C. Metabolic Mapping of Schisandra Sphenanthera Extract and Its Active Lignans Using a Metabolomic Approach Based on Ultra High Performance Liquid Chromatography with High-Resolution Mass Spectrometry. J. Sep. Sci. 2017, 40, 574–586. [Google Scholar] [CrossRef]
  30. Cobbina, E.; Akhlaghi, F. Non-Alcoholic Fatty Liver Disease (NAFLD)—Pathogenesis, Classification, and Effect on Drug Metabolizing Enzymes and Transporters. Drug Metab. Rev. 2017, 49, 197–211. [Google Scholar] [CrossRef] [Green Version]
  31. Xie, C.C.; Halegoua-DeMarzio, D. Role of Probiotics in Non-Alcoholic Fatty Liver Disease: Does Gut Microbiota Matter? Nutrients 2019, 11, 2837. [Google Scholar] [CrossRef] [Green Version]
  32. Ji, Y.; Yin, Y.; Li, Z.R.; Zhang, W.Z. Gut Microbiota-Derived Components and Metabolites in the Progression of Non-Alcoholic Fatty Liver Disease (NAFLD). Nutrients 2019, 11, 1712. [Google Scholar] [CrossRef] [PubMed]
  33. Aron-Wisnewsky, J.; Vigliotti, C.; Witjes, J.; Le, P.; Holleboom, A.G.; Verheij, J.; Nieuwdorp, M.; Clement, K. Gut Microbiota and Human NAFLD: Disentangling Microbial Signatures from Metabolic Disorders. Nat. Rev. Gastroenterol. Hepatol. 2020, 17, 279–297. [Google Scholar] [CrossRef] [PubMed]
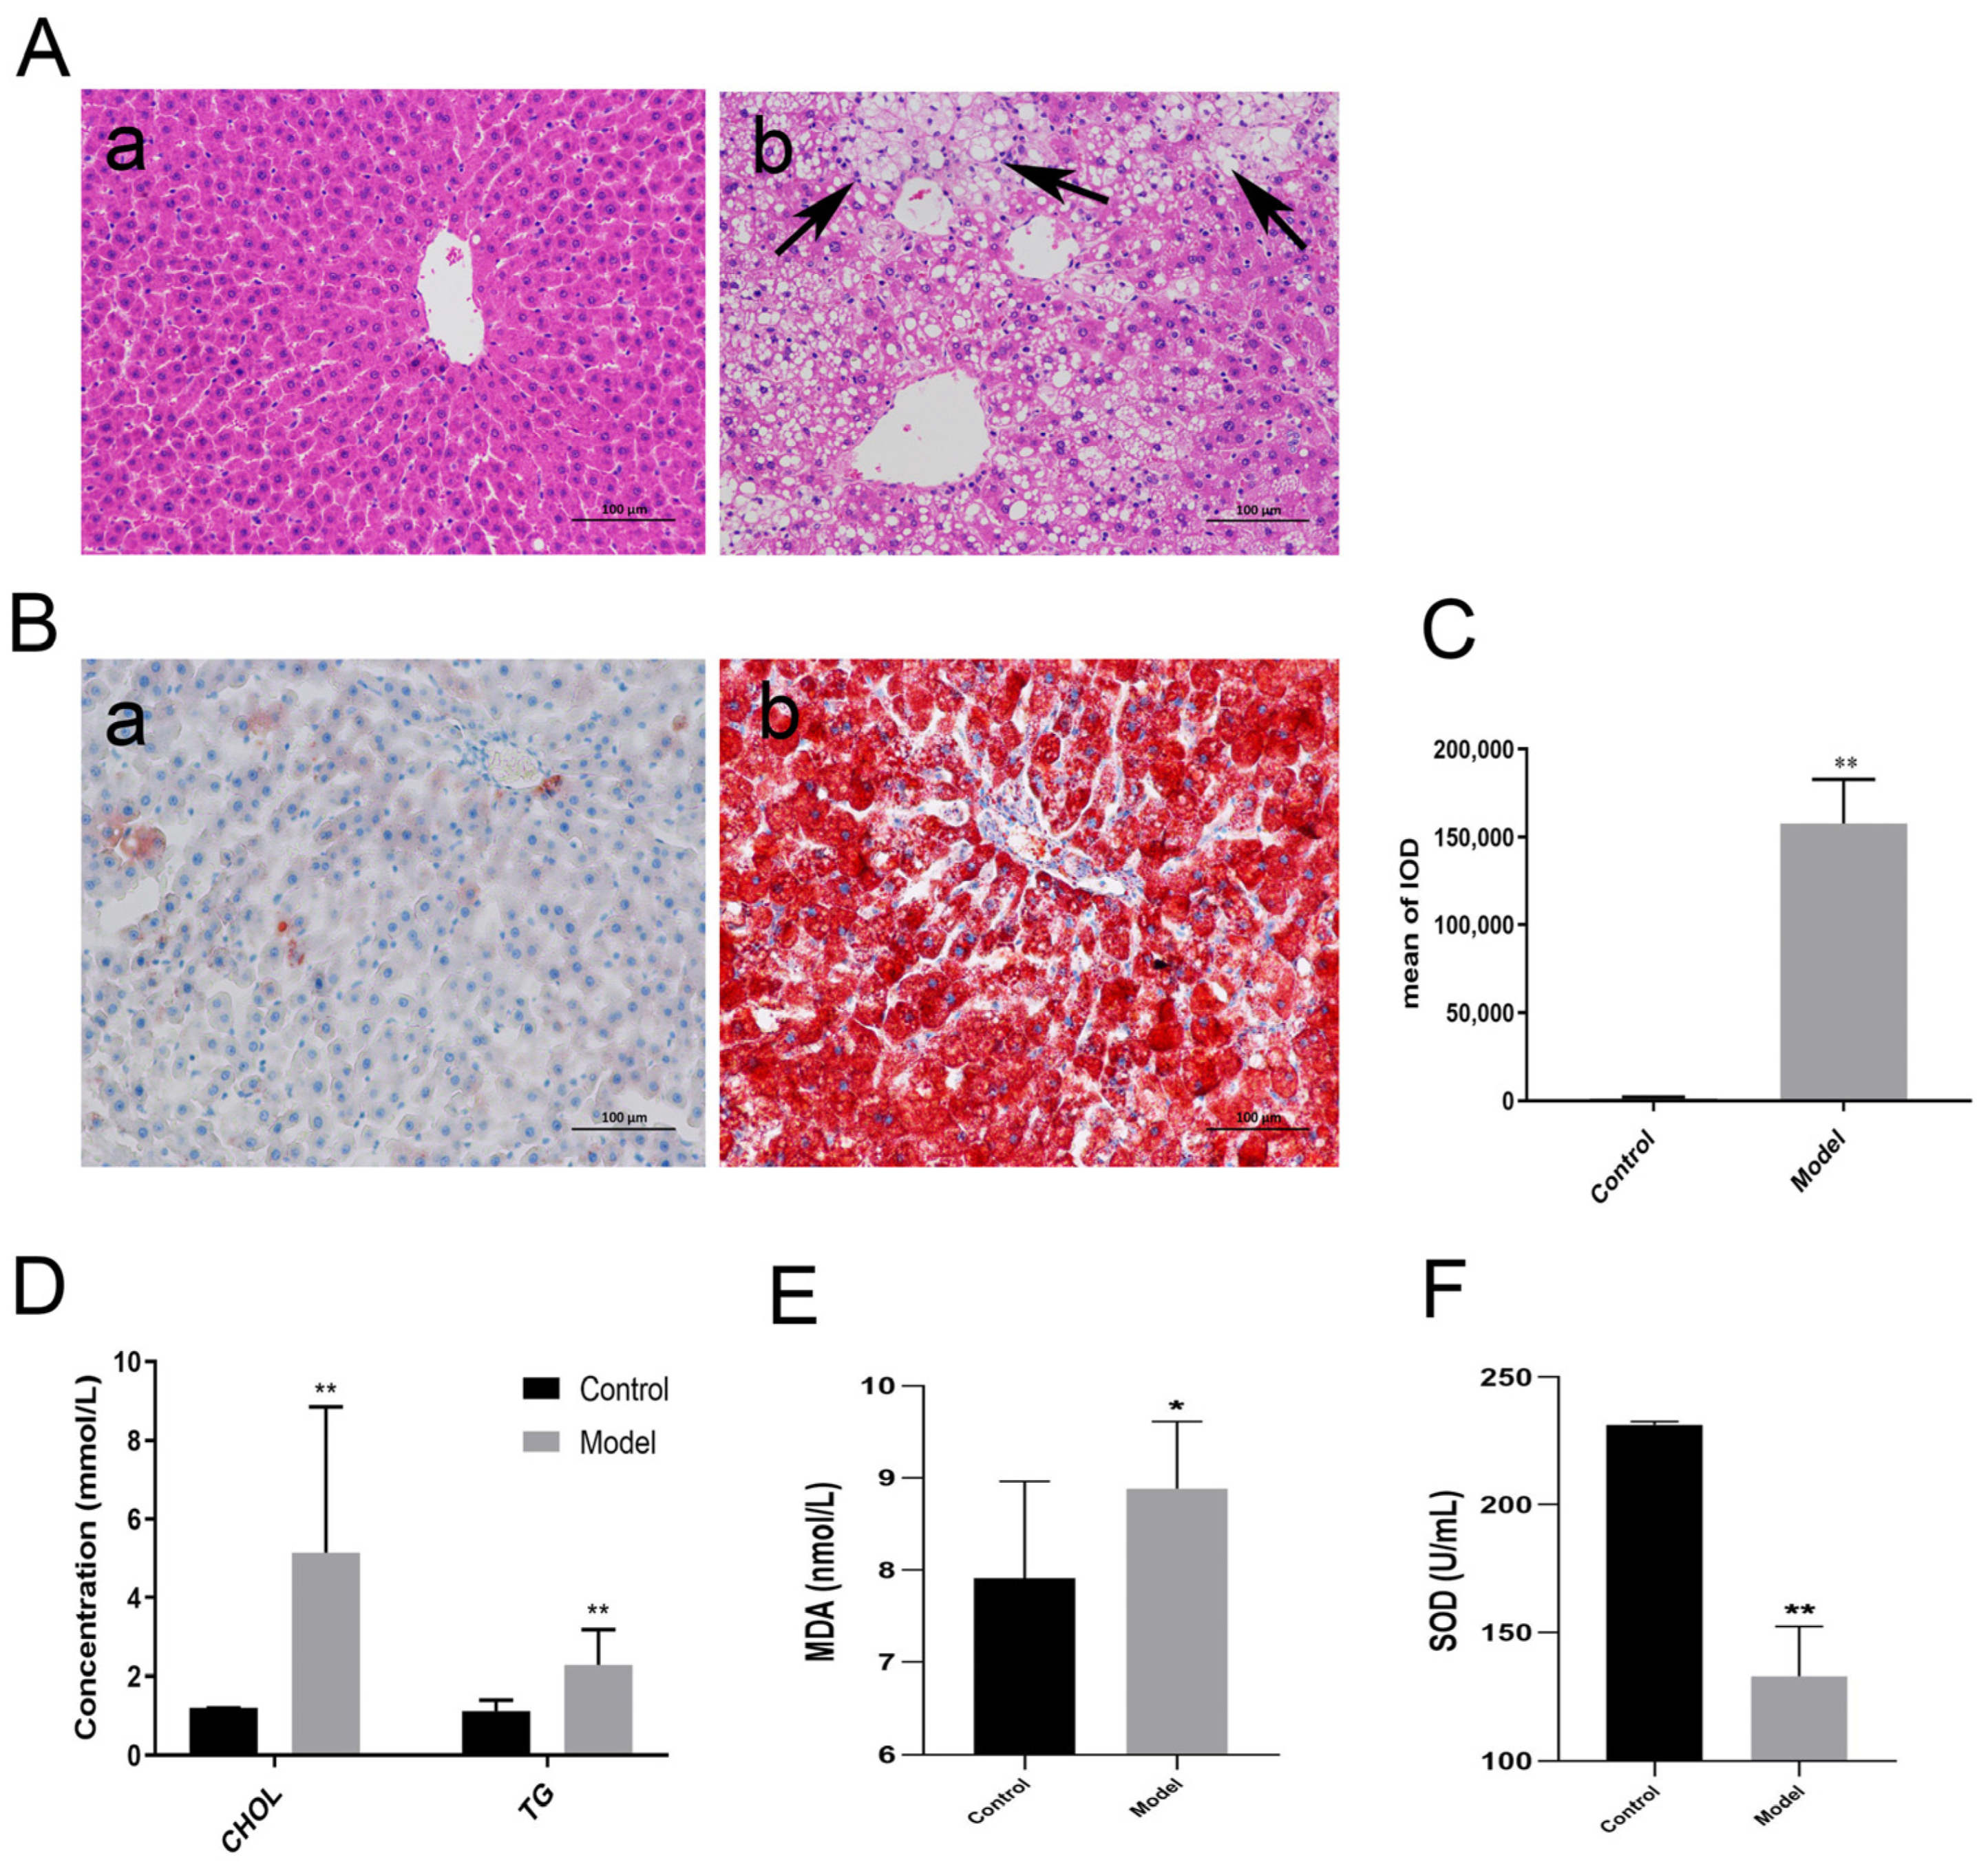
Figure 1. Establishment of NAFLD model. (A) The histopathological examination by H&E (200×). (a): Normal control group; (b): NAFLD model group. The black arrows indicate lipid droplets and inflammatory infiltrate. (B) Oil red o (×200) staining in control (a) and model (b) groups. (C) Quantitative analysis of oil red staining. IOD: integral optical density. (D) The level of CHOL and TG in the liver. (E) The concentration of MDA in serum. (F) The concentration of SOD in serum. Data are exhibited as the mean ± SD (n = 10/group). * indicates p < 0.05, ** indicates p < 0.01.
Metabolites 13 00038 g001
Figure 2. The MS2 spectra of RA (A) and the proposed fragmentation process of RA (B). “!”indicates there may be interference with the shape or resolution of the particular MS peaks. It usually appears on the magnified Masslynx mass specta. For known chemical structures, these molecular ions can be manually determined.
Metabolites 13 00038 g002
Figure 3. The extracted ion chromatograms of RA and its metabolites.
Metabolites 13 00038 g003
Figure 4. The proposed metabolic profiles of RA, in rat liver microsome (A), in normal rat (B), and in NAFLD rat (C).
Metabolites 13 00038 g004
Table 1. The metabolite information of RA.
NO.tR (Min)[M-H]FormulaMetabolite DescriptionMS/MS FragmentNormal RatNAFLD RatLM
Cal.Exp.FPULFPUL
08.04487.3423487.3420C30H48O5Prototype469.3310, 455.2479, 437.3031, 423.3235, 405.3140, 393.3111, 391.2842+++++++++
17.65473.3267473.3260C29H46O5Demethylation455.2859, 423.2159, 409.2301, 405.2641, 391.2842++++++++
215.75445.3317445.3348C28H46O4Demethylation + Decarbonylation427.35, 395.35, 391.34++
34.62649.3587649.3563C35H54O11Demethylation + Glucuronide conjugation631.21, 599.20, 423.20+++
415.19621.3638621.3605C34H54O10Demethylation + Decarboxylation + Glucuronide conjugation603.43, 553.31, 445.39, 395.34++
58.41485.3267485.3317C30H46O5Dehydrogenation467.3573, 455.3588, 437.3543, 411.3806, 389.3309+++++++
68.8485.3267485.3273C30H46O5Dehydrogenation467.3567, 405.3729, 389.3342++++++
77.86499.3423499.3423C31H48O5Desaturation + Methylation485.3569, 481.3273, 469.3383, 419.3471, 437.3595+++
810.18499.3423499.3358C31H48O5Desaturation + Methylation481.3222, 439.3662++++
916.46661.3587661.3616C36H54O11Desaturation + Glucuronide conjugation643.39, 581.44, 409.24+++++++
106.11503.3372503.3366C30H48O6Hydroxylation485.3713, 453.3587, 407.3573, 391.3818++++++
117.54503.3372503.3387C30H48O6Hydroxylation485.3718, 471.3510, 453.3677, 407.3552, 391.3692+++++
126.44501.3216501.3211C30H46O6Hydroxylation + desaturation483.3675, 439.3691, 451.2440, 405.3373+++++
137.81501.3216501.3580C30H46O6Hydroxylation + desaturation483.3567, 469.3797, 439.3788, 421.3737, 405.3845+++++++
148.36499.3059499.3107C30H44O6Hydroxylation + desaturation + Desaturation481.3325, 457.2943, 449.3637++++
155.72489.3216489.3261C29H46O6Hydroxylation + Demethylation471.3112, 439.2938, 421.2827++++++++
165.66519.3321519.3369C30H48O72 x Hydroxylation501.2282, 469.2262, 423.3068++
176.82489.358489.3506C30H50O5Reduction471.2795, 407.3333+++
185.56505.3529505.3398C30H50O6Reduction + Hydroxylation487.3348, 423.3238, 391.2398++
195.89567.2991567.2737C30H48O8SSulfate conjugation549.3577, 503.2623, 489.3547, 485.2561+
207.04 567.2991567.3094C30H48O8SSulfate conjugation523.3328, 487.3748, 453.2393, 407.3369+++++
215.94553.2835553.3008C29H46O8SDemethylation + Sulfate conjugation485.2623, 489.3580, 473.2652, 429.2460, 379.2833+++++
226.21553.2835553.2967C29H46O8SDemethylation + Sulfate conjugation503.3317, 489.3503, 485.2567, 473.3644, 429.2452, 379.3122+++++
237.31565.2835565.2891C30H46O8SDesaturation + Sulfate conjugation515.3238, 501.3277, 485.3311, 439.3272, 421.3105+++++
245.5583.294583.2958C30H48O9SHydroxylation + Sulfate conjugation565.2947, 533.3004, 467.2841, 439.3002+++++
255.61581.2784581.2805C30H46O9SHydroxylation + desaturation + Sulfate conjugation563.2995, 517.2929, 501.2476, 487.2725, 467.2502++
2617.22663.3744663.3741C36H56O11Glucuronide conjugation549.22, 487.22, 437.31++++++
TR, retention time; F, feces; P, plasma; U, urine; L, liver; LM, liver microsome.
Disclaimer/Publisher’s Note: The statements, opinions and data contained in all publications are solely those of the individual author(s) and contributor(s) and not of MDPI and/or the editor(s). MDPI and/or the editor(s) disclaim responsibility for any injury to people or property resulting from any ideas, methods, instructions or products referred to in the content.