Abstract
Long-chain polyunsaturated fatty acids (LC-PUFAs) play important roles in human health, from controlling inflammation to lipid and glucose homeostasis. In our previous study, which employed a cluster analysis of a plasma fatty acid (FA) pattern, we identified two clusters of metabolic syndrome (MetS) independent of clinical and biochemical parameters within the whole study group (controls together with metabolic syndrome (MetS) patients). FA desaturase (FADS) genes are the key regulators of LC-PUFA metabolism. The aim of this study was to analyze associations between FADS polymorphisms and clusters of MetS. The study group consisted of 188 controls and 166 patients with MetS. The first cluster contained 71 controls (CON1) and 109 MetS patients (MetS1). The second cluster consisted of 117 controls (CON2) and 57 MetS patients (MetS2). In comparison with MetS2, cluster MetS1 displayed a more adverse risk profile. Cluster CON1 had, in comparison with CON2, higher body weight and increased triacylglycerol levels (p < 0.05). We found that the FADS rs174537 (p < 0.001), rs174570 (p < 0.01), and rs174602 (p < 0.05) polymorphisms along with two inferred haplotypes had statistically significant genotype associations with the splitting of MetS into MetS1 and MetS2. Conversely, we observed no significant differences in the distribution of FADS polymorphisms between MetS and CON subjects, or between CON1 and CON2. These associations between FADS polymorphisms and two clusters of MetS (differing in waist circumference, HOMA-IR, lipolysis, and oxidative stress) implicate the important influence of genetic factors on the phenotypic manifestation of MetS.
1. Introduction
Metabolic syndrome (MetS) is a group of clinical, biochemical, and metabolic conditions that include abdominal obesity, insulin resistance, atherogenic dyslipidemia, and arterial hypertension, all known as MetS components. MetS is associated with a high risk of developing type 2 diabetes mellitus (T2DM), cardiovascular diseases (CVD), as well as a number of other clinical conditions, such as nonalcoholic fatty liver disease (NAFLD), vascular dementia, Alzheimer’s disease, and various tumors (especially pancreatic and colorectal cancer). The increasing prevalence of MetS, due to the obesity pandemic, represents a serious public health concern [1,2,3]. The pathophysiology of MetS involves several complex mechanisms, such as age, gender, and genetic factors [4,5,6]. Lifestyle (overeating and lack of physical activity) and the quantity and composition of dietary fat and carbohydrates (fructose and sucrose) consumed are also important contributors to MetS development [3,7].
In addition to the above components, MetS is characterized by increased levels of oxidative stress, low-grade inflammation, hormonal activation, endothelial dysfunction, and variations in the composition of esterified fatty acids (FAs) in various body compartments [3,7,8]. Like other insulin resistance states, MetS is mostly connected to increased proportions of serum saturated FAs (SFAs), palmitoleic acid (POA, 16:1n-7), and dihomo-γ-linolenic acid (DGLA, 20:3n-6), whereas proportions of linoleic acid (LA, 18:2n-6) and total n-6 polyunsaturated FAs (n-6 PUFA) are decreased. Moreover, MetS is linked to increased estimated activities of the enzymes delta-9 desaturase (D9D) and delta-6 desaturase (D6D), which catalyze the synthesis of POA from palmitic acid (PA, 16:0), oleic acid (OA, 18:1n-9) from stearic acid (SA, 18:0), and γ-linolenic acid (GLA, 18:3n-6) from LA. In contrast, the activity of delta-5 desaturase (D5D), which catalyzes the synthesis of arachidonic acid (AA, 20:4n-6) from DGLA is decreased. The dysregulated FA metabolism and composition are connected to an altered n-3 PUFA/n-6 PUFA ratio [6,9,10,11,12]. Similar FA alterations correlate with both the total and cardiovascular mortality and the risk of developing T2DM.
MetS and other cardiometabolic diseases such as obesity, T2DM, NAFLD, and CVD, are characterized by decreased concentrations of long-chain polyunsaturated fatty acids (LC-PUFA) in plasma and body tissues [7,13,14]. The biological effects of LC-PUFAs are supposed to be mediated by the availability of PUFAs with ≥20 carbons and ≥3 double bonds [15].
LC-PUFAs have a wide range of regulatory, autocrine, and paracrine effects. LC-PUFAs are important components of cell membranes, which are known to affect fluidity and permeability, thus, influencing the functions of membrane-associated proteins. They also act as substrates for the synthesis of eicosanoids and docosanoids (being substrates for the synthesis of specialized proresolving mediators) and, thus, control inflammation, act as signaling molecules (eicosanoids and endocannabinoids), and regulate gene expression by serving as ligands to transcription factors such as peroxisome proliferator-activated receptors γ/α, (PPARγ/α), nuclear factor kappa B (NFκB), and sterol regulatory element-binding protein-1 (SREBP-1), all of which affect the lipid and glucose metabolism [6,16,17].
The FA composition of plasma lipids and cell membranes depends on their dietary intake and endogenous FA metabolism, which are in turn influenced by many factors, including age, gender, ethnicity, health status, and, importantly, genetics [18]. Apart from the dietary supply of preformed LC-PUFAs, they can be derived from precursor essential FAs, LA, and α-linolenic acid (ALA, 18:3n-3) via successive desaturation and elongation. The activities of fatty acid desaturases (FADSs) and elongases significantly affect FA profiles in different body compartments. Delta-5 desaturase (D5D, FADS1) and delta-6 desaturase (D6D, FADS2) are the key enzymes required for the synthesis of LC-PUFA [19,20]. D5D and D6D catalyze the conversion of n-6 and n-3 PUFAs to their longer and more unsaturated products. Through a series of desaturation and elongation reactions (mainly in the liver), the parent n-6 PUFA, LA, is converted to AA, while the parent n-3 PUFA, ALA, is converted to eicosapentaenoic acid (EPA, 20:5n-3) and docosahexaenoic acid (DHA, 22:6n-3) [13,14,16].
Both D5D and D6D are encoded by the fatty acid desaturase 1 (FADS1) and FADS2 genes, which are mapped on human chromosome 11q12.2-13.1. Activities of D5D and D6D are associated with the LC-PUFA content in the body compartments and are related to MetS risk. Candidate gene and genome-wide association studies (GWASs) have described associations between minor alleles of single-nucleotide polymorphisms (SNPs) in the FADS1–FADS2 genes and lower concentrations of LC-PUFAs. Carriers of the minor alleles exhibit increased concentrations of desaturase substrates (LA and ALA) and decreased levels of desaturase products (AA, EPA, and DHA) [14,21]. Only in the FADS2 rs968567 (C > T) polymorphism has a minor allele been shown to have higher promoter activity of D6D [22]. GWASs have revealed the presence of two common FADS haplotypes (A and D), which differentially regulate LC-PUFA synthesis. While haplotype D is associated with an increased ability to synthesize AA and EPA, haplotype A is associated with an opposite synthesizing effect on these LC-PUFAs. Variants of FADS1/FADS2 genes (as well as the statistically reconstructed haplotypes derived from them) show the strongest association with AA, but also with LA, ALA, eicosadienoic acid (20:2n-6), DGLA, docosapentaenoic acid (DPA, 20:5n-3), and DHA (22:6n-3) [23,24,25].
SNPs of FADS1–FADS2 genes have been strongly associated with various metabolic phenotypes/traits, including obesity, T2DM, dyslipidemia, and complex conditions, such as coronary artery disease (CAD), ischemic stroke, and NAFLD [18,26,27,28].
Some studies have found significant genotype–phenotype associations between variants of FADS1/FADS2 (rs174547, rs174575) genes and atherogenic dyslipidemia (high triacylglycerol (TAG) and low high-density lipoprotein cholesterol (HDL-C) levels) [29,30,31,32,33,34]. The FADS1 variant (rs174547) is associated with an increased risk of developing MetS [32]. Chinese authors found a significant association between FADS1 rs174547 and MetS, as well as its components (waist circumference, blood pressure, and a low HDL-C level) [34]. In diabetics, the minor allele of the FADS2 variant (rs174575) associated with a higher plasma total cholesterol, LDL-C, and TAG was reported [35]. In addition, several FADS polymorphisms (rs174537, rs174575, rs174547, rs174576, rs174616, and rs174550) have been related to lipoprotein particle size obesity and the abdominal distribution of adipose tissue and low-grade inflammation [36,37,38,39,40,41]. Variants (rs174537, rs174575) of the FADS1/FADS2 genes are also associated with a higher oxidative stress level [21,37,40,42]. Some studies have found associations between FADS1/FADS2 variants (rs174546, rs174550, rs174537, rs174575, and rs174570) and insulin sensitivity, the serum glucose level, and risk of T2DM [43,44,45], while others have linked FADS1/FADS2 variants (rs1535, rs174547, rs174546, rs174537, rs174549, and rs9957425) to increased blood pressure (arterial hypertension, respectively) and obesity [46,47,48,49,50]. Associations between FADS1/FADS2 variants and complex conditions such as MetS, T2DM, and cardiovascular disease (e.g., acute coronary syndromes, CAD, and ischemic stroke) have likewise been described. An alternative/minor allele of FADS1 rs174537 was linked to T2DM in an Iranian population [44], and FADS1 rs74556 and FADS2 rs174617 have been linked with acute coronary syndromes [51]. The GG genotype of the FADS1 variant rs174537 increases the risk of developing T2DM and coronary artery disease [52]. T alleles and TT genotypes of the FADS1/FADS2 variants are associated with coronary artery disease and ischemic stroke. The minor allele of rs174547 is connected to a lower risk of ischemic stroke [28,53]. The FADS1 (rs174537) polymorphism, which is associated with an increased GG genotype frequency in Afro-Americans, is supposed to be connected to high levels of AA, leading to an increased level of low-grade inflammation and a greater risk of developing T2DM [54].
An increased concentration of ALA in adipose tissue in combination with an FADS2 SNP (rs3834458 T/-) has been implicated in the development of MetS via a decreased conversion of ALA to EPA [55]. Finally, the elevated activity of aggregate delta desaturase activity represents an independent risk factor for ischemic heart disease. Aggregate desaturase activity has been associated with risk alleles of FADS1/FADS2, which condition the proinflammatory PUFA profile in correlation with hs-CRP levels [56].
In our previous study using a cluster analysis of plasma FA patterns, we described two clusters (or phenotypes) of MetS, independent of clinical and biochemical parameters. In comparison with cluster 2 (MetS2), cluster 1 (MetS1) displayed a greater consistency and more adverse risk [9].
The aim of the present study was to analyze associations between selected polymorphisms of the FADS1-FADS2 genes (including reconstructed haplotypes) and phenotypes (or clusters) of MetS patients and controls (CON) in a Czech population.
2. Results
2.1. Clinical and Biochemical Parameters
Patients with MetS significantly differed from CON subjects in all clinical (body mass index, blood pressure, waist circumference, and fat mass) and biochemical (TC, TAG, HDL-C, apoB, glucose, CD-LDL, insulin, and HOMA-IR) parameters consistent with the MetS phenotype (Table 1).

Table 1.
Clinical and biochemical characteristics of studied groups.
Based on the cluster analysis that included six selected FA patterns obtained from a linear discriminant analysis, two clusters were found in the whole study group (CON and MetS groups together). In the MetS group, 109 patients (65.7%) were classified as cluster 1 (MetS1) and 57 patients (34.3%) were classified as cluster 2 (MetS2). Conversely, in the control group, 71 probands (37.8%) were classified as cluster 1 (CON1) and 117 subjects (62.2%) were classified as cluster 2 (CON2). These results indicated a nonrandom distribution of subjects in both groups into cluster 1 and cluster 2 (χ2 = 26.35; p < 0.001). This means that MetS was present mainly in cluster 1, while the CON probands presented mainly in cluster 2. Patients with MetS in cluster 1 (MetS1) had a more adverse metabolic profile in comparison with patients in cluster 2 (MetS2). There were no statistically significant differences between both clusters with regard to the sex ratio, age, BMI, fat mass, systolic and diastolic blood pressure, total cholesterol, HDL-C, triglycerides, or apoB concentrations. Characteristically, patients with MetS1 exhibited an increased waist circumference and HOMA-IR (both p < 0.05), as well as increased glucose (p < 0.01), NEFA (p < 0.001), and CD-LDL concentrations (p < 0.05) (Table 2).
Table 2.
Clinical and biochemical characteristics of metabolic syndrome according to cluster analysis.
After splitting the CON group according to the results of the cluster analysis, individuals in CON1 were found to have an increased body weight (by 9%; p < 0.01), BMI (by 5.5%, p < 0.05), and TAG (by 23%, p < 0.01). After the ANCOVA adjustment with body weight as the covariate, the only parameter to increase in CON1 probands compared with CON2 was the TAG level (p < 0.05). However, the median difference between CON1 and CON2 (0.3 mmol/L) proved clinically insignificant (Table 3).
Table 3.
Clinical and biochemical characteristics of the control group based on cluster analysis.
Differences in clinical and biochemical traits between MetS1 and CON1 followed a similar pattern to the differences between MetS and CON. However, after adjusting for body weight, the differences in TC and apoB levels between MetS1 and CON1 proved nonsignificant (Supplementary Table S1).
Patients in Met2, compared to CON2 individuals, had significantly changed nearly all studied traits except for TC, apoB, NEFA, and CD-LDL levels (Supplementary Table S2).
2.2. Fatty Acid Profiles in Plasma Phospholipids
The FA compositions of plasma phospholipids (PL) for MetS and CON are given in Table 4. In MetS patients, we found significantly increased concentrations of POA (p < 0.01), SA (p < 0.001), DGLA (p < 0.0001), and decreased levels of LA (p < 0.001). There was an increased sum of saturated FA (ΣSFA) (p < 0.0001) and decreased Σn-6 PUFA (p < 0.001) in MetS compared to the CON group. These changes were accompanied by increased activities of D9D and D6D (both p < 0.05) and decreased activity of D5D (p < 0.01).
Table 4.
Plasma phospholipid fatty acid composition of the analyzed groups.
A comparison of FA patterns between patients in the MetS1 and MetS2 clusters is given in Table 5. In MetS patients, we found increased concentrations of POA (p < 0.0001), OA (p < 0.0001), and vaccenic acid (VA, 18:1n:7, p < 0.01), and opposite changes in the level of LA (p < 0.0001). Moreover, MetS1 patients exhibited increased levels of precursors of proinflammatory eicosanoids, such as GLA (p < 0.05), DGLA (p < 0.05), and AA (p < 0.05). MetS1 patients also displayed statistically increased levels of n-3 PUFA, such as eicosapentaenoic acid (EPA, 20:5n-3, p < 0.0001), docosapentaenoic acid (DPA, 22:5n-3, p < 0.0001), and docosahexaenoic acid (DHA, 22:6n-3, p < 0.0001). MetS1 exhibited increases in ΣSFA, the Σ of monounsaturated (ΣMFA), and Σ n-3 PUFA (all p < 0.0001), as well as in the activities of D9D and D6D (both p < 0.0001).
Table 5.
Plasma phospholipid fatty acid composition of metabolic syndrome based on cluster analysis.
The FA compositions of CON1 and CON2 participants are given in Supplementary Table S3. Changes in FA composition were similar to those observed for the MetS1 and MetS2 clusters. Participants in CON1 had significantly increased levels of PA (p < 0.01), POA (16:1n-7, p < 0.000), SA (p < 0.01), and OA (p < 0.05), as well as higher levels of n-6 LC-PUFA (DGLA and AA, both p < 0.001) and n-3 LC-PUFA (EPA, DPA, and DHA, all p < 0.001). Similarly, levels of ΣSFA, ΣMFA, Σn-3PUFA, and Σn-6PUFA significantly increased (all p < 0.001), as did the activities of D9D and D6D (both p < 0.0001). A comparison of FA patterns and derived parameters between the MetS1 and CON1 groups is given in Supplementary Table S4. MetS1 patients only exhibited a decreased activity of D5D (p < 0.05). Differences in FA composition between MetS2 patients and CON2 probands are shown in Supplementary Table S5. Patients in MetS1 had decreased OA (p < 0.05) and VA (both p < 0.01) levels, which were associated with mild changes in ΣSFA and ΣMFA levels (both p < 0.05).
2.3. Genetic Analyses and Statistically Reconstructed Haplotypes
In our study, three FADS1 SNPs (rs174537, rs174545, and rs174546) and five FADS2 SNPs (rs174570, rs174575, rs174602, rs174589, and rs968567) were analyzed. All studied variants of the FADS1–FADS2 genes were in Hardy–Weinberg equilibrium (p > 0.05). The polymorphism FADS1 rs174537 was in the near-complete linkage disequilibrium (LD) (r2 = 0.97–0.99) with the two other FADS1 SNPs (rs174545 and rs174546) and two of the FADS2 SNPs (rs968567 and rs174570) (see Figure 1).
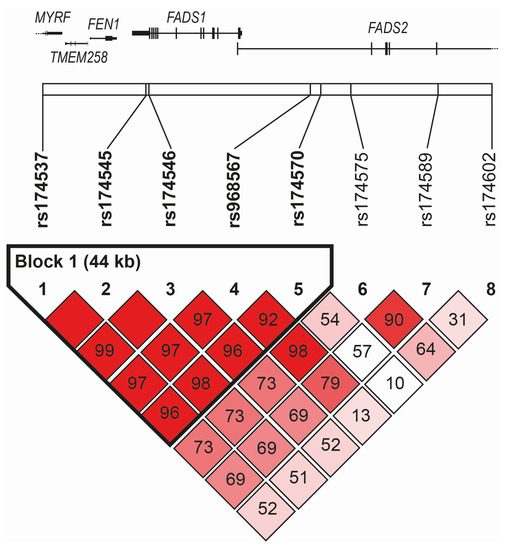
Figure 1.
Linkage disequilibrium among studied SNPs of FADS1–FADS2 region.
The linkage disequilibrium plot based on D’ spanned the genomic region of chromosome 11, including the FADS1 and FADS2 genes (chr11: 61,785,208–61,856,942, genome assembly GRCh38.p14) with the indication of the position of single-nucleotide polymorphisms genotyped in the current study. The definition of blocks was computed using the Genotype Resolution and Block Identification using Likelihood (GERBIL) algorithm implemented in the Genotype Visualization and Algorithmic Tool (GEVALT) software, version 2. Numbers indicated pair-wise D’ values, and the color-coding of boxes was based on D’/LOD: shades of pink/red for LOD > 2, D’ < 1 (bright red for D’ = 1), white for LOD < 2, D’< 1.
The frequencies of reference (major) and alternative (minor) alleles of all polymorphisms analyzed in this study were not significantly different from frequencies found in other European populations (Supplementary Table S6).
The numbers and frequencies of allele and genotype variants in the FADS1–FADS2 genes across studied groups based on the cluster analysis are given in Table 6 and Table 7. The differences in allele and genotype frequencies were not statistically significant for MetS vs. CON, CON1 vs. CON2, MetS1 vs. CON1, and MetS2 vs. CON2 in any of the analyzed variants in the FADS1/FADS2 genes.
Table 6.
Numbers and frequencies of allele and genotype variants for FADS1–FADS2 genes across studied groups.
Table 7.
Genotype and allele frequencies of studied FADS polymorphisms in MetS clusters 1 and 2.
Statistically significant differences between MetS1 and Mets2 were only found for the FADS1 variants rs174537, rs174545, and rs174546 (p = 0.0024 for both allele and genotype), FADS2 rs174570 (p = 0.014 for genotype, p = 0.009 for allele), and FADS2 rs174602 (p = 0.048 for genotype, p = 0.0248 for allele) (see Table 7).
After simultaneous block partitioning and haplotype phasing, a single haplotype block (rs174537-rs174545-rs174546-rs968567-rs174570) was revealed within the region spanned by the genotyped SNPs (Figure 1). Using five-SNP haplotypes, we modeled four haplotypes with an estimated frequency greater than 1%. The frequencies of individual haplotypes were GGGCC (66.2%) > TCATC (14.9%) > TCACT (13.0%) > TCACC (4.9%). The association of haplotypes with the individual clusters showed a significant result only when comparing MetS1 vs. MetS2 clusters, corroborating the individual SNP associations. After one million permutations, the corrected p-values obtained were 0.0002 and 0.0027 for the GGGCC and TCACT haplotypes, respectively.
3. Discussion
The development of MetS, such as other cardiometabolic diseases, is influenced both by lifestyle and genetic factors. An increased energy intake, particularly saturated fat along with an imbalance in the type of dietary fat consumed, results in obesity, insulin resistance, and ectopic fat accumulation. These states are characterized by decreased concentrations of LC-PUFA in body tissues. The individual components of MetS are variably influenced by SFA, monounsaturated FA (MFA), and LC-PUFA of the n-3 and n-6 series. These fatty acids are understood to have effects on plasma lipids/lipoproteins, blood pressure, and insulin secretion, as well as on low-grade inflammation and oxidative stress [13,14,16,26]. LC-PUFAs play an important protective role by controlling the synthesis and oxidation of SFA and MFA, decreasing the hepatic fat content and improving blood lipid profiles associated with cardiovascular risk [17,57].
The availability of LC-PUFA in body tissues depends on the dietary intake as well as on endogenous factors influencing the FA metabolism. Recently, attention has been focused on fatty acid desaturases and elongases. FADS1 and FADS2 encode the enzymes D5D and D6D, respectively [14,18,58]. These are the key enzymes in the conversion of n-6 and n-3 PUFA to their longer and more unsaturated products.
Activities of D5D and D6D depend on the genetic background and on other factors, especially nutritional, hormonal, and environmental. The expression of D5D is increased by insulin and inhibited by a fat-free diet, exogenous cholesterol, trans-MFA, n-3 PUFA, glucagon, adrenalin, and glucocorticoids. The expression of D6D increases the deficiency of essential FA (EFA) (e.g., LA and ALA), Zn, Mg, and pyridoxine. The Inhibition of D6D is associated with fasting, ethanol, dietary SFA, cholesterol, PUFA (of both n-3 and n-6 series), glucagon, glucocorticoids, and thyroxine [59].
FADS1 and FADS2 polymorphisms are considered the most important factors contributing to variability in LC-PUFA levels in plasma phospholipid and erythrocyte membranes. A variation in FA concentrations attributable to the SNPs of FADS1/FADS2 genes amounts to 28% for AA and 10% for precursor FAs [16]. According to data on erythrocyte FA from the Framingham Offspring Study, a strong association has been shown between the FADS and ELOVL regions. SNPs in these regions accounted for a 8–14% variation in three FAs (AA, LA, and OA) and a 1–4% variation in another four FAs (ALA, DTA, GLA, and DPA). Polymorphisms of FADS and ELOVL revealed a 53% variance in DGLA levels [60].
In our study, we performed a cluster analysis that included six selected FAs (DGLA (20:3n-6), SA (18:0), myristic acid (MA, 14:0), DHA (22:6n-3), DPA (22:5n-3), and LA (18:2n-6)), revealing two clusters each in the CON and MetS groups. In the MetS group, 65.7% of patients were classified as phenotype/cluster 1 (MetS1) and 34.3% of patients were classified as MetS2. In the CON group, 37.8% of probands were classified as cluster 1 (CON1) and 62.2% of subjects were classified as CON2. These results indicated a nonrandom distribution of subjects in both groups into cluster 1 and cluster 2 in both groups, supporting the premise that two genotypes/clusters of MetS exist that are independent of clinical and laboratory parameters [9]. To our knowledge, this is the first phenotyping of MetS based on a cluster analysis of plasma FAs.
Two of these six FAs, namely, MA and SA, could be interpreted as surrogate markers of dietary SFA intake [59,61]. The remaining four FAs are important substrates, intermediates, and products of the LC-PUFA metabolism [21,58]. POA, OA, and VA levels, as well as the activities of D9D (SCD1, respectively) are supposed to be surrogate markers of de novo lipogenesis [62,63,64].
As expected, patients in the MetS1 cluster exhibited an increased waist circumference, a surrogate marker of abdominal obesity, and increased HOMA-IR. They also had increased plasma concentrations of NEFA and CD-LDL. In comparison with MetS2, MetS1 displayed a more adverse risk profile caused by a higher insulin resistance and an increased level of oxidative stress.
In comparison with CON2, patients in the CON1 cluster had a significantly increased body weight, waist circumference, and plasma TAG. After the ANCOVA adjustment with body weight as the covariate, the only parameter that remained significantly increased was the TAG level. The median difference between CON1 and CON2 (0.3 mmol/L) was clinically insignificant. Abdominal obesity is one of the major metabolic stressors leading to increased TAG levels. The persistence of elevated TAG levels after adjusting for body weight implicated the association of non-FADS genetic factors in the pathogenesis of mild hypertriglyceridemia. The elevation of TAG may be caused by the polygenic contribution of multiple risk alleles in genes that influence both VLDL production and removal [65]. Additionally, heterozygous carriers of the gene mutations that in a homozygous constitution cause chylomicronemia (e.g., LPL, APOC2, APOA5, LMF1, GPIHBP1, and GPD1) commonly display only moderately elevated serum TAG levels [29,66].
Our findings of higher HOMA-IR values and increased plasma concentrations of NEFA and CD-LDL in MetS concurred with our previous study and with the studies of other authors. A higher severity of MetS (as expressed by the number of MetS components) is associated with increased levels of plasma CD-LDL [67]. One study found that subjects with MetS had lower activities of plasma catalase and paraoxonase 1 [8]. Both CD-LDL and ox-LDL reflect systemic oxidative stress. CD-LDL is an indicator of minimally oxidized LDL (containing only oxidatively modified lipids), whereas ox-LDL contains both oxidatively modified lipids and proteins [68,69].
Abdominal obesity, insulin resistance, and T2DM risk are strongly associated with variants of the FADS gene cluster [70]. For instance, the gene–diet interaction was proved in the METSIM study. Carriers of the minor allele genotype (CC) for rs174550 (FADS1) had a lower plasma glucose concentration after LA consumption [21]. Moreover, an association between FADS genetic variants and disturbed glucose metabolism has been reported [71]. The rs174537 FADS1 polymorphism, which is characterized by a “high-converting” GG genotype (being more frequent in African Americans), is supposed to be connected with high levels of AA and, thus, with a higher level of low-grade inflammation and with an increased risk of T2DM [54]. Finally, elevated aggregated delta desaturase activity represents an independent risk factor for CAD. Aggregated desaturase activity (AA/LA ratio) has been linked to risk alleles of FADS1/FADS2, which condition a proinflammatory PUFA profile and are correlated with hs-CRP levels [56]. In a large Italian population sample of obese children, a common variant in the gene FADS1 (rs1535) has been associated with BMI [48]. SNPs of FADS2 (rs174593, rs174616, and rs175576) have been documented to play a role in the interaction of polyphenols with PUFA levels and parameters of obesity [72], while lower levels of TC, LDL-C, and HDL-C have been associated with the minor allele of FADS1 rs174547 [73]. Regarding the incidence of DM2T, one study found a positive association between D6D activity and FADS1 rs174550, but, on the other hand, a clear inverse relation between the same SNP and D5D activity [43].
When comparing FA composition between the MetS and CON groups in our study, we found that MetS displayed increased levels of POA (16:1n-7), DGLA (20:3n-6), ∑SFA, and decreased levels of LA (18:2n-6) as well as ∑ n-6 PUFA. In comparison with MetS2, MetS1 showed an increased content of OA (18:1n-9), VA (18:1n-7), GLA (18:3n-6), AA (20:4n-6), EPA (20:5n-3), DPA (22:5n-3), ∑MFA, and ∑ n-3 PUFA, together with decreased levels of ∑ n-6 PUFA. MetS (compared to CON) and MetS1 (compared to MetS2) exhibited increased D6D and D9D (for PA) activities. In comparison with CON, MetS exhibited decreased activity of D5D. Our most distinct findings with regard to MetS were increased markers of D9D (SCD1) and D6D (FADS2) activities and decreased levels of LA. We observed a decrease in D5D (FADS1) only when comparing MetS and CON. The increased values of POA, D9D, and D6D we document here corresponded with previous findings by other authors [10,12,74]. A decrease in LA levels can be caused by several factors, including decreased dietary intake, increased peroxidation and β-oxidation, and a higher conversion of LA to proinflammatory eicosanoids [59].
The main result of our study was the statistically significant genotype associations of FADS1 SNPs (rs174537, rs174545, and rs174546; all p < 0.01), FADS2 SNPs (rs174570 and 174602, both p < 0.05), and two inferred haplotypes (GGGCC (p < 0.01) and TCACT (p < 0.05)) with the splitting of MetS into two phenotypes (MetS1 and MetS2). Additionally, the rs174537 polymorphism was in the near complete LD (r2 = 0.97–0.99) with the other two FADS1 SNPs, rs174545 and rs174546, and with two of the FADS2 SNPs, rs968567 and rs174570.
Our observation of a linkage disequilibrium block encompassing the FADS1 gene and the adjacent part of the FADS2 gene corresponded to previous findings by several European population studies investigating the extent LD blocks and associates with distinct FA profiles [17,23,25]. While rs174537 actually lies in the intron of the myelin regulatory factor gene with no reported function related to MetS features, the associations reported in this and previous studies (98 significant rs174537 associations are listed in the NHGRI-EBI catalog of human genome-wide association studies [75]) most likely reflect the near-complete linkage disequilibrium with other FADS1 variants.
In comparison with MetS2, the MetS1 cluster/phenotype was characterized by a higher proportion of major alleles and genotypes of a homozygous constitution across all FADS1 and FADS2 SNPs significantly associated with the splitting of MetS into two phenotypes.
In comparison with MetS2, MetS1 exhibited increased D6D (FADS2) activity and aggregate desaturase activity (results are not given). We observed no significant differences in D5D (FADS1) between the two MetS phenotypes.
A cross-sectional Chinese study found a significant association between FADS1 rs174547 (and a high LD linkage disequilibrium with rs174546 and rs174537) and MetS and its components. Carriers of the major allele and the TT genotype had a larger waist circumference (a surrogate marker of abdominal obesity), increased plasma glucose, higher blood pressure, and lower HDL-C [34]. Another Chinese study found that plasma FAs, delta desaturase activities, and FADS1 rs174537 were associated with T2DM and CAD. The GG genotype of rs174537 led to an unfavorable FA status that is connected with T2DM and CAD [52]. Another study found that that minor alleles (T) of FADS1 SNPs rs174537 and rs174546 were associated with lower plasma PA and AA levels in obese adolescents [49].
A Korean case–control study found that the minor allele (T) of FADS1 rs174537 was associated with a lower risk of CAD that resulted from lower levels of plasma total cholesterol, LDL-C, a higher LDL particle size that was linked with oxidative stress markers (malondialdehyde, MDA; oxidatively modified LDL, ox-LDL, and urinary 8-epi-prostaglandin F2α (8-epi-PGF2α)). The proportion of AA (20:4n-6) correlated with LDL-C, ox-LDL, MDA, and with urinary 8-epi-PGF2α. In controls, the G allele and the GG genotype were associated with opposite changes [37].
It has been proven that the G allele and the GG genotype of FADS1 rs174537 are more prevalent among African Americans than among European Americans. This SNP is also associated with increased levels of AA, increased D5D (AA/DGLA ratio) and urinary concentrations of isoprostane F2 (F2-isoP) and F3-isoP; all markers of oxidative stress. African Americans are understood to be more effective converters of LA to AA [40,54]. In an Iranian study, minor alleles of FADS1 rs174537 correlated with lower levels of LDL-C and a higher risk of T2DM [44]. FADS1 (rs174545 and rs174546) and FADS2 (rs174575) SNPs were connected with plasma lipids. Carriers of minor alleles had a lower plasma TC and LDL-C, whereas carriers of heterozygous alleles displayed higher TAG and lower HDL-C levels [31].
Minor alleles of various FADS1 (rs174545, rs174546, rs174548, and rs174553) and FADS2 (rs1535 and rs174583) genes have been associated with an increased risk of obesity in women with a lower BMI (less than 25.0 kg·m−2) [50]. While FADS2 rs17457 minor allele carriers had a higher HOMA-IR index (connected with a higher level of DGLA), FADS1 rs174546 predicted a lower risk of T2DM [27].
One study found lower levels of EPA and DPA in erythrocytes along with a decreased total n-3 FA in postmenopausal women. Female carriers of at least one minor allele of FADS1 (rs174546) and FADS2 (rs3834458) were associated with an unfavorable FA status contributing to MetS [12]. FADS1 (rs174546) and FADS2 (rs174601) were linked to CAD and ischemic stroke. Further, the T allele and the TT genotype were associated with these clinical conditions as well as with decreased apoA-I and HDL-C levels [28]. In a study involving individuals of Caucasian and Asian descent, minor alleles and genotypes of both FADS1 (rs174546) and FADS2 (rs174576) SNPs were connected with lower aggregate desaturase activity.
Finally, the minor allele of FADS1 (rs174570) has been associated with decreased FADS1 and FADS2 expression levels, resulting from an epigenetic gene regulation (methylation) through CpG sites in FADS1 and FADS2 [76].
A limitation of this study was the relatively small number of participants and a cross-sectional design of the study. Another limitation of the current study was (from an analytical point of view) the absence of analyzed trans-FAs in plasma samples, the determination of the FA profiles as a relative percentage of the total esterified FAs of the plasma phospholipids, and, finally, the absence of simultaneously measured low-grade inflammation. Trans-FAs are supposed to have an important impact on the biochemical and clinical parameters of MetS [77]. The study utilized computational haplotype phasing as unrelated individuals were genotyped. Although based on a validated algorithm, which was shown to perform with high accuracy, it still represents a method of biostatistical inference with an inherent, though subtle, potential for errors. In humans, the biosynthesis of LC-PUFA requires delta-5 desaturase (D5D), D6D, and elongase 2 activities, which are encoded by the genes for FADS1, FADS2, and the elongation of very-long-chain fatty acids like 2 (ELOVL2). Neither elongase 2 activities nor genetic variants of ELOVL2 were examined in the study.
The strength of this study was that the groups of participants were relatively homogenous. Patients with MetS were not treated either with lipid-lowering drugs, supplements containing n-3 PUFA/n-6 PUFA, or antioxidants. The implementation of a cluster analysis seems to be a novel approach. To date, the phenotyping of MetS based on a cluster analysis of FAs has not yet been carried out. We used the clustering approach to classify novel phenotypes of MetS. Our findings identified two distinct phenotypes of MetS through a cluster analysis according to plasma phospholipid FA composition. The current study represents a continuation of our previous studies/reports and contributes to the study of genetic factors, specifically FADS variants, to the fatty acid metabolism and pathogenesis of MetS phenotypes. Moreover, to our best knowledge, this was the first study to deal with several FADS variants in patients with MetS.
4. Materials and Methods
4.1. Patients
The sampling procedures used in this study were previously described in detail [9]. For the purpose of this paper, the study group remained unchanged. In brief, 354 subjects were enrolled as part of the study group, consisting of 188 (101 M/87F) controls (CON) and 166 MetS patients (98M/68F). MetS was diagnosed according to the International Diabetes Federation criteria [78]. The control group comprised 42 subjects (22M/20 F) without MetS components (MetSC) that were recruited from employees of the General University Hospital, as well as 146 probands (79M/67F) with at least one MetSC who failed to fulfil the diagnostic criteria for MetS. Of these, 69 probands had only one MetSC and 77 probands had two MetSCs.
Exclusion criteria for both groups were as follows: current antioxidant, lipid-lowering, and/or antidiabetic medication; excessive alcohol consumption (>30 g/day), hormonal replacement therapy, supplementation with polyunsaturated fatty acids (both of the n-3 and n-6 families), manifestation of cardiovascular and/or cerebrovascular diseases, type 1 diabetes mellitus, liver (except nonalcoholic fatty liver disease) and/or kidney diseases (creatinine >130 μmol/L), microalbuminuria (urinary albumin 30–300 mg/day), hypothyroidism, as well as recent serious infections and/or operations (both within the last six months), and malignancies.
Nutritional intake of the main dietary components, based on a standard 7-day dietary questionnaire, was assessed in all study subjects. Nutritional data were reappraised using the Nutrimaster SE software, Version 2.0 (2014).
Basal clinical and anthropometrical data, including body fat assessment, were examined using standard methods, as described previously [67]. The study was performed in adherence with the principles of the Declaration of Helsinki and approved by the Ethical Committee of the General University Hospital, Prague.
4.2. Laboratory Measurements
Total cholesterol (TC) in serum was analyzed using a commercially purchased enzymatic colorimetric test (CHOD-PAP) (BIO-LA-TEST Cholesterol 2500 kit; Pliva-Lachema, Czech Republic). Serum triacylglycerols (TAGs) were measured using a standard enzymatic colorimetric kit (GPO-PAP) (Pliva-Lachema). High-density lipoprotein cholesterol (HDL-C) concentration was measured in the supernatant of serum samples after selective precipitation of LDL-C using the BIO-LA-TEST HDL-Cholesterol kit (Pliva-Lachema) on a Cobas Mira analyzer (Roche, Switzerland).
To measure conjugated diene concentrations in precipitated LDL, a modified spectrophotometric method was used [68]. Levels of nonesterified fatty acids (NEFAs) were determined using an enzymatic colorimetric method (Randox Laboratories, UK). Apolipoprotein B concentration was analyzed nephelometrically using a standard kit (Beckman Coulter) on an image analyzer. Concentrations of insulin were measured using diagnostic sets and a modular analyzer (Roche Diagnostics, Indianapolis, IN, USA) by electrochemiluminescence (ECLIA).
Fatty acid patterns of the main plasma lipid classes were examined using analytical procedures described previously [79]. The homeostasis model assessment method, HOMA-IR, was used as an index of insulin resistance [80]. Desaturase activities were estimated using FA product/precursor ratios [58,67].
4.3. Clustering
Based on cluster analysis fatty acid (FA) patterns in plasma phospholipids independent of clinical and laboratory measures, all subjects were divided into two clusters (or phenotypes). As discussed in Section 2.1 in more detail, MetS was present mainly in cluster 1, while the CON probands were present mainly in cluster 2. In total, the whole study group was divided into four subgroups/clusters: MetS1 (n = 109), MetS2 (n = 57), CON1 (n = 71), and CON2 (n = 117).
Cluster analysis was performed in two steps. In the first step, the number of individual FAs in plasma phospholipids was reduced; in the second step, subjects were grouped into clusters. The number of individual FAs was reduced using linear discriminant analysis with stepwise forward variable selection based on Wilk’s lambda criterion. We used 22 of the initially analyzed FAs for all the probands to separate CON and MetS groups using linear discriminant analysis. This resulted in an overall 69.8% correct classification. The following variables subjected into the linear discriminant analysis were DHGLA (20:3n-6; F = 30.41), SA (18:0; F = 24.2), MA (14:0; F = 21.55), DHA (22:6n-3; F = 17.66), DPA (22:5n-3; F = 14.92), and LA (18:2n-6, F = 13.19) acids. These six individual fatty acids were included in the cluster analysis. On the selected six fatty acids, an agglomerative hierarchical clustering was applied using Ward’s minimum variance method with Euclidean measure [81]. This type of clustering minimizes the total within-cluster variance. Thus, the obtained clusters identified the groups of subjects with similar values of FAs selected with the discriminant analysis in the previous step.
4.4. Genetic Analyses
Genetic analyses were performed only in 330 subjects of the primary group (93.2%) of patients. The reasons for the reduction in the number of individuals analyzed were due to technical problems (lost or damaged blood samples in 8 cases) and disclaimers regarding informed consent for the genetic analysis (in 16 cases). The genetic analysis was performed in 180 subjects (96M/4F) from the CON group and 150 patients (83M/67F) from the MetS group.
Single-nucleotide nucleotide polymorphisms (SNPs) of two genes—fatty acid desaturase 1 (FADS1) and fatty acid desaturase 2 (FADS2) were analyzed in 330 participants. The numbers and sexes of the participants that took part in the genetic analyses across the various groups and clusters are given in the Supplementary Table S1. The three FADS1 SNPs (rs174537 (extragenic), rs174545 (3′-UTR), and rs174546 (3′-UTR)) and five FADS2 SNPs (rs174570, rs174575, rs174602, rs174589, and rs968567—all intronic) were selected for genotyping based on the following parameters: (i) their frequencies in the European Caucasian population [82], (ii) their established and implicated functional effects, as documented by previous genetic studies [14,16,22,36,37,38,52,83,84], and (iii) their positions along the FADS1/FADS2 gene cluster [24]. All of the SNPs selected had a minor allele frequency (MAF) of > 0.1.
DNA isolation was performed according to standard desalting procedures [85]. The DNA concentration and purity were assessed (Nanodrop ND 1000, Thermo Scientific, Wilmington, DE, USA) as prerequisite parameters for subsequent methods. Polymerase chain reaction (PCR) conditions, forward and reverse primers, annealing temperatures, and restriction endonucleases are given in Table 8. Restriction products were directly separated by electrophoresis in 3% agarose gel and visualized in UV light after ethidium bromide staining. Fragment sizes were assessed using the NebCutter V2.0 program (http://tools.neb.com/NEBcutter2 (accessed on 15 May 2018)). For primer design, the Primer3 Input web application was used (http://tools.neb.com/NEBcutter2 (accessed on 15 May 2018)). Forward and reverse primers were further used for cycle sequencing to verify the results of the PCR restriction fragment length polymorphism (PCR-RFLP) method. In cases where the respective endonuclease or restrictive site was not found, direct DNA sequencing was employed [86]. Sequencing was performed using an automated DNA capillary sequencer (Model SEQ 8000, supplied by Beckman Coulter, Prague, Czech Republic).
Table 8.
Analytical conditions for detection of polymorphisms in the FADS1 and FADS2 genes.
The unphased genotype data of the whole cohort were entered into the Genotype Visualization and Algorithmic Tool (GEVALT) software, Version 2 [87]. Phasing, linkage disequilibrium analysis, and estimation of the haplotype block structure were determined using the Genotype Resolution and Block Identification using Likelihood (GERBIL) algorithm [88]. Multimarker haplotype associations were performed using the χ2-test implemented in the Haploview 4.2 software [89]. Multiple testing corrections were performed based on 1,000,000 permutations.
4.5. Statistical Analysis
The statistical analysis was performed using the R statistical software Version 4.1.3 [90], or with the STATISTICA® software for Windows.
Categorical data were summarized using absolute and relative frequencies. Continuous data were expressed as mean and standard deviation or median and interquartile range (IQR, 25th–75th percentile) in cases of non-Gaussian distribution of data. The normality of the distribution was tested using the Shapiro–Wilks W test. Comparisons between the groups were determined using the independent t-test and the Wilcoxon test, respectively. p-values for both continuous and categorical data were adjusted for multiple comparisons using the Benjamini–Hochberg correction. Genotype distributions were tested for the Hardy–Weinberg equilibrium (HWE) (with d.f. = N-2). Pearson’s χ2-test was employed to test the differences in the distribution of genotype frequencies in both groups (Yates’ correction for small numbers in 2 × 2 tables). Statistical significance was defined as p < 0.05.
5. Conclusions
In summary, the current study demonstrated significant associations between a number of FADS1, FADS2 polymorphisms, and two MetS phenotypes identified by a cluster analysis of plasma FA profiles. The first phenotype had a more harmful clinical and metabolic profile (increased waist circumference, increase insulin resistance and oxidative stress) than the second phenotype. The FADS1 (rs174537, rs174545, and rs174546) and FADS2 (174570 and 174602) polymorphisms, along with the two inferred haplotypes (GGGCC; TCACT) described in this study, were found to be implicated in the heterogeneity of MetS.
The findings of this study could contribute (from a gnoseological point of view) to the knowledge of the regulation of FA metabolism and the pathogenesis of MetS; from a clinical point of view, it could be a contribution to the personalized management of MetS.
The subjects carrying reference alleles of FADS1 (FADS2, respectively) having a higher conversion capacity towards PUFA n-6 products might benefit from PUFA n-3 supplementation (or intervention).
Supplementary Materials
The following are available online at https://www.mdpi.com/article/10.3390/metabo12060568/s1, Table S1: clinical and biochemical characteristics of participants in MetS1 and CON1 groups, Table S2: clinical and biochemical characteristics of participants in MetS2 and CON2 groups, Table S3: plasma phospholipid fatty acid composition of control groups based on cluster analysis, Table S4: plasma phospholipids fatty acid composition of cluster 1 in metabolic syndrome and control groups, Table S5: plasma phospholipids fatty acid composition of cluster 2 in metabolic syndrome and control groups, Table S6: reference and alternative allele frequencies according to NCBI Allele Frequency Aggregator (ALFA) Release 2.
Author Contributions
Conceptualization, A.Ž. and M.V.; methodology, M.V., M.B., M.J., O.Š. and B.S.; writing—original draft preparation, M.V., A.S. and A.Ž.; writing—review and editing, M.V., M.Z., A.S. and A.Ž.; supervision, M.V. and A.Ž.; project administration, M.V.; funding acquisition, A.Ž. All authors have read and agreed to the published version of the manuscript.
Funding
This research was funded by the Ministry of Health of the Czech Republic, grant number MH CZ DRO-VFN64165, and the Charles University Research program, Cooperatio—Gastroenterology.
Institutional Review Board Statement
This study was conducted according to the guidelines of the Declaration of Helsinki and approved by the Ethics Committee of the General University Hospital in Prague (decision no. 3311/2011).
Informed Consent Statement
Informed consent was obtained from all subjects involved in the study.
Data Availability Statement
All the data supporting the findings of this study are included in this article and the Supplementary Materials.
Conflicts of Interest
The authors declare no conflict of interest.
References
- Dizaji, B.F. The investigations of genetic determinants of the metabolic syndrome. Diabetes Metab. Syndr. 2018, 12, 783–789. [Google Scholar] [CrossRef] [PubMed]
- Zafar, U.; Khaliq, S.; Ahmad, H.U.; Manzoor, S.; Lone, K.P. Metabolic syndrome: An update on diagnostic criteria, pathogenesis, and genetic links. Hormones 2018, 17, 299–313. [Google Scholar] [CrossRef] [PubMed]
- Fahed, G.; Aoun, L.; Bou Zerdan, M.; Allam, S.; Bou Zerdan, M.; Bouferraa, Y.; Assi, H.I. Metabolic Syndrome: Updates on Pathophysiology and Management in 2021. Int. J. Mol. Sci. 2022, 23, 786. [Google Scholar] [CrossRef] [PubMed]
- Stančáková, A.; Laakso, M. Genetics of metabolic syndrome. Rev. Endocr. Metab. Disord. 2014, 15, 243–252. [Google Scholar] [CrossRef] [PubMed]
- Brown, A.E.; Walker, M. Genetics of Insulin Resistance and the Metabolic Syndrome. Curr. Cardiol. Rep. 2016, 18, 75. [Google Scholar] [CrossRef] [PubMed]
- Panda, C.; Varadharaj, S.; Voruganti, V.S. PUFA, genotypes and risk for cardiovascular disease. Prostaglandins Leukot. Essent. Fat. Acids 2022, 176, 102377. [Google Scholar] [CrossRef]
- Das, U.N. Metabolic Syndrome Pathophysiology: The Role of Essential Fatty Acids, 1st ed.; Wiley-Blackwell: Ames, IA, USA, 2010; 268p. [Google Scholar]
- Vávrová, L.; Kodydková, J.; Zeman, M.; Dušejovská, M.; Macášek, J.; Staňková, B.; Tvrzická, E.; Žák, A. Altered Activities of Antioxidant Enzymes in Patients with Metabolic Syndrome. Obes. Facts 2013, 6, 39–47. [Google Scholar] [CrossRef]
- Žák, A.; Burda, M.; Vecka, M.; Zeman, M.; Tvrzická, E.; Staňková, B. Fatty Acid Composition Indicates Two Types of Metabolic Syndrome Independent of Clinical and Laboratory Parameters. Phys. Res. 2014, 63, S375–S385. [Google Scholar] [CrossRef]
- Mayneris-Perxachs, J.; Guerendiain, M.; Castellote, A.I.; Estruch, R.; Covas, M.I.; Fitó, M.; Salas-Salvadó, J.; Martínez-González, M.A.; Aros, F.; Lamuela-Raventós, R.M.; et al. Plasma fatty acid composition, estimated desaturase activities, and their relation with the metabolic syndrome in a population at high risk of cardiovascular disease. Clin. Nutr. 2014, 33, 90–97. [Google Scholar] [CrossRef]
- Zeman, M.; Vecka, M.; Burda, M.; Tvrzická, E.; Staňková, B.; Macášek, J.; Žák, A. Phosphatidylcholine Determines Body Fat Parameters in Subjects with Metabolic Syndrome-Related Traits. Metabol. Syndrome Rel. Disord. 2017, 15, 371–378. [Google Scholar] [CrossRef]
- Muzsik, A.; Jeleń, H.H.; Chmurzynska, A. Metabolic syndrome in postmenopausal women is associated with lower erythrocyte PUFA/MUFA and n-3/n-6 ratio: A case-control study. Prostaglandins Leukot. Essent. Fatty Acids 2020, 159, 102155. [Google Scholar] [CrossRef] [PubMed]
- Lattka, E.; Illig, T.; Koletzko, B.; Heinrich, J. Genetic variants of the FADS1 FADS2 gene cluster as related to essential fatty acid metabolism. Curr. Opin. Lipidol. 2010, 21, 64–69. [Google Scholar] [CrossRef] [PubMed]
- Merino, D.M.; Johnston, H.; Clarke, S.; Roke, K.; Nielsen, D.; Badawi, A.; El-Sohemy, A.; Ma, D.W.; Mutch, D.M. Polymorphisms in FADS1 and FADS2 alter desaturase activity in young Caucasian and Asian adults. Mol. Genet. Metab. 2011, 103, 171–178. [Google Scholar] [CrossRef] [PubMed]
- Lattka, E.; Illig, T.; Heinrich, J.; Koletzko, B. FADS Gene Cluster Polymorphisms: Important Modulators of Fatty Acid Levels and Their Impact on Atopic Diseases. J. Nutrigenet. Nutr. 2009, 2, 119–128. [Google Scholar] [CrossRef] [PubMed]
- Glaser, C.; Heinrich, J.; Koletzko, B. Role of FADS1 and FADS2 polymorphisms in polyunsaturated fatty acid metabolism. Metabolism 2010, 59, 993–999. [Google Scholar] [CrossRef]
- Reynolds, L.M.; Dutta, R.; Seeds, M.C.; Kirsten, N.; Lake, K.N.; Hallmark, B.; Mathias, R.A.; Timothy, D.; Howard, T.D.; Chilton, F.C. FADS genetic and metabolomic analyses identify the Δ5 desaturase (FADS1) step as a critical control point in the formation of biologically important lipids. Sci. Rep. 2020, 10, 15873. [Google Scholar] [CrossRef]
- Lankinen, M.; Uusitupa, M.; Schwab, U. Genes and Dietary Fatty Acids in Regulation of Fatty Acid Composition of Plasma and Erythrocyte Membranes. Nutrients 2018, 10, 1785. [Google Scholar] [CrossRef]
- Nakamura, M.T.; Nara, T.Y. Structure, function, and dietary regulation of delta6, delta5, and delta9 desaturases. Annu. Rev. Nutr. 2004, 24, 345–376. [Google Scholar] [CrossRef]
- Lee, J.M.; Lee, H.; Kang, S.; Park, W.J. Fatty Acid Desaturases, Polyunsaturated Fatty Acid Regulation, and Biotechnological Advances. Nutrients 2016, 8, 23. [Google Scholar] [CrossRef]
- Lankinen, M.A.; Fauland, A.; Shimizu, B.-I.; Agren, J.; Wheelock, C.E.; Laakso, M.; Schwab, U.; Pihlajamaki, J. Inflammatory response to dietary linoleic acid depends on FADS1 genotype. Am. J. Clin. Nutr. 2019, 109, 165–175. [Google Scholar] [CrossRef]
- Bokor, S.; Dumont, J.; Spinneker, A.; Gonzalez-Gross, M.; Nova, E.; Widhalm, W.; Moschonis, G.; Stehle, P.; Amouyel, P.; De Henauw, S.; et al. Single nucleotide polymorphisms in the FADS gene cluster are associated with delta-5 and delta-6 desaturase activities estimated by serum fatty acid ratios. J. Lipid Res. 2010, 51, 2325–2333. [Google Scholar] [CrossRef] [PubMed]
- Ameur, A.; Enroth, S.; Johansson, A.; Zaboli, G.; Igl, W.; Johansson, A.C.; Rivas, M.A.; Daly, M.J.; Schmitz, G.; Hicks, A.A.; et al. Genetic adaptation of fatty-acid metabolism: A human-specific haplotype increasing the biosynthesis of long-chain omega-3 and omega-6 fatty acids. Am. J. Hum. Genet. 2012, 90, 809–820. [Google Scholar] [CrossRef] [PubMed]
- Malerba, G.; Schaeffer, L.; Xumerle, L.; Klopp, N.; Trabetti, E.; Biscuola, M.; Cavallari, U.; Galavotti, R.; Martinelli, N.; Guarini, P.; et al. SNPs of the FADS gene cluster are associated with polyunsaturated fatty acids in a cohort of patients with cardiovascular disease. Lipids 2008, 43, 289–299. [Google Scholar] [CrossRef]
- Schaeffer, L.; Gohlke, H.; Müller, M.; Heid, I.M.; Palmer, L.J.; Kompauer, I.; Demmelmair, H.; Illig, T.; Koletzko, B.; Heinrich, J. Common genetic variants of the FADS1 FADS2 gene cluster and their reconstructed haplotypes are associated with the fatty acid composition in phospholipids. Hum. Mol. Genet. 2006, 15, 1745–1756. [Google Scholar] [CrossRef] [PubMed]
- Czumaj, A.; Sledzinski, T. Biological Role of Unsaturated Fatty Acid Desaturases in Health and Disease. Nutrients 2020, 12, 356. [Google Scholar] [CrossRef]
- Brayner, B.; Kaur, G.; Keske, M.A.; Livingstone, K.M. FADS Polymorphism, Omega-3 Fatty Acids and Diabetes Risk: A Systematic Review. Nutrients 2018, 10, 758. [Google Scholar] [CrossRef] [PubMed]
- Yang, Q.; Yin, R.X.; Cao, X.L.; Wu, D.F.; Chen, W.X.; Zhou, Y.J. Association of two polymorphisms in the FADS1/FADS2 gene cluster and the risk of coronary artery disease and ischemic stroke. Int. J. Clin. Exp. Pathol. 2015, 8, 7318–7331. [Google Scholar]
- Kathiresan, S.; Willer, C.J.; Peloso, G.M.; Demissie, S.; Musunuru, K.; Schadt, E.E.; Kaplan, L.; Bennett, D.; Li, Y.; Tanaka, T.; et al. Common variants at 30 loci contribute to polygenic dyslipidemia. Nat. Genet. 2009, 41, 56–65. [Google Scholar] [CrossRef]
- Nakayama, K.; Bayasgalan, T.; Tazoe, F.; Yanagisawa, Y.; Gotoh, T.; Yamanaka, K.; Ogawa, A.; Munkhtulga, L.; Chimedregze, U.; Kagawa, Y.; et al. A single nucleotide polymorphism in the FADS1/FADS2 gene is associated with plasma lipid profiles in two genetically similar Asian ethnic groups with distinctive differences in lifestyle. Hum. Genet. 2010, 127, 685–690. [Google Scholar] [CrossRef]
- Standl, M.; Lattka, E.; Stach, B.; Koletzko, S.; Bauer, C.-P.; von Berg, A.; Berdel, D.; Krämer, U.; Schaaf, B.; Röder, S.; et al. FADS1 FADS2 Gene Cluster, PUFA Intake and Blood Lipids in Children: Results from the GINIplus and LISAplus Studies. PLoS ONE 2012, 7, e37780. [Google Scholar] [CrossRef]
- Park, S.; Kim, D.S.; Kang, S. Carrying minor allele of FADS1 and haplotype of FADS1 and FADS2 increased the risk of metabolic syndrome and moderate but not low fat diets lowered the risk in two Korean cohorts. Eur. J. Nutr. 2019, 58, 831–842. [Google Scholar] [CrossRef] [PubMed]
- Marklund, M.; Morris, A.P.; Mahajan, A.; Ingelsson, E.; Lindgren, C.M.; Lind, L.; Risérus, U. Genome-Wide Association Studies of Estimated Fatty Acid Desaturase Activity in Serum and Adipose Tissue in Elderly Individuals: Associations with Insulin Sensitivity. Nutrients 2018, 10, 1791. [Google Scholar] [CrossRef] [PubMed]
- Ching, Y.K.; Chin, Y.S.; Appukutty, M.; Ramanchadran, V.; Yu, C.Y.; Ang, G.Y.; Gan, W.Y.; Chan, Y.M.; Teh, L.K.; Salleh, M.Z. Interaction of Dietary Linoleic Acid and α-Linolenic Acids with rs174547 in FADS1 Gene on Metabolic Syndrome Components among Vegetarians. Nutrients 2019, 11, 1686. [Google Scholar] [CrossRef]
- Shetty, S.S.; Kumari, N.S. Fatty acid desaturase 2 (FADS 2) rs174575 (C/G) polymorphism, circulating lipid levels and susceptibility to type-2 diabetes mellitus. Sci. Rep. 2021, 11, 13151. [Google Scholar] [CrossRef] [PubMed]
- Stančáková, A.; Paananen, J.; Soininen, P.; Kangas, A.J.; Bonnycastle, L.L.; Morken, M.A.; Collins, F.S.; Jackson, A.U.; Boehnke, M.L.; Kuusisto, J.; et al. Effects of 34 risk loci for type 2 diabetes or hyperglycemia on lipoprotein subclasses and their composition in 6,580 nondiabetic Finish men. Diabetes 2011, 60, 1608–1616. [Google Scholar] [CrossRef] [PubMed][Green Version]
- Kwak, J.H.; Paik, J.K.; Kim, O.Y.; Jang, Y.; Lee, S.H.; Ordovas, J.M.; Lee, J.H. FADS gene polymorphisms in Koreans: Association with ω6 polyunsaturated fatty acids in serum phospholipids, lipid peroxides, and coronary artery disease. Atherosclerosis 2011, 214, 94–100. [Google Scholar] [CrossRef]
- Roke, K.; Ralston, J.C.; Abdelmagid, S.; Nielsen, D.E.; Badawi, A.; El-Sohemy, A.; Ma, D.W.; Mutch, D.M. Variation in the FADS1/2 gene cluster alters plasma n−6 PUFA and is weakly associated with hsCRP levels in healthy young adults. Prostaglandins Leukot. Essent. Fatty Acids 2013, 89, 257–263. [Google Scholar] [CrossRef] [PubMed]
- Vaittinen, M.; Walle, P.; Kuosmanen, E.; Männistö, V.; Käkelä, P.; Ågren, J.; Schwab, U.; Pihlajamäki, J. FADS2 genotype regulates delta-6 desaturase aktivity and inflammation in human adipose tissue. J. Lipid Res. 2016, 57, 56–65. [Google Scholar] [CrossRef]
- Rifkin, S.B.; Shrubsole, M.J.; Cai, Q.; Smalley, W.E.; Ness, R.M.; Swift, L.L.; Milne, G.; Zheng, W.; Murff, H.J. Differences in erythrocyte phospholipid membrane long-chain polyunsaturated fatty acids and the prevalence of fatty acid desaturase genotype among African Americans and European Americans. Prostaglandins Leukot. Essent. Fatty Acids 2021, 164, 102216. [Google Scholar] [CrossRef]
- Meuronen, T.; Lankinen, M.A.; Kärkkäinen, O.; Laakso, M.; Pihlajamäki, J.; Hanhineva, K.; Schwab, U. FADS1 rs174550 genotype and high linoleic acid diet modify plasma PUFA phospholipids in a dietary intervention study. Eur. J. Nutr. 2022, 61, 1109–1120. [Google Scholar] [CrossRef]
- Hong, S.H.; Kwak, J.H.; Paik, J.K.; Chae, J.S.; Lee, J.H. Association of polymorphisms in FADS gene with age-related changes in serum phospholipid polyunsaturated fatty acids and oxidative stress markers in middle-aged nonobese men. Clin. Interv. Aging 2013, 8, 585–596. [Google Scholar] [CrossRef]
- Kröger, J.; Schulze, M.B. Recent insights into the relation of 5 desaturase and 6 desaturase activity to the development of type 2 diabetes. Curr. Opin. Lipidol. 2012, 23, 4–10. [Google Scholar] [CrossRef]
- Mansouri, V.; Javanmard, S.H.; Mahdavi, M.; Tajedini, M.H. Association of Polymorphism in Fatty Acid Desaturase Gene with the Risk of Type 2 Diabetes in Iranian Population. Adv. Biomed. Res. 2018, 7, 98. [Google Scholar] [CrossRef]
- Chen, Y.; Estampador, A.C.; Keller, M.; Poveda, A.; Dalla-Riva, J.; Johansson, I.; Renström, F.; Kurbasic, A.; Franks, P.W.; Varga, T.V. The combined effects of FADS gene variation and dietary fats in obesity-related traits in a population from the far north of Sweden: The GLACIER Study. Int. J. Obes. 2019, 43, 808–820. [Google Scholar] [CrossRef]
- Dumont, J.; Goumidi, L.; Grenier-Boley, B.; Cottel, D.; Marecaux, N.; Montaye, M.; Wagner, A.; Arveiler, D.; Simon, C.; Ferrieres, J.; et al. Dietary linoleic acid interacts with FADS1 genetic variability to modulate HDL-Cholesterol and obesity-related traits. Clin. Nutr. 2018, 37, 1683–1689. [Google Scholar] [CrossRef]
- Khamlaoui, W.; Mehri, S.; Hammami, S.; Hammouda, S.; Chraeif, I.; Elosua, R.; Hammami, M. Association Between Genetic Variants in FADS1-FADS2 and ELOVL2 and Obesity, Lipid Traits, and Fatty Acids in Tunisian Population. Clin. Appl. Thromb. Hemost. 2020, 26, 1–9. [Google Scholar] [CrossRef]
- Maguolo, A.; Zusi, C.; Giontella, A.; Miraglia Del Giudice, E.; Tagetti, A.; Fava, C.; Morandi, A.; Maffeis, C. Influence of genetic variants in FADS2 and ELOVL2 genes on BMI and PUFAs homeostasis in children and adolescents with obesity. Int. J. Obes. 2021, 45, 56–65. [Google Scholar] [CrossRef]
- Metelcová, T.; Vaňková, M.; Zamrazilová, H.; Hovhannisyan, M.; Staňková, B.; Tvrzická, E.; Hill, M.; Hainer, V.; Včelák, J.; Kunešová, M. FADS1 gene polymorphism(s) and fatty acid composition of serum lipids in adolescents. Lipids 2021, 56, 499–508. [Google Scholar] [CrossRef]
- de la Garza Puentes, A.; Montes Goyanes, R.; Chisaguano Tonato, A.M.; Torres-Espínola, F.J.; Arias García, M.; de Almeida, L.; Bonilla Aguirre, M.; Guerendiain, M.; Castellote Bargalló, A.I.; Segura Moreno, M.; et al. Association of maternal weight with FADS and ELOVL genetic variants and fatty acid levels- The PREOBE follow-up. PLoS ONE 2017, 12, e0179135. [Google Scholar] [CrossRef]
- Song, Z.; Cao, H.; Qin, L.; Jiang, Y. A Case-Control Study between Gene Polymorphisms of Polyunsaturated Fatty Acid Metabolic Rate-Limiting Enzymes and Acute Coronary Syndrome in Chinese Han Population. Biomed. Res. Int. 2013, 2013, 928178. [Google Scholar] [CrossRef]
- Li, S.-W.; Wang, J.; Yang, Y.; Liu, Z.-J.; Cheng, L.; Liu, H.-Y.; Ma, P.; Wan Luo, W.; Liu, S.-M. Polymorphisms in FADS1 and FADS2 alterplasma fatty acids and desaturase levels in type 2 diabetic patients with coronary artery disease. J. Transl. Med. 2016, 14, 79. [Google Scholar] [CrossRef]
- Yuan, S.; Bäck, M.; Bruzelius, M.; Mason, A.M.; Burgess, S.; Larsson, S. Plasma Phospholipid Fatty Acids, FADS1 and Risk of 15 Cardiovascular Diseases: A Mendelian Randomisation Study. Nutrients 2019, 11, 3001. [Google Scholar] [CrossRef]
- Sergeant, S.; Hugenschmidt, C.E.; Rudock, M.E.; Ziegler, J.T.; Ivester, P.; Ainsworth, H.C.; Vaidya, D.; Case, L.D.; Langefeld, C.D.; Freedman, B.I.; et al. Differences in Arachidonic Acid Levels and Fatty Acid Desaturase (FADS) Gene Variants in African Americans and European Americans with Diabetes/Metabolic Syndrome. Br. J. Nutr. 2012, 107, 547–555. [Google Scholar] [CrossRef]
- Truong, H.; DiBello, J.R.; Ruiz-Narvaez, E.; Kraft, P.; Campos, H.; Baylin, A. Does genetic variation in the D6-desaturase promoter modify the association between a-linolenic acid and the prevalence of metabolic syndrome? Am. J. Clin. Nutr. 2009, 89, 920–925. [Google Scholar] [CrossRef]
- Martinelli, N.; Girelli, D.; Malerba, G.; Guarini, P.; Illig, T.; Trabetti, E.; Sandri, M.; Friso, S.; Pizzolo, F.; Schaeffer, L.; et al. FADS genotypes and desaturase activity estimated by the ratio of arachidonic acid to linoleic acid are associated with inflammation and coronary artery disease. Am. J. Clin. Nutr. 2008, 88, 941–949. [Google Scholar] [CrossRef]
- Jump, D.B. Fatty acid regulation of hepatic lipid metabolism. Curr. Opin. Clin. Nutr. Metab. Care 2011, 14, 115–120. [Google Scholar] [CrossRef]
- Tosi, F.; Sartori, F.; Guarini, P.; Olivieri, O.; Martinelli, N. Delta-5 and delta-6 desaturases: Crucial enzymes in polyunsaturated fatty acid-related pathways with pleiotropic influences in health and disease. Adv. Exp. Med. Biol. 2014, 824, 61–81. [Google Scholar] [CrossRef]
- Kremmyda, L.S.; Tvrzická, E.; Staňková, B.; Žák, A. Fatty acids as biocompounds: Their role in human metabolism, health and disease: A review. Part 2: Fatty acid physiological roles and applications in human health and disease. Biomed. Pap. Med. Fac. Univ. Palacky Olomouc Czech Repub. 2011, 155, 195–218. [Google Scholar] [CrossRef]
- Tintle, N.L.; Pottala, J.V.; Lacey, S.; Ramachandran, V.; Westra, J.; Rogers, A.; Clark, J.; Olthoff, B.; Larson, M.; Harris, W.; et al. A genome-wide association study of saturated, mono- and polyunsaturated red blood cell fatty acids in the Framingham heart offspring study. Prostaglandins Leukot. Essent. Fatty Acids 2015, 94, 65–72. [Google Scholar] [CrossRef]
- Tvrzická, E.; Kremmyda, L.S.; Staňková, B.; Žák, A. Fatty acids as biocompounds: Their role in human metabolism, health and disease--a review. Part 1: Classification, dietary sources and biological functions. Biomed. Pap. Med. Fac. Univ. Palacky Olomouc Czech Repub. 2011, 155, 117–130. [Google Scholar] [CrossRef]
- Solinas, G.; Borén, J.; Dulloo, A.G. De novo lipogenesis in metabolic homeostasis: More friend than foe? Mol. Metab. 2015, 4, 367–377. [Google Scholar] [CrossRef] [PubMed]
- Saponaro, C.; Gaggini, M.; Carli, F.; Gastaldelli, A. The Subtle Balance between Lipolysis and Lipogenesis: A Critical Point in Metabolic Homeostasis. Nutrients 2015, 7, 9453–9474. [Google Scholar] [CrossRef]
- AlJohani, A.M.; Syed, D.N.; Ntambi, J.M. Insights into Stearoyl-CoA Desaturase-1 Regulation of Systemic Metabolism. Trends Endocrinol. Metab. 2017, 28, 831–842. [Google Scholar] [CrossRef]
- Dron, J.S.; Hegele, R.A. Genetics of Hypertriglyceridemia. Front. Endocrinol. 2020, 11, 455. [Google Scholar] [CrossRef]
- Bauer, R.C.; Khetarpal, S.A.; Hand, N.J.; Rader, D.J. Therapeutic targets of triglyceride metabolism as informed by human genetics. Trends Mol. Med. 2016, 22, 328–340. [Google Scholar] [CrossRef]
- Žák, A.; Tvrzická, E.; Vecka, M.; Jáchymová, M.; Duffková, L.; Staňková, B.; Vávrová, L.; Kodydková, J.; Zeman, M. Severity of metabolic syndrome unfavorably influences oxidative stress and fatty acid metabolism in men. Tohoku J. Exp. Med. 2007, 212, 359–371. [Google Scholar] [CrossRef]
- Ahotupa, M.; Ruutu, M.; Mantyla, E. Simple methods of quantifying oxidation products and antioxidant potential of low density lipoproteins. Clin. Biochem. 1996, 29, 139–144. [Google Scholar] [CrossRef]
- Esterbauer, H.; Gebicki, J.; Puhl, H.; Jürgens, G. The role of lipid peroxidation and antioxidants in oxidative modification of LDL. Free Radic. Biol. Med. 1992, 13, 341–390. [Google Scholar] [CrossRef]
- Gromovsky, A.D.; Schugar, R.C.; Brown, A.L.; Helsley, R.N.; Burrows, A.C.; Ferguson, D.; Zhang, R.; Sansbury, B.E.; Lee, R.G.; Morton, R.E.; et al. The Δ-5 Fatty Acid Desaturase FADS1 Impacts Metabolic Disease by Balancing Pro-Inflammatory and Pro-Resolving Lipid Mediators. Arterioscler. Thromb. Vasc. Biol. 2018, 38, 218–231. [Google Scholar] [CrossRef]
- Mazoochian, L.; Sadeghi, H.M.; Pourfarzam, M. The effect of FADS2 gene rs174583 polymorphism on desaturase activities, fatty acid profile, insulin resistance, biochemical indices, and incidence of type 2 diabetes. J. Res. Med. Sci. 2018, 23, 47. [Google Scholar] [CrossRef]
- Zec, M.M.; Krga, I.; Stojković, L.; Živković, M.; Pokimica, B.; Stanković, A.; Glibetic, M. Is There a FADS2-Modulated Link between Long-Chain Polyunsaturated Fatty Acids in Plasma Phospholipids and Polyphenol Intake in Adult Subjects Who Are Overweight? Nutrients 2021, 13, 296. [Google Scholar] [CrossRef] [PubMed]
- Dumont, J.; Huybrechts, I.; Spinneker, A.; Gottrand, F.; Grammatikaki, E.; Bevilacqua, N.; Vyncke, K.; Widhalm, K.; Kafatos, A.; Molnar, D.; et al. FADS1 genetic variability interacts with dietary alpha-linolenic acid intake to affect serum Non-HDL-Cholesterol concentrations in European adolescents. J. Nutr. 2011, 141, 1247–1253. [Google Scholar] [CrossRef] [PubMed]
- Kawashima, A.; Sugawara, S.; Okita, M.; Akahane, T.; Fukui, K.; Hashiuchi, M.; Kataoka, C.; Tsukamoto, I. Plasma fatty acid composition, estimated desaturase activities, and intakes of energy and nutrient in Japanese Men with Abdominal Obesity or Metabolic syndrome. J. Nutr. Sci. Vitaminol. 2009, 55, 400–406. [Google Scholar] [CrossRef]
- GWAS Catalog. Available online: https://www.ebi.ac.uk/gwas/variants/rs174537 (accessed on 8 May 2022).
- He, Z.; Zhang, R.; Jiang, F.; Zhang, H.; Zhao, A.; Xu, B.; Jin, L.; Wang, T.; Jia, W.; Jia, W.; et al. FADS1-FADS2 genetic polymorphisms are associated with fatty acid metabolism through changes in DNA methylation and gene expression. Clin. Epigenetics 2018, 10, 113. [Google Scholar] [CrossRef]
- Lottenberg, A.M.; da Silva Alfonso, M.; Lavrador, M.S.; Machado, R.M.; Nakandakare, E.R. The role of dietary fatty acids in the pathology of metabolic syndrome. J. Nutr. Biochem. 2012, 23, 1027–1040. [Google Scholar] [CrossRef] [PubMed]
- Alberti, K.G.; Zimmet, P.; Shaw, J. Metabolic syndrome—A new world-wide definition. A consensus statement from the International Diabetes Federation. Diabet. Med. 2006, 23, 469–480. [Google Scholar] [CrossRef]
- Vecka, M.; Dušejovská, M.; Staňková, B.; Rychlík, I.; Žák, A. A Matched Case-Control Study of Noncholesterol Sterols and Fatty Acids in Chronic Hemodialysis Patients. Metabolites 2021, 11, 774. [Google Scholar] [CrossRef]
- Matthews, D.R.; Hosker, J.P.; Rudenski, A.S.; Naylor, B.A.; Treacher, D.F.; Turner, R.C. Homeostasis model assessment: Insulin resistance and beta-cell function from fasting plasma glucose and insulin concentrations in man. Diabetologia 1985, 28, 412–419. [Google Scholar] [CrossRef]
- Ward, J.H., Jr. Hierarchical Grouping to Optimize an Objective Function. J. Amer. Statist. Assoc. 1963, 58, 236–244. [Google Scholar] [CrossRef]
- Phan, L.; Jin, Y.; Zhang, H.; Qiang, W.; Shekhtman, E.; Shao, D.; Revoe, D.; Villamarin, R.; Ivanchenko, E.; Kimura, M.; et al. ALFA: Allele Frequency Aggregator. National Center for Biotechnology Information. U.S. National Library of Medicine. 2020. Available online: www.ncbi.nlm.nih.gov/snp/docs/gsr/alfa (accessed on 8 May 2022).
- Mathias, R.A.; Pani, V.; Chilton, F.H. Genetic Variants in the FADS Gene: Implications for Dietary Recommendations for Fatty Acid Intake. Curr. Nutr. Rep. 2014, 3, 139–148. [Google Scholar] [CrossRef]
- Cormier, H.; Rudkowska, I.; Paradis, A.M.; Thifault, E.; Garneau, V.; Lemieux, S.; Couture, P.; Vohl, M.C. Association between polymorphisms in the fatty acid desaturase gene cluster and the plasma triacylglycerol response to an n-3 PUFA supplementation. Nutrients 2012, 4, 1026–1041. [Google Scholar] [CrossRef] [PubMed]
- Miller, S.A.; Dykes, D.D.; Polesky, H.F. A simple salting out procedure for extracting DNA from human nucleated cells. Nucleic Acids Res. 1988, 16, 1215. [Google Scholar] [CrossRef]
- Sanger, F.; Nicklen, S.; Coulson, A.R. DNA sequencing with chain-terminating inhibitors. Proc. Natl. Acad. Sci. USA 1977, 74, 5463–5467. [Google Scholar] [CrossRef] [PubMed]
- Kimmel, G.; Shamir, R. Maximum Likelihood Resolution of Multi-block Genotypes. In Proceedings of the Eighth Annual International Conference on Research in Computational Molecular Biology—RECOMB 04: San Diego, CA USA, New York, NY, USA, 27–31 March 2004; pp. 2–9. [Google Scholar] [CrossRef]
- Kimmel, G.; Shamir, R. GERBIL: Genotype resolution and block identification using likelihood. Proc. Natl. Acad. Sci. USA 2005, 102, 158–162. [Google Scholar] [CrossRef] [PubMed]
- Barrett, J.C.; Fry, B.; Maller, J.; Daly, M.J. Haploview: Analysis and visualization of LD and haplotype maps. Bioinformatics 2005, 21, 263–265. [Google Scholar] [CrossRef] [PubMed]
- The R Core Team: A Language and Environment for Statistical Computing. R Foundation for Statistical Computing: Vienna, Austria. 2022. Available online: https://www.R-project.org/ (accessed on 16 April 2022).
Publisher’s Note: MDPI stays neutral with regard to jurisdictional claims in published maps and institutional affiliations. |
© 2022 by the authors. Licensee MDPI, Basel, Switzerland. This article is an open access article distributed under the terms and conditions of the Creative Commons Attribution (CC BY) license (https://creativecommons.org/licenses/by/4.0/).