
Metabolome Alterations Linking Sugar-Sweetened Beverage Intake with Dyslipidemia in Youth: The Exploring Perinatal Outcomes among CHildren (EPOCH) Study

 ,
,  , ,
, , 
Abstract
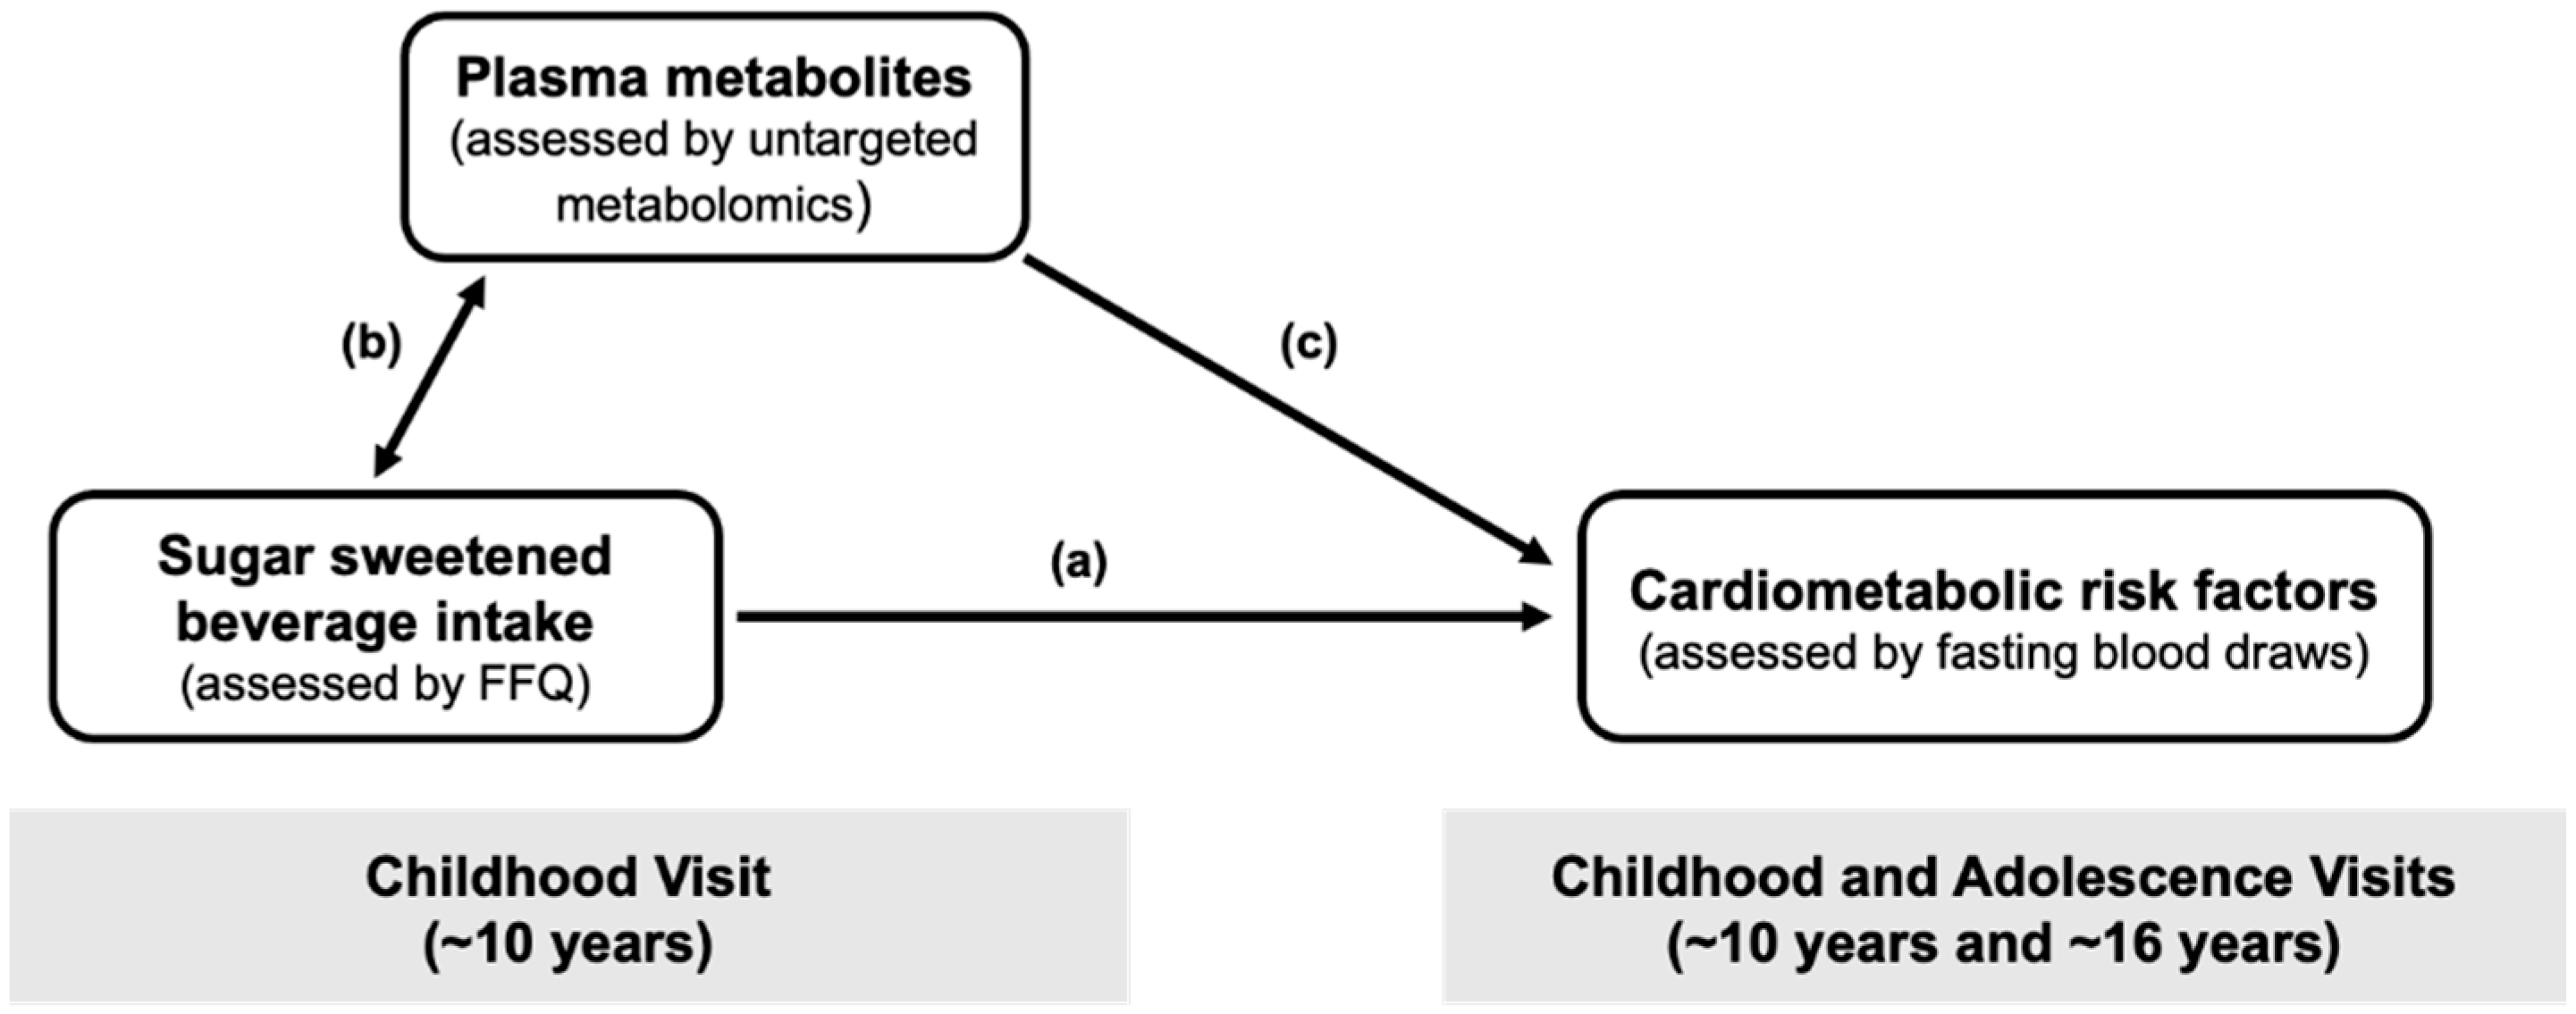
:1. Introduction
2. Results
2.1. Characteristics
2.2. Associations of SSB Intake in Childhood with Cardiometabolic Measures
2.3. Associations of SSB Intake in Childhood with Plasma Metabolites
2.4. Associations of SSB-Related Metabolites in Childhood with Triglycerides
2.5. Sensitivity Analyses
3. Discussion
Conclusions
4. Materials and Methods
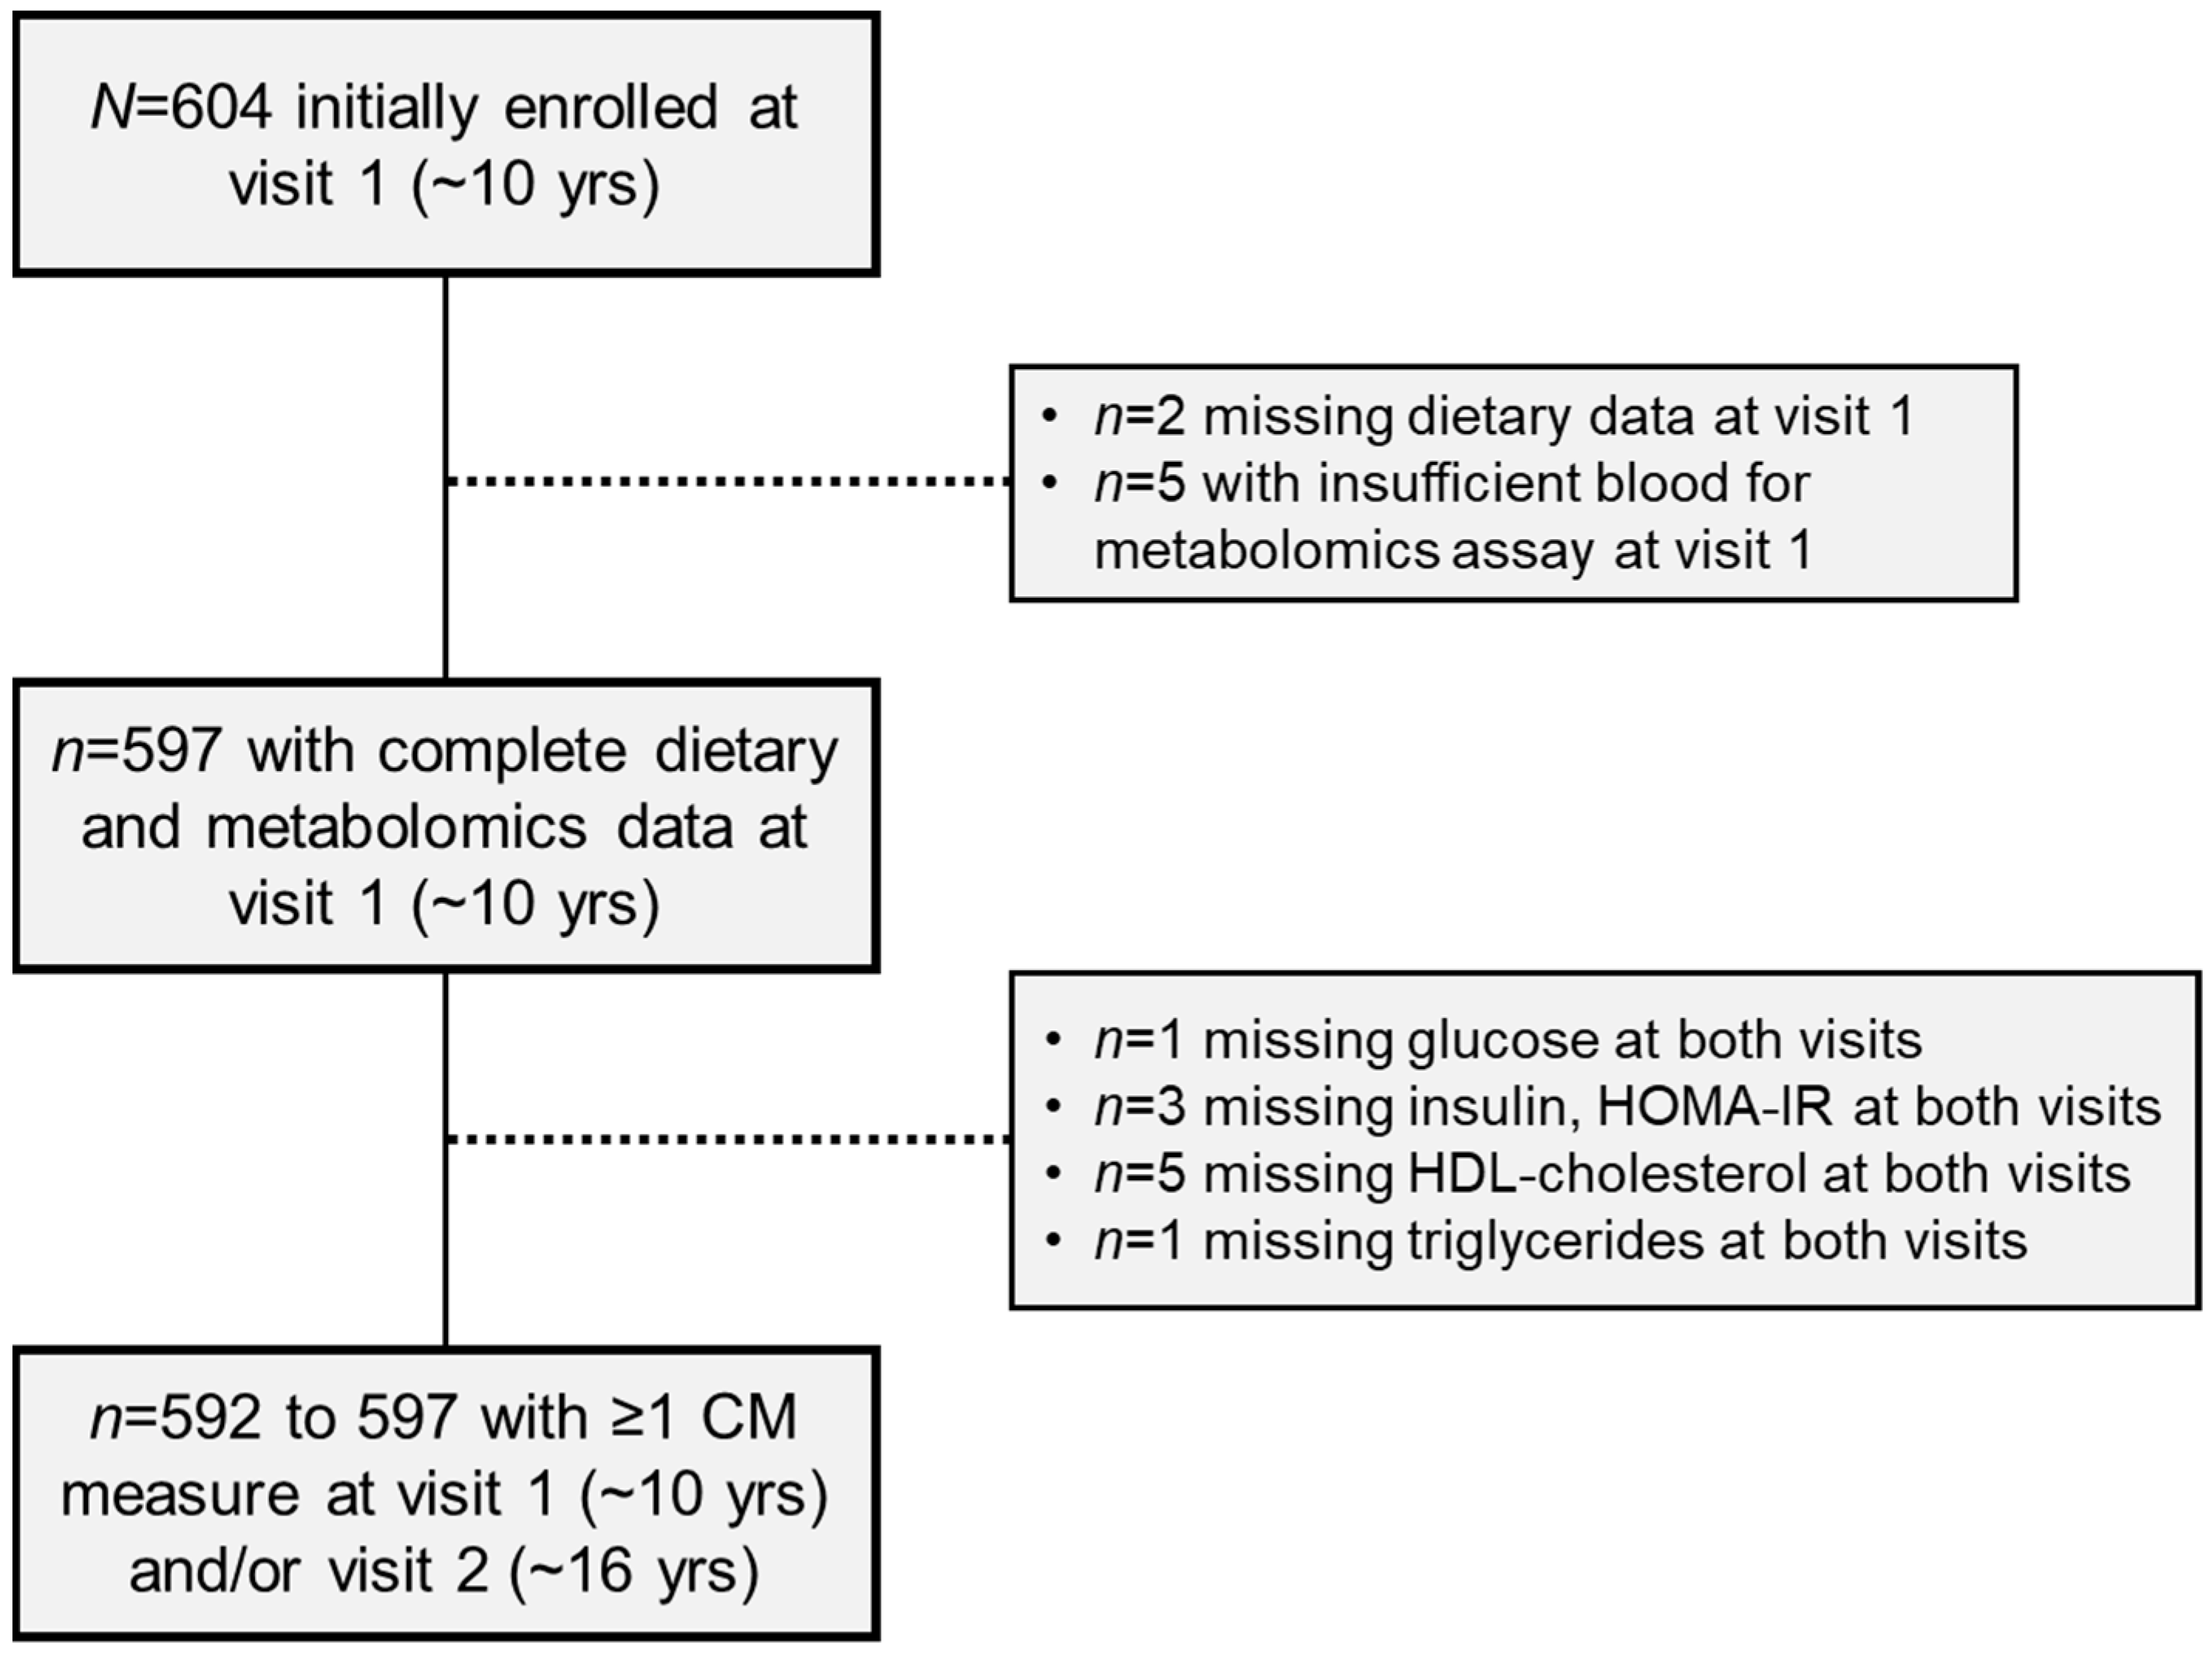
4.1. Study Population
4.2. Dietary Assessment
4.3. Untargeted Metabolomics Profiling of Plasma
4.4. Cardiometabolic Risk Assessments
4.5. Other Covariate Assessments
4.6. Statistical Analyses
Supplementary Materials
Author Contributions
Funding
Institutional Review Board Statement
Informed Consent Statement
Data Availability Statement
Conflicts of Interest
References
- Hu, F.B. Resolved: There is sufficient scientific evidence that decreasing sugar-sweetened beverage consumption will reduce the prevalence of obesity and obesity-related diseases. Obes. Rev. 2013, 14, 606–619. [Google Scholar] [CrossRef] [PubMed]
- Te Morenga, L.; Mallard, S.; Mann, J. Dietary sugars and body weight: Systematic review and meta-analyses of randomised controlled trials and cohort studies. BMJ 2012, 346, e7492. [Google Scholar] [CrossRef] [PubMed] [Green Version]
- Vartanian, L.R.; Schwartz, M.B.; Brownell, K.D. Effects of soft drink consumption on nutrition and health: A systematic review and meta-analysis. Am. J. Public Health 2007, 97, 667–675. [Google Scholar] [CrossRef] [PubMed]
- Sigala, D.M.; Stanhope, K.L. An Exploration of the Role of Sugar-Sweetened Beverage in Promoting Obesity and Health Disparities. Curr. Obes. Rep. 2021, 10, 39–52. [Google Scholar] [CrossRef] [PubMed]
- Eny, K.M.; Jeyakumar, N.; Dai, D.W.H.; Maguire, J.L.; Parkin, P.C.; Birken, C.S.; Collaboration, T.A.K. Sugar-containing beverage consumption and cardiometabolic risk in preschool children. Prev. Med. Rep. 2020, 17, 101054. [Google Scholar] [CrossRef] [PubMed]
- Seferidi, P.; Millett, C.; Laverty, A.A. Sweetened beverage intake in association to energy and sugar consumption and cardiometabolic markers in children. Pediatr. Obes. 2018, 13, 195–203. [Google Scholar] [CrossRef]
- Stanhope, K.L.; Goran, M.I.; Bosy-Westphal, A.; King, J.C.; Schmidt, L.A.; Schwarz, J.M.; Stice, E.; Sylvetsky, A.C.; Turnbaugh, P.J.; Bray, G.A.; et al. Pathways and mechanisms linking dietary components to cardiometabolic disease: Thinking beyond calories. Obes. Rev. 2018, 19, 1205–1235. [Google Scholar] [CrossRef] [PubMed]
- Kosova, E.C.; Auinger, P.; Bremer, A.A. The relationships between sugar-sweetened beverage intake and cardiometabolic markers in young children. J. Acad. Nutr. Diet. 2013, 113, 219–227. [Google Scholar] [CrossRef] [Green Version]
- Bremer, A.A.; Auinger, P.; Byrd, R.S. Relationship between insulin resistance-associated metabolic parameters and anthropometric measurements with sugar-sweetened beverage intake and physical activity levels in US adolescents: Findings from the 1999–2004 National Health and Nutrition Examination Survey. Arch. Pediatr. Adolesc. Med. 2009, 163, 328–335. [Google Scholar] [CrossRef] [Green Version]
- Cioffi, C.E.; Welsh, J.A.; Alvarez, J.A.; Hartman, T.J.; Narayan, K.M.V.; Vos, M.B. Associations of Added Sugar from All Sources and Sugar-Sweetened Beverages with Regional Fat Deposition in US Adolescents: NHANES 1999–2006. Curr. Dev. Nutr. 2019, 3, nzz130. [Google Scholar] [CrossRef]
- Goree, L.L.; Chandler-Laney, P.; Ellis, A.C.; Casazza, K.; Granger, W.M.; Gower, B.A. Dietary macronutrient composition affects β cell responsiveness but not insulin sensitivity. Am. J. Clin. Nutr. 2011, 94, 120–127. [Google Scholar] [CrossRef] [PubMed] [Green Version]
- Cohen, C.C.; Li, K.W.; Alazraki, A.L.; Beysen, C.; Carrier, C.A.; Cleeton, R.L.; Dandan, M.; Figueroa, J.; Knight-Scott, J.; Knott, C.J.; et al. Dietary sugar restriction reduces hepatic de novo lipogenesis in adolescent boys with fatty liver disease. J. Clin. Investig. 2021, 131, e150996. [Google Scholar] [CrossRef] [PubMed]
- Schwarz, J.M.; Noworolski, S.M.; Wen, M.J.; Dyachenko, A.; Prior, J.L.; Weinberg, M.E.; Herraiz, L.A.; Tai, V.W.; Bergeron, N.; Bersot, T.P.; et al. Effect of a High-Fructose Weight-Maintaining Diet on Lipogenesis and Liver Fat. J. Clin. Endocrinol. Metab. 2015, 100, 2434–2442. [Google Scholar] [CrossRef] [PubMed]
- Schwarz, J.M.; Noworolski, S.M.; Erkin-Cakmak, A.; Korn, N.J.; Wen, M.J.; Tai, V.W.; Jones, G.M.; Palii, S.P.; Velasco-Alin, M.; Pan, K.; et al. Effects of Dietary Fructose Restriction on Liver Fat, De Novo Lipogenesis, and Insulin Kinetics in Children With Obesity. Gastroenterology 2017, 153, 743–752. [Google Scholar] [CrossRef] [Green Version]
- Stanhope, K.L.; Schwarz, J.M.; Keim, N.L.; Griffen, S.C.; Bremer, A.A.; Graham, J.L.; Hatcher, B.; Cox, C.L.; Dyachenko, A.; Zhang, W.; et al. Consuming fructose-sweetened, not glucose-sweetened, beverages increases visceral adiposity and lipids and decreases insulin sensitivity in overweight/obese humans. J. Clin. Investig. 2009, 119, 1322–1334. [Google Scholar] [CrossRef] [Green Version]
- Geidl-Flueck, B.; Hochuli, M.; Németh, Á.; Eberl, A.; Derron, N.; Köfeler, H.C.; Tappy, L.; Berneis, K.; Spinas, G.A.; Gerber, P.A. Fructose- and sucrose- but not glucose-sweetened beverages promote hepatic de novo lipogenesis: A randomized controlled trial. J. Hepatol. 2021, 75, 46–54. [Google Scholar] [CrossRef]
- Uppal, K.; Walker, D.I.; Liu, K.; Li, S.; Go, Y.-M.; Jones, D.P. Computational Metabolomics: A Framework for the Million Metabolome. Chem. Res. Toxicol. 2016, 29, 1956–1975. [Google Scholar] [CrossRef] [Green Version]
- Gibbons, H.; McNulty, B.A.; Nugent, A.P.; Walton, J.; Flynn, A.; Gibney, M.J.; Brennan, L. A metabolomics approach to the identification of biomarkers of sugar-sweetened beverage intake. Am. J. Clin. Nutr. 2015, 101, 471–477. [Google Scholar] [CrossRef]
- Vineis, P.; Perera, F. Molecular Epidemiology and Biomarkers in Etiologic Cancer Research: The New in Light of the Old. Cancer Epidemiol. Biomark. Prev. 2007, 16, 1954–1965. [Google Scholar] [CrossRef] [Green Version]
- Perng, W.; Tang, L.; Song, P.X.K.; Goran, M.; Tellez Rojo, M.M.; Cantoral, A.; Peterson, K.E. Urate and Nonanoate Mark the Relationship between Sugar-Sweetened Beverage Intake and Blood Pressure in Adolescent Girls: A Metabolomics Analysis in the ELEMENT Cohort. Metabolites 2019, 9, 100. [Google Scholar] [CrossRef] [Green Version]
- Te Morenga, L.A.; Howatson, A.J.; Jones, R.M.; Mann, J. Dietary sugars and cardiometabolic risk: Systematic review and meta-analyses of randomized controlled trials of the effects on blood pressure and lipids. Am. J. Clin. Nutr. 2014, 100, 65–79. [Google Scholar] [CrossRef] [PubMed] [Green Version]
- Mayes, P.A. Intermediary metabolism of fructose. Am. J. Clin. Nutr. 1993, 58, 754s–765s. [Google Scholar] [CrossRef] [PubMed]
- Schultz, A.; Neil, D.; Aguila, M.B.; Mandarim-de-Lacerda, C.A. Hepatic adverse effects of fructose consumption independent of overweight/obesity. Int. J. Mol. Sci. 2013, 14, 21873–21886. [Google Scholar] [CrossRef] [Green Version]
- Kim, M.-S.; Krawczyk, S.A.; Doridot, L.; Fowler, A.J.; Wang, J.X.; Trauger, S.A.; Noh, H.-L.; Kang, H.J.; Meissen, J.K.; Blatnik, M.; et al. ChREBP regulates fructose-induced glucose production independently of insulin signaling. J. Clin. Investig. 2016, 126, 4372–4386. [Google Scholar] [CrossRef] [PubMed] [Green Version]
- Cox, C.L.; Stanhope, K.L.; Schwarz, J.M.; Graham, J.L.; Hatcher, B.; Griffen, S.C.; Bremer, A.A.; Berglund, L.; McGahan, J.P.; Havel, P.J.; et al. Consumption of fructose-sweetened beverages for 10 weeks reduces net fat oxidation and energy expenditure in overweight/obese men and women. Eur. J. Clin. Nutr. 2012, 66, 201–208. [Google Scholar] [CrossRef] [Green Version]
- Maersk, M.; Belza, A.; Stødkilde-Jørgensen, H.; Ringgaard, S.; Chabanova, E.; Thomsen, H.; Pedersen, S.B.; Astrup, A.; Richelsen, B. Sucrose-sweetened beverages increase fat storage in the liver, muscle, and visceral fat depot: A 6-mo randomized intervention study. Am. J. Clin. Nutr. 2011, 95, 283–289. [Google Scholar] [CrossRef]
- Stapleton, P.P.; Charles, R.P.; Redmond, H.P.; Bouchier-Hayes, D.J. Taurine and human nutrition. Clin. Nutr. 1997, 16, 103–108. [Google Scholar] [CrossRef]
- Mingrone, G.; Castagneto-Gissey, L.; Macé, K. Use of dicarboxylic acids in type 2 diabetes. Br. J. Clin. Pharm. 2013, 75, 671–676. [Google Scholar] [CrossRef] [Green Version]
- Butte, N.F.; Liu, Y.; Zakeri, I.F.; Mohney, R.P.; Mehta, N.; Voruganti, V.S.; Göring, H.; Cole, S.A.; Comuzzie, A.G. Global metabolomic profiling targeting childhood obesity in the Hispanic population. Am. J. Clin. Nutr. 2015, 102, 256–267. [Google Scholar] [CrossRef]
- Roglans, N.; Vilà, L.; Farré, M.; Alegret, M.; Sánchez, R.M.; Vázquez-Carrera, M.; Laguna, J.C. Impairment of hepatic Stat-3 activation and reduction of PPARalpha activity in fructose-fed rats. Hepatology 2007, 45, 778–788. [Google Scholar] [CrossRef]
- Razquin, C.; Liang, L.; Toledo, E.; Clish, C.B.; Ruiz-Canela, M.; Zheng, Y.; Wang, D.D.; Corella, D.; Castaner, O.; Ros, E.; et al. Plasma lipidome patterns associated with cardiovascular risk in the PREDIMED trial: A case-cohort study. Int. J. Cardiol. 2018, 253, 126–132. [Google Scholar] [CrossRef] [PubMed]
- Wang, D.D.; Zheng, Y.; Toledo, E.; Razquin, C.; Ruiz-Canela, M.; Guasch-Ferré, M.; Yu, E.; Corella, D.; Gómez-Gracia, E.; Fiol, M.; et al. Lipid metabolic networks, Mediterranean diet and cardiovascular disease in the PREDIMED trial. Int. J. Epidemiol. 2018, 47, 1830–1845. [Google Scholar] [CrossRef] [PubMed] [Green Version]
- Koves, T.R.; Ussher, J.R.; Noland, R.C.; Slentz, D.; Mosedale, M.; Ilkayeva, O.; Bain, J.; Stevens, R.; Dyck, J.R.; Newgard, C.B.; et al. Mitochondrial overload and incomplete fatty acid oxidation contribute to skeletal muscle insulin resistance. Cell Metab. 2008, 7, 45–56. [Google Scholar] [CrossRef] [PubMed] [Green Version]
- Razquin, C.; Toledo, E.; Clish, C.B.; Ruiz-Canela, M.; Dennis, C.; Corella, D.; Papandreou, C.; Ros, E.; Estruch, R.; Guasch-Ferré, M.; et al. Plasma Lipidomic Profiling and Risk of Type 2 Diabetes in the PREDIMED Trial. Diabetes Care 2018, 41, 2617–2624. [Google Scholar] [CrossRef] [Green Version]
- Guasch-Ferré, M.; Hruby, A.; Toledo, E.; Clish, C.B.; Martínez-González, M.A.; Salas-Salvadó, J.; Hu, F.B. Metabolomics in Prediabetes and Diabetes: A Systematic Review and Meta-analysis. Diabetes Care 2016, 39, 833–846. [Google Scholar] [CrossRef] [Green Version]
- McGranaghan, P.; Kirwan, J.A.; Garcia-Rivera, M.A.; Pieske, B.; Edelmann, F.; Blaschke, F.; Appunni, S.; Saxena, A.; Rubens, M.; Veledar, E.; et al. Lipid Metabolite Biomarkers in Cardiovascular Disease: Discovery and Biomechanism Translation from Human Studies. Metabolites 2021, 11, 621. [Google Scholar] [CrossRef]
- Papandreou, C.; Harrold, J.A.; Hansen, T.T.; Halford, J.C.G.; Sjödin, A.; Bulló, M. Changes in Circulating Metabolites during Weight Loss and Weight Loss Maintenance in Relation to Cardiometabolic Risk. Nutrients 2021, 13, 4289. [Google Scholar] [CrossRef]
- Quinn, W.J., 3rd; Wan, M.; Shewale, S.V.; Gelfer, R.; Rader, D.J.; Birnbaum, M.J.; Titchenell, P.M. mTORC1 stimulates phosphatidylcholine synthesis to promote triglyceride secretion. J. Clin. Investig. 2017, 127, 4207–4215. [Google Scholar] [CrossRef] [Green Version]
- Wehling, H.; Lusher, J. People with a body mass index ≥30 under-report their dietary intake: A systematic review. J. Health Psychol. 2019, 24, 2042–2059. [Google Scholar] [CrossRef]
- Willett, W.; Stampfer, M.J. Total energy intake: Implications for epidemiologic analyses. Am. J. Epidemiol. 1986, 124, 17–27. [Google Scholar] [CrossRef]
- Guevara, R.M.; Moral-García, J.E.; Urchaga, J.D.; López-García, S. Relevant Factors in Adolescent Well-Being: Family and Parental Relationships. Int. J. Environ. Res. Public Health 2021, 18, 7666. [Google Scholar] [CrossRef] [PubMed]
- Eck, K.M.; Dinesen, A.; Garcia, E.; Delaney, C.L.; Famodu, O.A.; Olfert, M.D.; Byrd-Bredbenner, C.; Shelnutt, K.P. “Your Body Feels Better When You Drink Water”: Parent and School-Age Children’s Sugar-Sweetened Beverage Cognitions. Nutrients 2018, 10, 1232. [Google Scholar] [CrossRef] [PubMed] [Green Version]
- Godin, K.M.; Chaurasia, A.; Hammond, D.; Leatherdale, S.T. Examining associations between school food environment characteristics and sugar-sweetened beverage consumption among Canadian secondary-school students in the COMPASS study. Public Health Nutr. 2019, 22, 1928–1940. [Google Scholar] [CrossRef] [Green Version]
- Crume, T.L.; Ogden, L.; West, N.A.; Vehik, K.S.; Scherzinger, A.; Daniels, S.; McDuffie, R.; Bischoff, K.; Hamman, R.F.; Norris, J.M.; et al. Association of exposure to diabetes in utero with adiposity and fat distribution in a multiethnic population of youth: The Exploring Perinatal Outcomes among Children (EPOCH) Study. Diabetologia 2011, 54, 87–92. [Google Scholar] [CrossRef] [PubMed] [Green Version]
- Mayer-Davis, E.J.; Nichols, M.; Liese, A.D.; Bell, R.A.; Dabelea, D.M.; Johansen, J.M.; Pihoker, C.; Rodriguez, B.L.; Thomas, J.; Williams, D. Dietary intake among youth with diabetes: The SEARCH for Diabetes in Youth Study. J. Am. Diet. Assoc. 2006, 106, 689–697. [Google Scholar] [CrossRef] [PubMed]
- Cullen, K.W.; Watson, K.; Zakeri, I. Relative reliability and validity of the Block Kids Questionnaire among youth aged 10 to 17 years. J. Am. Diet. Assoc. 2008, 108, 862–866. [Google Scholar] [CrossRef] [PubMed]
- Block, G.; Murphy, M.; Roullet, J.B.; Wakimoto, P.; Crawford, P.B.; Block, T. Pilot validation of a FFQ for children 8–10 years. In Proceedings of the Fourth International Conference on Dietary Assessment Methods, Tucson, AZ, USA, 17–20 September 2000. [Google Scholar]
- Willett, W.C.; Howe, G.R.; Kushi, L.H. Adjustment for total energy intake in epidemiologic studies. Am. J. Clin. Nutr. 1997, 65, 1220S–1228S. [Google Scholar] [CrossRef]
- Perng, W.; Ringham, B.M.; Smith, H.A.; Michelotti, G.; Kechris, K.M.; Dabelea, D. A prospective study of associations between in utero exposure to gestational diabetes mellitus and metabolomic profiles during late childhood and adolescence. Diabetologia 2020, 63, 296–312. [Google Scholar] [CrossRef]
- Perng, W.; Francis, E.C.; Smith, H.A.; Carey, J.; Wang, D.; Kechris, K.M.; Dabelea, D. Sex-Specific Metabolite Biomarkers of NAFLD in Youth: A Prospective Study in the EPOCH Cohort. J. Clin. Endocrinol. Metab. 2020, 105, e3437–e3450. [Google Scholar] [CrossRef]
- Schiffman, C.; Petrick, L.; Perttula, K.; Yano, Y.; Carlsson, H.; Whitehead, T.; Metayer, C.; Hayes, J.; Rappaport, S.; Dudoit, S. Filtering procedures for untargeted LC-MS metabolomics data. BMC Bioinform. 2019, 20, 334. [Google Scholar] [CrossRef] [Green Version]
- Risso, D.; Ngai, J.; Speed, T.P.; Dudoit, S. Normalization of RNA-seq data using factor analysis of control genes or samples. Nat. Biotechnol. 2014, 32, 896–902. [Google Scholar] [CrossRef] [PubMed] [Green Version]
- R Development Core Team. R: A Language Environment for Statistical Computing; R Foundation for Statistical Computing: Vienna Austria, 2021; Available online: https://www.R-project.org/ (accessed on 11 April 2022).
- Matthews, D.R.; Hosker, J.P.; Rudenski, A.S.; Naylor, B.A.; Treacher, D.F.; Turner, R.C. Homeostasis model assessment: Insulin resistance and beta-cell function from fasting plasma glucose and insulin concentrations in man. Diabetologia 1985, 28, 412–419. [Google Scholar] [CrossRef] [PubMed] [Green Version]
- Classification and Diagnosis of Diabetes. Diabetes Care 2017, 40, S11–S24. [CrossRef] [PubMed] [Green Version]
- de Onis, M.; Onyango, A.W.; Borghi, E.; Siyam, A.; Nishida, C.; Siekmann, J. Development of a WHO growth reference for school-aged children and adolescents. Bull. World Health Organ. 2007, 85, 660–667. [Google Scholar] [CrossRef] [PubMed]
- Chavarro, J.E.; Watkins, D.J.; Afeiche, M.C.; Zhang, Z.; Sánchez, B.N.; Cantonwine, D.; Mercado-García, A.; Blank-Goldenberg, C.; Meeker, J.D.; Téllez-Rojo, M.M.; et al. Validity of Self-Assessed Sexual Maturation Against Physician Assessments and Hormone Levels. J. Pediatr. 2017, 186, 172–178.e173. [Google Scholar] [CrossRef]
- Tibshirani, R. Regression shrinkage and selection via the lasso. J. R. Stat. Soc. Ser. B 1996, 58, 267–288. [Google Scholar] [CrossRef]
- Reinehr, T.; Wolters, B.; Knop, C.; Lass, N.; Holl, R.W. Strong Effect of Pubertal Status on Metabolic Health in Obese Children: A Longitudinal Study. J. Clin. Endocrinol. Metab. 2015, 100, 301–308. [Google Scholar] [CrossRef] [Green Version]

| SSB Intake in Childhood 1: | |||||
|---|---|---|---|---|---|
| Quartile 1 (0 to 0.25 Servings/d) | Quartile 2 (0.26 to 0.54 Servings/d) | Quartile 3 (0.55 to 1.00 Servings/d) | Quartile 4 (1.01 to 5.12 Servings/d) | ||
| Variable: | Mean (SD) or Count (%) | Mean (SD) or Count (%) | Mean (SD) or Count (%) | Mean (SD) or Count (%) | p-Value 2 |
| N | 148 | 149 | 150 | 150 | |
| Age (years), mean (SD) | 10.2 (1.5) | 10.3 (1.4) | 10.5 (1.4) | 10.7 (1.5) | 0.023 |
| Male Sex, n (%) | 63 (43%) | 72 (48%) | 75 (50%) | 87 (58%) | 0.064 |
| Race/ethnicity, n (%): | <0.001 | ||||
| Hispanic | 43 (29%) | 52 (35%) | 57 (38%) | 78 (52%) | |
| NH White | 89 (60%) | 77 (52%) | 71 (47%) | 49 (33%) | |
| NH Black | 10 (7%) | 8 (5%) | 13 (9%) | 17 (11%) | |
| NH Other | 6 (4%) | 12 (8%) | 9 (6%) | 6 (4%) | |
| BMI z-score, mean (SD) | 0.28 (1.30) | 0.19 (1.22) | 0.22 (1.21) | 0.37 (1.21) | 0.611 |
| Energy intake (kcal/d), mean (SD) | 1720 (501) | 1808 (503) | 1834 (527) | 1810 (649) | 0.292 |
| Pubertal stage, n (%): | 0.793 | ||||
| Pre-pubertal (Tanner = 1) | 69 (49%) | 68 (48%) | 67 (47%) | 69 (49%) | |
| Pubertal (Tanner = 2 or 3) | 71 (51%) | 74 (52%) | 75 (53%) | 72 (51%) | |
| Late/post-pubertal (Tanner = 4) | 0 (0%) | 1 (1%) | 0 (0%) | 0 (0%) | |
| In utero GDM Exposure, n (%) | 29 (20%) | 22 (15%) | 23 (15%) | 25 (16%) | 0.683 |
| SSB intake 3 (serving/d), mean (SD) | 0.11 (0.09) | 0.39 (0.08) | 0.77 (0.13) | 1.86 (0.91) | |
| SSB Intake in Childhood 1: | ||||
|---|---|---|---|---|
| Quartile 2 vs. 1 | Quartile 3 vs. 1 | Quartile 4 vs. 1 | Linear Trend | |
| Outcome: | β (95% CI) 2 | β (95% CI) 2 | β (95% CI) 2 | p-Value 2,3 |
| Glucose (mg/dL) | −0.7 (−4.1, 2.7) | −0.7 (−4.2, 2.7) | −1.4 (−4.9, 2.2) | 0.488 |
| Insulin (μIU/mL) | −1.7 (−3.5, 0.1) | −1.1 (−2.9, 0.7) | −1.3 (−3.1, 0.6) | 0.426 |
| HOMA-IR | −0.7 (−1.3, −0.1) | −0.4 (−1.0, 0.2) | −0.5 (−1.1, 0.1) | 0.330 |
| HDL Cholesterol (mg/dL) | −0.6 (−2.7, 1.6) | −0.8 (−3.0, 1.4) | −0.1 (−2.4, 2.1) | 0.973 |
| Triglycerides (mg/dL) | 1.6 (−7.0, 10.3) | 4.9 (−3.8, 13.6) | 8.1 (−0.9, 17.0) | 0.057 |
| Systolic blood pressure (mm Hg) | −1.8 (−3.7, 0.2) | −1.0 (−3.0, 1.0) | −0.9 (−2.9, 1.1) | 0.770 |
| Metabolite Name 1 | Pathway | Sub-Pathway | Average β 2 | Count 3 |
|---|---|---|---|---|
| Beta-citrylglutamate | Amino acid | Glutamate metabolism | 0.140 | 61 |
| Carboxyethyl-GABA | Amino Acid | Glutamate Metabolism | 0.113 | 52 |
| N-acetyl-aspartyl-glutamate (NAAG) | Amino Acid | Glutamate Metabolism | 0.108 | 56 |
| N-acetylglutamate | Amino Acid | Glutamate Metabolism | −0.110 | 52 |
| Pyroglutamine * | Amino acid | Glutamate metabolism | 0.072 | 50 |
| Cys-gly, oxidized | Amino acid | Glutathione metabolism | 0.222 | 84 |
| Betaine | Amino acid | Glycine/serine/threonine metabolism | 0.212 | 44 |
| Dimethylglycine | Amino acid | Glycine/serine/threonine metabolism | −0.187 | 55 |
| Sarcosine | Amino acid | Glycine/serine/threonine metabolism | 0.147 | 58 |
| Threonine | Amino acid | Glycine/serine/threonine metabolism | −0.153 | 45 |
| 3-methylhistidine | Amino acid | Histidine metabolism | 0.026 | 43 |
| N-acetylhistidine | Amino Acid | Histidine metabolism | 0.434 | 89 |
| Trans-urocanate | Amino acid | Histidine metabolism | 0.065 | 50 |
| 2,3-dihydroxy-2-methylbutyrate | Amino acid | BCAA metabolism | 0.049 | 44 |
| 3-hydroxy-2-ethylpropionate | Amino acid | BCAA metabolism | −0.196 | 50 |
| 3-hydroxyisobutyrate | Amino acid | BCAA metabolism | 0.042 | 40 |
| 3-methyl-2-oxobutyrate | Amino acid | BCAA metabolism | 0.032 | 43 |
| 3-methylglutaconate | Amino acid | BCAA metabolism | −0.136 | 53 |
| Alpha-hydroxyisocaproate | Amino acid | BCAA metabolism | −0.197 | 59 |
| Isoleucine | Amino acid | BCAA metabolism | 0.338 | 45 |
| Isovalerylcarnitine (C5) | Amino Acid | BCAA metabolism | 0.157 | 63 |
| Isovalerylglycine | Amino acid | BCAA metabolism | 0.096 | 51 |
| 5-(galactosylhydroxy)-L-lysine | Amino Acid | Lysine Metabolism | −0.094 | 40 |
| 5-hydroxylysine | Amino acid | Lysine metabolism | 0.133 | 62 |
| Glutarylcarnitine (C5-DC) | Amino Acid | Lysine Metabolism | −0.280 | 89 |
| N,N,N-trimethyl-5-aminovalerate | Amino Acid | Lysine Metabolism | 0.157 | 55 |
| N6-acetyllysine | Amino Acid | Lysine Metabolism | −0.165 | 41 |
| Cysteine s-sulfate | Amino acid | Methionine/cysteine/SAM metabolism | 0.124 | 68 |
| Methionine sulfone | Amino acid | Methionine/cysteine/SAM metabolism | 0.071 | 42 |
| Taurine | Amino acid | Methionine/cysteine/SAM metabolism | 0.165 | 57 |
| (N(1) + N(8))-acetylspermidine | Amino Acid | Polyamine Metabolism | 0.122 | 44 |
| 4-acetamidobutanoate | Amino acid | Polyamine metabolism | −0.173 | 48 |
| Indoleacetate | Amino acid | Tryptophan metabolism | 0.066 | 53 |
| Indolepropionate | Amino acid | Tryptophan metabolism | −0.057 | 52 |
| Tryptophan betaine | Amino acid | Tryptophan metabolism | −0.045 | 62 |
| 3-methoxytyrosine | Amino acid | Tyrosine metabolism | 0.268 | 71 |
| N-acetyltyrosine | Amino Acid | Tyrosine Metabolism | −0.116 | 53 |
| P-cresol glucuronide * | Amino acid | Tyrosine metabolism | 0.030 | 42 |
| Phenol sulfate | Amino acid | Tyrosine metabolism | −0.003 | 40 |
| Thyroxine | Amino acid | Tyrosine metabolism | 0.090 | 42 |
| Tyramine O-sulfate | Amino Acid | Tyrosine Metabolism | 0.210 | 100 |
| Argininate * | Amino acid | Urea cycle; arginine/proline metabolism | −0.094 | 57 |
| N-acetylarginine | Amino Acid | Urea cycle; arginine/proline metabolism | −0.121 | 43 |
| N-methylproline | Amino Acid | Urea cycle; arginine/proline metabolism | −0.029 | 40 |
| N-acetylglucosamine/galactosamine | Carbohydrate | Amino sugar Metabolism | −0.136 | 42 |
| Mannitol/sorbitol | Carbohydrate | Hexose metabolism | −0.045 | 49 |
| Arabitol/xylitol | Carbohydrate | Pentose metabolism | −0.230 | 62 |
| Arabonate/xylonate | Carbohydrate | Pentose metabolism | −0.096 | 40 |
| Ribonate | Carbohydrate | Pentose metabolism | −0.094 | 41 |
| Ribulonate/xylulonate * | Carbohydrate | Pentose metabolism | 0.121 | 54 |
| Gulonate * | Cofactors | Ascorbate/aldarate metabolism | 0.144 | 55 |
| Threonate | Cofactors | Ascorbate/aldarate metabolism | 0.047 | 45 |
| 1-methylnicotinamide | Cofactors | Nicotinate/nicotinamide metabolism | 0.352 | 92 |
| Quinolinate | Cofactors | Nicotinate/nicotinamide metabolism | 0.070 | 44 |
| Trigonelline (N’-methylnicotinate) | Cofactors | Nicotinate/Nicotinamide Metabolism | −0.058 | 58 |
| Pantothenate | Cofactors | Pantothenate/CoA metabolism | −0.115 | 40 |
| Beta-cryptoxanthin | Cofactors | Vitamin A metabolism | −0.047 | 50 |
| Carotene diol (2) | Cofactors | Vitamin A metabolism | 0.110 | 41 |
| Retinol (Vitamin A) | Cofactors | Vitamin A Metabolism | −0.239 | 61 |
| Pyridoxate | Cofactors | Vitamin B6 metabolism | −0.084 | 47 |
| Deoxycarnitine | Lipid | Carnitine metabolism | −0.129 | 46 |
| Ceramide (d18:1/14:0, d16:1/16:0) * | Lipid | Ceramides | 0.115 | 50 |
| N-stearoyl-sphingadienine (d18:2/18:0) * | Lipid | Ceramides | −0.289 | 86 |
| Palmitoyl-arachidonoyl-glycerol (36:4) * | Lipid | Diacylglycerol | −0.067 | 45 |
| Palmitoyl-linoleoyl-glycerol (16:0/18:2) * | Lipid | Diacylglycerol | 0.096 | 44 |
| Stearoyl-arachidonoyl-glycerol (18:0/20:4) * | Lipid | Diacylglycerol | −0.079 | 41 |
| N-oleoylserine | Lipid | Endocannabinoid | 0.227 | 61 |
| Adipoylcarnitine (C6-DC) | Lipid | Fatty Acid Metabolism (Acyl Carnitine) | 0.085 | 55 |
| Laurylcarnitine (C12) | Lipid | Fatty Acid Metabolism (Acyl Carnitine) | 0.124 | 44 |
| Linolenoylcarnitine (C18:3) * | Lipid | Fatty Acid Metabolism (Acyl Carnitine) | 0.083 | 42 |
| 3-hydroxybutyroylglycine * | Lipid | Fatty acid metabolism (Acyl Glycine) | −0.066 | 50 |
| N-palmitoylglycine | Lipid | Fatty Acid Metabolism (Acyl Glycine) | −0.187 | 52 |
| Hexadecanedioate (C16-DC) | Lipid | Fatty Acid/Dicarboxylate | −0.124 | 50 |
| Hexadecenedioate (C16:1-DC) * | Lipid | Fatty Acid/Dicarboxylate | −0.252 | 65 |
| Octadecadienedioate (C18:2-DC) * | Lipid | Fatty Acid/Dicarboxylate | 0.107 | 67 |
| Sebacate (C10-DC) | Lipid | Fatty Acid/Dicarboxylate | −0.063 | 41 |
| Tetradecanedioate (C14-DC) | Lipid | Fatty Acid/Dicarboxylate | −0.317 | 77 |
| 12,13-dihome | Lipid | Fatty Acid/Dihydroxy | 0.063 | 41 |
| 2-hydroxylaurate | Lipid | Fatty acid/monohydroxy | 0.303 | 78 |
| 2-hydroxynervonate * | Lipid | Fatty acid/monohydroxy | 0.174 | 56 |
| Glycosyl ceramide (d38:1) * | Lipid | Hexosylceramides (HCER) | 0.339 | 79 |
| Glycosyl-N-stearoyl-sphingosine (d36:1) | Lipid | Hexosylceramides (HCER) | 0.160 | 43 |
| Lactosyl-N-behenoyl-sphingosine (d40:1) * | Lipid | Lactosylceramides (LCER) | −0.230 | 84 |
| Arachidate (20:0) | Lipid | Long chain fatty acid | 0.127 | 48 |
| Margarate (17:0) | Lipid | Long chain fatty acid | 0.217 | 44 |
| 1-linoleoyl-GPG (18:2) * | Lipid | Lysophospholipid | 0.091 | 41 |
| 1-arachidonylglycerol (20:4) | Lipid | Monoacylglycerol | 0.108 | 58 |
| 1-linolenoylglycerol (18:3) | Lipid | Monoacylglycerol | 0.182 | 84 |
| 1-oleoylglycerol (18:1) | Lipid | Monoacylglycerol | 0.105 | 47 |
| 2-arachidonoylglycerol (20:4) | Lipid | Monoacylglycerol | 0.083 | 56 |
| 1-myristoyl-2-arachidonoyl-GPC (34:4) * | Lipid | Phosphatidylcholine (PC) | −0.122 | 42 |
| 1-stearoyl-2-oleoyl-GPC (18:0/18:1) | Lipid | Phosphatidylcholine (PC) | 0.440 | 64 |
| 1,2-dipalmitoyl-GPC (16:0/16:0) | Lipid | Phosphatidylcholine (PC) | 0.466 | 57 |
| 1-palmitoyl-2-arachidonoyl-GPI (36:4) * | Lipid | Phosphatidylinositol (PI) | 0.199 | 66 |
| 1-(1-enyl-palmitoyl)-2-arachidonoyl-GPC (P-36:4) * | Lipid | Plasmalogen | 0.166 | 44 |
| 1-(1-enyl-palmitoyl)-2-palmitoleoyl-GPC (P-32:1) * | Lipid | Plasmalogen | −0.173 | 64 |
| Adrenate (22:4n6) | Lipid | Polyunsaturated fatty acid (n3/n6) | 0.117 | 52 |
| Glycochenodeoxycholate | Lipid | Primary bile acid metabolism | −0.035 | 41 |
| Taurocholate | Lipid | Primary bile acid metabolism | 0.057 | 54 |
| Glycolithocholate sulfate * | Lipid | Secondary bile acid metabolism | −0.044 | 45 |
| Lithocholate sulfate (1) | Lipid | Secondary bile acid metabolism | −0.037 | 42 |
| Sphinganine-1-phosphate | Lipid | Sphingolipid synthesis | −0.147 | 63 |
| Sphingomyelin (d43:1) * | Lipid | Sphingomyelins | −0.280 | 74 |
| Sphingomyelin (d42:4) * | Lipid | Sphingomyelins | 0.201 | 45 |
| 7-alpha-hydroxy-3-oxo-4-cholestenoate | Lipid | Sterol | −0.082 | 42 |
| Allantoin | Nucleotide | Purine metabolism: xanthine/inosine | −0.376 | 80 |
| Adenine | Nucleotide | Purine metabolism: adenine | −0.147 | 42 |
| Guanosine | Nucleotide | Purine metabolism: guanine | −0.145 | 97 |
| N2,N2-dimethylguanosine | Nucleotide | Purine Metabolism: guanine | 0.279 | 46 |
| Orotate | Nucleotide | Pyrimidine metabolism: orotate | −0.238 | 73 |
| Orotidine | Nucleotide | Pyrimidine metabolism: orotate | 0.073 | 41 |
| 3-aminoisobutyrate | Nucleotide | Pyrimidine metabolism: thymine | 0.059 | 46 |
| 5,6-dihydrothymine | Nucleotide | Pyrimidine metabolism: thymine | 0.181 | 65 |
| Leucylalanine | Peptide | Dipeptide | 0.044 | 47 |
| Gamma-glutamylcitrulline * | Peptide | Gamma-glutamyl amino acid | −0.056 | 42 |
| 3-methoxycatechol sulfate (1) | Xenobiotics | Benzoate metabolism | 0.082 | 81 |
| 3-phenylpropionate (hydrocinnamate) | Xenobiotics | Benzoate metabolism | −0.057 | 61 |
| 4-ethylphenylsulfate | Xenobiotics | Benzoate metabolism | 0.027 | 48 |
| 4-hydroxyhippurate | Xenobiotics | Benzoate metabolism | 0.087 | 52 |
| 4-methylguaiacol sulfate | Xenobiotics | Benzoate metabolism | 0.041 | 40 |
| Methyl-4-hydroxybenzoate sulfate | Xenobiotics | Benzoate metabolism | 0.046 | 75 |
| 2-naphthol sulfate | Xenobiotics | Chemical | 0.029 | 45 |
| 3-hydroxypyridine sulfate | Xenobiotics | Chemical | −0.042 | 45 |
| Perfluorooctanoate (PFOA) * | Xenobiotics | Chemical | −0.141 | 62 |
| Sulfate * | Xenobiotics | Chemical | 0.336 | 56 |
| Hydroquinone sulfate | Xenobiotics | Drug–topical agents | −0.185 | 92 |
| 2-isopropylmalate | Xenobiotics | Food component/plant | −0.064 | 47 |
| 2-piperidinone | Xenobiotics | Food component/plant | −0.040 | 52 |
| 2,3-dihydroxyisovalerate | Xenobiotics | Food component/plant | −0.050 | 52 |
| 3,4-methyleneheptanoate | Xenobiotics | Food component/plant | 0.059 | 50 |
| Ergothioneine | Xenobiotics | Food component/plant | −0.400 | 98 |
| Erythritol | Xenobiotics | Food component/plant | 0.110 | 51 |
| Glucuronide of piperine metabolite * | Xenobiotics | Food Component/Plant | −0.039 | 45 |
| Pyrraline | Xenobiotics | Food component/plant | −0.088 | 64 |
| Thymol sulfate | Xenobiotics | Food component/plant | −0.030 | 59 |
| 5-acetylamino-6-amino-3-methyluracil | Xenobiotics | Xanthine metabolism | 0.097 | 90 |
| Metabolite Name 1 | Pathway | Sub-Pathway | β (95% CI) 2 | p-Value 3 |
|---|---|---|---|---|
| Palmitoyl-linoleoyl-glycerol (16:0/18:2) * | Lipid | Diacylglycerol | 78.3 (66.3, 90.2) | <1.00 × 10⁻⁷ |
| Tetradecanedioate (C14-DC) | Lipid | Fatty Acid/Dicarboxylate | −35.9 (−51.2, −20.5) | 3.79 × 10⁻⁶ |
| Hexadecenedioate (C16:1-DC) * | Lipid | Fatty Acid/Dicarboxylate | −30.9 (−46.3, −15.6) | 8.35 × 10⁻⁵ |
| Hexadecanedioate (C16-DC) | Lipid | Fatty Acid/Dicarboxylate | −40.0 (−56.7, −23.2) | 8.47 × 10⁻⁶ |
| Sebacate (C10-DC) | Lipid | Fatty Acid/Dicarboxylate | −31.6 (−45.4, −17.8) | 6.15 × 10⁻⁶ |
| Lactosyl-N-behenoyl-sphingosine (d40:1) * | Lipid | Lactosylceramides (LCER) | −39.6 (−55.4, −23.8) | 1.23 × 10⁻⁶ |
| 1-linolenoylglycerol (18:3) | Lipid | Monoacylglycerol | 46.6 (35.6, 57.6) | <1.00 × 10⁻⁷ |
| 1-oleoylglycerol (18:1) | Lipid | Monoacylglycerol | 88.3 (73.9, 102.7) | <1.00 × 10⁻⁷ |
| 1-stearoyl-2-oleoyl-GPC (18:0/18:1) | Lipid | Phosphatidylcholine (PC) | 76.1 (47.7, 104.5) | 2.26 × 10⁻⁷ |
| 1-palmitoyl-2-arachidonoyl-GPI (36:4) * | Lipid | Phosphatidylinositol (PI) | 71.6 (56.6, 86.6) | <1.00 × 10⁻⁷ |
| 1-(1-enyl-palmitoyl)-2-palmitoleoyl-GPC (P-32:1) * | Lipid | Plasmalogen | −69.3 (−92.8, −45.7) | <1.00 × 10⁻⁷ |
Publisher’s Note: MDPI stays neutral with regard to jurisdictional claims in published maps and institutional affiliations. |
© 2022 by the authors. Licensee MDPI, Basel, Switzerland. This article is an open access article distributed under the terms and conditions of the Creative Commons Attribution (CC BY) license (https://creativecommons.org/licenses/by/4.0/).
Share and Cite
Cohen, C.C.; Dabelea, D.; Michelotti, G.; Tang, L.; Shankar, K.; Goran, M.I.; Perng, W. Metabolome Alterations Linking Sugar-Sweetened Beverage Intake with Dyslipidemia in Youth: The Exploring Perinatal Outcomes among CHildren (EPOCH) Study. Metabolites 2022, 12, 559. https://doi.org/10.3390/metabo12060559
Cohen CC, Dabelea D, Michelotti G, Tang L, Shankar K, Goran MI, Perng W. Metabolome Alterations Linking Sugar-Sweetened Beverage Intake with Dyslipidemia in Youth: The Exploring Perinatal Outcomes among CHildren (EPOCH) Study. Metabolites. 2022; 12(6):559. https://doi.org/10.3390/metabo12060559
Chicago/Turabian StyleCohen, Catherine C., Dana Dabelea, Gregory Michelotti, Lu Tang, Kartik Shankar, Michael I. Goran, and Wei Perng. 2022. "Metabolome Alterations Linking Sugar-Sweetened Beverage Intake with Dyslipidemia in Youth: The Exploring Perinatal Outcomes among CHildren (EPOCH) Study" Metabolites 12, no. 6: 559. https://doi.org/10.3390/metabo12060559
APA StyleCohen, C. C., Dabelea, D., Michelotti, G., Tang, L., Shankar, K., Goran, M. I., & Perng, W. (2022). Metabolome Alterations Linking Sugar-Sweetened Beverage Intake with Dyslipidemia in Youth: The Exploring Perinatal Outcomes among CHildren (EPOCH) Study. Metabolites, 12(6), 559. https://doi.org/10.3390/metabo12060559