
Monitoring Neurochemistry in Traumatic Brain Injury Patients Using Microdialysis Integrated with Biosensors: A Review

 , ,
, ,
Abstract
:
1. Introduction
2. Importance of Monitoring Brain Metabolism for TBI
2.1. Traumatic Brain Injury (TBI)
2.2. Cerebral Metabolism
2.3. Altered Cerebral Metabolism Due to TBI
3. Review of Sensor Technologies for Brain Metabolism
3.1. Cerebral Microdialysis
3.2. Current Standard for TBI Monitoring in the ICU
3.3. Introduction to Biosensors
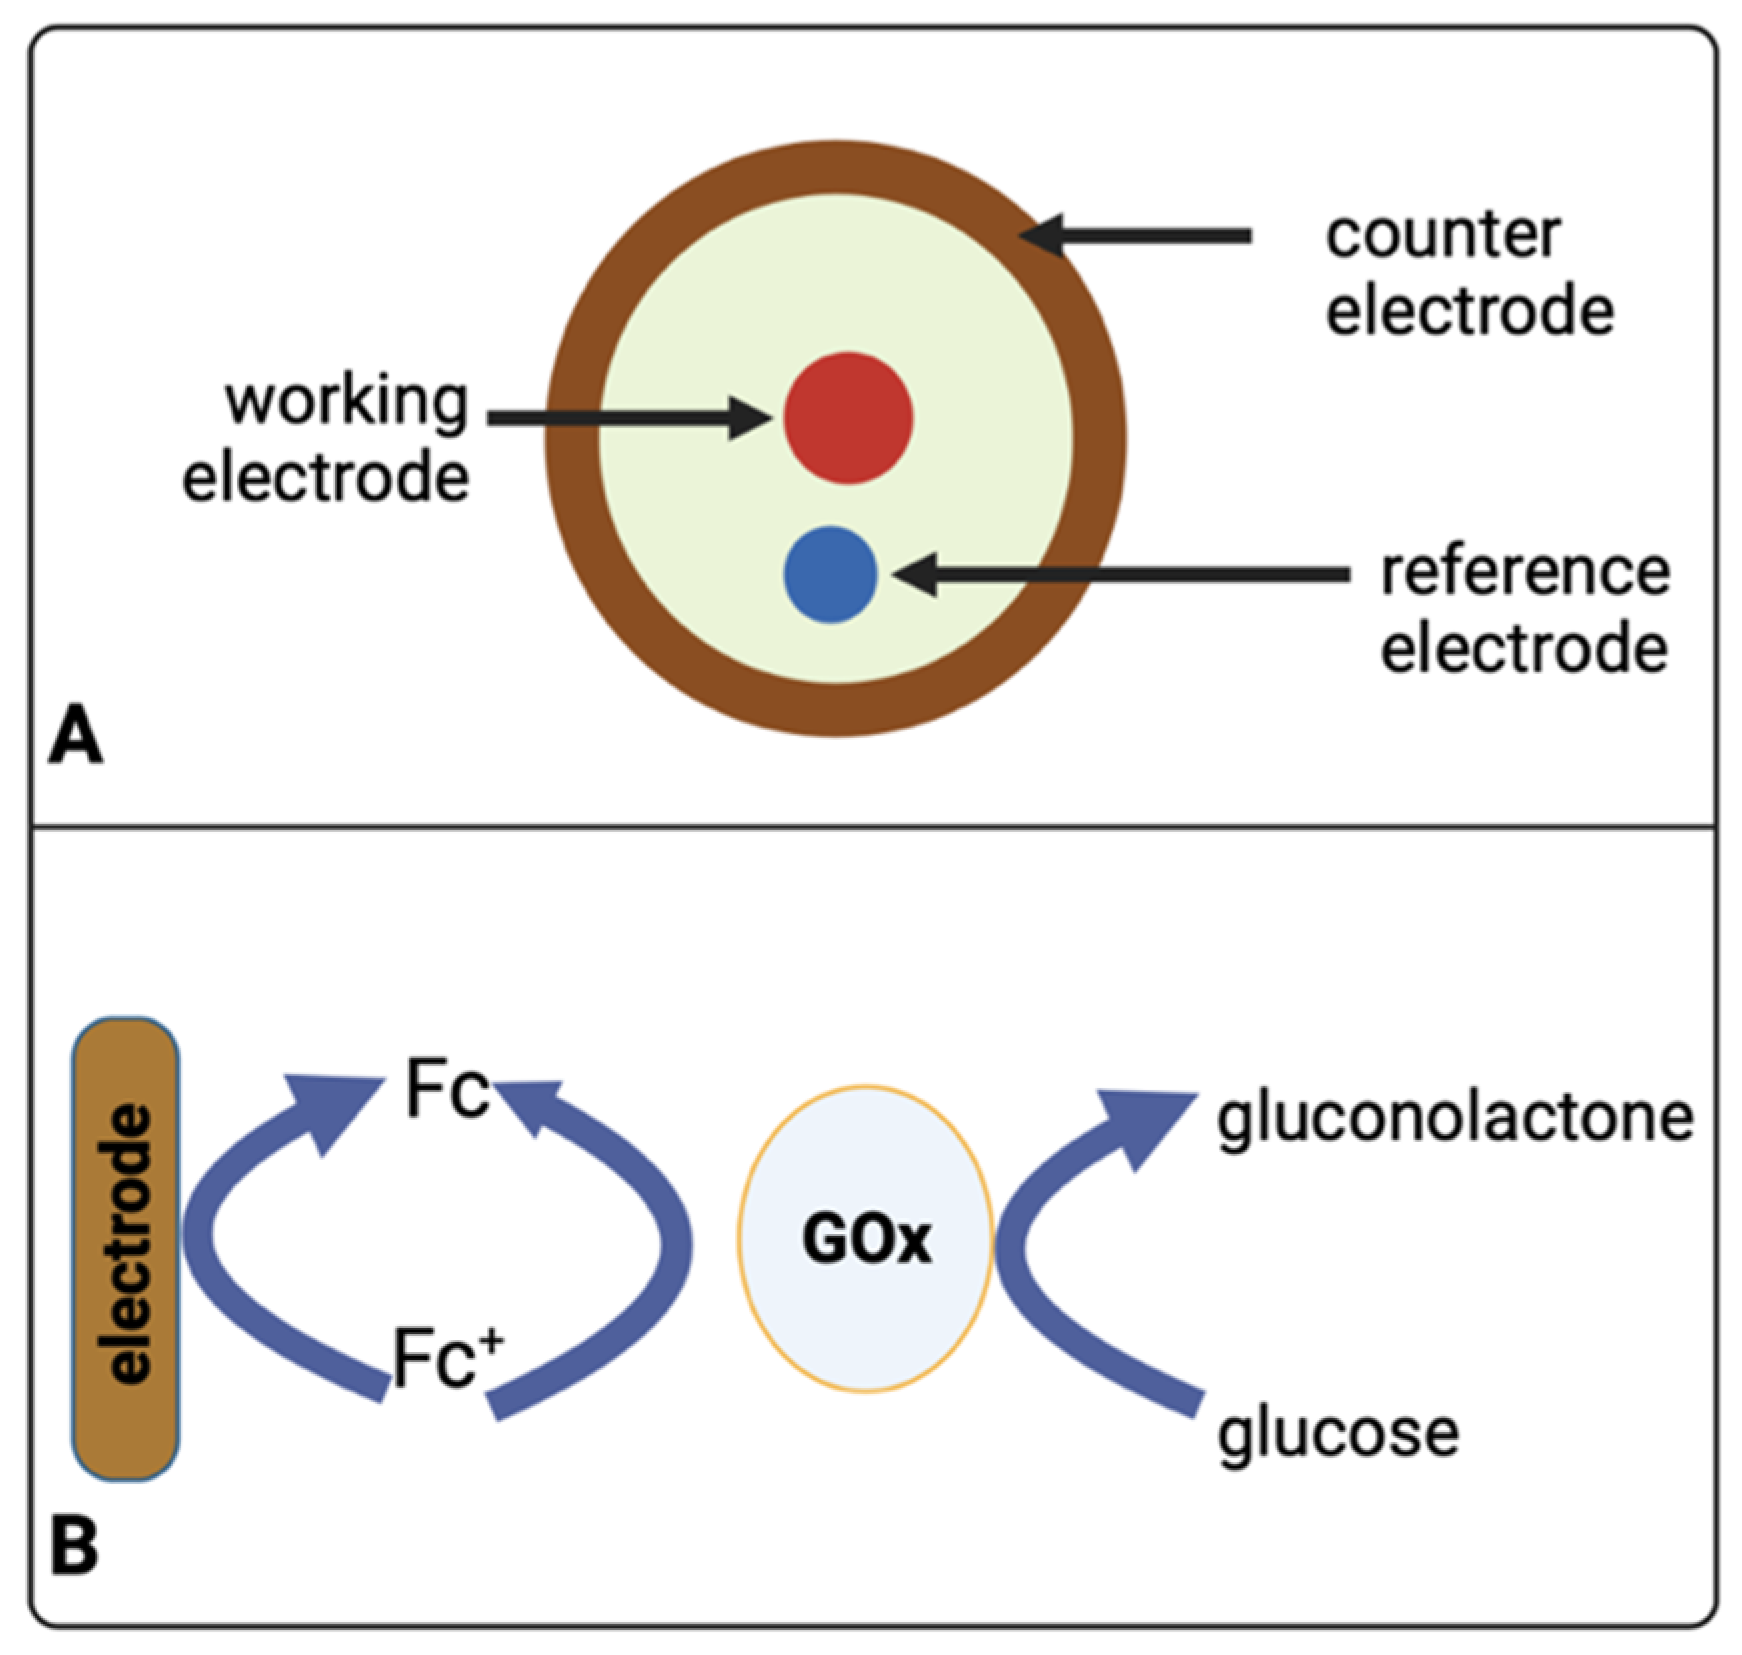
3.4. Electrochemical Sensors
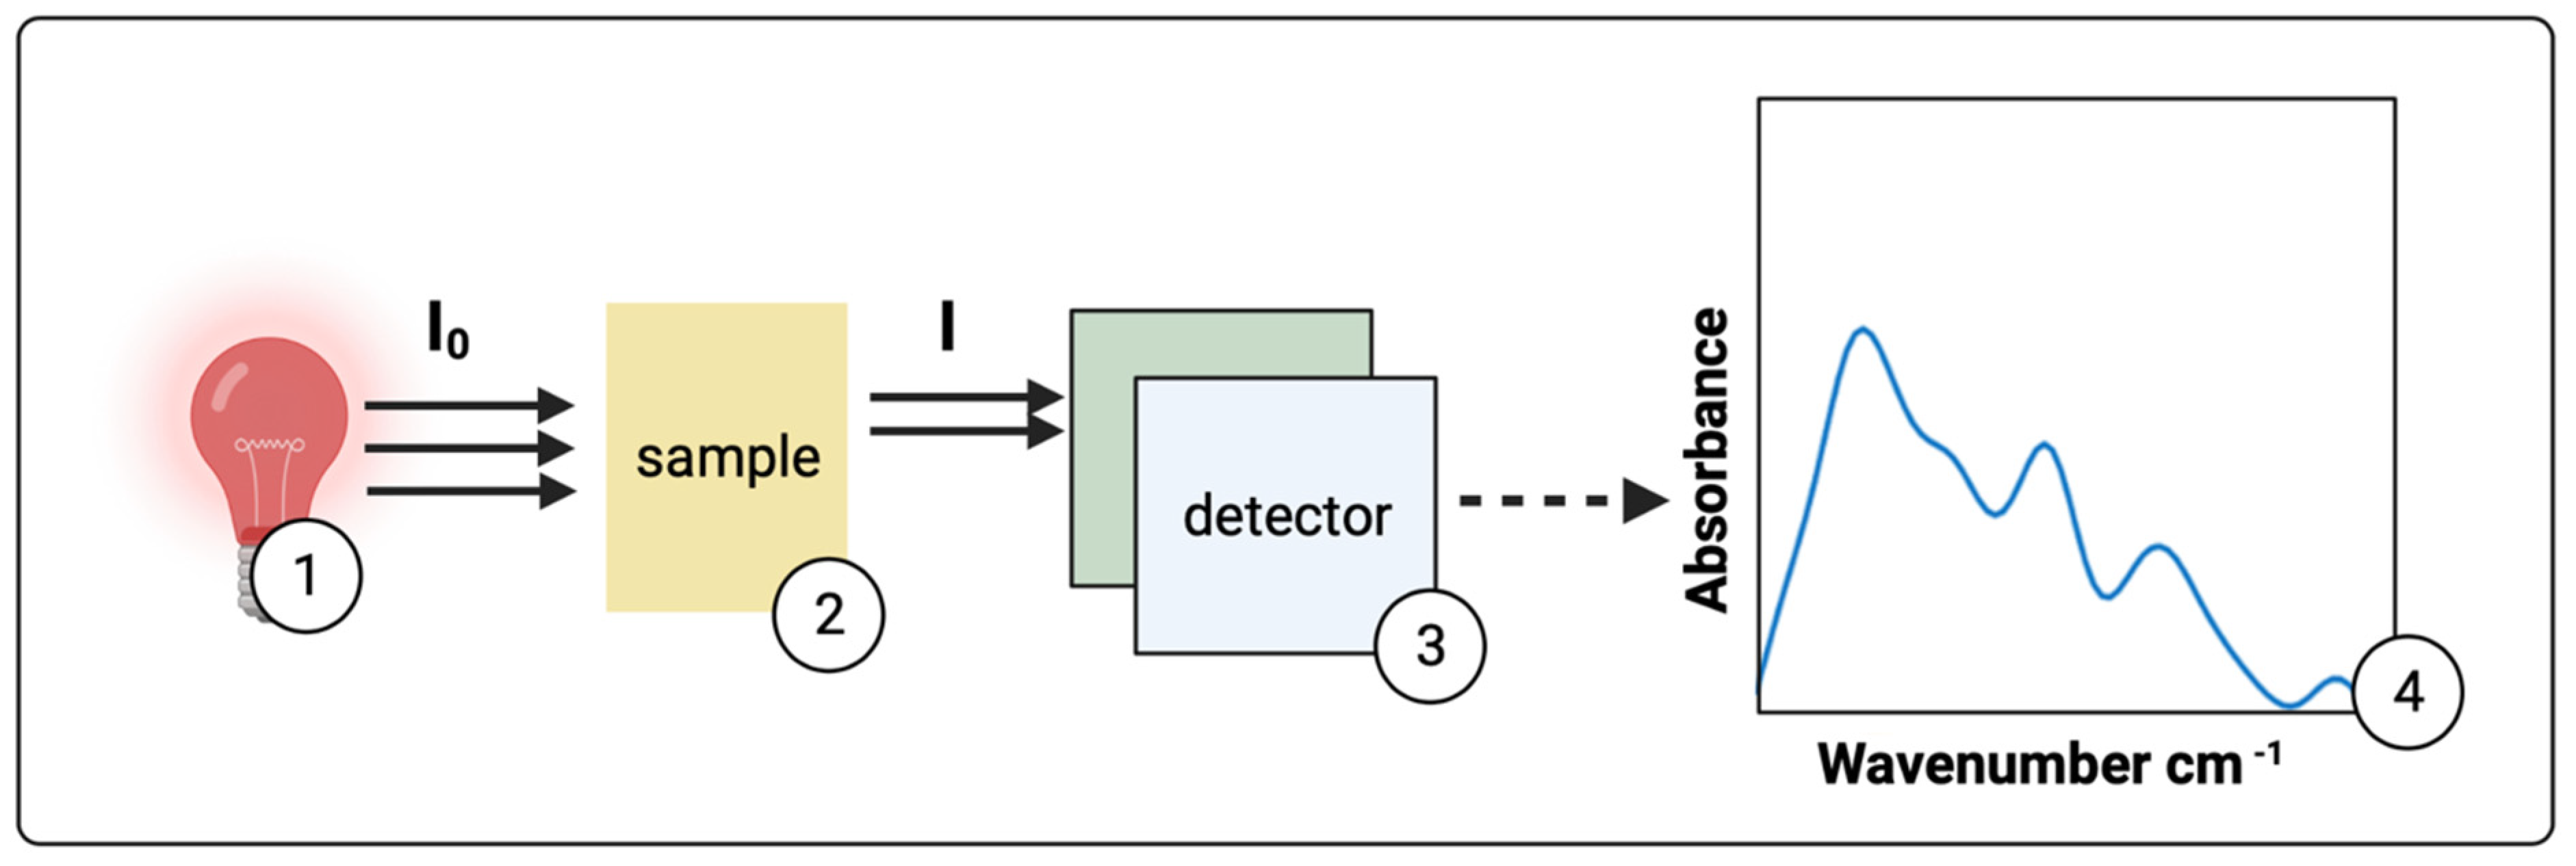
3.5. Optical Biosensors
4. Progress, Challenges, and Future Perspectives
5. Conclusions
Funding
Conflicts of Interest
Abbreviations
| TBI | Traumatic brain injury |
| ICP | Intracranial pressure |
| LPR | Lactate pyruvate ratio |
| PBtO2 | Brain tissue oxygen |
| ATP | Adenosine triphosphate |
| TCA | Tricarboxylic acid |
| PPP | Pentose phosphate pathway |
| NAD+ | Nicotinamide adenine dinucleotide (oxidised) |
| NADH | Nicotinamide adenine dinucleotide (reduced) |
| FAD | Flavin adenine dinucleotide (oxidised) |
| FADH2 | Flavin adenine dinucleotide (reduced) |
| LoD | Limits of detection |
| GOx | Glucose oxidase |
| MIR | Mid-infrared |
| CNS | Central nervous system |
| CPP | Cerebral perfusion pressure |
| PRx | Pressure reactivity index |
References
- Maas, A.I.R.; Menon, D.K.; Adelson, P.D.; Andelic, N.; Bell, M.J.; Belli, A.; Bragge, P.; Brazinova, A.; Büki, A.; Chesnut, R.M.; et al. Traumatic brain injury: Integrated approaches to improve prevention, clinical care, and research. Lancet Neurol. 2017, 16, 987–1048. [Google Scholar] [CrossRef] [Green Version]
- Dewan, M.C.; Rattani, A.; Gupta, S.; Baticulon, R.E.; Hung, Y.C.; Punchak, M.; Agrawal, A.; Adeleye, A.O.; Shrime, M.G.; Rubiano, A.M.; et al. Estimating the global incidence of traumatic brain injury. J. Neurosurg. 2018, 130, 1080–1097. [Google Scholar] [CrossRef] [PubMed] [Green Version]
- Barlow, K.M. Traumatic brain injury. Handb. Clin. Neurol. 2013, 112, 891–904. [Google Scholar] [CrossRef] [PubMed]
- Taylor, C.A.; Bell, J.M.; Breiding, M.J.; Xu, L. Traumatic Brain Injury-Related Emergency Department Visits, Hospitalizations, and Deaths-United States, 2007 and 2013. MMWR Surveill. Summ. 2017, 66, 1–16. [Google Scholar] [CrossRef]
- Vidgeon, S.D.; Strong, A.J. Multimodal Cerebral Monitoring in Traumatic Brain Injury. J. Intensive Care Soc. 2011, 12, 126–133. [Google Scholar] [CrossRef]
- Wijayatilake, D.S.; Shepherd, S.J. What’s new in the management of traumatic brain injury on neuro ICU? Curr. Opin. Anaesthesiol. 2014, 27, 459–464. [Google Scholar] [CrossRef]
- Carpenter, K.L.; Jalloh, I.; Gallagher, C.N.; Grice, P.; Howe, D.J.; Mason, A.; Timofeev, I.; Helmy, A.; Murphy, M.P.; Menon, D.K.; et al. 13C-labelled microdialysis studies of cerebral metabolism in TBI patients. Eur. J. Pharm. Sci. 2014, 57, 87–97. [Google Scholar] [CrossRef] [Green Version]
- Helmy, A.; Carpenter, K.L.; Hutchinson, P.J. Microdialysis in the human brain and its potential role in the development and clinical assessment of drugs. Curr. Med. Chem. 2007, 14, 1525–1537. [Google Scholar] [CrossRef]
- Menon, D.K.; Schwab, K.; Wright, D.W.; Maas, A.I. Position statement: Definition of traumatic brain injury. Arch. Phys. Med. Rehabil. 2010, 91, 1637–1640. [Google Scholar] [CrossRef]
- Ng, S.Y.; Lee, A.Y.W. Traumatic Brain Injuries: Pathophysiology and Potential Therapeutic Targets. Front. Cell. Neurosci. 2019, 13, 528. [Google Scholar] [CrossRef]
- Khellaf, A.; Khan, D.Z.; Helmy, A. Recent advances in traumatic brain injury. J. Neurol. 2019, 266, 2878–2889. [Google Scholar] [CrossRef] [PubMed] [Green Version]
- Chamoun, R.; Suki, D.; Gopinath, S.P.; Goodman, J.C.; Robertson, C. Role of extracellular glutamate measured by cerebral microdialysis in severe traumatic brain injury. J. Neurosurg. 2010, 113, 564–570. [Google Scholar] [CrossRef]
- Dyhrfort, P.; Shen, Q.; Clausen, F.; Thulin, M.; Enblad, P.; Kamali-Moghaddam, M.; Lewén, A.; Hillered, L. Monitoring of Protein Biomarkers of Inflammation in Human Traumatic Brain Injury Using Microdialysis and Proximity Extension Assay Technology in Neurointensive Care. J. Neurotrauma 2019, 36, 2872–2885. [Google Scholar] [CrossRef] [PubMed] [Green Version]
- Lassarén, P.; Lindblad, C.; Frostell, A.; Carpenter, K.L.H.; Guilfoyle, M.R.; Hutchinson, P.J.A.; Helmy, A.; Thelin, E.P. Systemic inflammation alters the neuroinflammatory response: A prospective clinical trial in traumatic brain injury. J. Neuroinflamm. 2021, 18, 221. [Google Scholar] [CrossRef] [PubMed]
- Di, X.; Lyeth, B.G.; Hamm, R.J.; Bullock, M.R. Voltage-dependent Na+/K+ ion channel blockade fails to ameliorate behavioral deficits after traumatic brain injury in the rat. J. Neurotrauma 1996, 13, 497–504. [Google Scholar] [CrossRef]
- Guilfoyle, M.R.; Carpenter, K.L.; Helmy, A.; Pickard, J.D.; Menon, D.K.; Hutchinson, P.J. Matrix Metalloproteinase Expression in Contusional Traumatic Brain Injury: A Paired Microdialysis Study. J. Neurotrauma 2015, 32, 1553–1559. [Google Scholar] [CrossRef] [Green Version]
- Timofeev, I.; Carpenter, K.L.H.; Nortje, J.; Al-Rawi, P.G.; O’Connell, M.T.; Czosnyka, M.; Smielewski, P.; Pickard, J.D.; Menon, D.K.; Kirkpatrick, P.J.; et al. Cerebral extracellular chemistry and outcome following traumatic brain injury: A microdialysis study of 223 patients. Brain 2011, 134, 484–494. [Google Scholar] [CrossRef]
- Dienel, G.A. Brain Glucose Metabolism: Integration of Energetics with Function. Physiol. Rev. 2019, 99, 949–1045. [Google Scholar] [CrossRef]
- McKenna, M.C.; Waagepetersen, H.S.; Schousboe, A.; Sonnewald, U. Neuronal and astrocytic shuttle mechanisms for cytosolic-mitochondrial transfer of reducing equivalents: Current evidence and pharmacological tools. Biochem. Pharm. 2006, 71, 399–407. [Google Scholar] [CrossRef]
- Rich, P.R.; Maréchal, A. The mitochondrial respiratory chain. Essays Biochem. 2010, 47, 1–23. [Google Scholar] [CrossRef] [Green Version]
- Berg, J.M.; Tymoczko, J.L.; Gatto, G.J., Jr.; Stryer, L. Biochemistry, 9th ed.; McMillan Learning: New York, NY, USA, 2019. [Google Scholar]
- Lodish, H.F.; Berk, A.; Kaiser, C.; Krieger, M.; Scott, M.P.; Bretscher, A.; Ploegh, H.L.; Matsudaira, P.T. Molecular Cell Biology, 6th ed.; W.H. Freeman: New York, NY, USA, 2008. [Google Scholar]
- Jalloh, I.; Carpenter, K.L.H.; Grice, P.; Howe, D.J.; Mason, A.; Gallagher, C.N.; Helmy, A.; Murphy, M.P.; Menon, D.K.; Carpenter, T.A.; et al. Glycolysis and the Pentose Phosphate Pathway after Human Traumatic Brain Injury: Microdialysis Studies Using 1,2-13C2 Glucose. J. Cereb. Blood Flow Metab. 2015, 35, 111–120. [Google Scholar] [CrossRef] [PubMed] [Green Version]
- Jalloh, I.; Helmy, A.; Howe, D.J.; Shannon, R.J.; Grice, P.; Mason, A.; Gallagher, C.N.; Murphy, M.P.; Pickard, J.D.; Menon, D.K.; et al. A Comparison of Oxidative Lactate Metabolism in Traumatically Injured Brain and Control Brain. J. Neurotrauma 2018, 35, 2025–2035. [Google Scholar] [CrossRef] [PubMed]
- Hutchinson, P.J.; Jalloh, I.; Helmy, A.; Carpenter, K.L.; Rostami, E.; Bellander, B.M.; Boutelle, M.G.; Chen, J.W.; Claassen, J.; Dahyot-Fizelier, C.; et al. Consensus statement from the 2014 International Microdialysis Forum. Intensive Care Med. 2015, 41, 1517–1528. [Google Scholar] [CrossRef] [PubMed] [Green Version]
- Gallagher, C.N.; Carpenter, K.L.; Grice, P.; Howe, D.J.; Mason, A.; Timofeev, I.; Menon, D.K.; Kirkpatrick, P.J.; Pickard, J.D.; Sutherland, G.R.; et al. The human brain utilizes lactate via the tricarboxylic acid cycle: A 13C-labelled microdialysis and high-resolution nuclear magnetic resonance study. Brain 2009, 132, 2839–2849. [Google Scholar] [CrossRef] [Green Version]
- Guilfoyle, M.R.; Helmy, A.; Donnelly, J.; Stovell, M.G.; Timofeev, I.; Pickard, J.D.; Czosnyka, M.; Smielewski, P.; Menon, D.K.; Carpenter, K.L.H.; et al. Characterising the dynamics of cerebral metabolic dysfunction following traumatic brain injury: A microdialysis study in 619 patients. PLoS ONE 2021, 16, e0260291. [Google Scholar] [CrossRef]
- Williamson, D.H.; Lund, P.; Krebs, H.A. The redox state of free nicotinamide-adenine dinucleotide in the cytoplasm and mitochondria of rat liver. Biochem. J. 1967, 103, 514–527. [Google Scholar] [CrossRef]
- Vespa, P.; Boonyaputthikul, R.; McArthur, D.L.; Miller, C.; Etchepare, M.; Bergsneider, M.; Glenn, T.; Martin, N.; Hovda, D. Intensive insulin therapy reduces microdialysis glucose values without altering glucose utilization or improving the lactate/pyruvate ratio after traumatic brain injury. Crit. Care Med. 2006, 34, 850–856. [Google Scholar] [CrossRef]
- Vespa, P.; McArthur, D.L.; Stein, N.; Huang, S.C.; Shao, W.; Filippou, M.; Etchepare, M.; Glenn, T.; Hovda, D.A. Tight glycemic control increases metabolic distress in traumatic brain injury: A randomized controlled within-subjects trial. Crit. Care Med. 2012, 40, 1923–1929. [Google Scholar] [CrossRef]
- Oddo, M.; Schmidt, J.M.; Carrera, E.; Badjatia, N.; Connolly, E.S.; Presciutti, M.; Ostapkovich, N.D.; Levine, J.M.; Le Roux, P.; Mayer, S.A. Impact of tight glycemic control on cerebral glucose metabolism after severe brain injury: A microdialysis study. Crit. Care Med. 2008, 36, 3233–3238. [Google Scholar] [CrossRef]
- Helbok, R.; Schmidt, J.M.; Kurtz, P.; Hanafy, K.A.; Fernandez, L.; Stuart, R.M.; Presciutti, M.; Ostapkovich, N.D.; Connolly, E.S.; Lee, K.; et al. Systemic glucose and brain energy metabolism after subarachnoid hemorrhage. Neurocrit. Care 2010, 12, 317–323. [Google Scholar] [CrossRef]
- Rostami, E.; Bellander, B.M. Monitoring of glucose in brain, adipose tissue, and peripheral blood in patients with traumatic brain injury: A microdialysis study. J. Diabetes Sci. Technol. 2011, 5, 596–604. [Google Scholar] [CrossRef] [PubMed] [Green Version]
- Tolias, C.M.; Reinert, M.; Seiler, R.; Gilman, C.; Scharf, A.; Bullock, M.R. Normobaric hyperoxia--induced improvement in cerebral metabolism and reduction in intracranial pressure in patients with severe head injury: A prospective historical cohort-matched study. J. Neurosurg. 2004, 101, 435–444. [Google Scholar] [CrossRef] [PubMed] [Green Version]
- Nortje, J.; Coles, J.P.; Timofeev, I.; Fryer, T.D.; Aigbirhio, F.I.; Smielewski, P.; Outtrim, J.G.; Chatfield, D.A.; Pickard, J.D.; Hutchinson, P.J.; et al. Effect of hyperoxia on regional oxygenation and metabolism after severe traumatic brain injury: Preliminary findings. Crit. Care Med. 2008, 36, 273–281. [Google Scholar] [CrossRef]
- Rockswold, S.B.; Rockswold, G.L.; Zaun, D.A.; Liu, J. A prospective, randomized Phase II clinical trial to evaluate the effect of combined hyperbaric and normobaric hyperoxia on cerebral metabolism, intracranial pressure, oxygen toxicity, and clinical outcome in severe traumatic brain injury. J. Neurosurg. 2013, 118, 1317–1328. [Google Scholar] [CrossRef] [PubMed] [Green Version]
- Marion, D.W.; Puccio, A.; Wisniewski, S.R.; Kochanek, P.; Dixon, C.E.; Bullian, L.; Carlier, P. Effect of hyperventilation on extracellular concentrations of glutamate, lactate, pyruvate, and local cerebral blood flow in patients with severe traumatic brain injury. Crit. Care Med. 2002, 30, 2619–2625. [Google Scholar] [CrossRef] [PubMed]
- Hutchinson, P.J.; Gupta, A.K.; Fryer, T.F.; Al-Rawi, P.G.; Chatfield, D.A.; Coles, J.P.; O’Connell, M.T.; Kett-White, R.; Minhas, P.S.; Aigbirhio, F.I.; et al. Correlation between Cerebral Blood Flow, Substrate Delivery, and Metabolism in Head Injury: A Combined Microdialysis and Triple Oxygen Positron Emission Tomography Study. J. Cereb. Blood Flow Metab. 2002, 22, 735–745. [Google Scholar] [CrossRef] [Green Version]
- Sakowitz, O.W.; Stover, J.F.; Sarrafzadeh, A.S.; Unterberg, A.W.; Kiening, K.L. Effects of mannitol bolus administration on intracranial pressure, cerebral extracellular metabolites, and tissue oxygenation in severely head-injured patients. J. Trauma 2007, 62, 292–298. [Google Scholar] [CrossRef]
- Chiu, C.; Xian, W.; Moss, C.F. Flying in silence: Echolocating bats cease vocalizing to avoid sonar jamming. Proc. Natl. Acad. Sci. USA 2008, 105, 13116–13121. [Google Scholar] [CrossRef] [Green Version]
- Soukup, J.; Zauner, A.; Doppenberg, E.M.; Menzel, M.; Gilman, C.; Bullock, R.; Young, H.F. Relationship between brain temperature, brain chemistry and oxygen delivery after severe human head injury: The effect of mild hypothermia. Neurol. Res. 2002, 24, 161–168. [Google Scholar] [CrossRef]
- Berger, C.; Schäbitz, W.R.; Georgiadis, D.; Steiner, T.; Aschoff, A.; Schwab, S. Effects of hypothermia on excitatory amino acids and metabolism in stroke patients: A microdialysis study. Stroke 2002, 33, 519–524. [Google Scholar] [CrossRef] [Green Version]
- Ho, C.L.; Wang, C.M.; Lee, K.K.; Ng, I.; Ang, B.T. Cerebral oxygenation, vascular reactivity, and neurochemistry following decompressive craniectomy for severe traumatic brain injury. J. Neurosurg. 2008, 108, 943–949. [Google Scholar] [CrossRef] [PubMed]
- Nagel, A.; Graetz, D.; Schink, T.; Frieler, K.; Sakowitz, O.; Vajkoczy, P.; Sarrafzadeh, A. Relevance of intracranial hypertension for cerebral metabolism in aneurysmal subarachnoid hemorrhage. Clinical article. J. Neurosurg. 2009, 111, 94–101. [Google Scholar] [CrossRef] [PubMed]
- Papadimitriou, K.I.; Wang, C.; Rogers, M.L.; Gowers, S.A.N.; Leong, C.L.; Boutelle, M.G.; Drakakis, E.M. High-Performance Bioinstrumentation for Real-Time Neuroelectrochemical Traumatic Brain Injury Monitoring. Front. Hum. Neurosci. 2016, 10, 212. [Google Scholar] [CrossRef] [PubMed] [Green Version]
- Pagkalos, I.; Rogers, M.; Boutelle, M.; Drakakis, E. A Higà Performance Application Specific Integrated Circuit for Electrical and Neurochemical Traumatic Brain Injury Monitoring. Chemphyschem 2018, 19, 1215–1225. [Google Scholar] [CrossRef] [PubMed]
- Tageldeen, M.K.; Gowers, S.A.N.; Leong, C.L.; Boutelle, M.G.; Drakakis, E.M. Traumatic brain injury neuroelectrochemical monitoring: Behind-the-ear micro-instrument and cloud application. J. Neuroeng. Rehabil. 2020, 17, 114. [Google Scholar] [CrossRef]
- Robbins, E.M.; Jaquins-Gerstl, A.; Fine, D.F.; Leong, C.L.; Dixon, C.E.; Wagner, A.K.; Boutelle, M.G.; Michael, A.C. Extended (10-Day) Real-Time Monitoring by Dexamethasone-Enhanced Microdialysis in the Injured Rat Cortex. ACS Chem. Neurosci. 2019, 10, 3521–3531. [Google Scholar] [CrossRef]
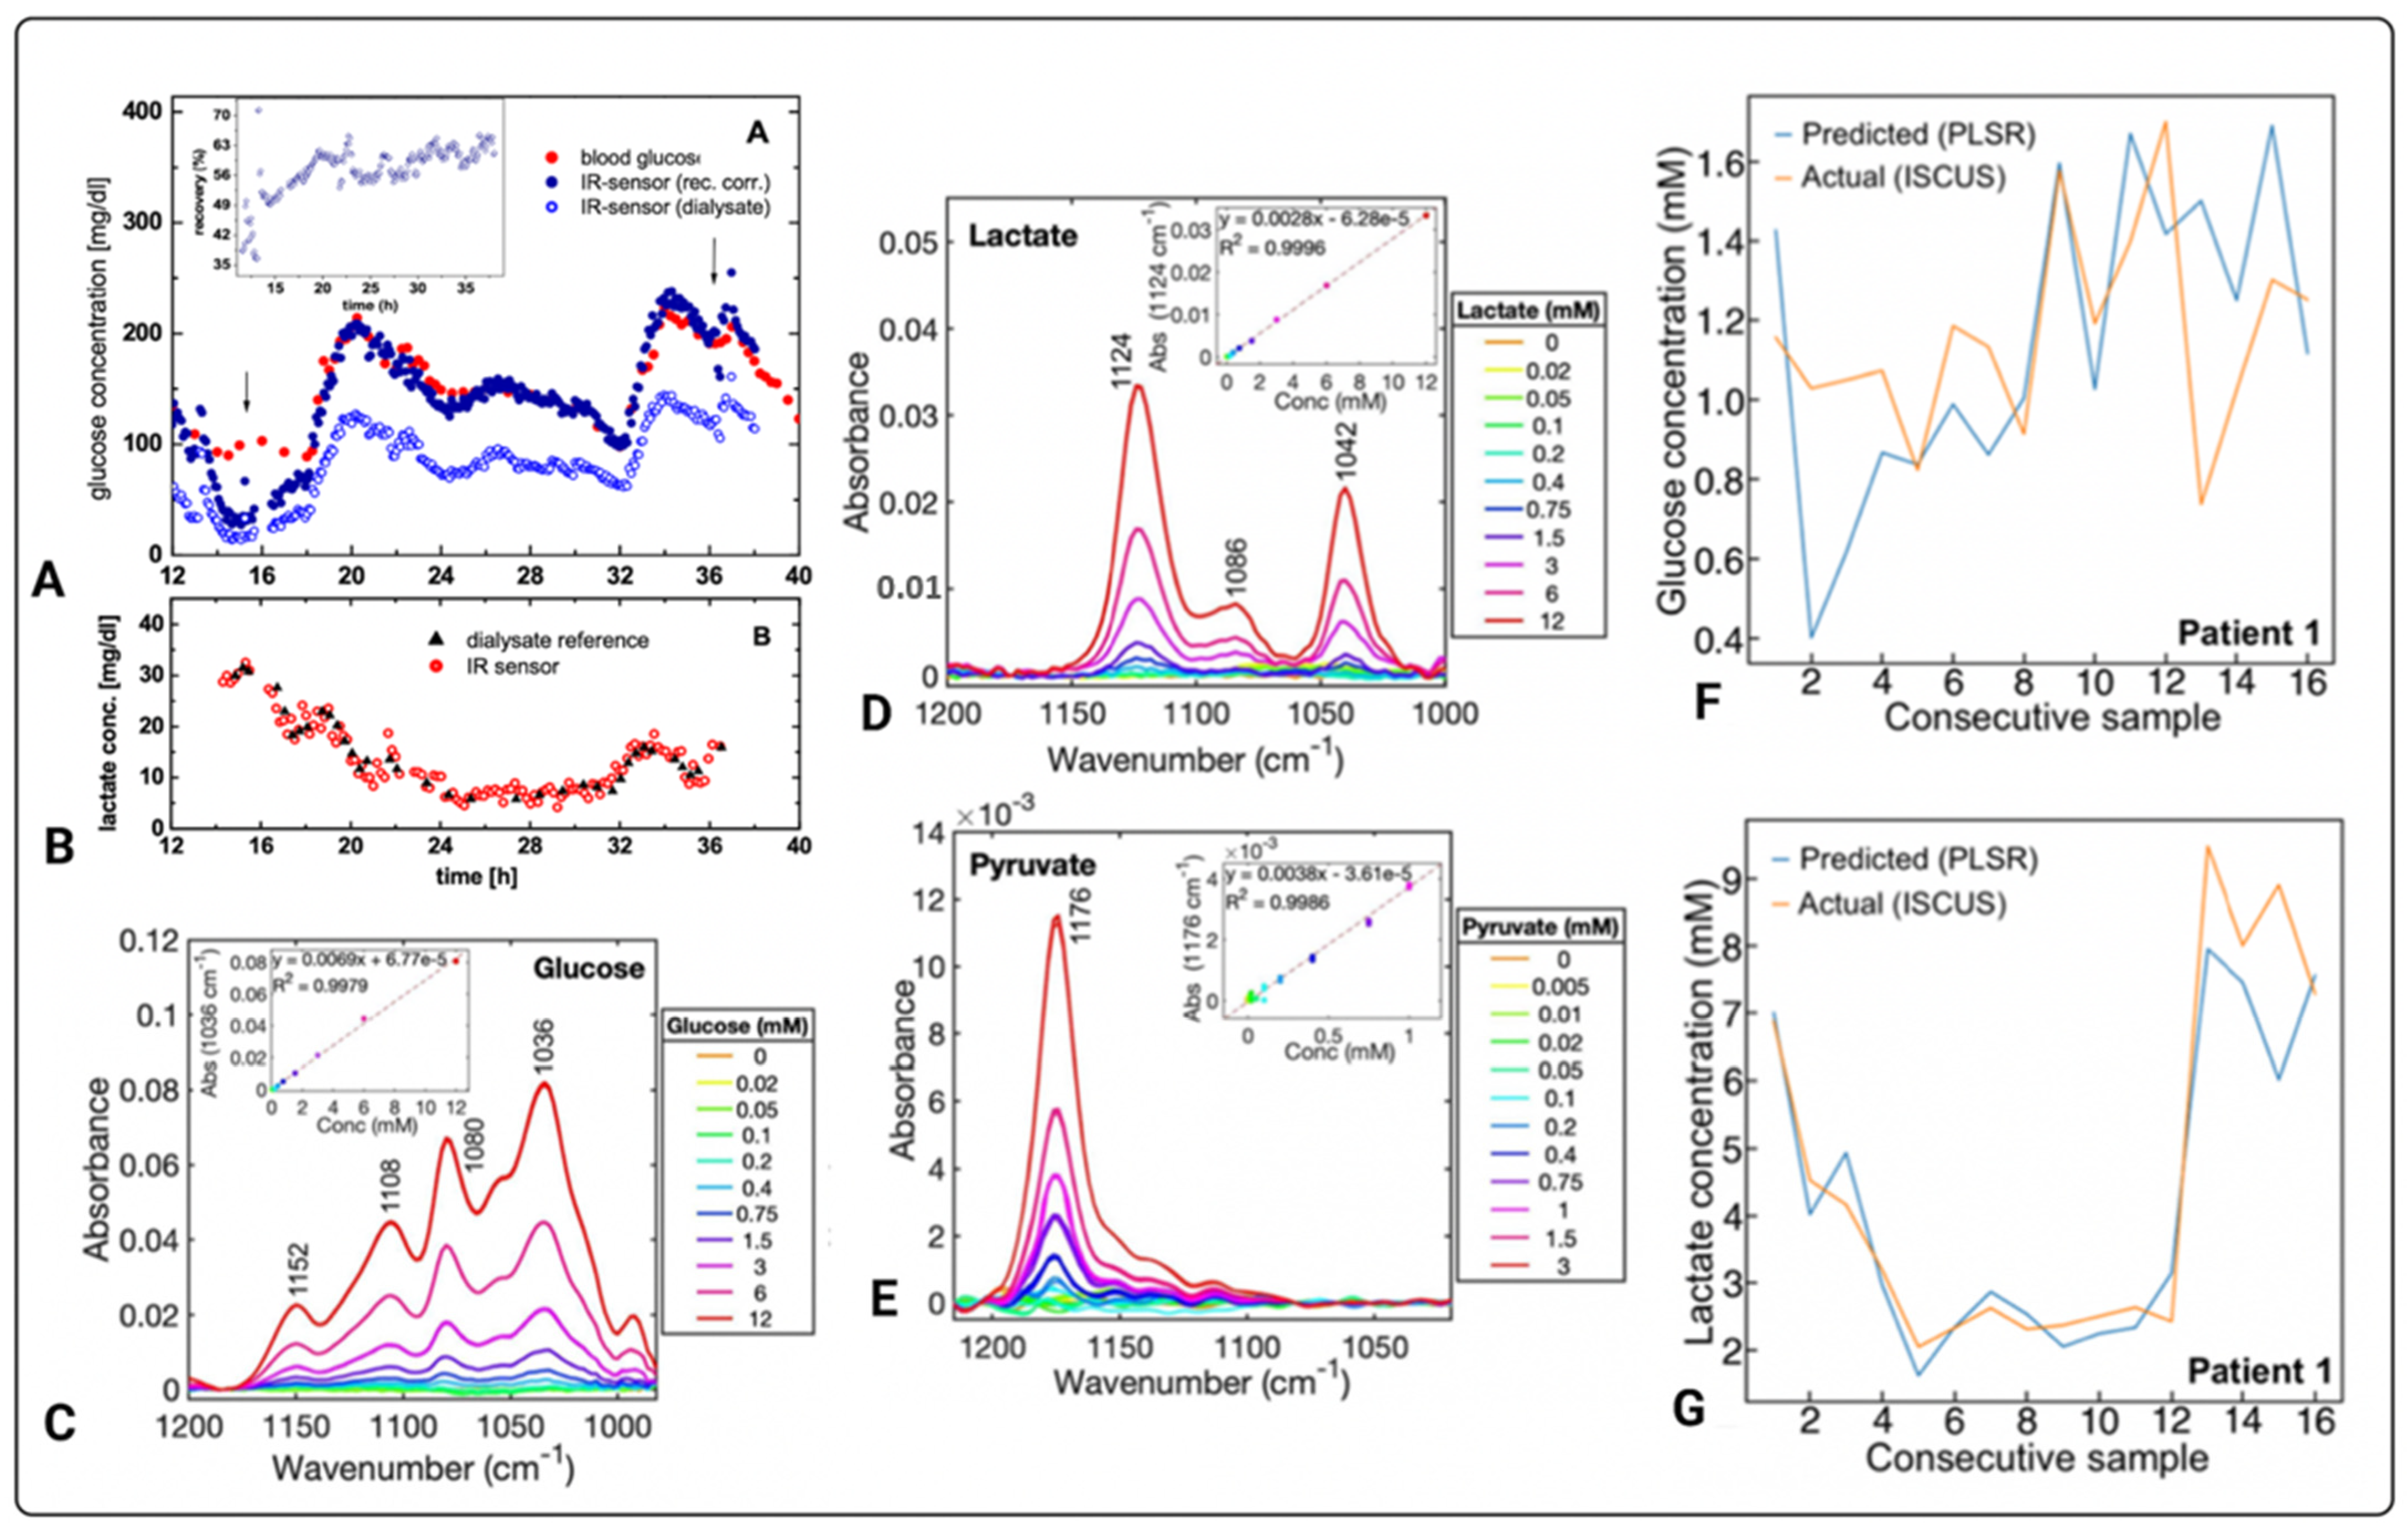
- Alimagham, F.C.; Hutter, D.; Marco-García, N.; Gould, E.; Highland, V.H.; Huefner, A.; Giorgi-Coll, S.; Killen, M.J.; Zakrzewska, A.P.; Elliott, S.R.; et al. Cerebral Microdialysate Metabolite Monitoring using Mid-infrared Spectroscopy. Anal. Chem. 2021, 93, 11929–11936. [Google Scholar] [CrossRef]
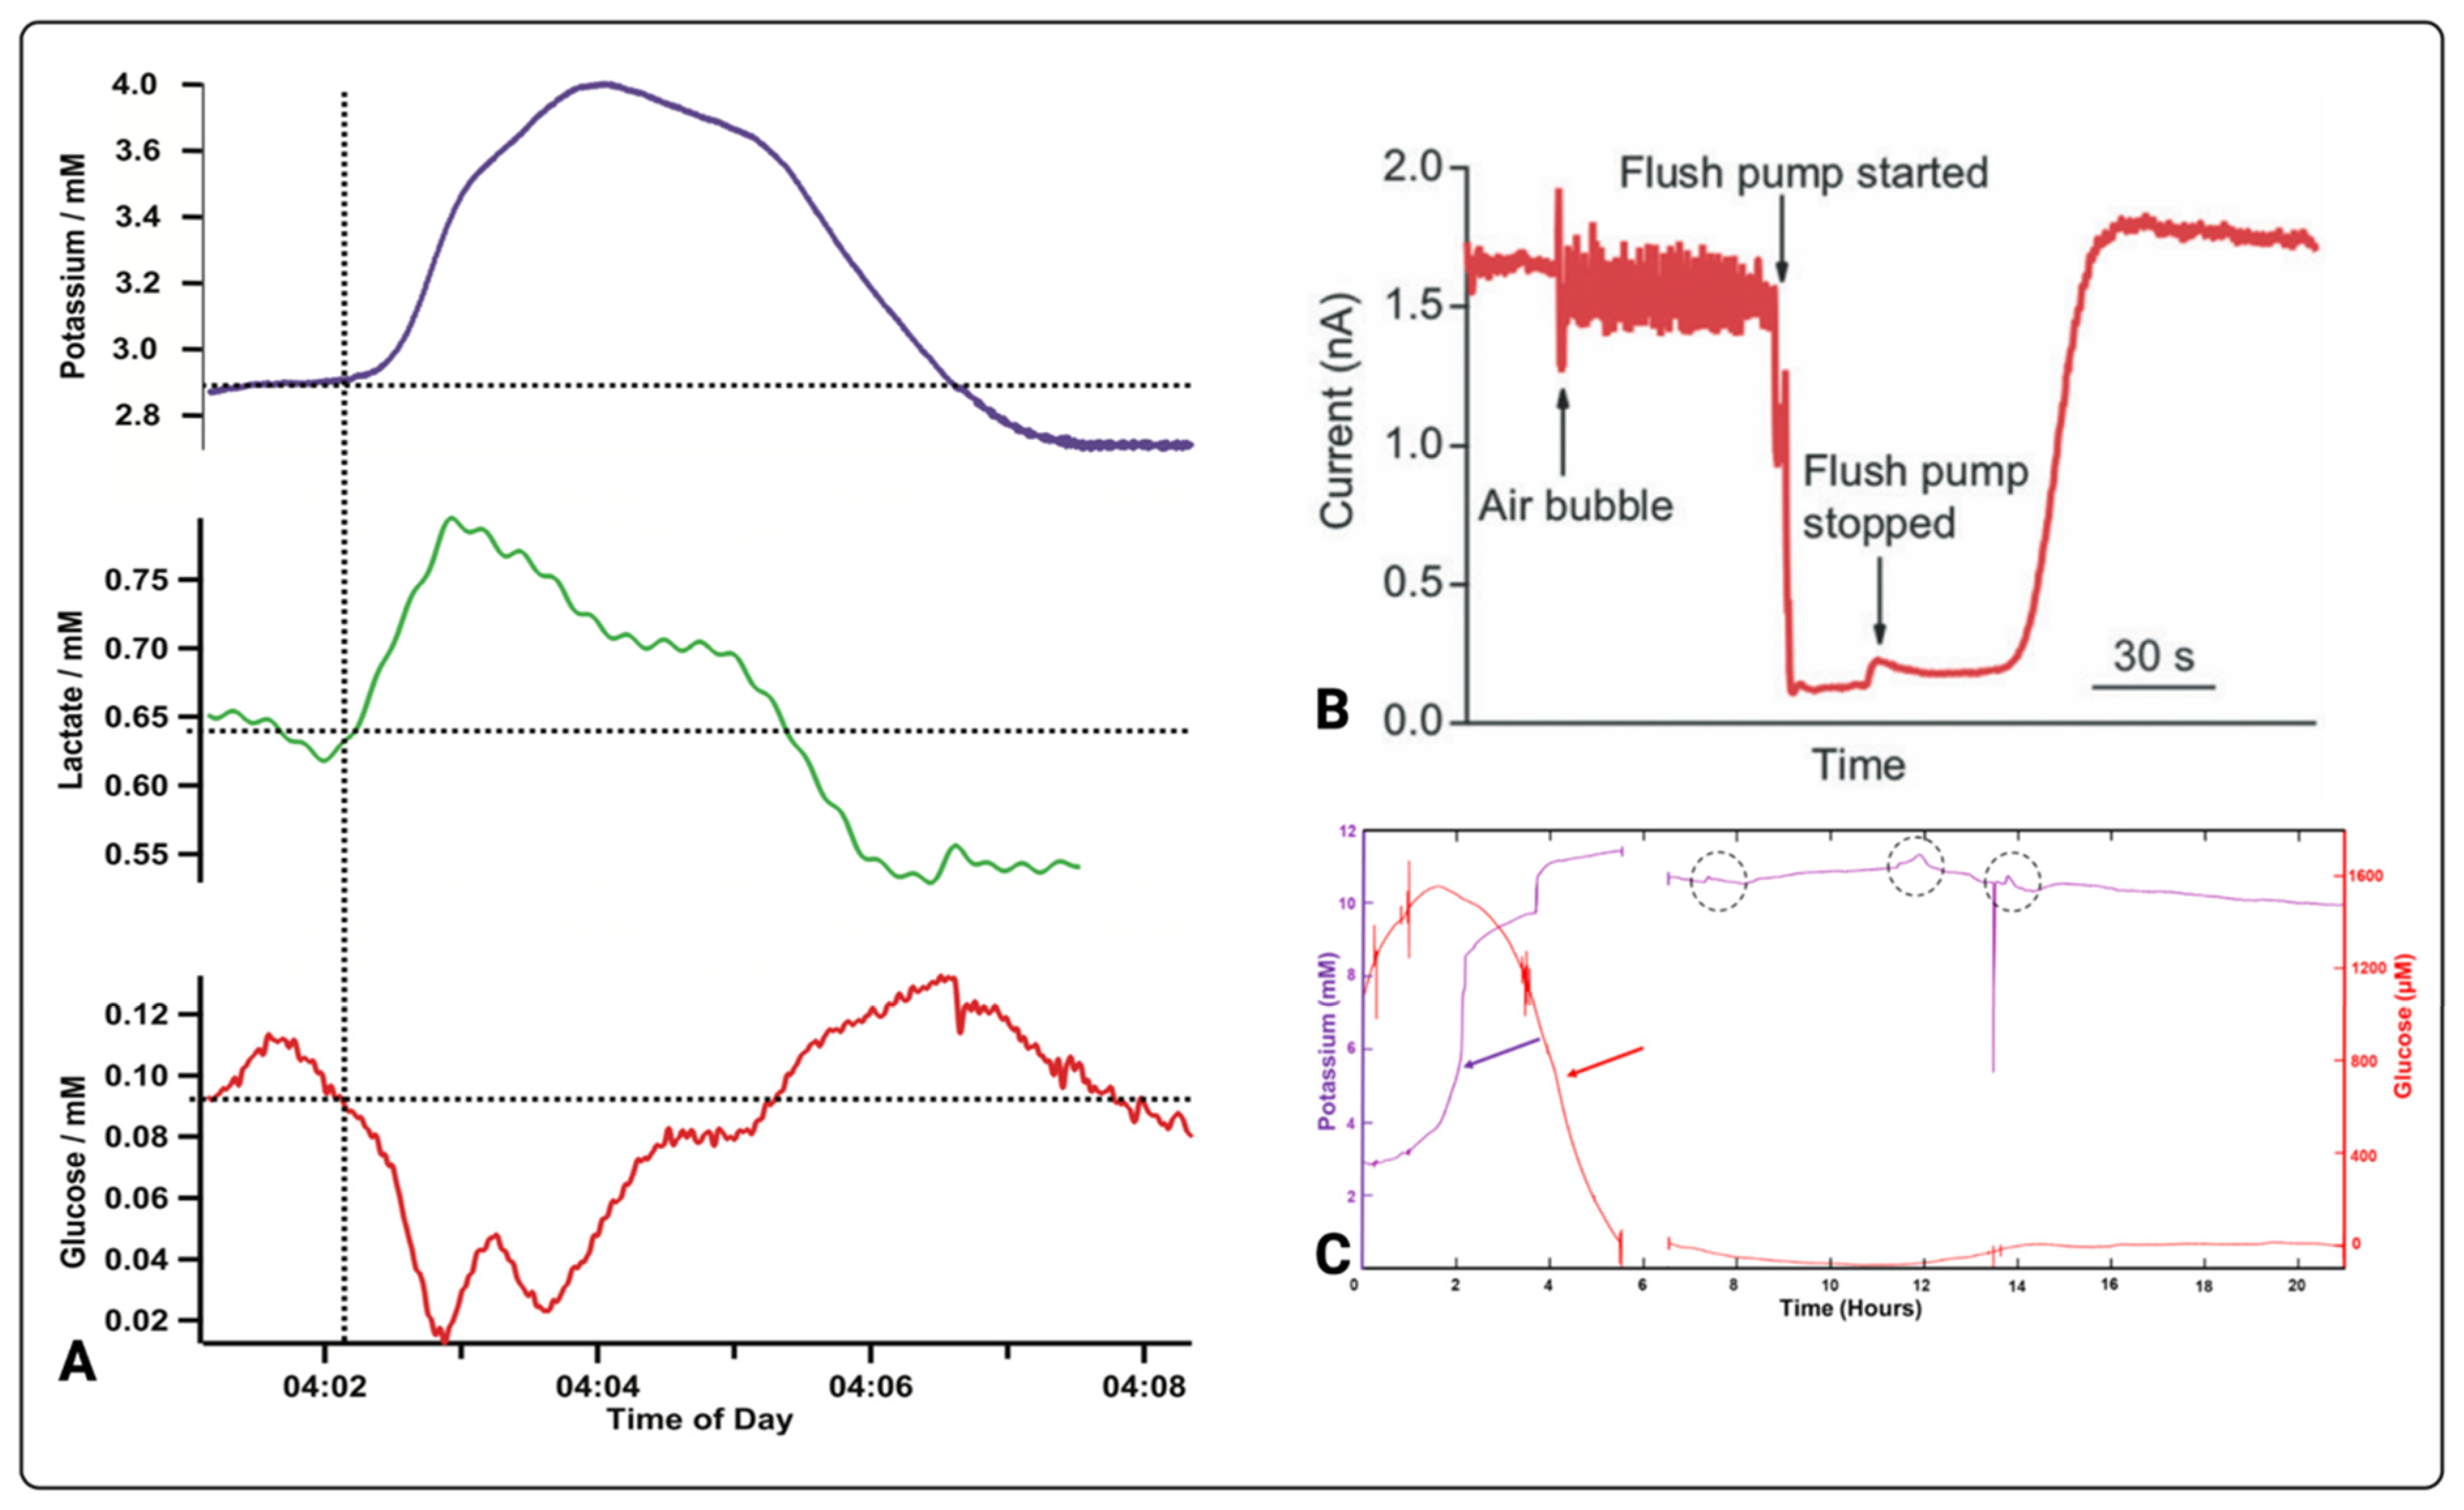
- Rogers, M.L.; Leong, C.L.; Gowers, S.A.; Samper, I.C.; Jewell, S.L.; Khan, A.; McCarthy, L.; Pahl, C.; Tolias, C.M.; Walsh, D.C.; et al. Simultaneous monitoring of potassium, glucose and lactate during spreading depolarization in the injured human brain–Proof of principle of a novel real-time neurochemical analysis system, continuous online microdialysis. J. Cereb. Blood Flow Metab. 2017, 37, 1883–1895. [Google Scholar] [CrossRef]
- Gifford, E.K.; Robbins, E.M.; Jaquins-Gerstl, A.; Rerick, M.T.; Nwachuku, E.L.; Weber, S.G.; Boutelle, M.G.; Okonkwo, D.O.; Puccio, A.M.; Michael, A.C. Validation of Dexamethasone-Enhanced Continuous-Online Microdialysis for Monitoring Glucose for 10 Days after Brain Injury. ACS Chem. Neurosci. 2021, 12, 3588–3597. [Google Scholar] [CrossRef]
- Hutchinson, P.J. Microdialysis in traumatic brain injury--methodology and pathophysiology. Acta Neurochir. Suppl. 2005, 95, 441–445. [Google Scholar] [CrossRef]
- Shannon, R.J.; Carpenter, K.L.; Guilfoyle, M.R.; Helmy, A.; Hutchinson, P.J. Cerebral microdialysis in clinical studies of drugs: Pharmacokinetic applications. J. Pharm. Pharm. 2013, 40, 343–358. [Google Scholar] [CrossRef] [PubMed] [Green Version]
- Hutchinson, P.J.; O’Connell, M.T.; Al-Rawi, P.G.; Maskell, L.B.; Kett-White, R.; Gupta, A.K.; Richards, H.K.; Hutchinson, D.B.; Kirkpatrick, P.J.; Pickard, J.D. Clinical cerebral microdialysis: A methodological study. J. Neurosurg. 2000, 93, 37–43. [Google Scholar] [CrossRef] [PubMed]
- Bhalla, N.; Jolly, P.; Formisano, N.; Estrela, P. Introduction to biosensors. Essays Biochem. 2016, 60, 1–8. [Google Scholar] [CrossRef] [PubMed] [Green Version]
- Adeel, M.; Rahman, M.M.; Caligiuri, I.; Canzonieri, V.; Rizzolio, F.; Daniele, S. Recent advances of electrochemical and optical enzyme-free glucose sensors operating at physiological conditions. Biosens. Bioelectron. 2020, 165, 112331. [Google Scholar] [CrossRef] [PubMed]
- Śmietana, M.; Koba, M.; Sezemsky, P.; Szot-Karpińska, K.; Burnat, D.; Stranak, V.; Niedziółka-Jönsson, J.; Bogdanowicz, R. Simultaneous optical and electrochemical label-free biosensing with ITO-coated lossy-mode resonance sensor. Biosens. Bioelectron. 2020, 154, 112050. [Google Scholar] [CrossRef]
- Pejcic, B.; Marco, R.D.; Parkinson, G. The role of biosensors in the detection of emerging infectious diseases. Analyst 2006, 131, 1079–1090. [Google Scholar] [CrossRef]
- Bergveld, P. The future of biosensors. Sens. Actuators A Phys. 1996, 56, 65–73. [Google Scholar] [CrossRef] [Green Version]
- Chan, K.M.; Gleadle, J.M.; O’Callaghan, M.; Vasilev, K.; MacGregor, M. Prostate cancer detection: A systematic review of urinary biosensors. Prostate Cancer Prostatic Dis. 2022, 25, 39–46. [Google Scholar] [CrossRef]
- Kristoffersson, A.; Lindén, M. A Systematic Review of Wearable Sensors for Monitoring Physical Activity. Sensor 2022, 22, 573. [Google Scholar] [CrossRef]
- Sharifianjazi, F.; Jafari Rad, A.; Bakhtiari, A.; Niazvand, F.; Esmaeilkhanian, A.; Bazli, L.; Abniki, M.; Irani, M.; Moghanian, A. Biosensors and nanotechnology for cancer diagnosis (lung and bronchus, breast, prostate, and colon): A systematic review. Biomed. Mater. 2021, 17, 012002. [Google Scholar] [CrossRef]
- Roda, A.; Girotti, S.; Grigolo, B.; Ghini, S.; Carrea, G.; Bovara, R.; Zini, I.; Grimaldi, R. Microdialysis and luminescent probe: Analytical and clinical aspects. Biosens. Bioelectron. 1991, 6, 21–29. [Google Scholar] [CrossRef]
- Heise, H.M.; Cocchieri, L.; Vahlsing, T.; Ihrig, D.F.; Elm, J. Monitoring of interstitial buffer systems using micro-dialysis and infrared spectrometry. In Proceedings of the Optical Diagnostics and Sensing XVII: Toward Point-of-Care Diagnostics, San Francisco, CA, USA, 28 January–2 February 2017; SPIE: Bellingham, WA, USA, 2017; Volume 10072. [Google Scholar] [CrossRef]
- Heise, H.M.; Damm, U.; Bodenlenz, M.; Kondepati, V.R.; Köhler, G.; Ellmerer, M. Bedside monitoring of subcutaneous interstitial glucose in healthy individuals using microdialysis and infrared spectrometry. J. Biomed. Opt. 2007, 12, 024004. [Google Scholar] [CrossRef] [PubMed]
- Heise, H.M.; Kondepati, V.R.; Damm, U.; Licht, M.; Feichtner, F.; Mader, J.K.; Ellmerer, M. Microdialysis Based Monitoring of Subcutaneous Interstitial and Venous Blood Glucose in Type 1 Diabetic Subjects by Mid-Infrared Spectrometry for Intensive Insulin Therapy. In Proceedings of the Optical Diagnostics and Sensing VIII, San Francisco, CA, USA, 19–24 January 2008; SPIE: Bellingham, WA, USA, 2008; Volume 6863. [Google Scholar] [CrossRef]
- Vahlsing, T.; Delbeck, S.; Budde, J.; Cocchieri, L.; Ihrig, D.; Leonhardt, S.; Heise, H. Ex-Vivo Glucose Sensors Using Micro-Dialysis: Importance of On-Line Recovery Rate Determination by Multi-Analyte Infrared Spectrometry. In Proceedings of the Optical Diagnostics and Sensing XV: Toward Point-of-Care Diagnostics, San Francisco, CA, USA, 7–12 February 2015; SPIE: Bellingham, WA, USA, 2015; Volume 9332. [Google Scholar] [CrossRef]
- Vahlsing, T.; Delbeck, S.; Budde, J.; Ihrig, D.; Leonhardt, S.; Heise, H.M. Reliable Glucose Monitoring by Ex-Vivo Blood Microdialysis and Infrared Spectrometry for Patients in Critical Care. In Proceedings of the Optical Diagnostics and Sensing XVII: Toward Point-of-Care Diagnostics, San Francisco, CA, USA, 28 January–2 February 2017; SPIE: Bellingham, WA, USA, 2017; Volume 10072. [Google Scholar] [CrossRef]
- Vahlsing, T.; Delbeck, S.; Budde, J.; Ihrig, D.F.; Heise, H.M. Combination of micro-dialysis and infrared spectroscopy: A multianalyte assay for accurate biofluid analysis and patient monitoring. In Proceedings of the Biomedical Vibrational Spectroscopy 2016: Advances in Research and Industry, San Francisco, CA, USA, 13–18 February 2016; SPIE: Bellingham, WA, USA, 2016; Volume 9704. [Google Scholar] [CrossRef]
- Gunawardhana, S.M.; Lunte, S.M. Continuous monitoring of adenosine and its metabolites using microdialysis coupled to microchip electrophoresis with amperometric detection. Anal. Methods 2018, 10, 3737–3744. [Google Scholar] [CrossRef] [PubMed]
- Perrier, R.; Pirog, A.; Jaffredo, M.; Gaitan, J.; Catargi, B.; Renaud, S.; Raoux, M.; Lang, J. Bioelectronic organ-based sensor for microfluidic real-time analysis of the demand in insulin. Biosens. Bioelectron. 2018, 117, 253–259. [Google Scholar] [CrossRef]
- Moßhammer, M.; Schrameyer, V.; Jensen, P.Ø.; Koren, K.; Kühl, M. Extracellular hydrogen peroxide measurements using a flow injection system in combination with microdialysis probes–Potential and challenges. Free Radic. Biol. Med. 2018, 128, 111–123. [Google Scholar] [CrossRef] [Green Version]
- Saylor, R.A.; Lunte, S.M. PDMS/glass hybrid device with a reusable carbon electrode for on-line monitoring of catecholamines using microdialysis sampling coupled to microchip electrophoresis with electrochemical detection. Electrophoresis 2018, 39, 462–469. [Google Scholar] [CrossRef]
- Zhu, X.; Xu, L.; Wu, T.; Xu, A.; Zhao, M.; Liu, S. Continuous monitoring of bisulfide variation in microdialysis effluents by on-line droplet-based microfluidic fluorescent sensor. Biosens. Bioelectron. 2014, 55, 438–445. [Google Scholar] [CrossRef]
- Scott, D.E.; Grigsby, R.J.; Lunte, S.M. Microdialysis sampling coupled to microchip electrophoresis with integrated amperometric detection on an all-glass substrate. Chemphyschem 2013, 14, 2288–2294. [Google Scholar] [CrossRef] [Green Version]
- Rosenbloom, A.J.; Gandhi, H.R.; Subrebost, G.L. Microdialysis coupled with an embedded systems controller and CMOS image sensor. In Proceedings of the Annual International Conference of the IEEE Engineering in Medicine and Biology Society (EMBC), Minneapolis, MN, USA, 3–6 September 2009; pp. 1230–1233. [Google Scholar] [CrossRef]
- Ware, J.; Allen, J.M.; Boughton, C.K.; Wilinska, M.E.; Hartnell, S.; Thankamony, A.; de Beaufort, C.; Schierloh, U.; Fröhlich-Reiterer, E.; Mader, J.K.; et al. Randomized Trial of Closed-Loop Control in Very Young Children with Type 1 Diabetes. N. Engl. J. Med. 2022, 386, 209–219. [Google Scholar] [CrossRef]
- Gowers, S.A.; Curto, V.F.; Seneci, C.A.; Wang, C.; Anastasova, S.; Vadgama, P.; Yang, G.Z.; Boutelle, M.G. 3D Printed Microfluidic Device with Integrated Biosensors for Online Analysis of Subcutaneous Human Microdialysate. Anal. Chem. 2015, 87, 7763–7770. [Google Scholar] [CrossRef]
- Rogers, M.L.; Boutelle, M.G. Real-Time Clinical Monitoring of Biomolecules. Annu. Rev. Anal. Chem. 2013, 6, 427–453. [Google Scholar] [CrossRef] [PubMed]
- Hansen, A.J.; Zeuthen, T. Extracellular ion concentrations during spreading depression and ischemia in the rat brain cortex. Acta Physiol. Scand. 1981, 113, 437–445. [Google Scholar] [CrossRef] [PubMed]
- Somjen, G.G. Mechanisms of spreading depression and hypoxic spreading depression-like depolarization. Physiol. Rev. 2001, 81, 1065–1096. [Google Scholar] [CrossRef] [PubMed] [Green Version]
- Risher, W.C.; Ard, D.; Yuan, J.; Kirov, S.A. Recurrent spontaneous spreading depolarizations facilitate acute dendritic injury in the ischemic penumbra. J. Neurosci. 2010, 30, 9859–9868. [Google Scholar] [CrossRef] [PubMed]
- Risher, W.C.; Croom, D.; Kirov, S.A. Persistent astroglial swelling accompanies rapid reversible dendritic injury during stroke-induced spreading depolarizations. Glia 2012, 60, 1709–1720. [Google Scholar] [CrossRef] [PubMed] [Green Version]
- Feuerstein, D.; Backes, H.; Gramer, M.; Takagaki, M.; Gabel, P.; Kumagai, T.; Graf, R. Regulation of cerebral metabolism during cortical spreading depression. J. Cereb. Blood Flow Metab. 2016, 36, 1965–1977. [Google Scholar] [CrossRef]
- Hashemi, P.; Bhatia, R.; Nakamura, H.; Dreier, J.P.; Graf, R.; Strong, A.J.; Boutelle, M.G. Persisting depletion of brain glucose following cortical spreading depression, despite apparent hyperaemia: Evidence for risk of an adverse effect of Leão’s spreading depression. J. Cereb. Blood Flow Metab. 2009, 29, 166–175. [Google Scholar] [CrossRef] [Green Version]
- Rogers, M.L.; Feuerstein, D.; Leong, C.L.; Takagaki, M.; Niu, X.; Graf, R.; Boutelle, M.G. Continuous online microdialysis using microfluidic sensors: Dynamic neurometabolic changes during spreading depolarization. ACS Chem. Neurosci. 2013, 4, 799–807. [Google Scholar] [CrossRef]
- Scheller, D.; Kolb, J.; Tegtmeier, F. Lactate and pH change in close correlation in the extracellular space of the rat brain during cortical spreading depression. Neurosci. Lett. 1992, 135, 83–86. [Google Scholar] [CrossRef]
- Ayata, C.; Lauritzen, M. Spreading Depression, Spreading Depolarizations, and the Cerebral Vasculature. Physiol. Rev. 2015, 95, 953–993. [Google Scholar] [CrossRef] [Green Version]
- Grafstein, B. Mechanism of spreading cortical depression. J. Neurophysiol. 1956, 19, 154–171. [Google Scholar] [CrossRef] [PubMed]
- Toth, P.; Szarka, N.; Farkas, E.; Ezer, E.; Czeiter, E.; Amrein, K.; Ungvari, Z.; Hartings, J.A.; Buki, A.; Koller, A. Traumatic brain injury-induced autoregulatory dysfunction and spreading depression-related neurovascular uncoupling: Pathomechanisms, perspectives, and therapeutic implications. Am. J. Physiol. Heart Circ. Physiol. 2016, 311, H1118–H1131. [Google Scholar] [CrossRef] [PubMed] [Green Version]
- Aydin, E.B.; Aydin, M.; Sezgintürk, M.K. Chapter One-Advances in electrochemical immunosensors. In Advances in Clinical Chemistry; Makowski, G.S., Ed.; Elsevier: Amsterdam, The Netherlands, 2019; Volume 92, pp. 1–57. [Google Scholar]
- Cass, A.E.G.; Davis, G.; Francis, G.D.; Hill, H.A.O.; Aston, W.J.; Higgins, I.J.; Plotkin, E.V.; Scott, L.D.L.; Turner, A.P.F. Ferrocene-mediated enzyme electrode for amperometric determination of glucose. Anal. Chem. 1984, 56, 667–671. [Google Scholar] [CrossRef] [PubMed]
- Davis, F.; Higson, S.P.J. 5-Practical applications and protocols for enzyme biosensors. In Biosensors for Medical Applications; Higson, S., Ed.; Woodhead Publishing: Sawston, UK, 2012; pp. 135–160. [Google Scholar] [CrossRef]
- Gowers, S.A.N.; Rogers, M.L.; Booth, M.A.; Leong, C.L.; Samper, I.C.; Phairatana, T.; Jewell, S.L.; Pahl, C.; Strong, A.J.; Boutelle, M.G. Clinical translation of microfluidic sensor devices: Focus on calibration and analytical robustness. Lab Chip 2019, 19, 2537–2548. [Google Scholar] [CrossRef]
- Li, H.; Zhang, D.; Gao, M.; Huang, L.; Tang, L.; Li, Z.; Chen, X.; Zhang, X. Highly specific C–C bond cleavage induced FRET fluorescence for in vivo biological nitric oxide imaging. Chem. Sci. 2017, 8, 2199–2203. [Google Scholar] [CrossRef] [Green Version]
- Germain-Genevois, C.; Garandeau, O.; Couillaud, F. Detection of Brain Tumors and Systemic Metastases Using NanoLuc and Fluc for Dual Reporter Imaging. Mol. Imaging Biol. 2016, 18, 62–69. [Google Scholar] [CrossRef]
- Zhang, N.; Francis, K.P.; Prakash, A.; Ansaldi, D. Enhanced detection of myeloperoxidase activity in deep tissues through luminescent excitation of near-infrared nanoparticles. Nat. Med. 2013, 19, 500–505. [Google Scholar] [CrossRef]
- Sinha, S.S.; Jones, S.; Pramanik, A.; Ray, P.C. Nanoarchitecture Based SERS for Biomolecular Fingerprinting and Label-Free Disease Markers Diagnosis. Acc. Chem. Res. 2016, 49, 2725–2735. [Google Scholar] [CrossRef]
- Grafen, M.; Delbeck, S.; Busch, H.; Heise, H.; Ostendorf, A. Evaluation and Benchmarking of an EC-QCL-Based Mid-Infrared Spectrometer for Monitoring Metabolic Blood Parameters in Critical Care Units. In Proceedings of the Optical Diagnostics and Sensing XVIII: Toward Point-of-Care Diagnostics, San Francisco, CA, USA, 27 January–1 February 2018; SPIE: Bellingham, WA, USA, 2016; Volume 10501. [Google Scholar] [CrossRef]
- Jessen, T.E.; Höskuldsson, A.T.; Bjerrum, P.J.; Verder, H.; Sørensen, L.; Bratholm, P.S.; Christensen, B.; Jensen, L.S.; Jensen, M.A. Simultaneous determination of glucose, triglycerides, urea, cholesterol, albumin and total protein in human plasma by Fourier transform infrared spectroscopy: Direct clinical biochemistry without reagents. Clin. Biochem. 2014, 47, 1306–1312. [Google Scholar] [CrossRef]
- Kochan, K.; Bedolla, D.E.; Perez-Guaita, D.; Adegoke, J.A.; Chakkumpulakkal Puthan Veettil, T.; Martin, M.; Roy, S.; Pebotuwa, S.; Heraud, P.; Wood, B.R. Infrared Spectroscopy of Blood. Appl. Spectrosc. 2021, 75, 611–646. [Google Scholar] [CrossRef]
- Lasalvia, M.; Capozzi, V.; Perna, G. Discrimination of Different Breast Cell Lines on Glass Substrate by Means of Fourier Transform Infrared Spectroscopy. Sensor 2021, 21, 6992. [Google Scholar] [CrossRef] [PubMed]
- Galli, R.; Meinhardt, M.; Koch, E.; Schackert, G.; Steiner, G.; Kirsch, M.; Uckermann, O. Rapid Label-Free Analysis of Brain Tumor Biopsies by Near Infrared Raman and Fluorescence Spectroscopy-A Study of 209 Patients. Front. Oncol. 2019, 9, 1165. [Google Scholar] [CrossRef] [PubMed]
- Wypych, G. (Ed.) 2-PHOTOPHYSICS. In Handbook of UV Degradation and Stabilization, 2nd ed.; ChemTec Publishing: Toronto, ON, Canada, 2015; pp. 9–35. [Google Scholar] [CrossRef]
- Dialysis, M. MD System Loke–M Dialysis. Available online: https://www.mdialysis.com/product/md-system-1-0-loke/ (accessed on 17 March 2022).
- Booth, M.A.; Gowers, S.A.N.; Hersey, M.; Samper, I.C.; Park, S.; Anikeeva, P.; Hashemi, P.; Stevens, M.M.; Boutelle, M.G. Fiber-Based Electrochemical Biosensors for Monitoring pH and Transient Neurometabolic Lactate. Anal. Chem. 2021, 93, 6646–6655. [Google Scholar] [CrossRef] [PubMed]
- Young, A.M.H.; Guilfoyle, M.R.; Donnelly, J.; Smielewski, P.; Agarwal, S.; Czosnyka, M.; Hutchinson, P.J. Multimodality neuromonitoring in severe pediatric traumatic brain injury. Pediatr. Res. 2018, 83, 41–49. [Google Scholar] [CrossRef]
- Figaji, A.A.; Zwane, E.; Thompson, C.; Fieggen, A.G.; Argent, A.C.; Le Roux, P.D.; Peter, J.C. Brain tissue oxygen tension monitoring in pediatric severe traumatic brain injury. Part 1: Relationship with outcome. Childs Nerv. Syst. 2009, 25, 1325–1333. [Google Scholar] [CrossRef]


| Intervention | Effect | References |
|---|---|---|
| Glucose/insulin | ↑↓ glucose, ↑↓ LPR | [29,30,31,32,33] |
| Hyperoxia | ↑ PBtO2, variable ↓ LPR | [34,35,36] |
| Hyperventilation | ↓ glucose | [37,38] |
| Mannitol | ↓ LPR | [32,39] |
| Decompressive craniotomy | ↓ LPR | [43,44] |
| Therapeutic (induced) hypothermia | ↓ glucose, ↓ lactate | [41,42] |
| Study | Sensor Type | Setting | Comments |
|---|---|---|---|
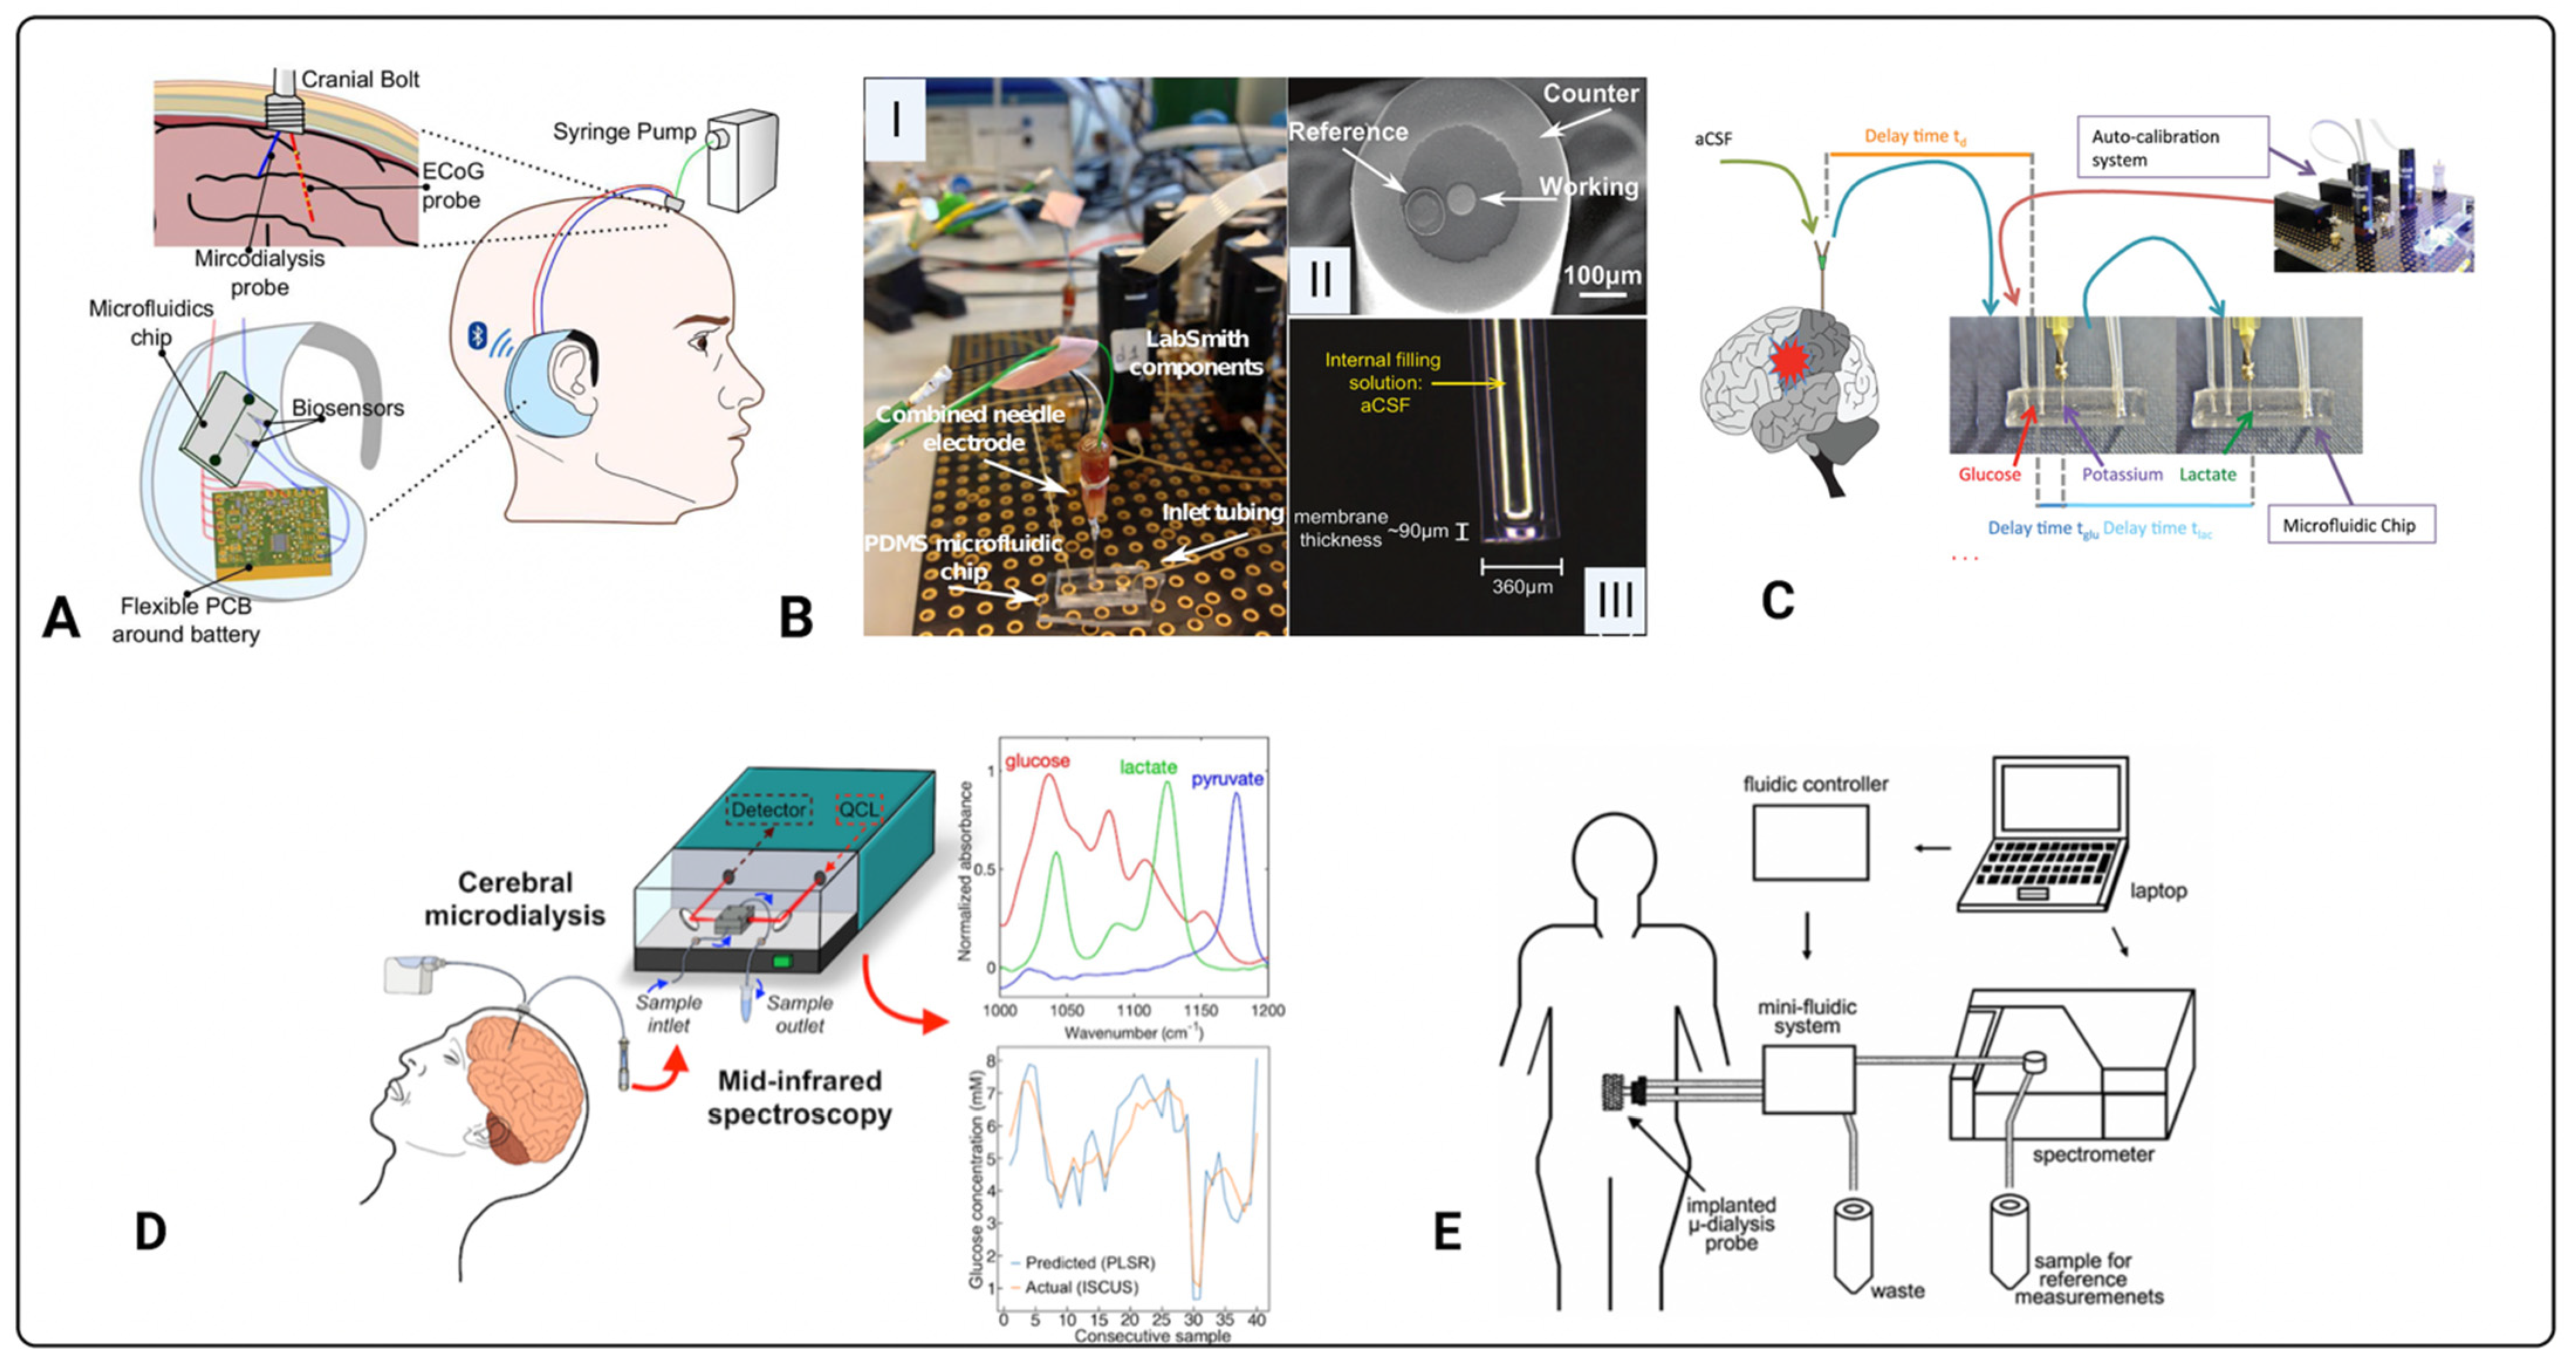
| Papadimitriou et al. (2016) [45] | Enzymatic-electrochemical | In-vitro | Measured 0–100 μM glucose concentration, with 25 μM increments, in a microdialysate stream. |
| Pagkalos et al. (2018) [46] | Enzymatic-electrochemical | In-vitro | Measured 0–50 μM lactate concentrations with 12.5 μM increments using enzymatic based sensor with LoD range 2.5 to 9.5 nM, in a microdialysate stream. |
| Tageldeen et al. (2020) [47] | Enzymatic-electrochemical | In-vitro | Measured 0–1 mM glucose and lactate, changing concentrations. LoDs of 0.85 and 1.3 μM for glucose and lactate, respectively, in a microdialysate stream. |
| Robbins et al. (2019) [48] | Enzymatic-electrochemical | In-vivo (rats) | Reported progressive decrease in glucose in microdialysates from a cortical impact injury. |
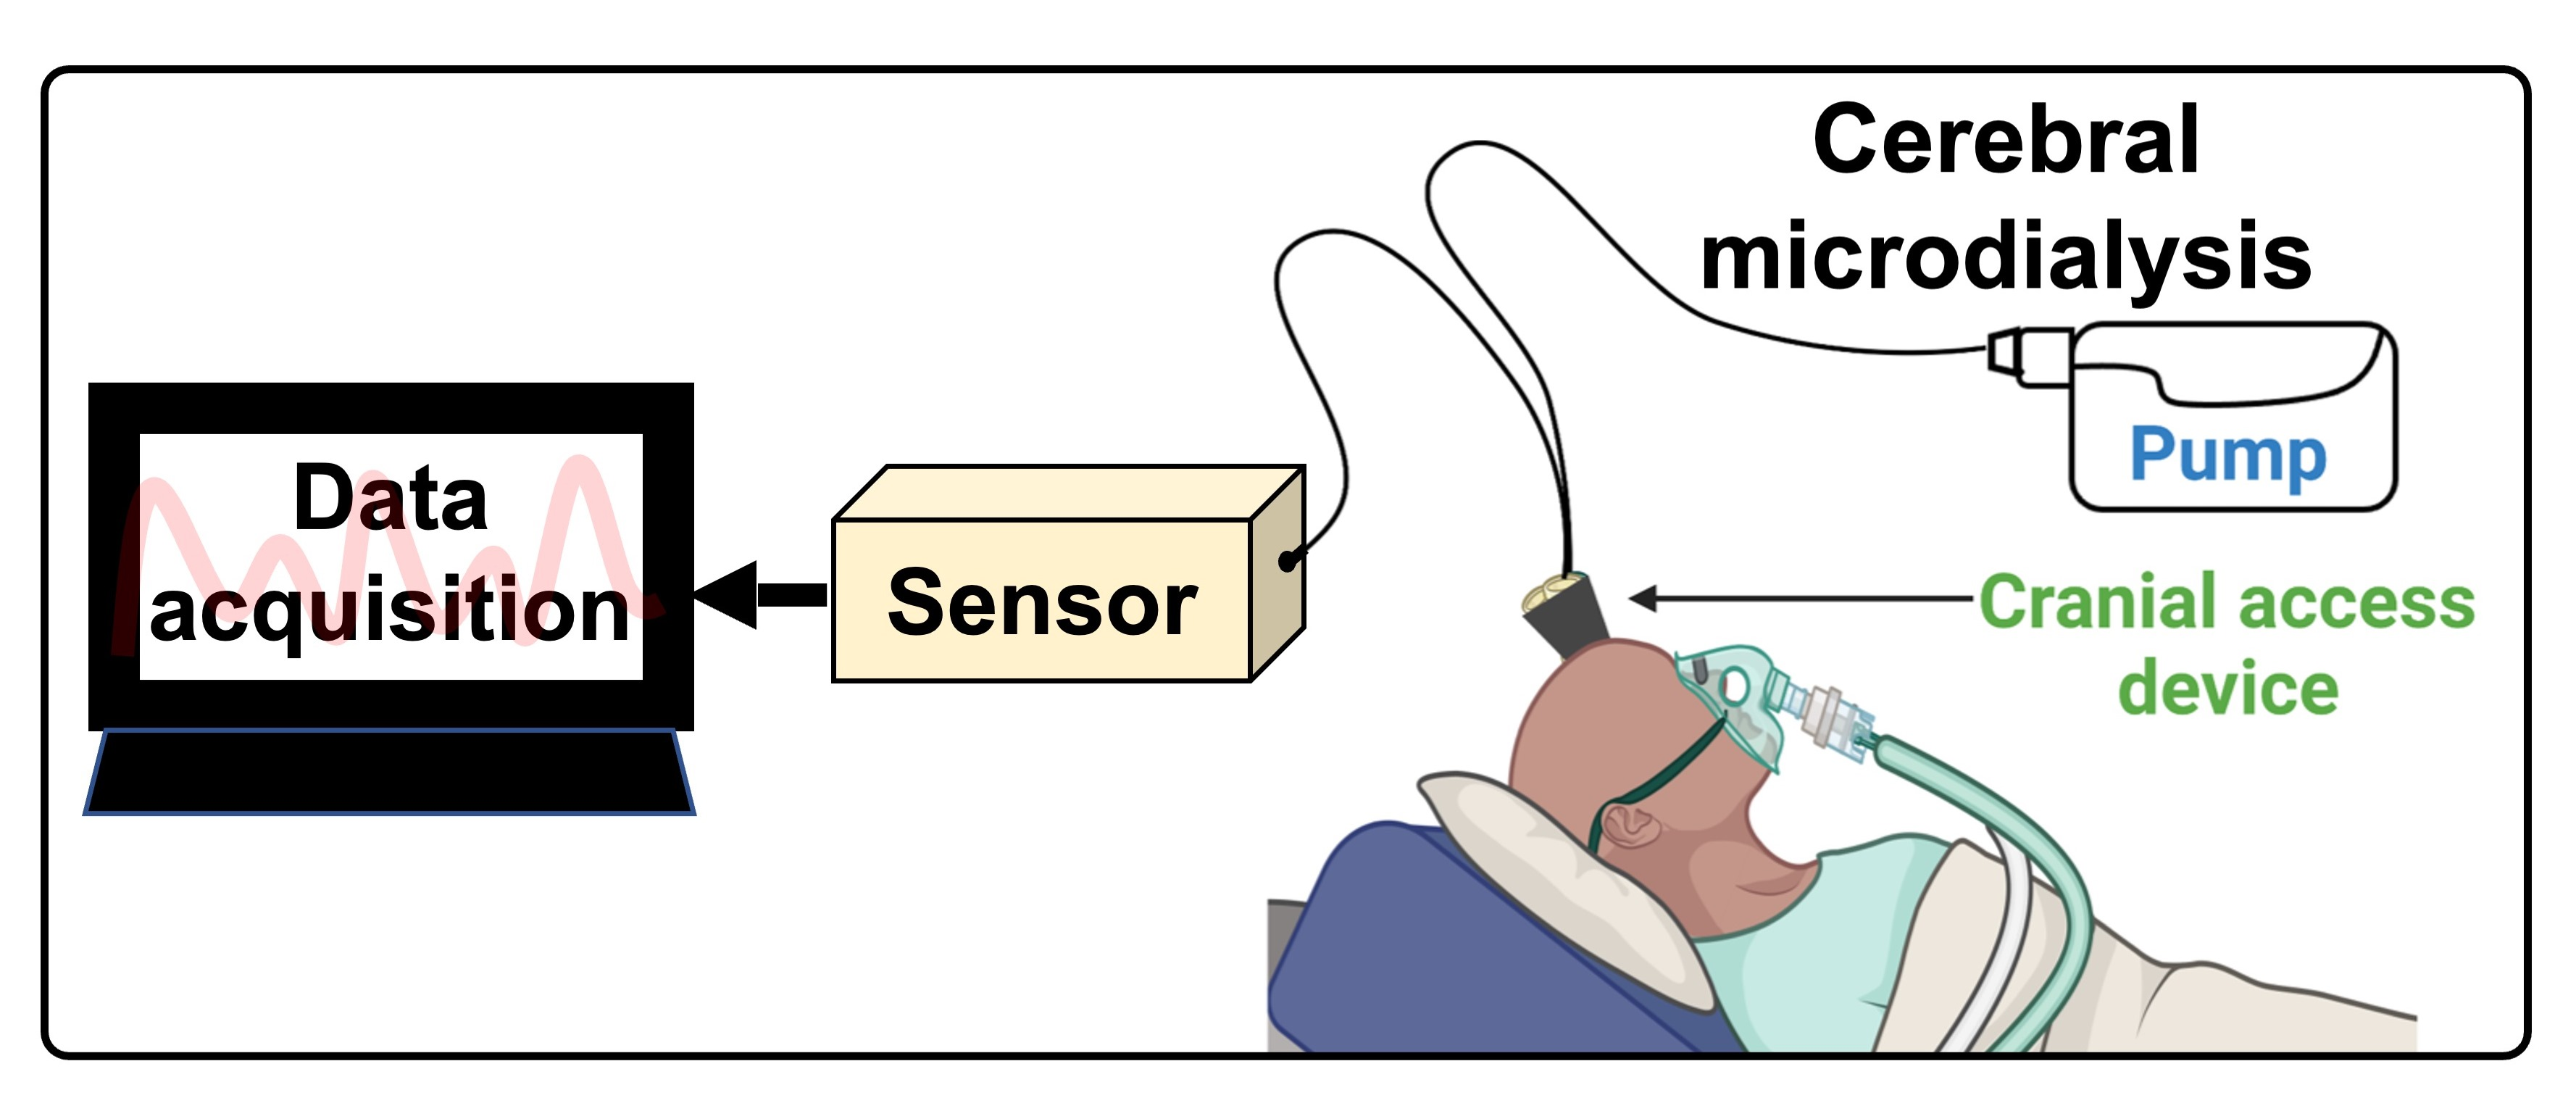
| Rogers et al. (2017) [50] | Enzymatic-electrochemical | In-vivo (human) | Continuous online microdialysis measurements in TBI patients; monitoring duration > 6 h; glucose, lactate, and K+ levels in spreading depolarisation (K+ was measured by an ion-selective electrode). |
| Gowers et al. (2019) [52] | Enzymatic-electrochemical | In-vivo (human) | Detected a sudden surge of lactate levels during continuous online dialysate measurements in TBI patients. |
| Gifford et al. (2021) [51] | Enzymatic-electrochemical | In-vivo (human) | Reported declining glucose levels in 3 TBI patients, and persistent low glucose in 1 TBI patient, in dexamethasone-enhanced continuous online microdialysis. |
| Alimagham et al. (2021) [49] | Optical (mid-IR) | Ex-vivo (human) | Microdialysate measurements from TBI patients, offline. LoDs of 0.5, 0.2, and 0.1 mM for glucose, lactate, and pyruvate respectively. Quantification of brain metabolites was compared with a conventional enzymatic-colorimetric microdialysis analyser (ISCUSflex). |
| Parameter | Meaning |
|---|---|
| Selectivity | The sensor should be able to detect a molecule of interest, e.g., glucose, in the presence of other molecules and endogenous substances found in microdialysates. |
| Sensitivity | The sensor should be able to detect the relevant range of metabolite concentrations seen in TBI. |
| Stability | The sensor should not be influenced by changes in the external or internal environment when monitoring brain metabolism as this can lead to distortion of output signals. |
| Linearity | The sensor should measure accurate concentration changes proportionately, and ideally in a linear manner. |
| Reproducibility | The results acquired by the sensor should be of highest accuracy and the investigator should be confident of achieving the same results if the brain metabolic conditions were constant. |
| Multiplexing | Ability of the sensor to detect several analytes simultaneously, e.g., glucose, lactate, and pyruvate, in microdialysates containing these and other endogenous molecules. |
Publisher’s Note: MDPI stays neutral with regard to jurisdictional claims in published maps and institutional affiliations. |
© 2022 by the authors. Licensee MDPI, Basel, Switzerland. This article is an open access article distributed under the terms and conditions of the Creative Commons Attribution (CC BY) license (https://creativecommons.org/licenses/by/4.0/).
Share and Cite
Zimphango, C.; Alimagham, F.C.; Carpenter, K.L.H.; Hutchinson, P.J.; Hutter, T. Monitoring Neurochemistry in Traumatic Brain Injury Patients Using Microdialysis Integrated with Biosensors: A Review. Metabolites 2022, 12, 393. https://doi.org/10.3390/metabo12050393
Zimphango C, Alimagham FC, Carpenter KLH, Hutchinson PJ, Hutter T. Monitoring Neurochemistry in Traumatic Brain Injury Patients Using Microdialysis Integrated with Biosensors: A Review. Metabolites. 2022; 12(5):393. https://doi.org/10.3390/metabo12050393
Chicago/Turabian StyleZimphango, Chisomo, Farah C. Alimagham, Keri L. H. Carpenter, Peter J. Hutchinson, and Tanya Hutter. 2022. "Monitoring Neurochemistry in Traumatic Brain Injury Patients Using Microdialysis Integrated with Biosensors: A Review" Metabolites 12, no. 5: 393. https://doi.org/10.3390/metabo12050393
APA StyleZimphango, C., Alimagham, F. C., Carpenter, K. L. H., Hutchinson, P. J., & Hutter, T. (2022). Monitoring Neurochemistry in Traumatic Brain Injury Patients Using Microdialysis Integrated with Biosensors: A Review. Metabolites, 12(5), 393. https://doi.org/10.3390/metabo12050393