
Availability and Metabolic Fate of Olive Phenolic Alcohols Hydroxytyrosol and Tyrosol in the Human GI Tract Simulated by the In Vitro GIDM–Colon Model

 , , , , and
Abstract
:1. Introduction
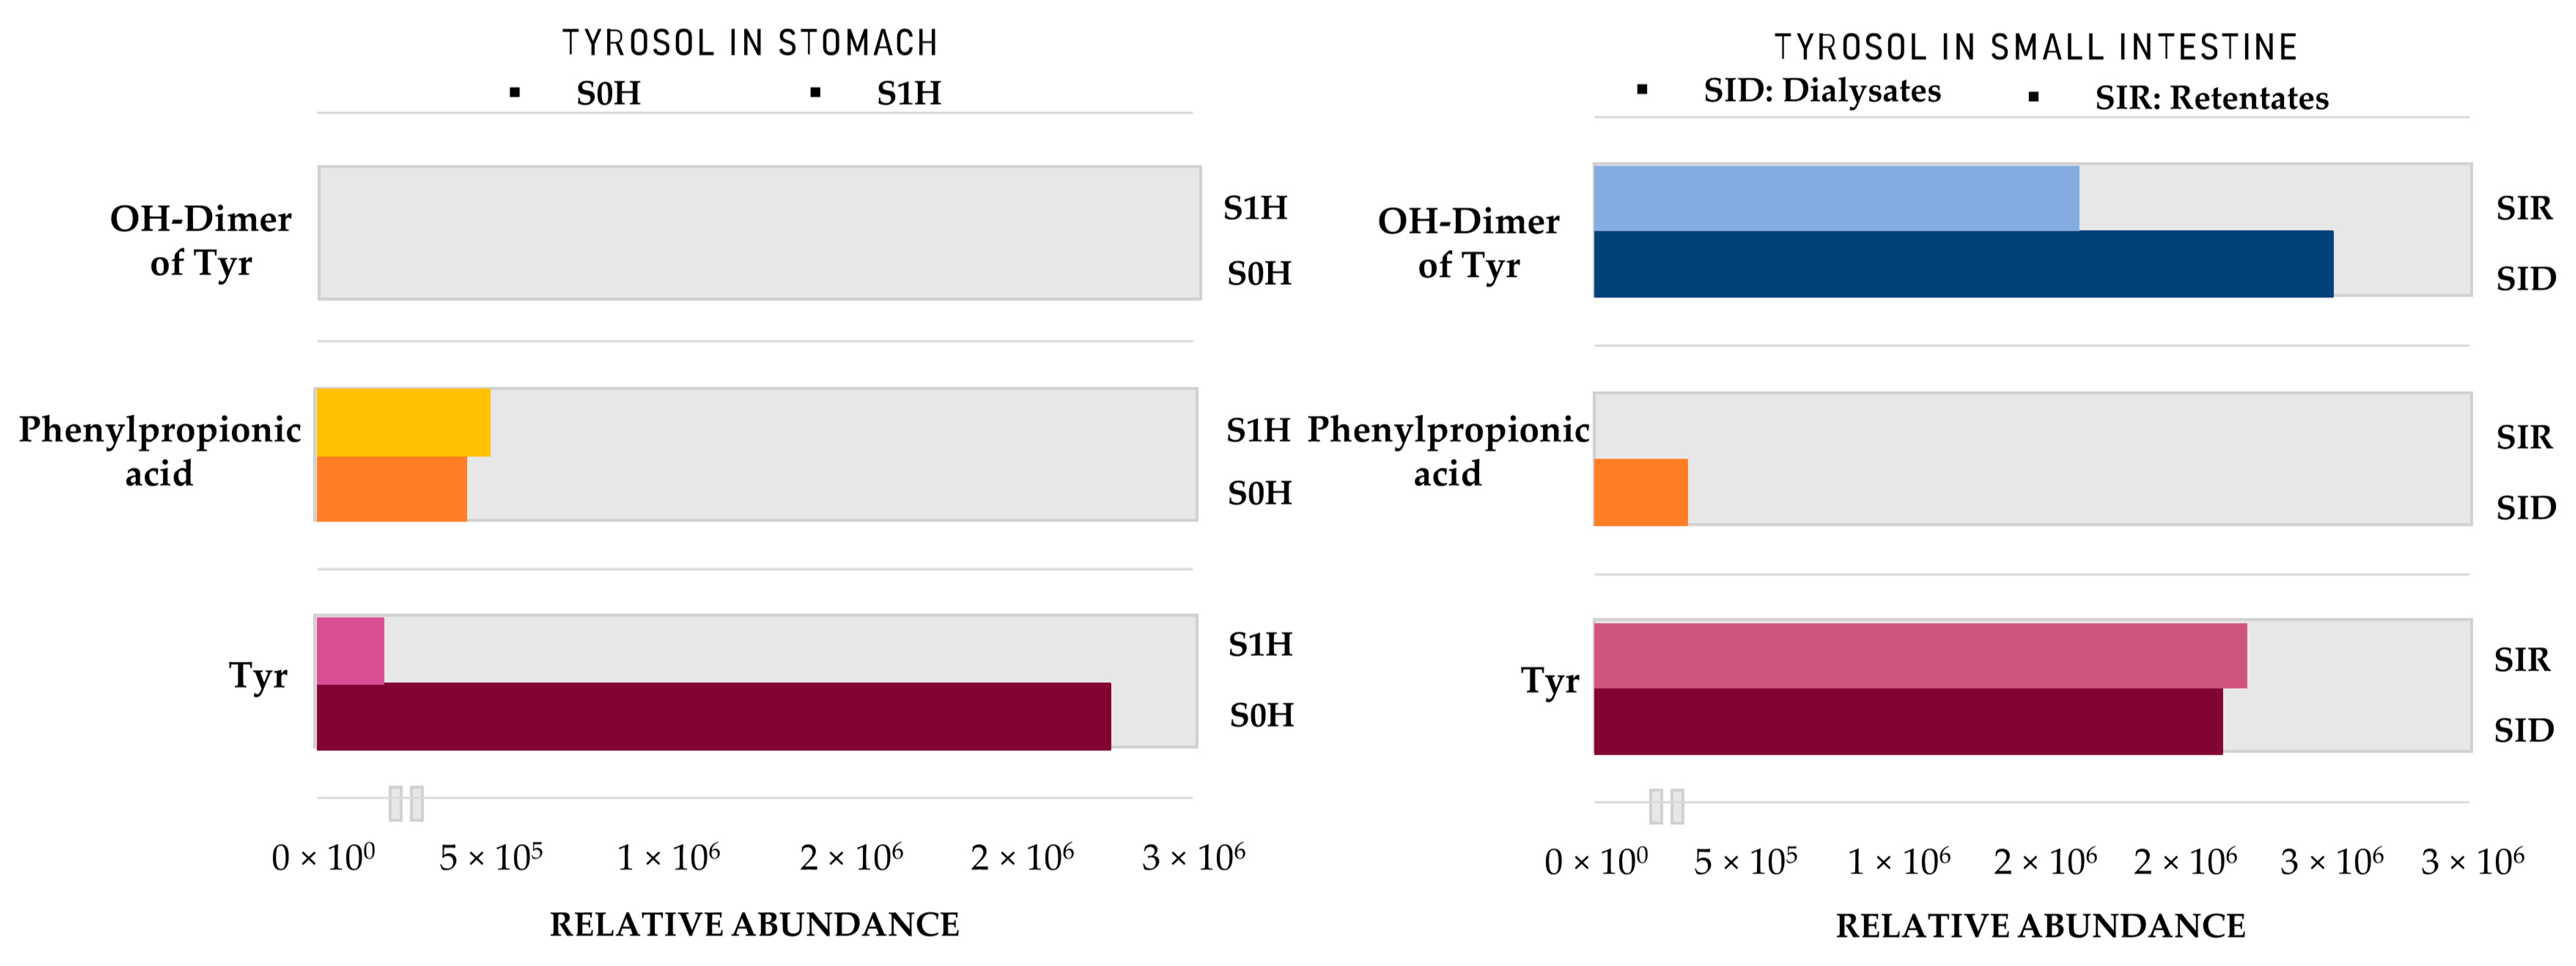
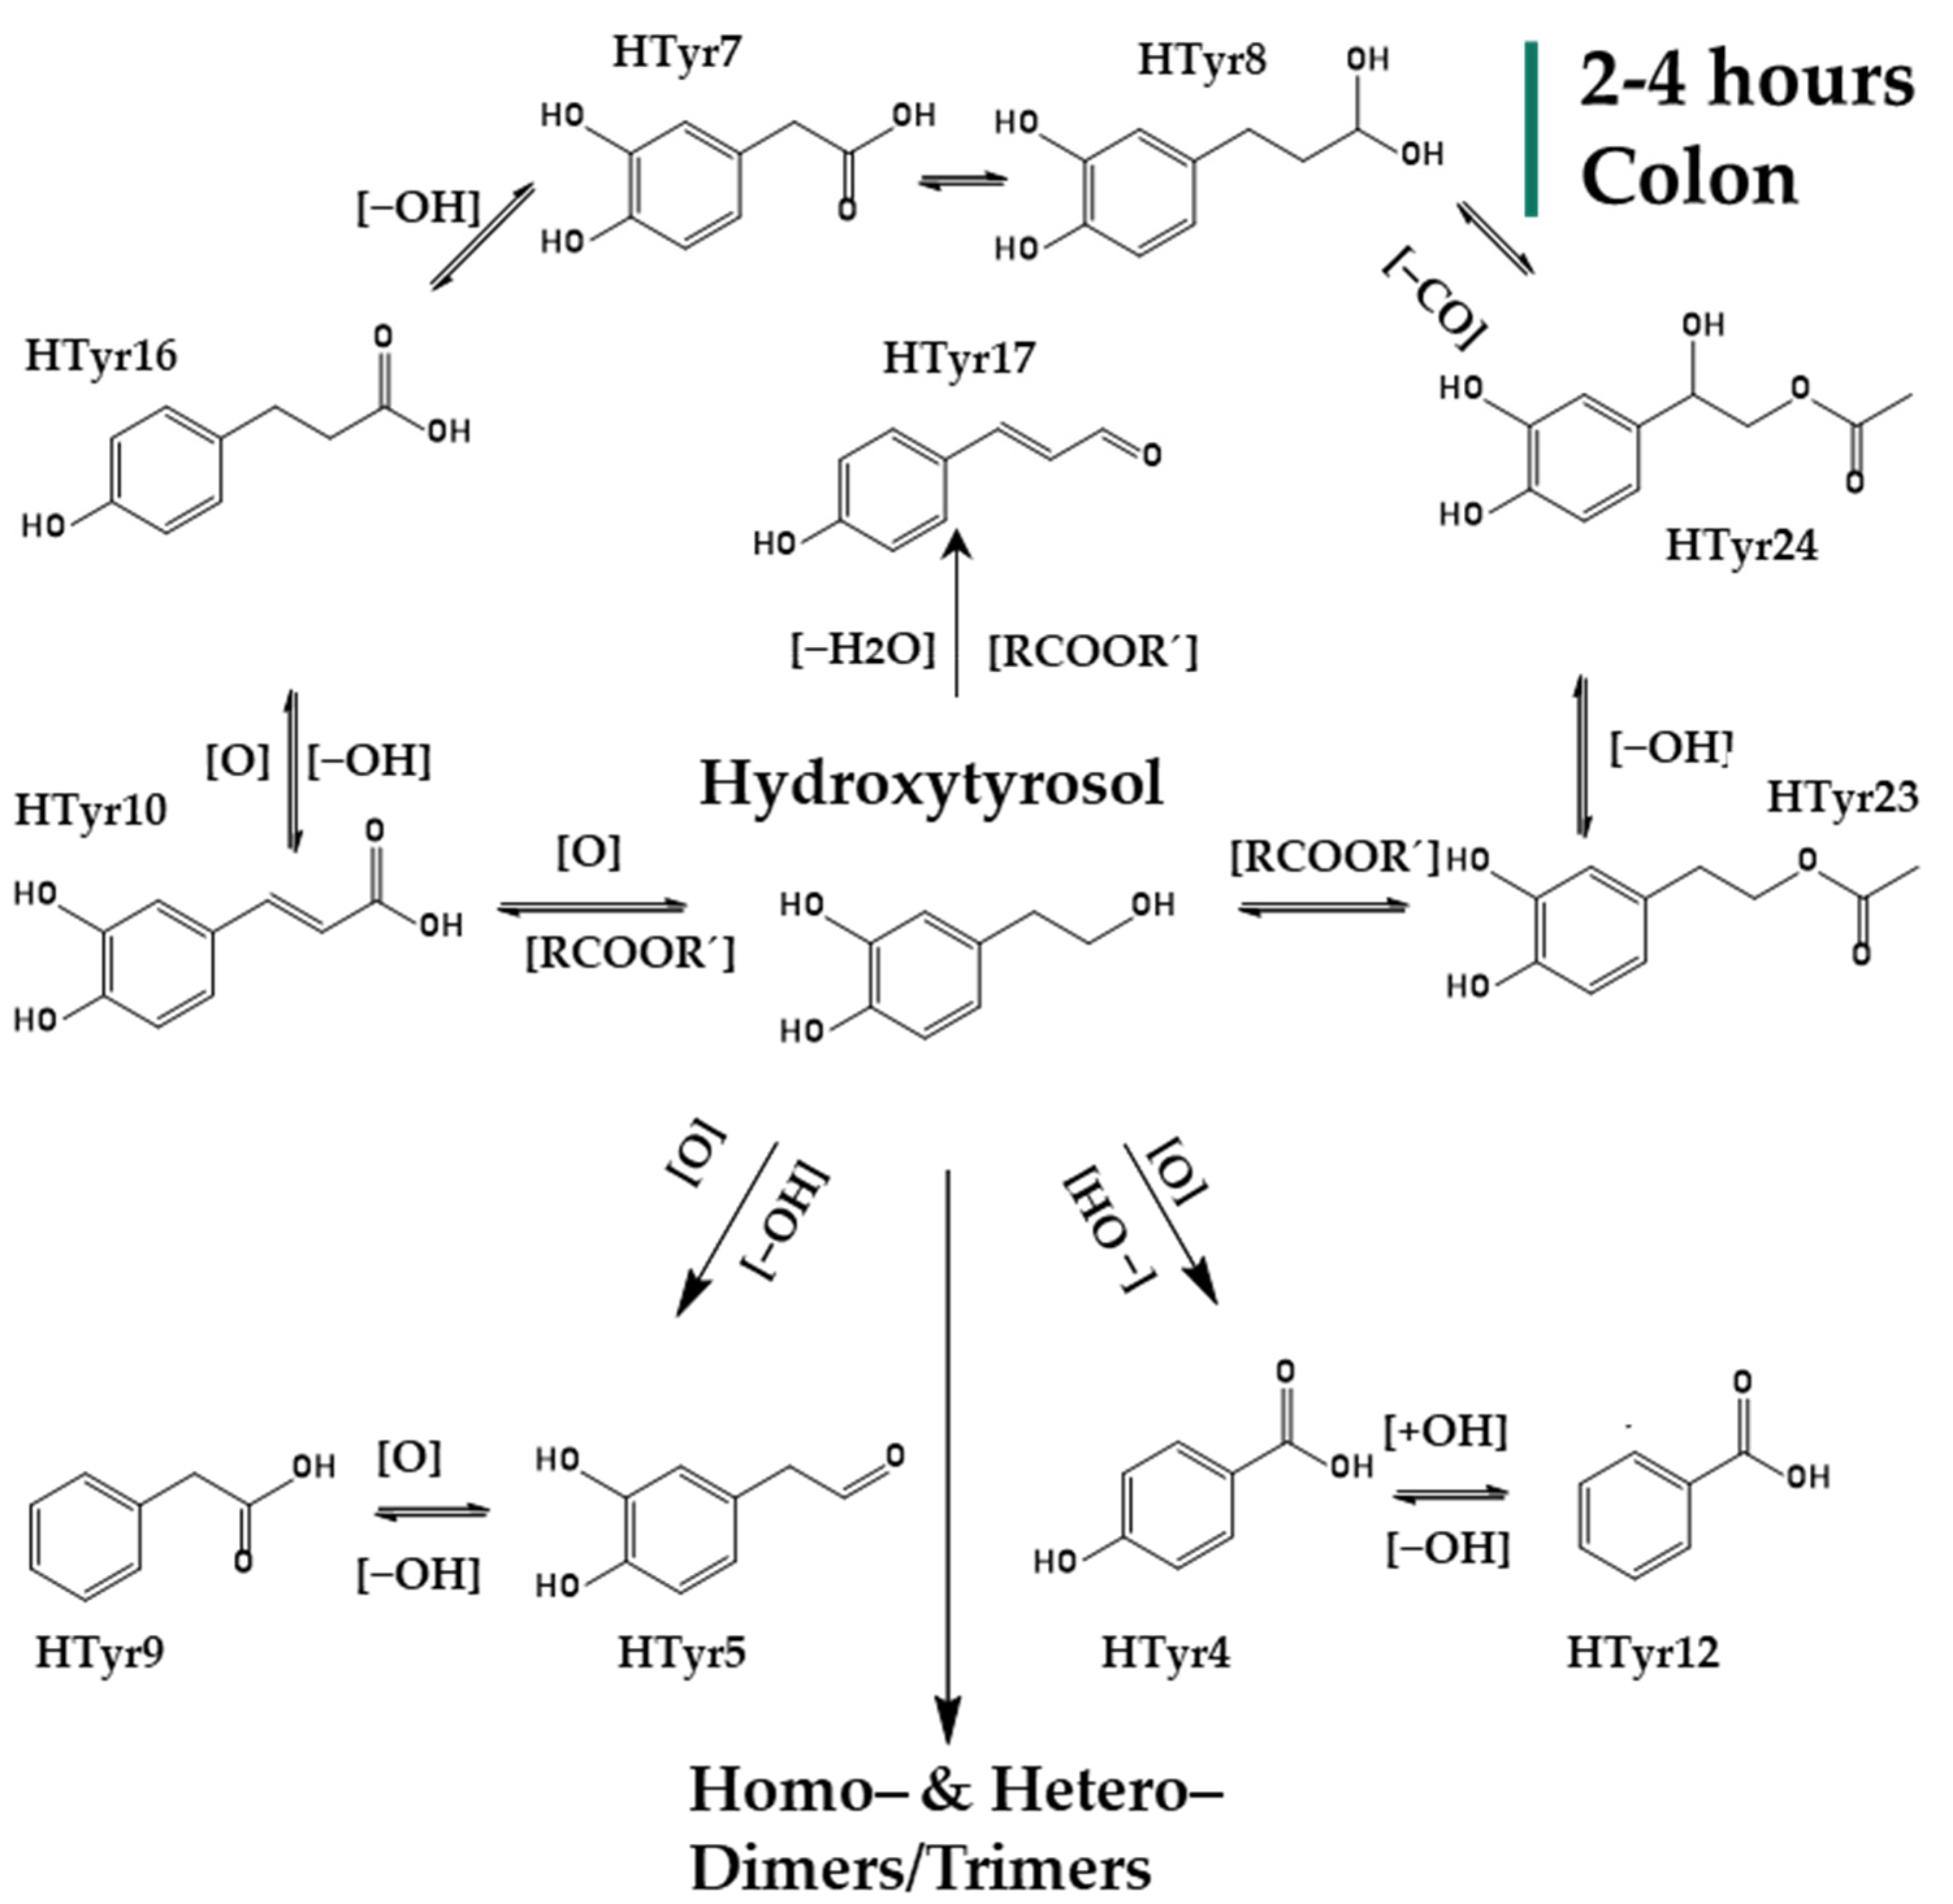
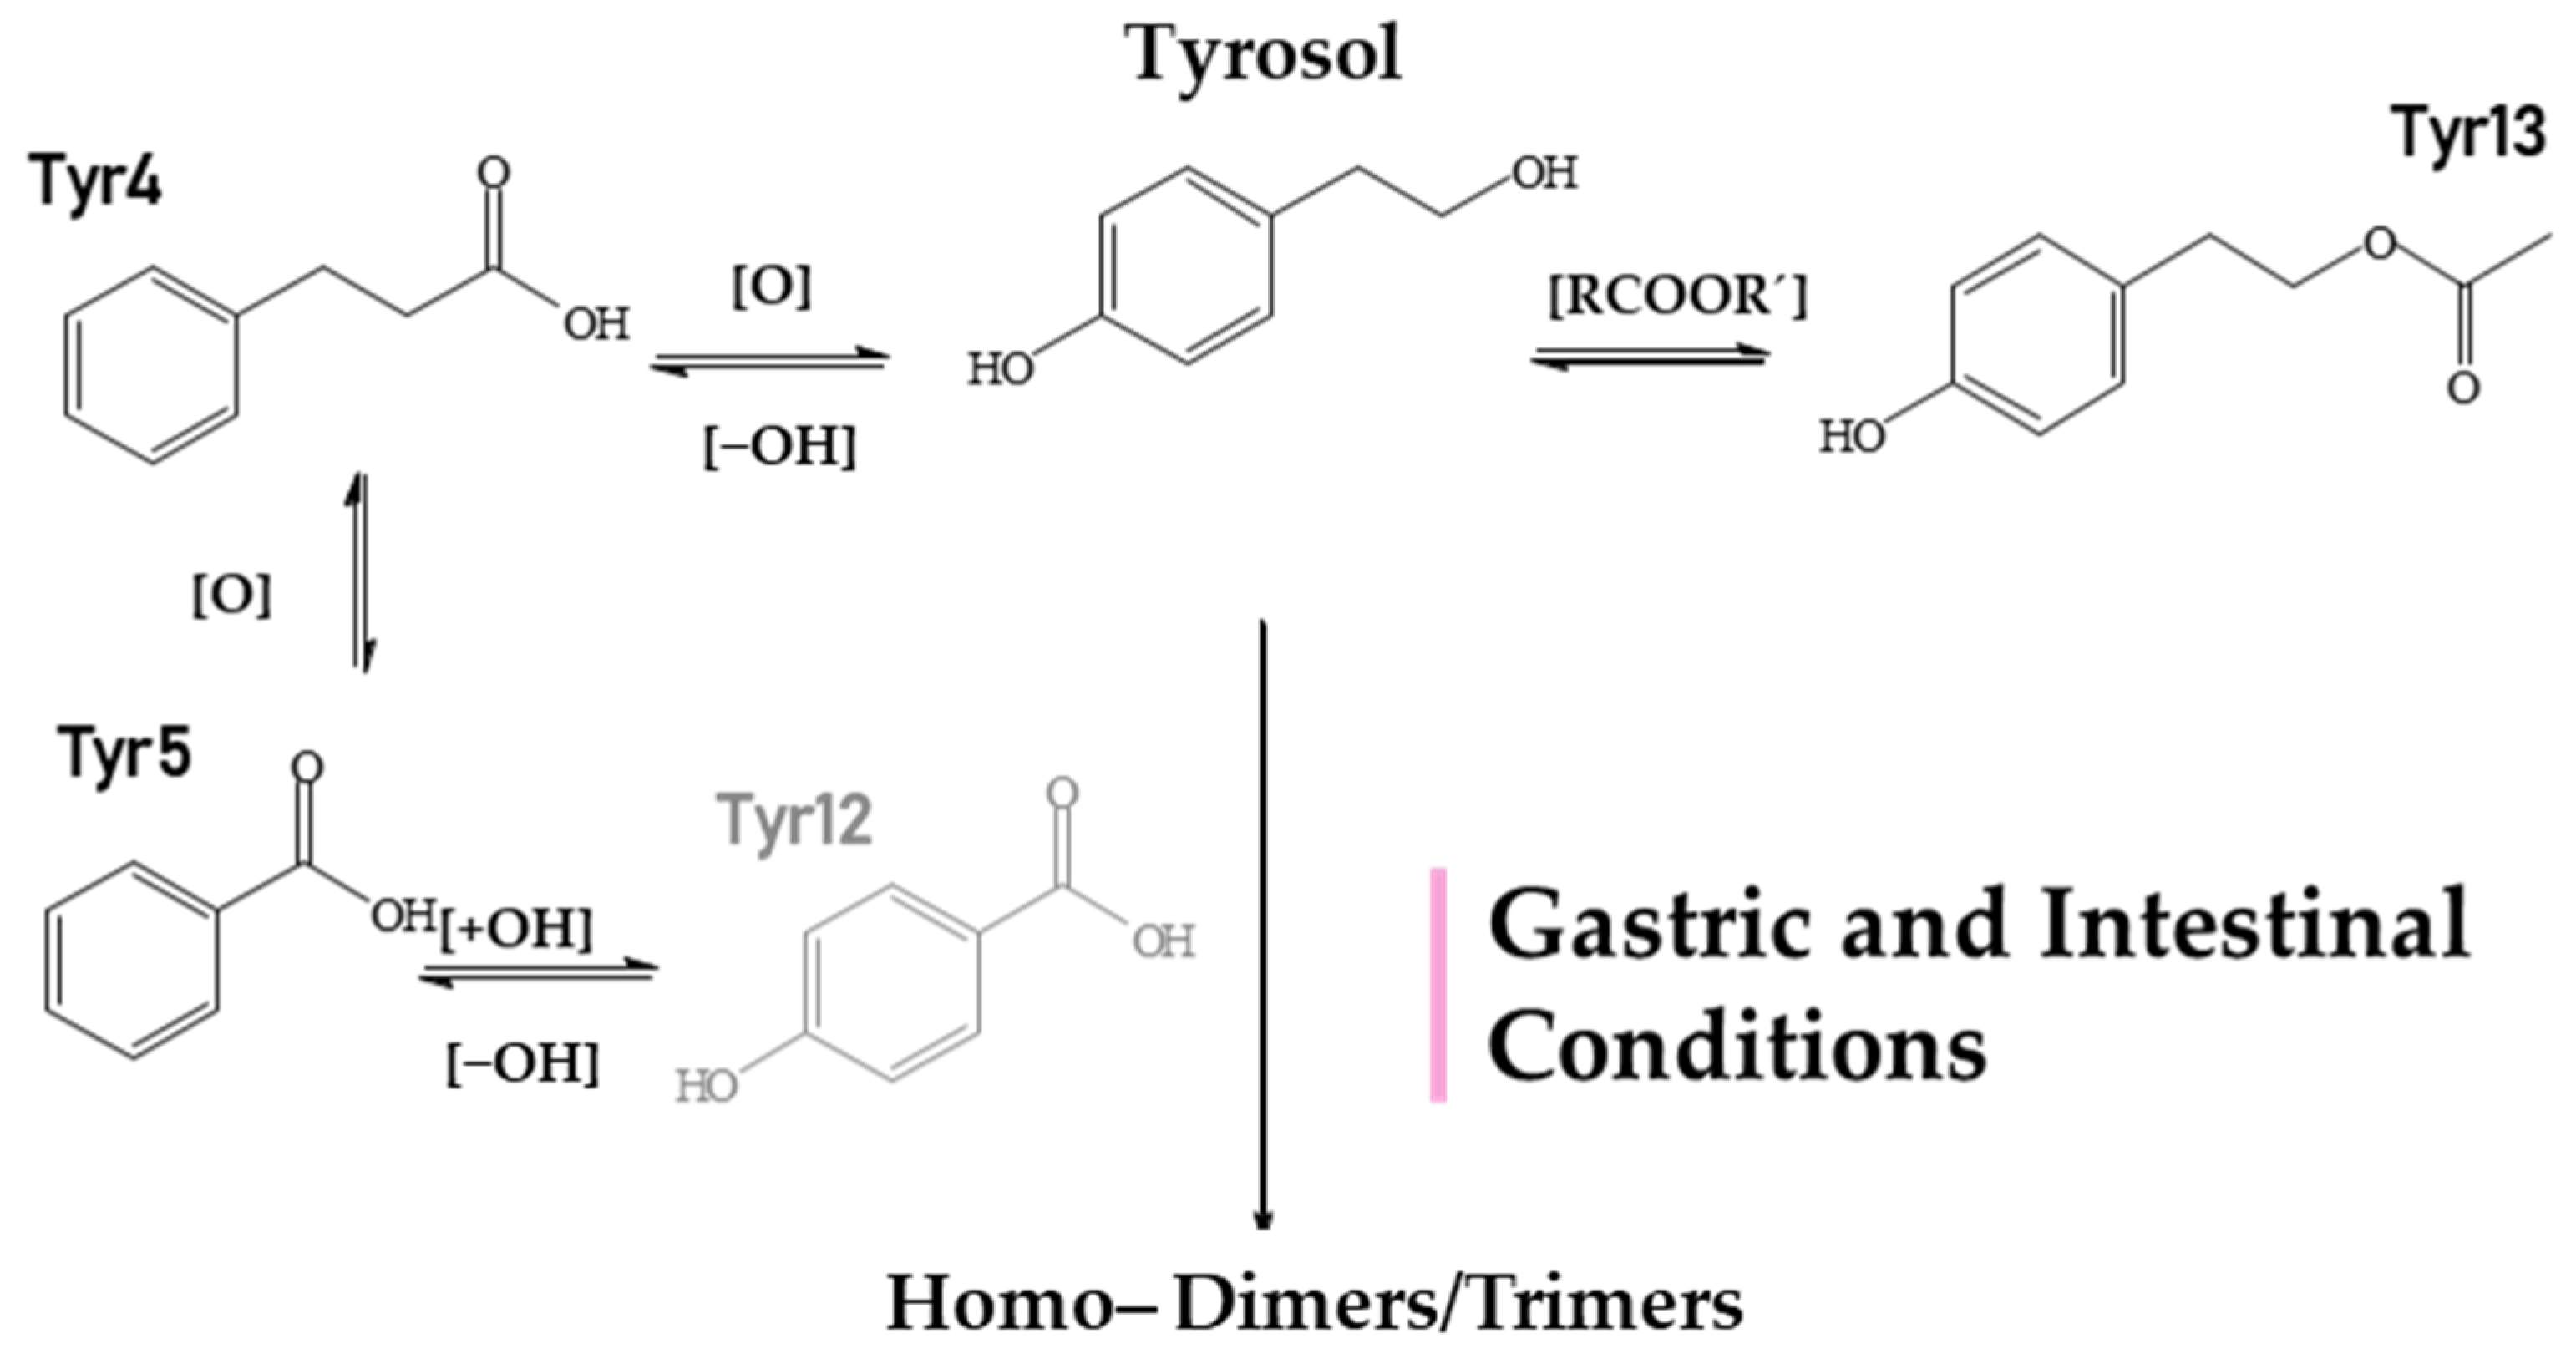
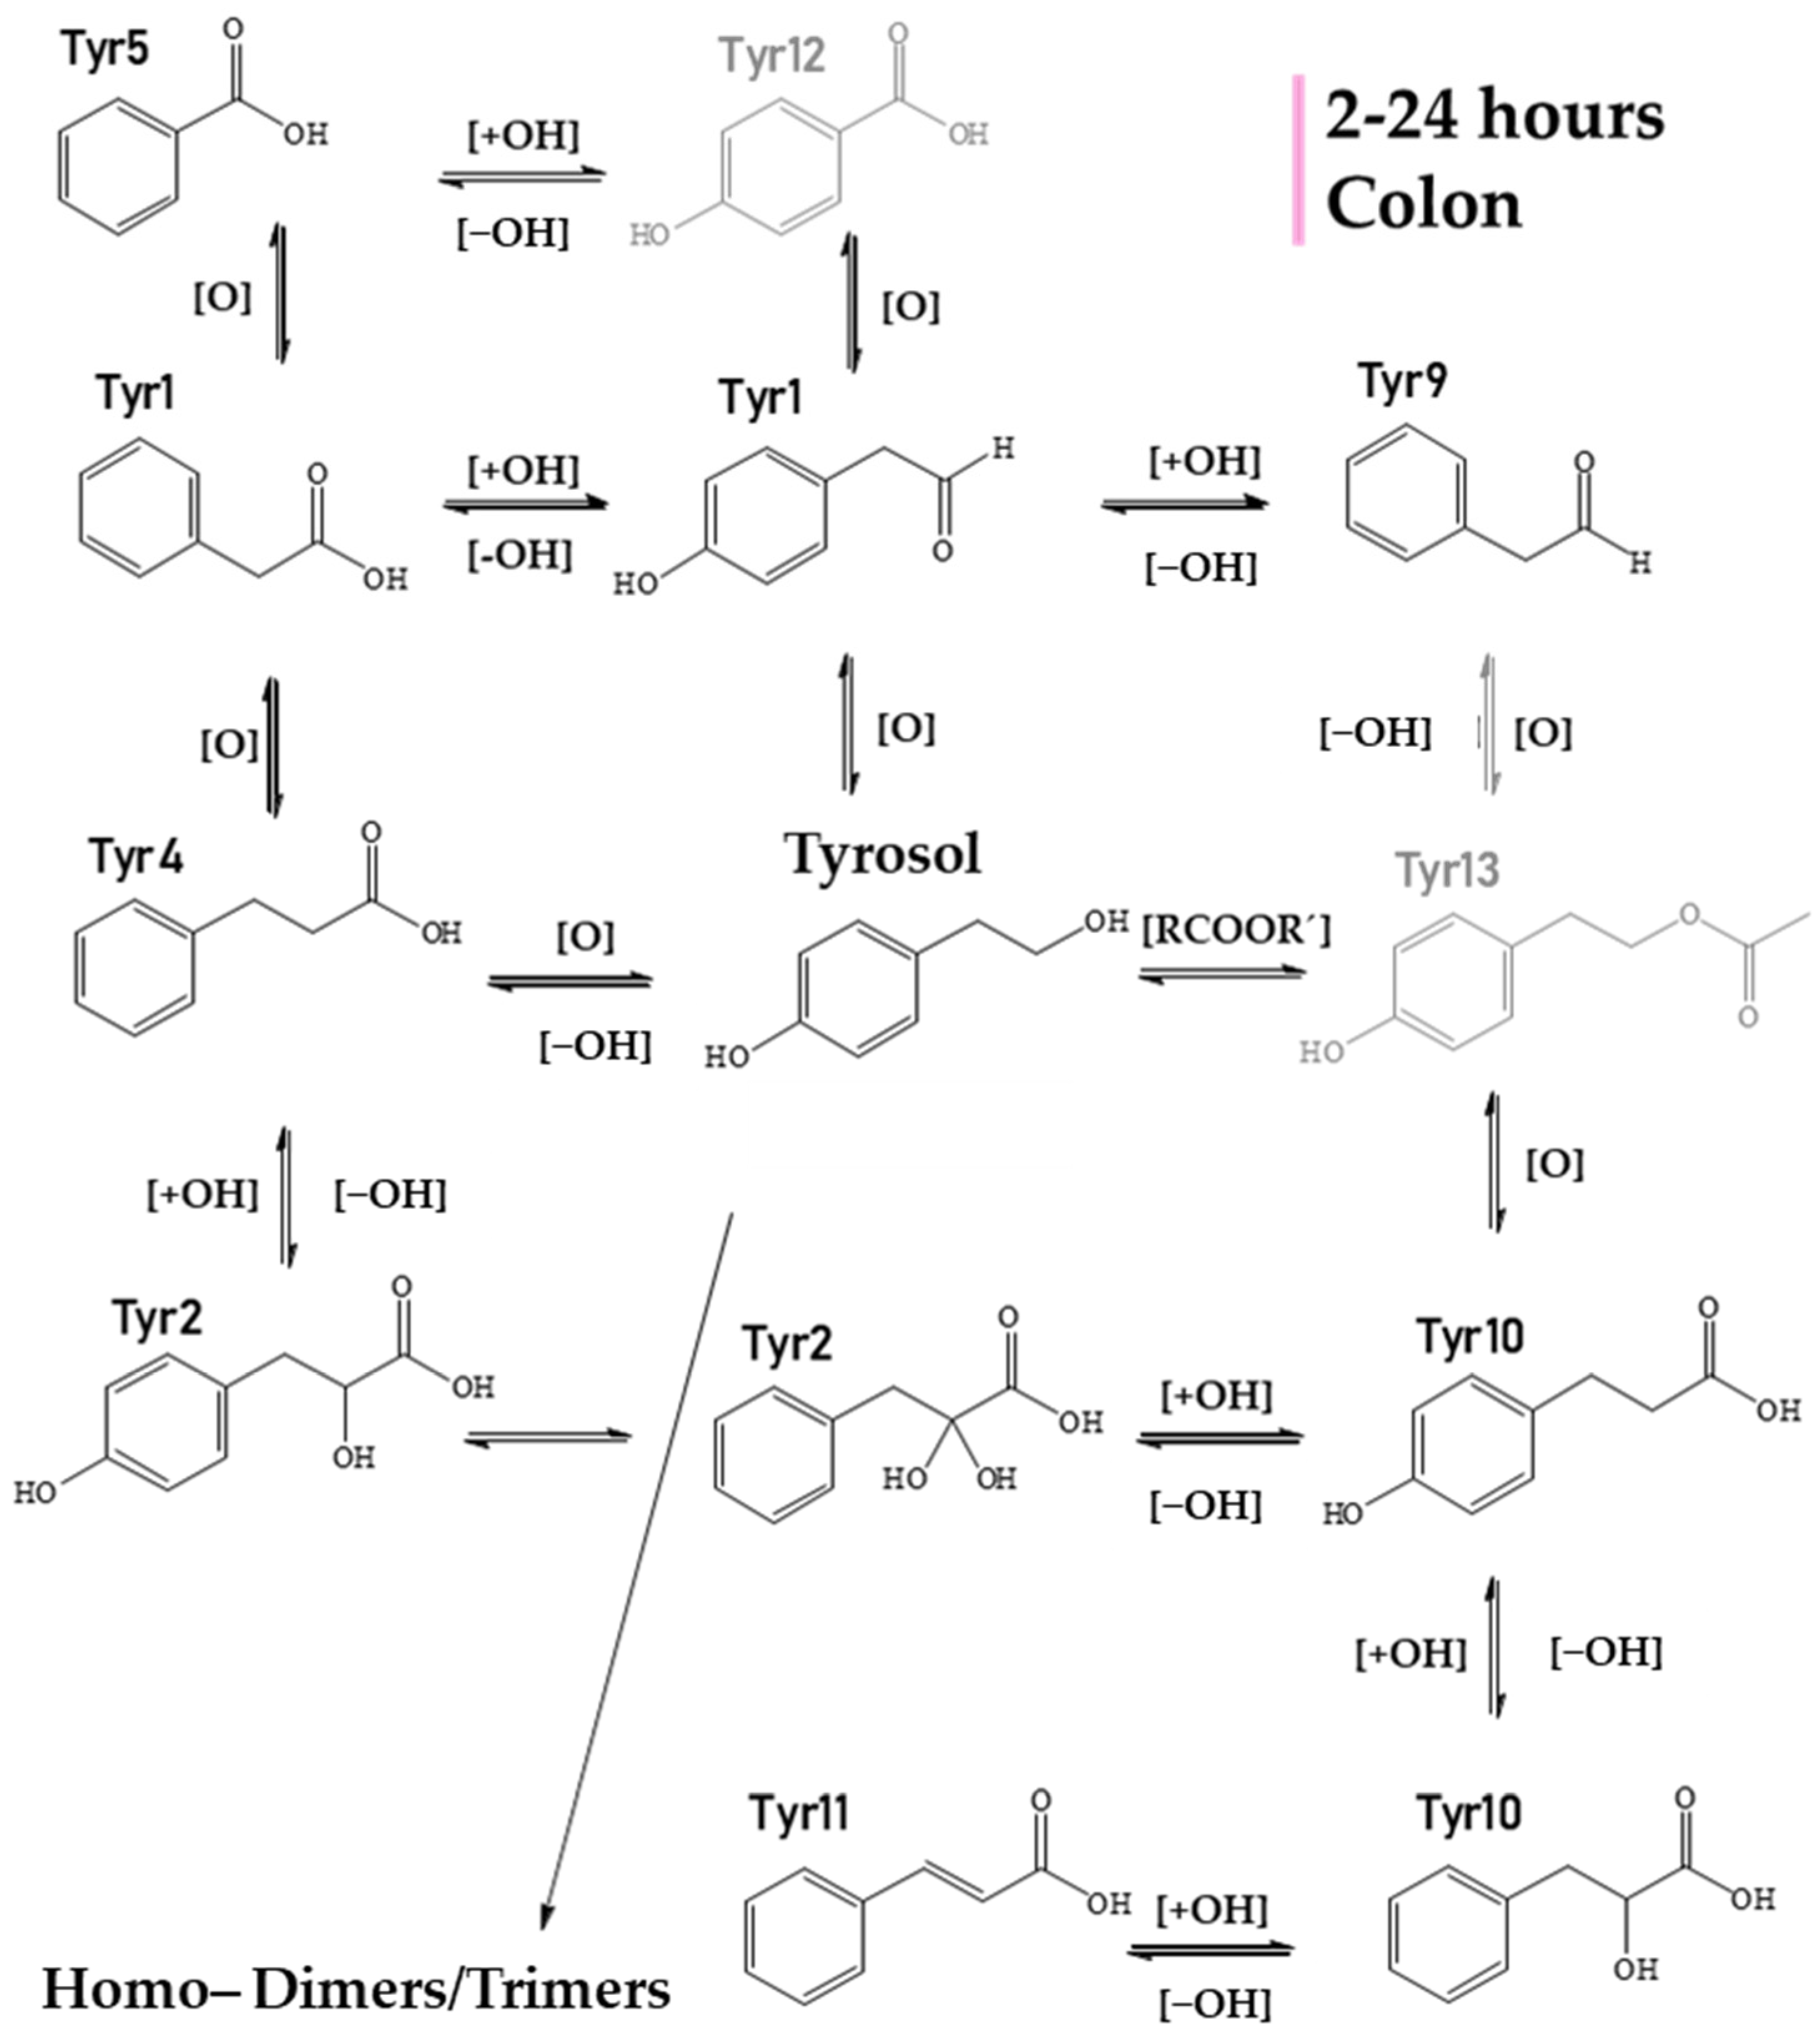
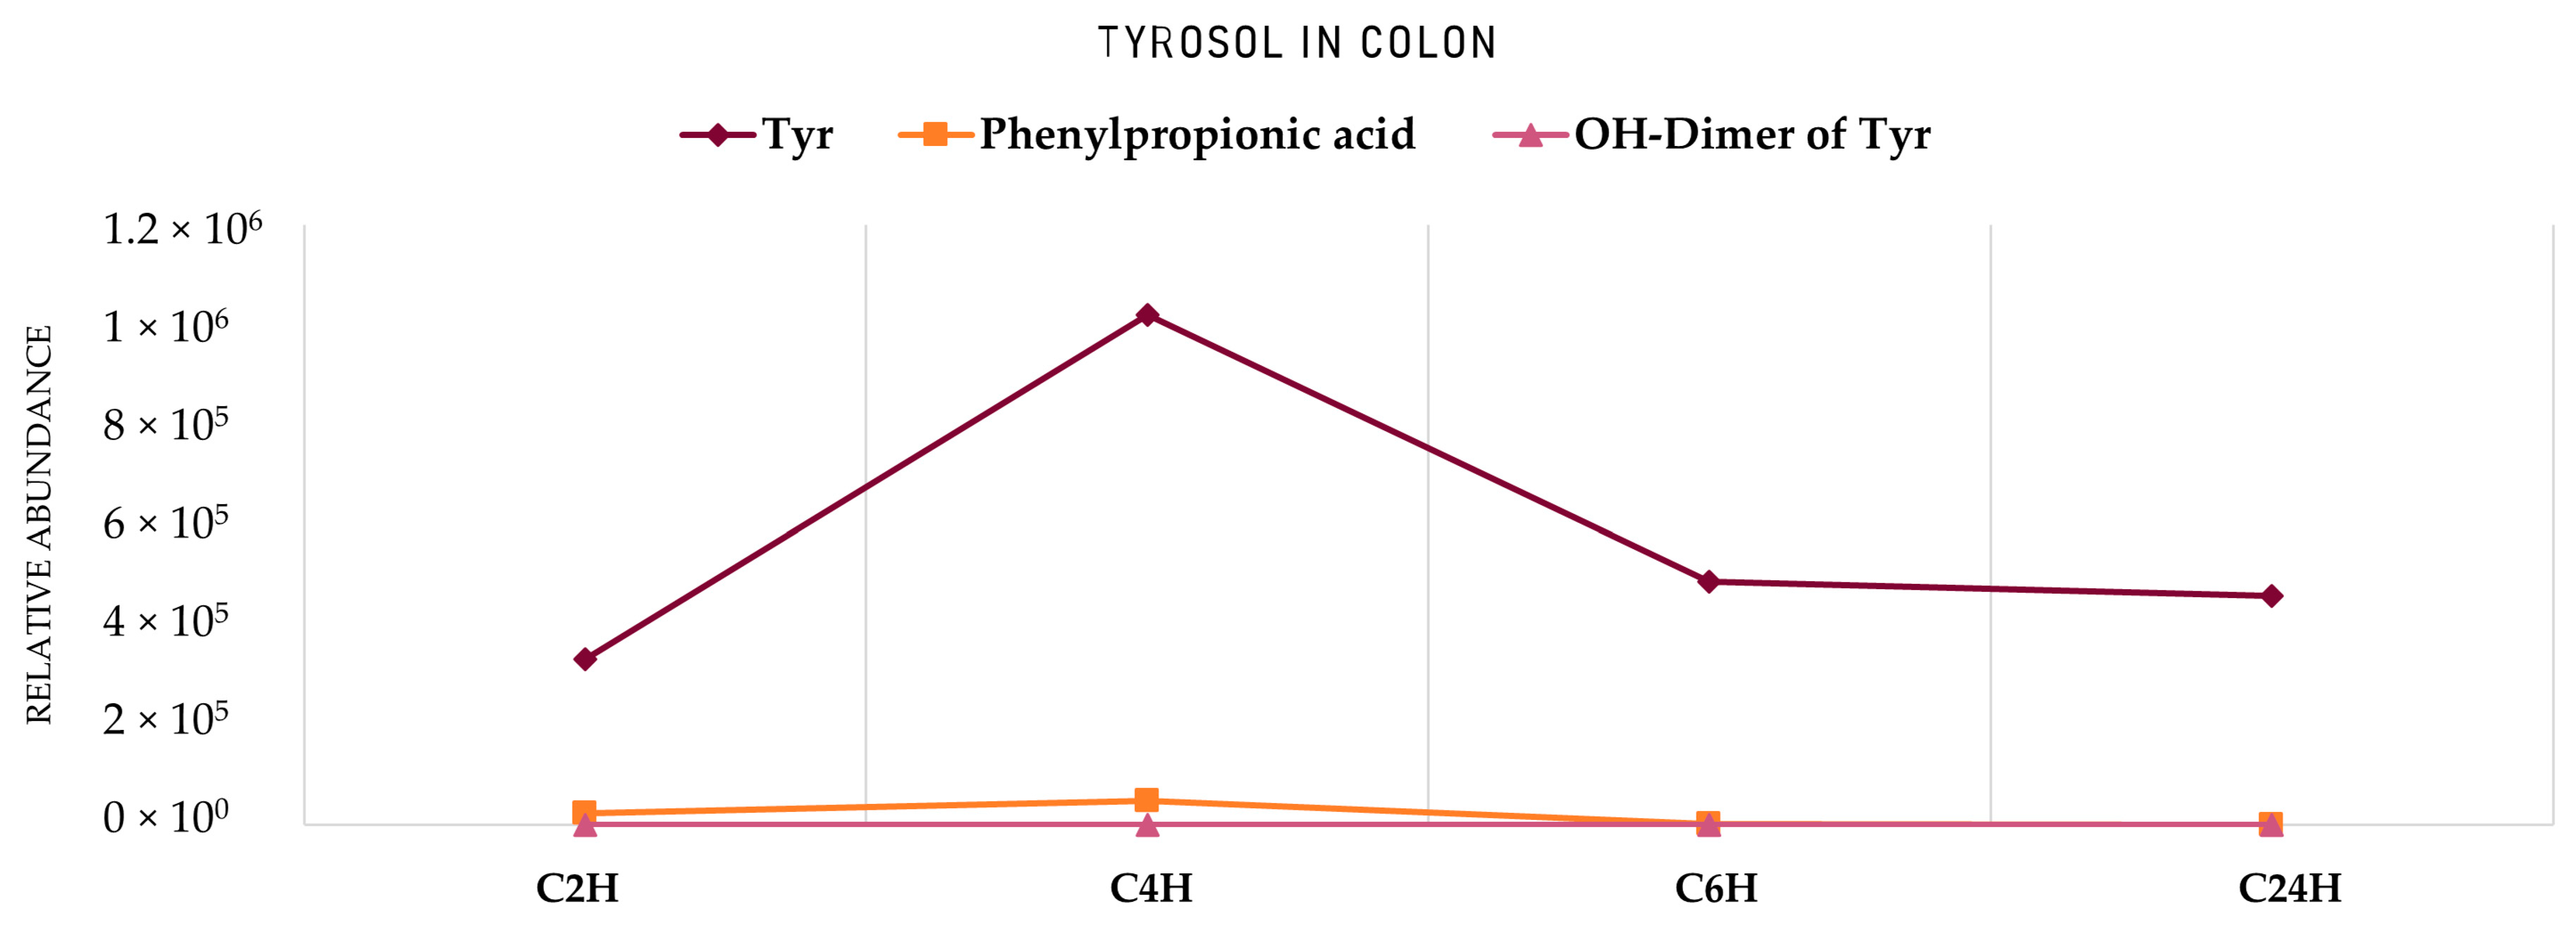
2. Results
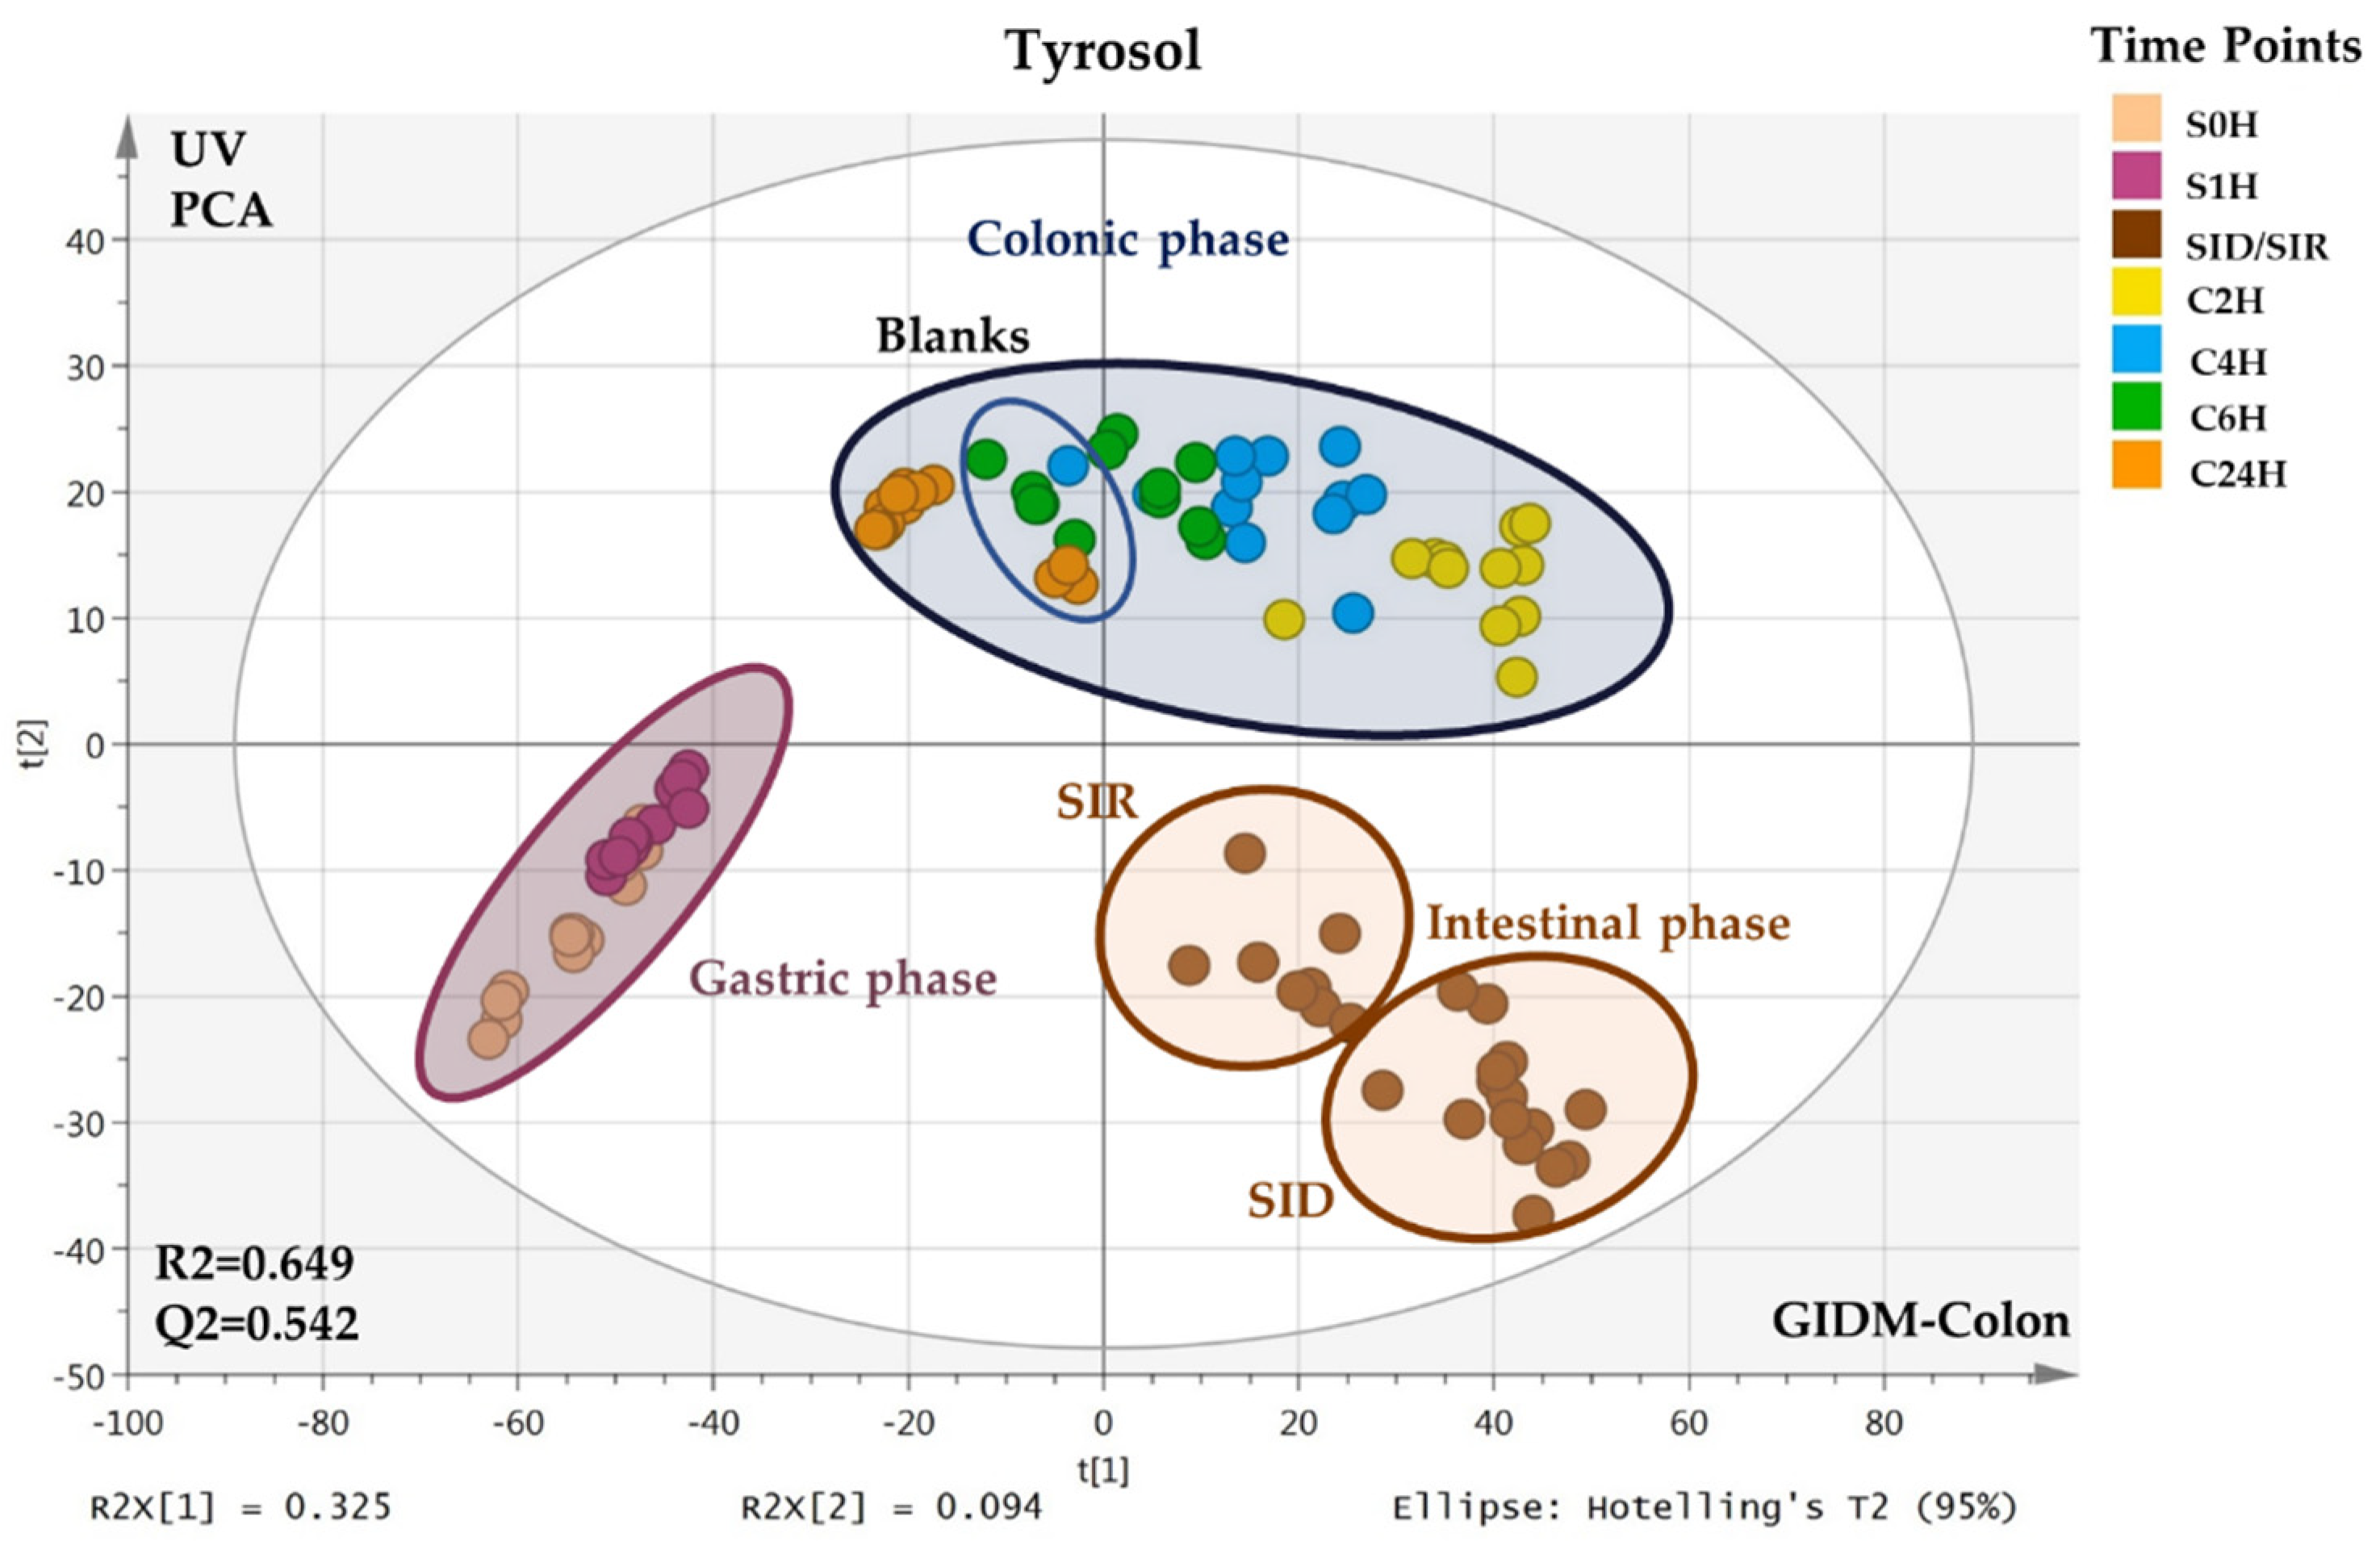
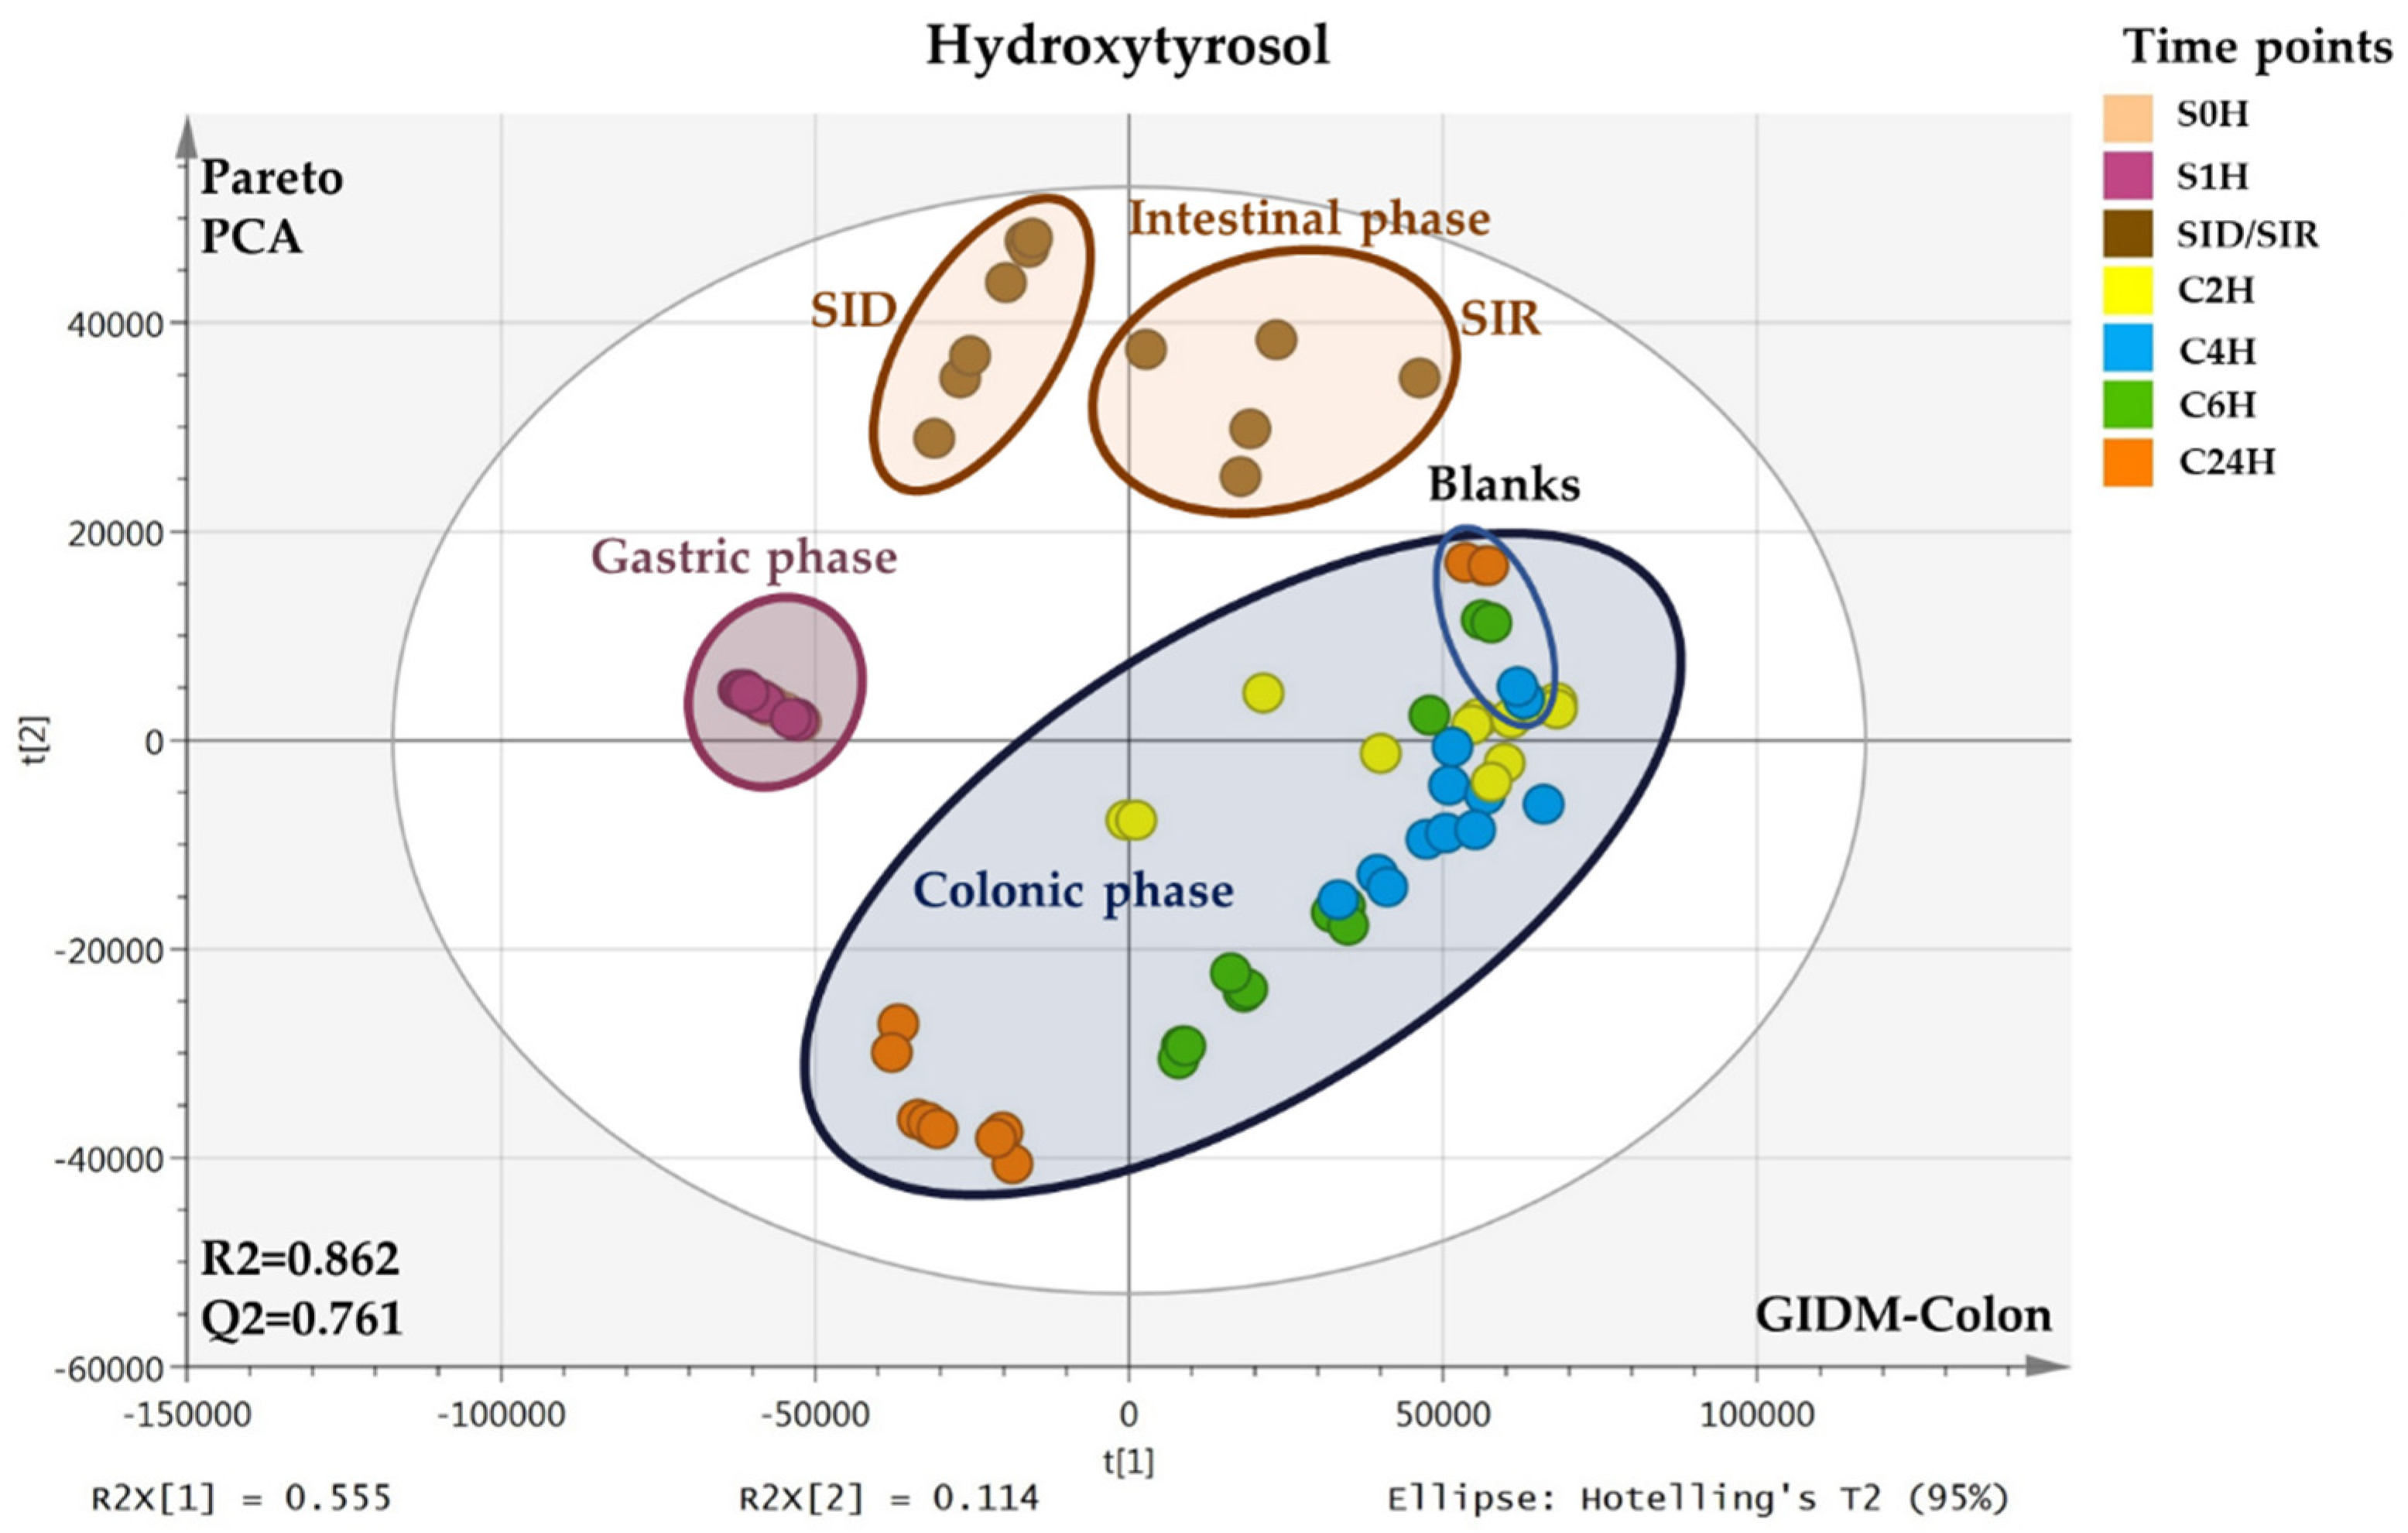
2.1. MVA–PCA Analysis
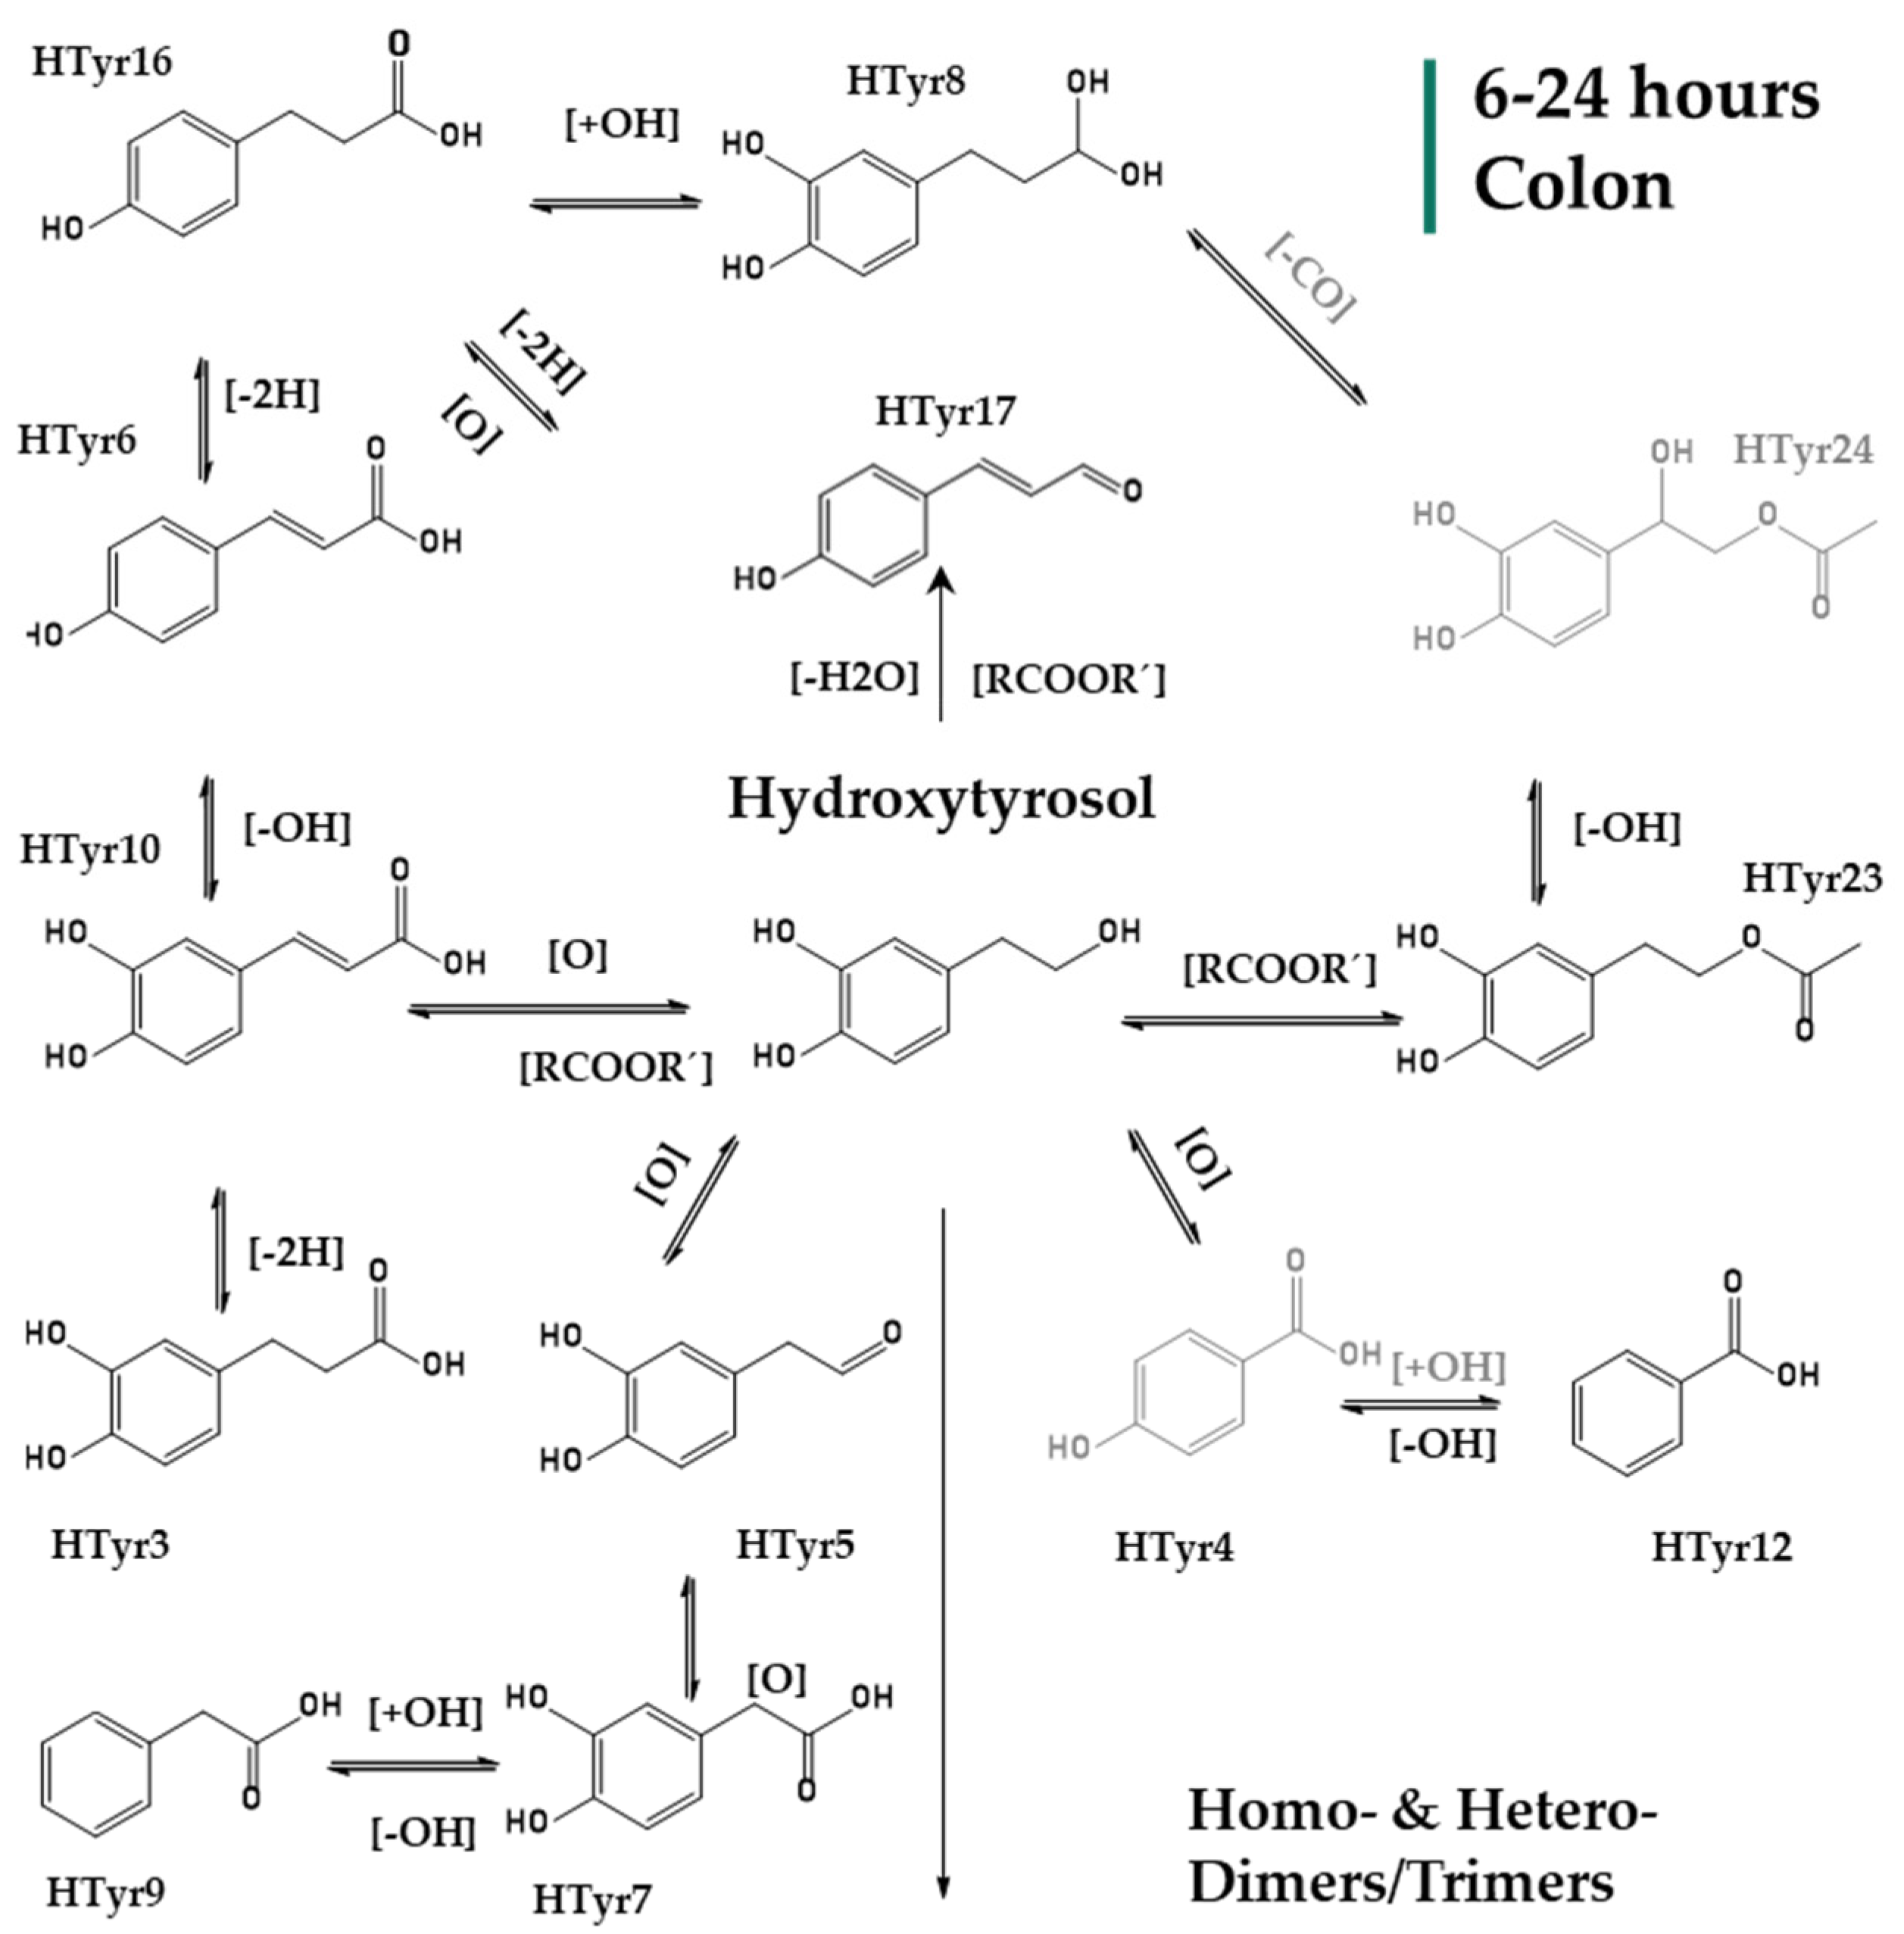
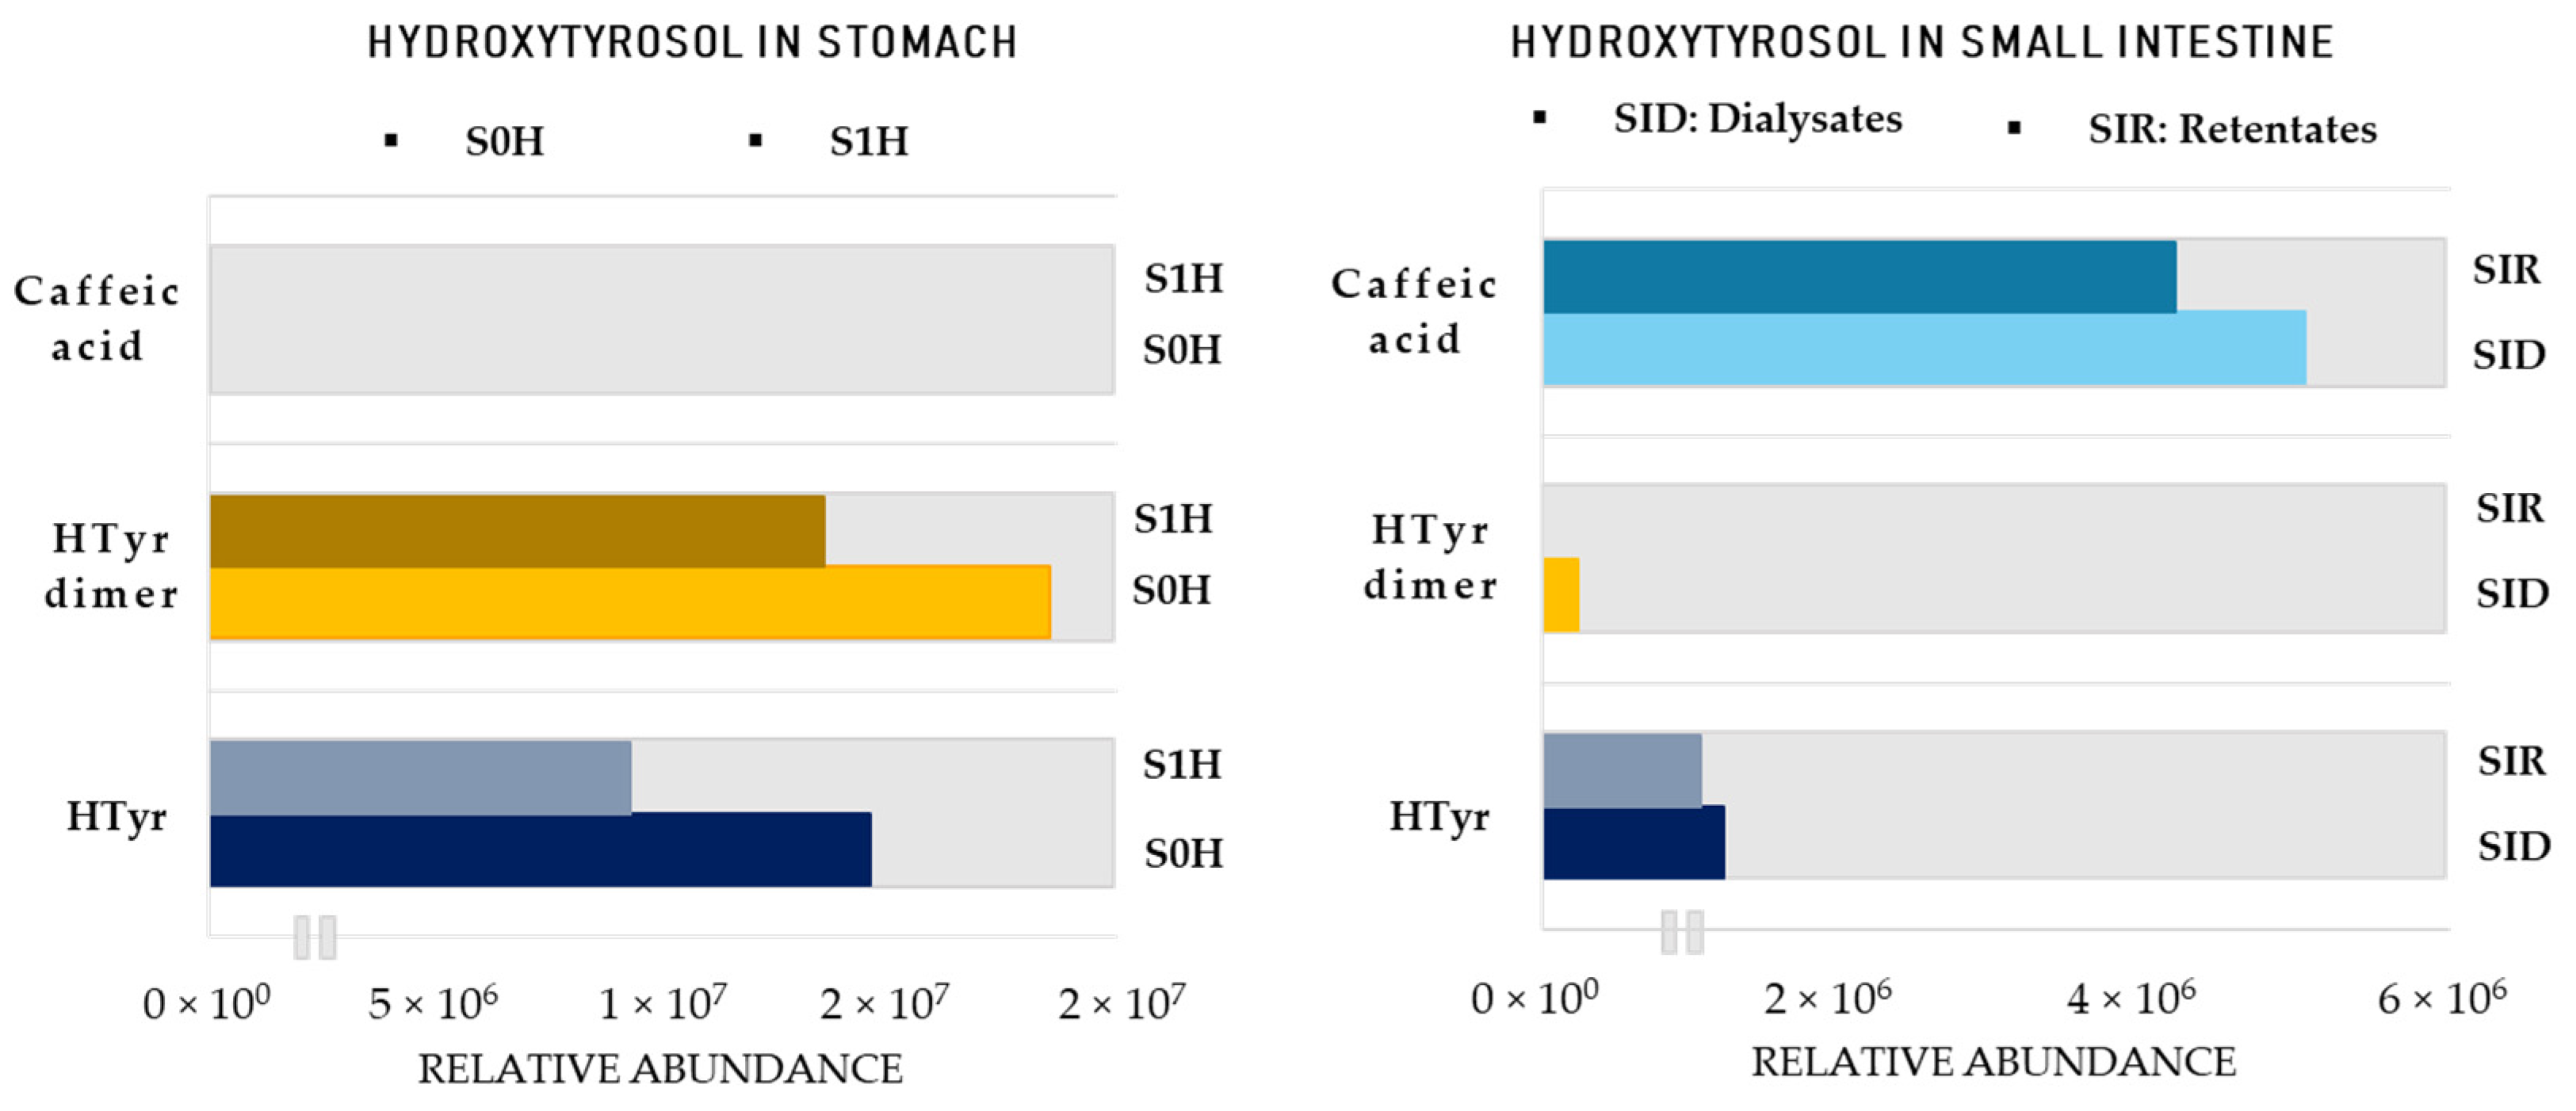
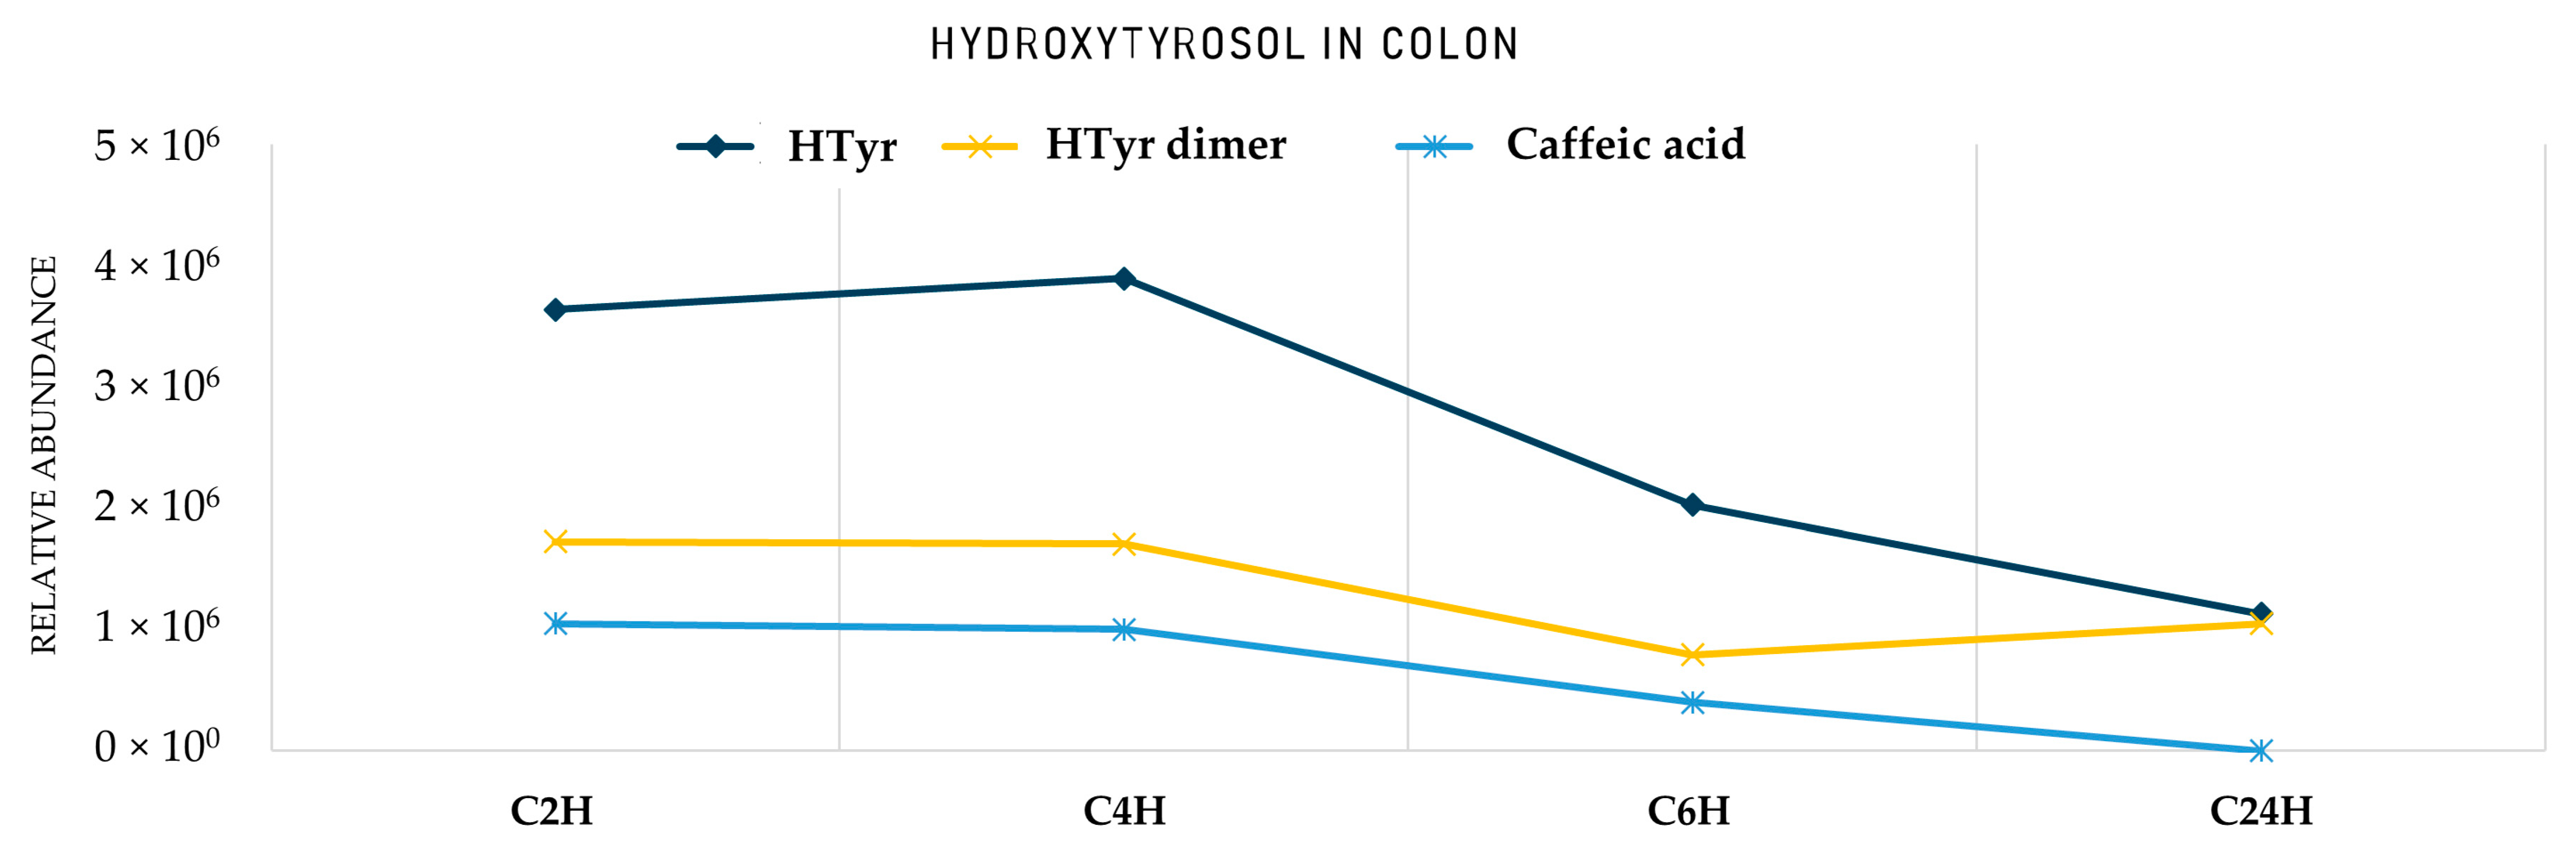
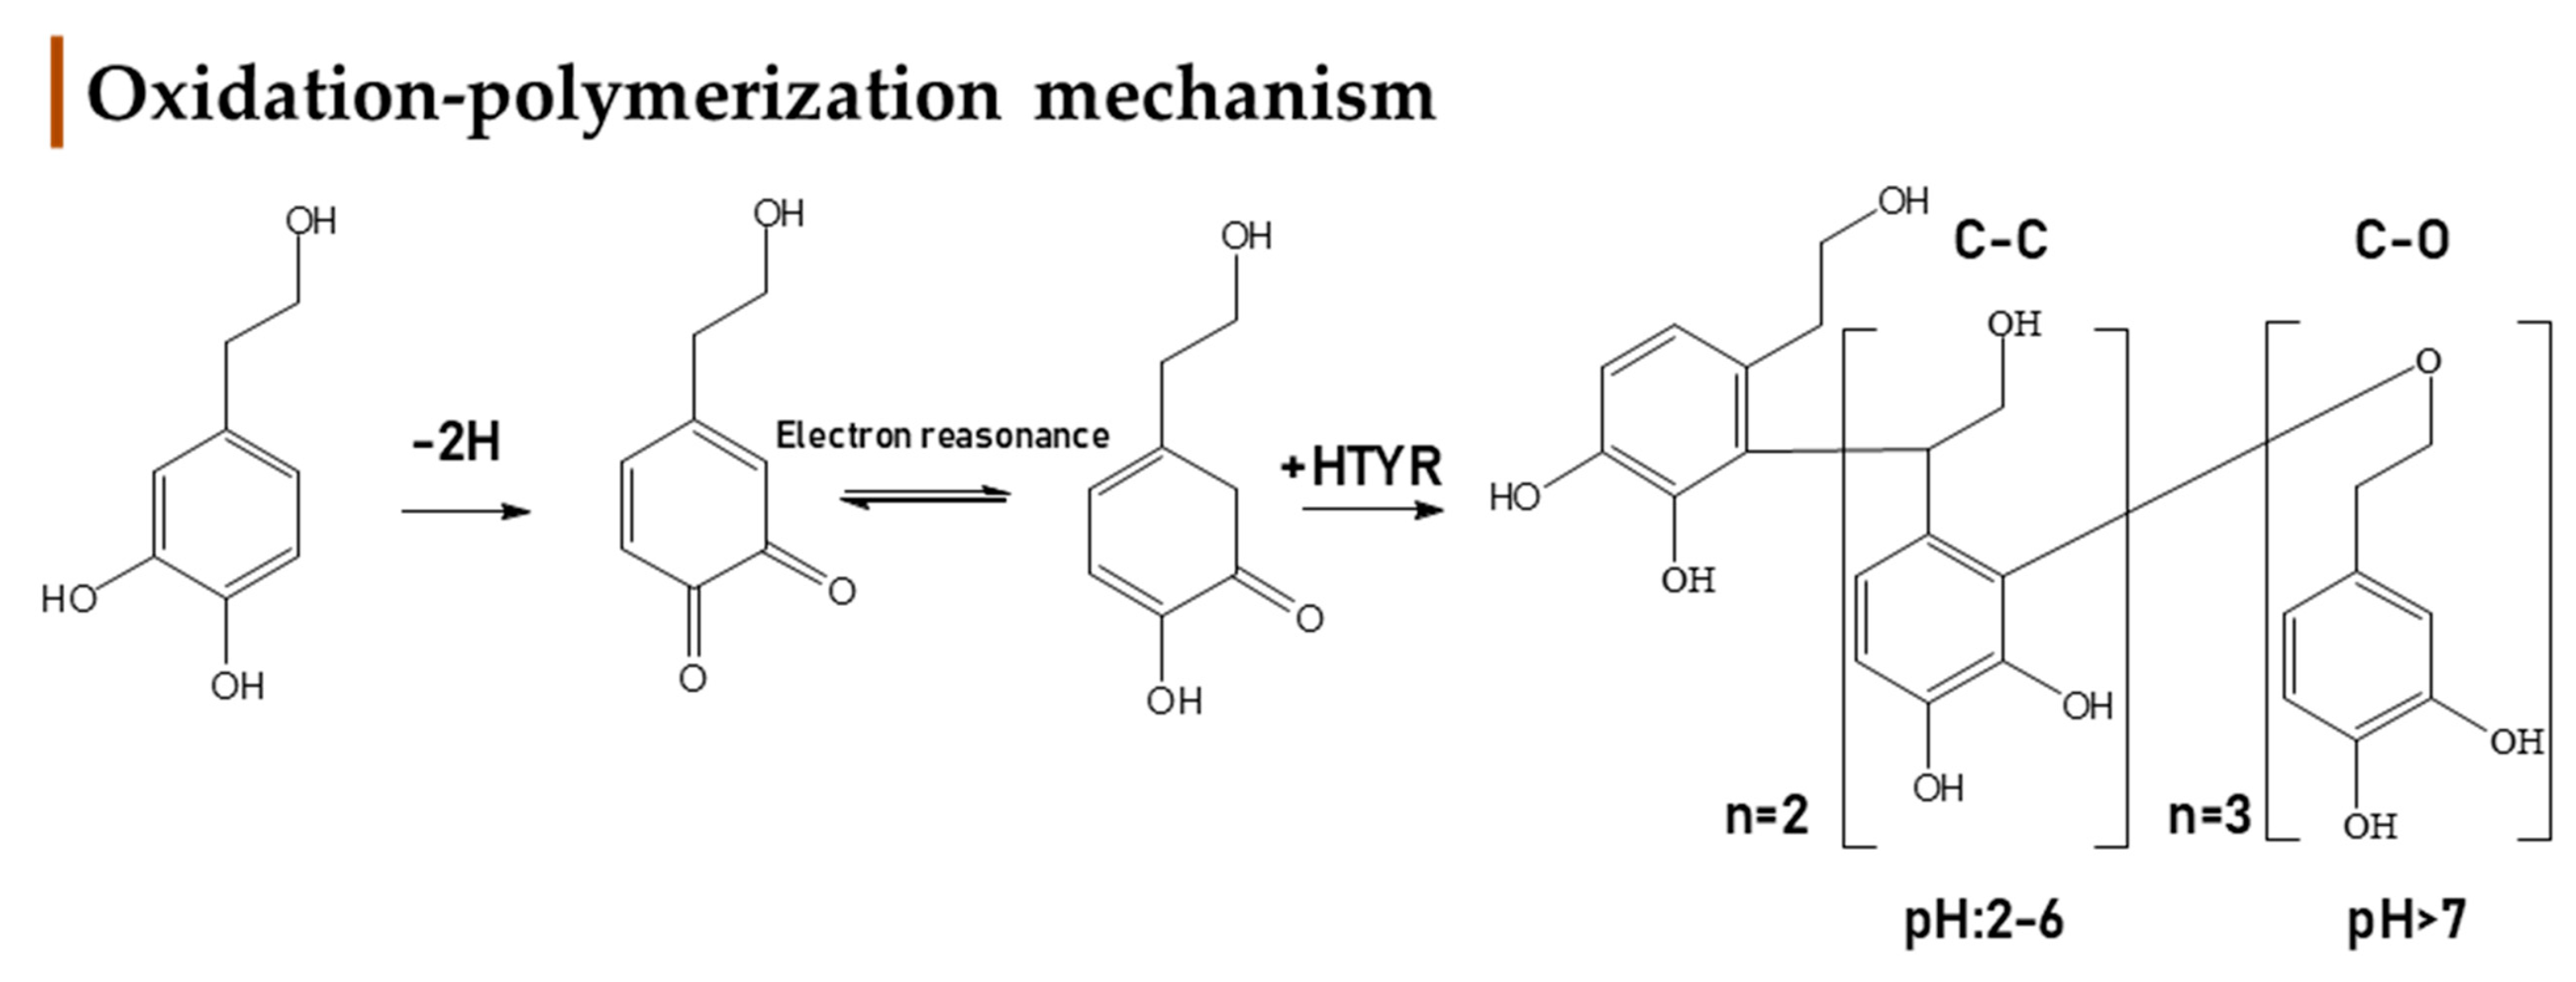
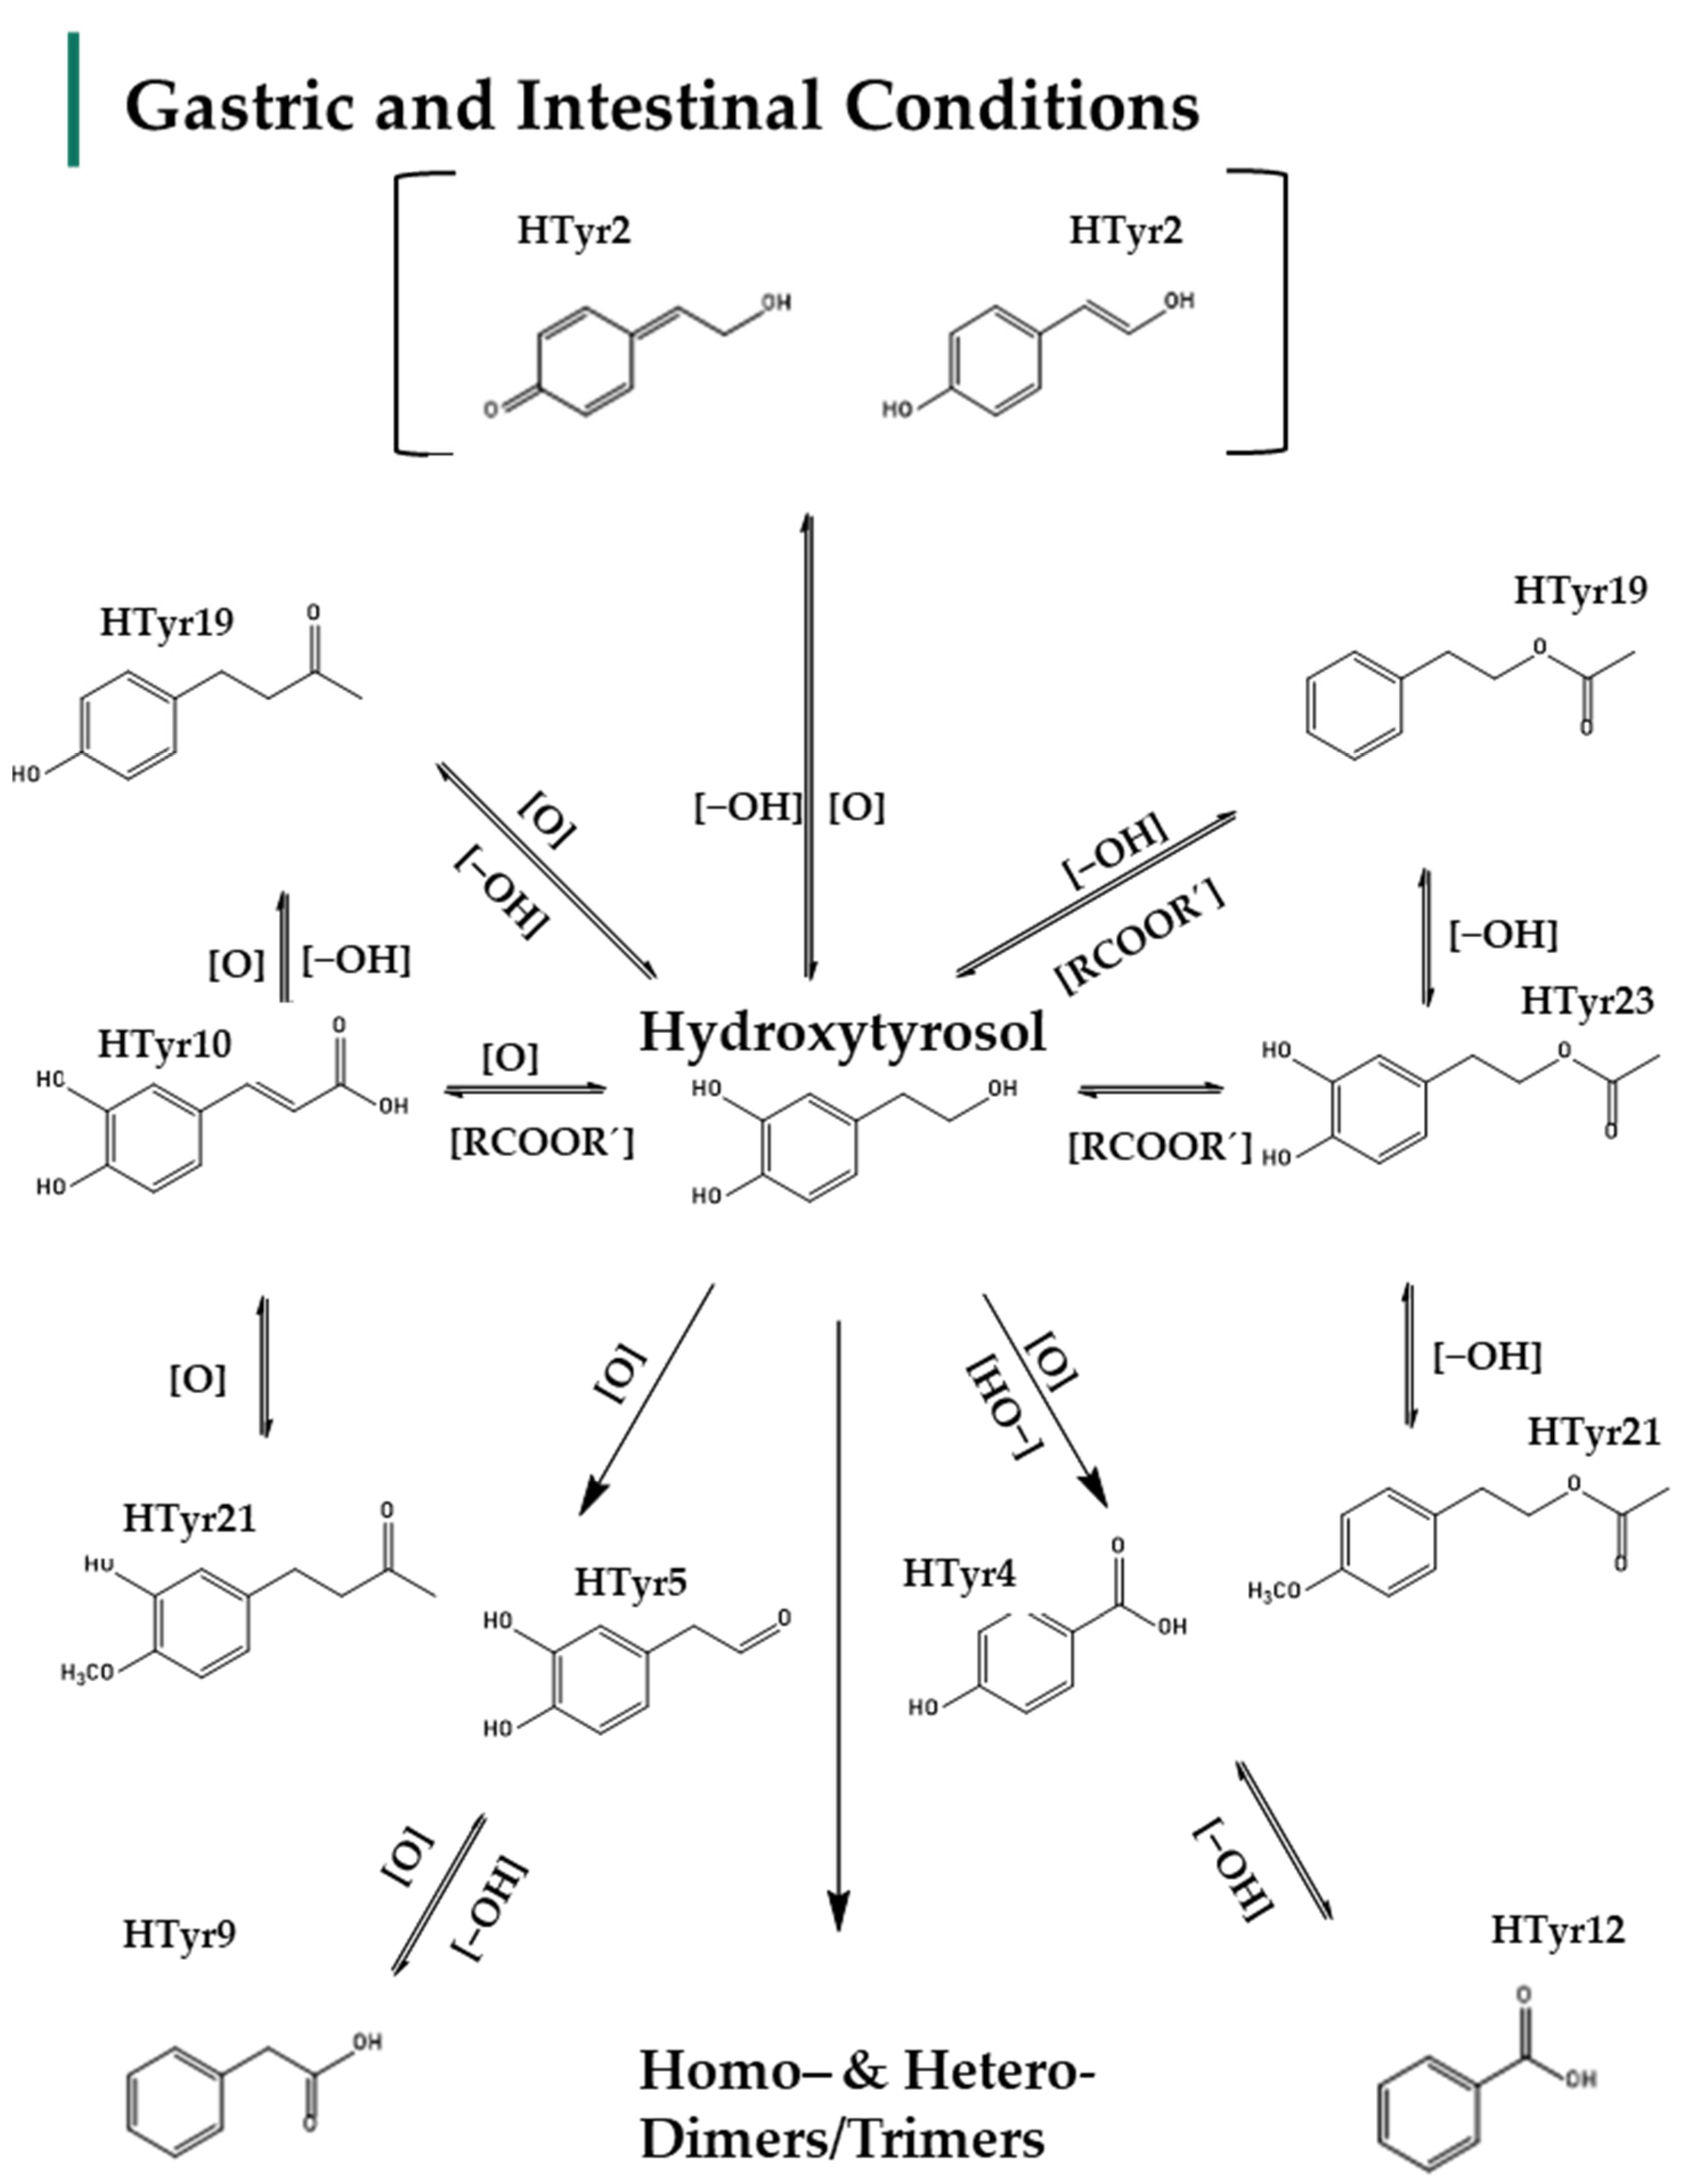
2.2. Identification of HTyr and Tyr Metabolites
3. Discussion
4. Materials and Methods
4.1. Chemicals and Materials
4.2. Equipment
4.3. Preparation of Digestive Juices
4.4. Preparation of the Fecal Slurry
4.5. Cultivation of the Fecal Slurry Suspension
4.6. GastroIntestinal Dialysis Model with Colon Phase, GIDM–Colon
4.6.1. Gastric Stage
4.6.2. Small Intestinal Stage
4.6.3. Colonic Stage
4.7. HPLC Analysis of 6 h Retentate Samples of Chlorogenic Acid Colonic Metabolism
4.8. Sample Pretreatment Prior Analysis, Quality Control Samples and Data Acquisition
4.9. UPLC–-HRMS Analysis of Samples
4.10. Statistical Process and Chemometrics
4.11. Identification Workflow
5. Conclusions
Supplementary Materials
Author Contributions
Funding
Institutional Review Board Statement
Informed Consent Statement
Data Availability Statement
Acknowledgments
Conflicts of Interest
References
- Marković, A.K.; Torić, J.; Barbarić, M.; Brala, C.J. Hydroxytyrosol, tyrosol and derivatives and their potential effects on human health. Molecules 2019, 24, 2001. [Google Scholar] [CrossRef] [PubMed] [Green Version]
- Gavahian, M.; Mousavi Khaneghah, A.; Lorenzo, J.M.; Munekata, P.E.S.; Garcia-Mantrana, I.; Collado, M.C.; Meléndez-Martínez, A.J.; Barba, F.J. Health benefits of olive oil and its components: Impacts on gut microbiota antioxidant activities, and prevention of noncommunicable diseases. Trends Food Sci. Technol. 2019, 88, 220–227. [Google Scholar] [CrossRef]
- Santangelo, C.; Vari, R.; Scazzocchio, B.; De Sanctis, P.; Giovannini, C.; D’Archivio, M.; Masella, R. Anti-inflammatory Activity of Extra Virgin Olive Oil Polyphenols: Which Role in the Prevention and Treatment of Immune-Mediated Inflammatory Diseases? Endocr. Metab. Immune Disord. Drug Targets 2017, 18, 36–50. [Google Scholar] [CrossRef] [PubMed]
- González-Santiago, M.; Fonollá, J.; Lopez-Huertas, E. Human absorption of a supplement containing purified hydroxytyrosol, a natural antioxidant from olive oil, and evidence for its transient association with low-density lipoproteins. Pharmacol. Res. 2010, 61, 364–370. [Google Scholar] [CrossRef]
- Panel, E.; Nda, A. Scientific Opinion on the substantiation of health claims related to polyphenols in olive and protection of LDL particles from oxidative damage (ID 1333, 1638, 1639, 1696, 2865), maintenance of normal blood HDL cholesterol concentrations (ID 1639), mainte. EFSA J. 2011, 9, 1–25. [Google Scholar] [CrossRef]
- Rodríguez-Morató, J.; Boronat, A.; Kotronoulas, A.; Pujadas, M.; Pastor, A.; Olesti, E.; Pérez-Mañá, C.; Khymenets, O.; Fitó, M.; Farré, M.; et al. Metabolic disposition and biological significance of simple phenols of dietary origin: Hydroxytyrosol and tyrosol. Drug Metab. Rev. 2016, 48, 218–236. [Google Scholar] [CrossRef] [Green Version]
- De La Torre, R.; Covas, M.I.; Pujadas, M.A.; Fitó, M.; Farré, M. Is dopamine behind the health benefits of red wine? Eur. J. Nutr. 2006, 45, 307–310. [Google Scholar] [CrossRef] [PubMed]
- D’Angelo, C.; Franceschelli, S.; Quiles, J.L.; Speranza, L. Wide Biological Role of Hydroxytyrosol: Possible Therapeutic and Preventive Properties in Cardiovascular Diseases. Cells 2020, 9, 1932. [Google Scholar] [CrossRef]
- Boronat, A.; Mateus, J.; Soldevila-Domenech, N.; Guerra, M.; Rodríguez-Morató, J.; Varon, C.; Muñoz, D.; Barbosa, F.; Morales, J.C.; Gaedigk, A.; et al. Cardiovascular benefits of tyrosol and its endogenous conversion into hydroxytyrosol in humans. A randomized, controlled trial. Free Radic. Biol. Med. 2019, 143, 471–481. [Google Scholar] [CrossRef]
- De La Torre, R. Bioavailability of olive oil phenolic compounds in humans. Inflammopharmacology 2008, 16, 245–247. [Google Scholar] [CrossRef]
- Heleno, S.A.; Martins, A.; Queiroz, M.J.R.P.; Ferreira, I.C.F.R. Bioactivity of phenolic acids: Metabolites versus parent compounds: A review. Food Chem. 2015, 173, 501–513. [Google Scholar] [CrossRef] [PubMed] [Green Version]
- Hakala, K. Liquid Chromatography-Mass Spectrometry in Studies of Drug Metabolism and Permeability. 2008. Available online: https://helda.helsinki.fi/handle/10138/19166 (accessed on 30 March 2022).
- Rein, M.J.; Renouf, M.; Cruz-Hernandez, C.; Actis-Goretta, L.; Thakkar, S.K.; da Silva Pinto, M. Bioavailability of bioactive food compounds: A challenging journey to bioefficacy. Br. J. Clin. Pharmacol. 2013, 75, 588–602. [Google Scholar] [CrossRef] [PubMed] [Green Version]
- Serreli, G.; Deiana, M. Biological Relevance of Extra Virgin Olive Oil Polyphenols Metabolites. Antioxidants 2018, 7, 170. [Google Scholar] [CrossRef] [Green Version]
- Serreli, G.; Le Sayec, M.; Diotallevi, C.; Teissier, A.; Deiana, M.; Corona, G. Conjugated metabolites of hydroxytyrosol and tyrosol contribute to the maintenance of nitric oxide balance in human aortic endothelial cells at physiologically relevant concentrations. Molecules 2021, 26, 7480. [Google Scholar] [CrossRef] [PubMed]
- Atul Bhattaram, V.; Graefe, U.; Kohlert, C.; Veit, M.; Derendorf, H. Pharmacokinetics and Bioavailability of Herbal Medicinal Products. Phytomedicine 2002, 9, 1–33. [Google Scholar] [CrossRef]
- Borah, P.; Hazarika, S.; Deka, S.; Venugopala, K.N.; Nair, A.B.; Attimarad, M.; Sreeharsha, N.; Mailavaram, R.P. Application of Advanced Technologies in Natural Product Research: A Review with Special Emphasis on ADMET Profiling. Curr. Drug Metab. 2020, 21, 751–767. [Google Scholar] [CrossRef] [PubMed]
- Koppel, N.; Rekdal, V.M.; Balskus, E.P. Chemical transformation of xenobiotics by the human gut microbiota. Science 2018, 356, 1246–1257. [Google Scholar] [CrossRef]
- Possemiers, S.; Bolca, S.; Verstraete, W.; Heyerick, A. The intestinal microbiome: A separate organ inside the body with the metabolic potential to influence the bioactivity of botanicals. Fitoterapia 2011, 82, 53–66. [Google Scholar] [CrossRef] [PubMed]
- Corona, G.; Spencer, J.; Dessì, M. Extra virgin olive oil phenolics: Absorption, metabolism, and biological activities in the GI tract. Toxicol. Ind. Health 2009, 25, 285–293. [Google Scholar] [CrossRef] [PubMed]
- Vissers, M.N.; Zock, P.L.; Katan, M.B. Bioavailability and antioxidant effects of olive oil phenols in humans: A review. Eur. J. Clin. Nutr. 2004, 58, 955–965. [Google Scholar] [CrossRef] [PubMed]
- Suárez, M.; Romero, M.P.; Macià, A.; Valls, R.M.; Fernández, S.; Solà, R.; Motilva, M.J. Improved method for identifying and quantifying olive oil phenolic compounds and their metabolites in human plasma by microelution solid-phase extraction plate and liquid chromatography-tandem mass spectrometry. J. Chromatogr. B Anal. Technol. Biomed. Life Sci. 2009, 877, 4097–4106. [Google Scholar] [CrossRef]
- Kotronoulas, A.; Pizarro, N.; Serra, A.; Robledo, P.; Joglar, J.; Rubió, L.; Hernaéz, Á.; Tormos, C.; Motilva, M.J.; Fitó, M.; et al. Dose-dependent metabolic disposition of hydroxytyrosol and formation of mercapturates in rats. Pharmacol. Res. 2013, 77, 47–56. [Google Scholar] [CrossRef] [PubMed]
- Rodríguez-Morató, J.; Robledo, P.; Tanner, J.A.; Boronat, A.; Pérez-Mañá, C.; Oliver Chen, C.Y.; Tyndale, R.F.; de la Torre, R. CYP2D6 and CYP2A6 biotransform dietary tyrosol into hydroxytyrosol. Food Chem. 2017, 217, 716–725. [Google Scholar] [CrossRef] [PubMed] [Green Version]
- López de las Hazas, M.C.; Godinho-Pereira, J.; Macià, A.; Almeida, A.F.; Ventura, M.R.; Motilva, M.J.; Santos, C.N. Brain uptake of hydroxytyrosol and its main circulating metabolites: Protective potential in neuronal cells. J. Funct. Foods 2018, 46, 110–117. [Google Scholar] [CrossRef]
- Mateos, R.; Goya, L.; Bravo, L. Metabolism of the olive oil phenols hydroxytyrosol, tyrosol, and hydroxytyrosyl acetate by human hepatoma HepG2 cells. J. Agric. Food Chem. 2005, 53, 9897–9905. [Google Scholar] [CrossRef] [PubMed] [Green Version]
- Lee, D.H.; Kim, Y.J.; Kim, M.J.; Ahn, J.; Ha, T.Y.; Lee, S.H.; Jang, Y.J.; Jung, C.H. Pharmacokinetics of tyrosol metabolites in rats. Molecules 2016, 21, 128. [Google Scholar] [CrossRef] [Green Version]
- Miloš, J.; Belaj, A.; Pascual, M.; Sanz, C. Handbook of Olive Oil: Phenolic Compounds, Production and Health Benefits, 1st ed.; Miloš, J., Ed.; Nova Science Publishers: New York, NY, USA, 2017; ISBN 9781536123562. [Google Scholar]
- Mosele, J.I.; Martín-Peláez, S.; Macià, A.; Farràs, M.; Valls, R.M.; Catalán, Ú.; Motilva, M.J. Faecal microbial metabolism of olive oil phenolic compounds: In vitro and in vivo approaches. Mol. Nutr. Food Res. 2014, 58, 1809–1819. [Google Scholar] [CrossRef]
- Mosele, J.I.; Macià, A.; Motilva, M.J. Metabolic and microbial modulation of the large intestine ecosystem by non-absorbed diet phenolic compounds: A review. Molecules 2015, 20, 17429–17468. [Google Scholar] [CrossRef] [PubMed] [Green Version]
- López De Las Hazas, M.C.; Piñol, C.; Macià, A.; Motilva, M.J. Hydroxytyrosol and the Colonic Metabolites Derived from Virgin Olive Oil Intake Induce Cell Cycle Arrest and Apoptosis in Colon Cancer Cells. J. Agric. Food Chem. 2017, 65, 6467–6476. [Google Scholar] [CrossRef] [PubMed]
- Ruiz-Garcia, A.; Bermejo, M.; Moss, A.; Casabo, V.G. Pharmacokinetics in drug discovery. J. Pharm. Sci. 2008, 97, 654–690. [Google Scholar] [CrossRef] [PubMed]
- Cheng, F.; Li, W.; Liu, G.; Tang, Y. In Silico ADMET Prediction: Recent Advances, Current Challenges and Future Trends. Curr. Top. Med. Chem. 2013, 13, 1273–1289. [Google Scholar] [CrossRef]
- Zhang, T.; Chen, Q.; Li, L.; Angela Liu, L.; Wei, D.-Q. In Silico Prediction of Cytochrome P450-Mediated Drug Metabolism. Comb. Chem. High Throughput Screen. 2011, 14, 388–395. [Google Scholar] [CrossRef] [PubMed]
- Manna, C.; Galletti, P.; Maisto, G.; Cucciolla, V.; D’Angelo, S.; Zappia, V. Transport mechanism and metabolism of olive oil hydroxytyrosol in Caco-2 cells. FEBS Lett. 2000, 470, 341–344. [Google Scholar] [CrossRef] [Green Version]
- D’Angelo, S.; Manna, C.; Migliardi, V.; Mazzoni, O.; Morrica, P.; Capasso, G.; Pontoni, G.; Galletti, P.; Zappia, V. Pharmacokinetics and metabolism of hydroxytyrosol, a natural antioxidant from olive oil. Drug Metab. Dispos. 2001, 29, 1492–1498. [Google Scholar] [PubMed]
- Miro-Casas, E.; Covas, M.I.; Farre, M.; Fito, M.; Ortuño, J.; Weinbrenner, T.; Roset, P.; De La Torre, R. Hydroxytyrosol disposition in humans. Clin. Chem. 2003, 49, 945–952. [Google Scholar] [CrossRef] [PubMed] [Green Version]
- Robles-Almazan, M.; Pulido-Moran, M.; Moreno-Fernandez, J.; Ramirez-Tortosa, C.; Rodriguez-Garcia, C.; Quiles, J.L.; Ramirez-Tortosa, M. Hydroxytyrosol: Bioavailability, toxicity, and clinical applications. Food Res. Int. 2018, 105, 654–667. [Google Scholar] [CrossRef]
- Derendorf, H. Pharmacokinetics of Natural Compounds. Planta Med. 2012, 78, IL41. [Google Scholar] [CrossRef]
- Breynaert, A.; Bosscher, D.; Kahnt, A.; Claeys, M.; Cos, P.; Pieters, L.; Hermans, N. Development and Validation of an in vitro Experimental GastroIntestinal Dialysis Model with Colon Phase to Study the Availability and Colonic Metabolisation of Polyphenolic Compounds. Planta Med. 2015, 81, 1075–1083. [Google Scholar] [CrossRef]
- Fedi, A.; Vitale, C.; Ponschin, G.; Ayehunie, S.; Fato, M.; Scaglione, S. In vitro models replicating the human intestinal epithelium for absorption and metabolism studies: A systematic review. J. Control Release 2021, 335, 247–268. [Google Scholar] [CrossRef] [PubMed]
- Cassidy, A.; Minihane, A.M. The role of metabolism (and the microbiome) in defining the clinical efficacy of dietary flavonoids. Am. J. Clin. Nutr. 2017, 105, 10–22. [Google Scholar] [CrossRef] [Green Version]
- Landberg, R.; Manach, C.; Kerckhof, F.-M.; Minihane, A.-M.; Saleh, R.N.M.; De Roos, B.; Tomas-Barberan, F.; Morand, C.; Van de Wiele, T. Future prospects for dissecting inter-individual variability in the absorption, distribution and elimination of plant bioactives of relevance for cardiometabolic endpoints. Eur. J. Nutr. 2019, 58, 21–36. [Google Scholar] [CrossRef] [Green Version]
- Van Dooren, I.; Foubert, K.; Bijttebier, S.; Breynaert, A.; Theunis, M.; Exarchou, V.; Claeys, M.; Hermans, N.; Apers, S.; Pieters, L. In vitro gastrointestinal biotransformation and characterization of a Desmodium adscendens decoction: The first step in unravelling its behaviour in the human body. J. Pharm. Pharmacol. 2018, 70, 1414–1422. [Google Scholar] [CrossRef] [PubMed]
- Tuenter, E.; Bijttebier, S.; Foubert, K.; Breynaert, A.; Apers, S.; Hermans, N.; Pieters, L. In Vitro and in Vivo Study of the Gastrointestinal Absorption and Metabolisation of Hymenocardine, a Cyclopeptide Alkaloid. Planta Med. 2017, 83, 790–796. [Google Scholar] [CrossRef] [Green Version]
- Rivera-Mondragón, A.; Peeters, L.; Van, A.A.; Breynaert, A.; Caballero-George, C.; Pieters, L.; Hermans, N.; Foubert, K. Simulated gastrointestinal biotransformation of chlorogenic acid, flavonoids, flavonolignans and triterpenoid saponins in cecropia obtusifolia leaf extract. Planta Med. 2020, 87, 404–416. [Google Scholar] [CrossRef] [PubMed]
- Mortelé, O.; Iturrospe, E.; Breynaert, A.; Lammens, C.; Britto, X.B.; Malhotra-Kumar, S.; Jorens, P.; Pieters, L.; van Nuijs, A.L.N.; Hermans, N. Chlorogenic Acid as a Model Compound for Optimization of an In Vitro Gut Microbiome-Metabolism Model. Proceedings 2019, 11, 31. [Google Scholar] [CrossRef] [Green Version]
- Aschenbrenner, E.M.; Weiss, C.K.; Landfester, K. Enzymatic esterification in aqueous miniemulsions. Chem. A Eur. J. 2009, 15, 2434–2444. [Google Scholar] [CrossRef]
- McDonald, S.; Prenzler, P.D.; Antolovich, M.; Robards, K. Phenolic content and antioxidant activity of olive extracts. Food Chem. 2001, 73, 73–84. [Google Scholar] [CrossRef]
- Alemán-Jiménez, C.; Domínguez-Perles, R.; Medina, S.; Prgomet, I.; López-González, I.; Simonelli-Muñoz, A.; Campillo-Cano, M.; Auñón, D.; Ferreres, F.; Gil-Izquierdo, Á. Pharmacokinetics and bioavailability of hydroxytyrosol are dependent on the food matrix in humans. Eur. J. Nutr. 2020, 60, 905–915. [Google Scholar] [CrossRef] [PubMed]
- Pereira-Caro, G.; Sarriá, B.; Madrona, A.; Espartero, J.L.; Escuderos, M.E.; Bravo, L.; Mateos, R. Digestive stability of hydroxytyrosol, hydroxytyrosyl acetate and alkyl hydroxytyrosyl ethers. Int. J. Food Sci. Nutr. 2012, 63, 703–707. [Google Scholar] [CrossRef] [Green Version]
- Napolitano, A.; De Lucia, M.; Panzella, L.; d’Ischia, M. The Chemistry of Tyrosol and Hydroxytyrosol: Implications for Oxidative Stress. In Olives and Olive Oil in Health and Disease Prevention; Academic Press: Cambridge, MA, USA, 2010; pp. 1225–1232. [Google Scholar]
- Camilleri, M.; Gores, G.J. Therapeutic targeting of bile acids. Am. J. Physiol. Gastrointest. Liver Physiol. 2015, 309, G209–G215. [Google Scholar] [CrossRef] [PubMed] [Green Version]
- Heřmánková, E.; Žák, A.; Poláková, L.; Hobzová, R.; Hromádka, R.; Širc, J. Polymeric bile acid sequestrants: Review of design, in vitro binding activities, and hypocholesterolemic effects. Eur. J. Med. Chem. 2018, 144, 300–317. [Google Scholar] [CrossRef] [PubMed]
- Caruso, D.; Visioli, F.; Patelli, R.; Galli, C.; Galli, G. Urinary excretion of olive oil phenols and their metabolites in humans. Metab.-Clin. Exp. 2001, 50, 1426–1428. [Google Scholar] [CrossRef]
- Tuck, K.L.; Hayball, P.J.; Stupans, I. Structural characterization of the metabolites of hydroxytyrosol, the principal phenolic component in olive oil, in rats. J. Agric. Food Chem. 2002, 50, 2404–2409. [Google Scholar] [CrossRef] [PubMed]
- Khymenets, O.; Farré, M.; Pujadas, M.; Ortiz, E.; Joglar, J.; Covas, M.I.; De La Torre, R. Direct analysis of glucuronidated metabolites of main olive oil phenols in human urine after dietary consumption of virgin olive oil. Food Chem. 2011, 126, 306–314. [Google Scholar] [CrossRef]
- De Lucia, M.; Panzella, L.; Pezzella, A.; Napolitano, A.; D’Ischia, M. Oxidative chemistry of the natural antioxidant hydroxytyrosol: Hydrogen peroxide-dependent hydroxylation and hydroxyquinone/o-quinone coupling pathways. Tetrahedron 2006, 62, 1273–1278. [Google Scholar] [CrossRef]
- Rubió, L.; Macià, A.; Valls, R.M.; Pedret, A.; Romero, M.-P.; Solà, R.; Motilva, M.-J. A new hydroxytyrosol metabolite identified in human plasma: Hydroxytyrosol acetate sulphate. Food Chem. 2012, 134, 1132–1136. [Google Scholar] [CrossRef] [PubMed]
- Vogna, D.; Pezzella, A.; Panzella, L.; Napolitano, A.; D’Ischia, M. Oxidative chemistry of hydroxytyrosol: Isolation and characterisation of novel methanooxocinobenzodioxinone derivatives. Tetrahedron Lett. 2003, 44, 8289–8292. [Google Scholar] [CrossRef]
- Fulcrand, H.; Cheminat, A.; Brouillard, R.; Cheynier, V. Characterization of compounds obtained by chemical oxidation of caffeic acid in acidic conditions. Phytochemistry 1994, 35, 499–505. [Google Scholar] [CrossRef]
- Arakawa, R.; Yamaguchi, M.; Hotta, H.; Osakai, T.; Kimoto, T. Product analysis of caffeic acid oxidation by on-line electrochemistry/ electrospray ionization mass spectrometry. J. Am. Soc. Mass Spectrom. 2004, 15, 1228–1236. [Google Scholar] [CrossRef] [PubMed] [Green Version]
- Hotta, H.; Sakamoto, H.; Nagano, S.; Osakai, T.; Tsujino, Y. Unusually large numbers of electrons for the oxidation of polyphenolic antioxidants. Biochim. Biophys. Acta Gen. Subj. 2001, 1526, 159–167. [Google Scholar] [CrossRef]
- Achat, S.; Rakotomanomana, N.; Madani, K.; Dangles, O. Antioxidant activity of olive phenols and other dietary phenols in model gastric conditions: Scavenging of the free radical DPPH and inhibition of the haem-induced peroxidation of linoleic acid. Food Chem. 2016, 213, 135–142. [Google Scholar] [CrossRef] [PubMed]
- Brooks, S.J.; Doyle, E.M.; O’Connor, K.E. Tyrosol to hydroxytyrosol biotransformation by immobilised cell extracts of Pseudomonas putida F6. Enzyme Microb. Technol. 2006, 39, 191–196. [Google Scholar] [CrossRef]
- Annunziata, F.; Contente, M.L.; Pinna, C.; Tamborini, L.; Pinto, A. Biocatalyzed Flow Oxidation of Tyrosol to Hydroxytyrosol and Efficient Production of Their Acetate Esters. Antioxidants 2021, 10, 1142. [Google Scholar] [CrossRef] [PubMed]
- Xie, P.; Fan, L.; Huang, L.; Zhang, C. Oxidative polymerization process of hydroxytyrosol catalysed by polyphenol oxidases or peroxidase: Characterization, kinetics and thermodynamics. Food Chem. 2021, 337, 127996. [Google Scholar] [CrossRef] [PubMed]
- Roche, M.; Dufour, C.; Mora, N.; Dangles, O. Antioxidant activity of olive phenols: Mechanistic investigation and characterization of oxidation products by mass spectrometry. Org. Biomol. Chem. 2005, 3, 423–430. [Google Scholar] [CrossRef]
- Myers, O.D.; Sumner, S.J.; Li, S.; Barnes, S.; Du, X. One Step Forward for Reducing False Positive and False Negative Compound Identifications from Mass Spectrometry Metabolomics Data: New Algorithms for Constructing Extracted Ion Chromatograms and Detecting Chromatographic Peaks. Anal. Chem. 2017, 89, 8696–8703. [Google Scholar] [CrossRef]


| Νο | RT (min) | EC | Exp. [M−H]− | Theor. [M−H]− m/z | Δm (ppm) | RDB eq. | Fragments MS/MS | Compartments | Metabolites | |||||||
|---|---|---|---|---|---|---|---|---|---|---|---|---|---|---|---|---|
| m/z | S0H | S1H | SID | SIR | C2H | C4H | C6H | C24H | ||||||||
| HTyr1 | 3.27 | C8H9O3 | 153.05617 | 153.05462 | −0.20 | 4.5 | 123 | + | + | t | t | + | + | + | + | HTyr |
| HTyr2 | 4.39 | C8H7O2 | 135.04541 | 135.0452 | 1.90 | 5.5 | nd | – | + | – | – | – | – | – | + | Quinone or epoxy or dihydro derivative of Tyr |
| HTyr3 | 4.64 | C9H9O4 | 181.05087 | 181.0506 | 1.32 | 5.5 | nd | – | – | – | – | – | + | + | + | Dihydrocaffeic acid |
| HTyr4 | 4.70 | C7H5O3 | 137.02500 | 137.02514 | 1.40 | 5.5 | nd | – | + | + | – | t | t | – | – | Hydroxybenzoic acid |
| HTyr5 | 4.72 | C8H7O3 | 151.0408 | 151.0401 | 4.6 | 5.5 | 123,103 | + | + | t | – | + | + | + | + | DOPAL (3,4 dihydroxyphenyl acetaldehyde) |
| HTyr6 | 5.51 | C9H7O3 | 163.0405 | 163.0401 | 2.50 | 6.5 | nd | – | – | – | – | – | – | – | + | Coumaric acid |
| HTyr7 | 6.19 | C8H7O4 | 167.0428 | 167.0428 | 0.23 | 5.5 | nd | – | – | – | – | + | + | + | + | DOPAC (dihydroxyphenylacetic acid) |
| HTyr8 | 6.24 | C9H11O4 | 183.0665 | 183.0663 | 1.01 | 4.5 | nd | – | – | – | – | + | + | + | + | 4–(1,3–dihydroxypropyl) benzene–1,2–diol |
| HTyr9 | 6.38 | C8H7O2 | 135.0454 | 135.0452 | 2.1 | 5.5 | nd | – | + | + | + | + | + | + | + | PPA (phenylacetic acid) |
| HTyr10 | 6.26 | C9H7O4 | 179.0351 | 179.0350 | 0.54 | 6.5 | nd | – | – | + | + | + | + | + | + | Caffeic acid |
| HTyr11 | 6.48 | C16H17O9 | 353.0872 | 353.0878 | −1.65 | 8.5 | 235,265,247 | – | – | + | – | – | – | – | – | Hydroxylated dimer of HTyr (homodimer) |
| HTyr12 | 6.98 | C7H5O2 | 121.0299 | 121.0295 | 2.96 | 5.5 | nd | – | t | t | t | t | t | t | t | Benzoic acid |
| HTyr13 | 8.03 | C16H17O4 | 273.0766 | 273.0768 | −0.79 | 9.5 | nd | – | – | – | – | + | + | + | + | Dimer of HTyr (heterodimer) |
| HTyr14 | 8.11 | C16H15O8 | 335.0766 | 335.0772 | −1.90 | 9.5 | nd | – | – | + | + | + | – | – | – | Hydroxylated dimer of HTyr (homodimer) |
| HTyr15 | 8.35 | C16H17O6 | 305.1028 | 305.1031 | −0.91 | 8.5 | 275,179,161 | – | + | – | – | – | – | – | – | Dimer of HTyr (homodimer) |
| HTyr16 | 8.75 | C9H9O3 | 165.05594 | 165.05462 | 1.30 | 5.5 | 147 | – | – | – | – | – | + | + | + | Hydroxyphenyl propionic acid |
| HTyr17 | 8.78 | C9H7O2 | 147.0454 | 147.0454 | 1.64 | 6.5 | 119 | – | – | – | – | – | + | + | + | Dehydrated hydroxyphenyl propionic acid |
| HTyr18 | 8.78 | C8H7O | 119.0505 | 119.0502 | 2.38 | 5.5 | nd | – | – | – | – | – | – | + | + | Phenylacetaldehyde |
| HTyr19 | 9.20 | C10H11O2 | 163.0767 | 163.0767 | 1.3 | 5.5 | nd | – | t | – | – | – | – | – | – | Phenylethyl acetate or 4–(4–hydroxyphenyl)–2–oxobutane |
| HTyr20 | 9.20/ 10.29 | C23H23O10 | 459.1291 | 459.1297 | −1.33 | 12.5 | nd | – | – | + | + | – | – | – | – | Trimer of HTyr (homodimer) |
| HTyr21 | 9.22–11.74 | C11H13O3 | 193.0871 | 193.0870 | 0.49 | 5.5 | 163 | – | + | – | – | – | – | – | – | 4–methoxyphenethyl acetate or 4–(3–hydroxy–4–methoxy–phenyl)–butan–2–one |
| HTyr22 | 9.24/ 9.53/ 10.35/10.75 | C23H23O9 | 443.1341 | 443.1348 | −1.49 | 12.5 | 247,399 | – | – | + | + | – | – | – | – | Hydroxylated trimer of HTyr (heterodimer) |
| HTyr23 | 3.52/9.87 | C10H11O4 | 195.06632 | 195.0663 | 0.17 | 5.5 | nd | – | + | – | – | + | + | + | + | Hydroxytyrosol acetate |
| HTyr24 | 9.97 | C10H11O5 | 211.0611 | 211.0612 | −0.40 | 5.5 | nd | – | – | – | – | + | + | – | – | HydroxylatedHydroxytyrosol acetate |
| HTyr25 | 8.12/ 11.29 | C16H15O6 | 303.0870 | 303.0874 | −1.43 | 9.5 | 167,123 | – | + | – | + | + | + | + | + | Hydroxylated dimer of HTyr |
| HTyr26 | 11.75 | C16H17O5 | 289.10779 | 289.10779 | 0.73 | 8.5 | 135,153 | + | + | t | – | + | + | + | + | Dimer of HTyr (heterodimer) |
| HTyr27 | 12.71 | C23H21O9 | 441.1185 | 441.1191 | −1.30 | 13.5 | nd | – | – | + | – | – | – | – | – | Trimer of HTyr–2H (homodimer) |
| Νο | RT (min) | EC | Exp. [M−H]− | Theor. [M−H]− | Δm (ppm) | RDBeq. | Fragments MS/MS | Compartments | Metabolites | |||||||
|---|---|---|---|---|---|---|---|---|---|---|---|---|---|---|---|---|
| m/z | S0H | S1H | SID | SIR | C2H | C4H | C6H | C24H | ||||||||
| Tyr1 | 3.80 | C8H7O2 | 135.0455 | 135.04552 | 2.58 | 5.5 | nd | − | − | − | − | − | − | − | + | PPA (phenylacetic acid) |
| Tyr2 | 3.86 | C9H9O4 | 181.0509 | 181.0506 | 1.39 | 5.5 | nd | − | − | − | − | − | − | *t | + | Dihydroxyphenylpropionic acid |
| Tyr3 | 3.91 | C9H7O3 | 163.0404 | 163.0401 | 2.16 | 6.5 | nd | − | − | − | − | − | − | − | + | Coumaric acid |
| Tyr4 | 4.40 | C8H5O3 | 149.0248 | 149.0244 | 2.84 | 6.5 | nd | + | + | + | − | + | + | + | − | Phenylpropionic acid |
| Tyr5 | 4.45 | C7H5O2 | 121.0299 | 121.0295 | 2.96 | 5.5 | nd | + | + | + | + | − | + | + | + | Benzoic acid |
| Tyr6 | 4.50 | C24H25O6 | 409.1657 | 409.1657 | 0.04 | 12.5 | 273 | − | − | + | − | − | − | − | − | Tyrosol Trimer |
| Tyr7 | 4.53 | C16H17O4 | 273.1133 | 273.1132 | 0.29 | 8.5 | 243,213,137 | + | + | + | + | –- | + | + | + | Tyrosol (ESI source Dimer) |
| Tyr8 | 5.21 | C16H17O5 | 289.1082 | 289.1081 | 0.13 | 8.5 | 271,121 | − | − | + | + | + | + | + | + | Hydroxylated Tyrosol Dimer |
| Tyr9 | 3.84 | C8H7O | 119.0505 | 119.0502 | 2.38 | 5.5 | nd | − | − | − | − | − | − | + | + | Phenylacetaldehyde |
| Tyr10 | 6.89 | C9H9O3 | 165.05594 | 165.05462 | 1.30 | 5.5 | 147 | − | − | − | − | − | + | + | + | Hydroxyphenylpropionic acid |
| Tyr11 | 6.90 | C9H7O2 | 147.0456 | 147.0452 | 2.9 | 6.5 | 103,119 | − | − | − | − | − | + | + | + | Cinnamic acid |
| Tyr12 | 8.45 | C7H5O3 | 137.02493 | 137.02493 | 3.5 | 5.5 | nd | + | + | − | − | + | − | − | − | 4−hydroxybezoic acid |
| Tyr13 | 12.27 | C10H11O3 | 179.0717 | 179.0714 | 1.86 | 5.5 | nd | t | + | t | − | t | − | − | − | Tyrosol acetate |
Publisher’s Note: MDPI stays neutral with regard to jurisdictional claims in published maps and institutional affiliations. |
© 2022 by the authors. Licensee MDPI, Basel, Switzerland. This article is an open access article distributed under the terms and conditions of the Creative Commons Attribution (CC BY) license (https://creativecommons.org/licenses/by/4.0/).
Share and Cite
Sakavitsi, M.E.; Breynaert, A.; Nikou, T.; Lauwers, S.; Pieters, L.; Hermans, N.; Halabalaki, M. Availability and Metabolic Fate of Olive Phenolic Alcohols Hydroxytyrosol and Tyrosol in the Human GI Tract Simulated by the In Vitro GIDM–Colon Model. Metabolites 2022, 12, 391. https://doi.org/10.3390/metabo12050391
Sakavitsi ME, Breynaert A, Nikou T, Lauwers S, Pieters L, Hermans N, Halabalaki M. Availability and Metabolic Fate of Olive Phenolic Alcohols Hydroxytyrosol and Tyrosol in the Human GI Tract Simulated by the In Vitro GIDM–Colon Model. Metabolites. 2022; 12(5):391. https://doi.org/10.3390/metabo12050391
Chicago/Turabian StyleSakavitsi, Maria Eleni, Annelies Breynaert, Theodora Nikou, Stef Lauwers, Luc Pieters, Nina Hermans, and Maria Halabalaki. 2022. "Availability and Metabolic Fate of Olive Phenolic Alcohols Hydroxytyrosol and Tyrosol in the Human GI Tract Simulated by the In Vitro GIDM–Colon Model" Metabolites 12, no. 5: 391. https://doi.org/10.3390/metabo12050391
APA StyleSakavitsi, M. E., Breynaert, A., Nikou, T., Lauwers, S., Pieters, L., Hermans, N., & Halabalaki, M. (2022). Availability and Metabolic Fate of Olive Phenolic Alcohols Hydroxytyrosol and Tyrosol in the Human GI Tract Simulated by the In Vitro GIDM–Colon Model. Metabolites, 12(5), 391. https://doi.org/10.3390/metabo12050391