
A Novel Strategy for Unveiling Spatial Distribution Pattern of Gallotannins in Paeonia rockii and Paeonia ostii Based on LC–QTRAP–MS

 ,
,
Abstract
:1. Introduction
2. Results and Discussion
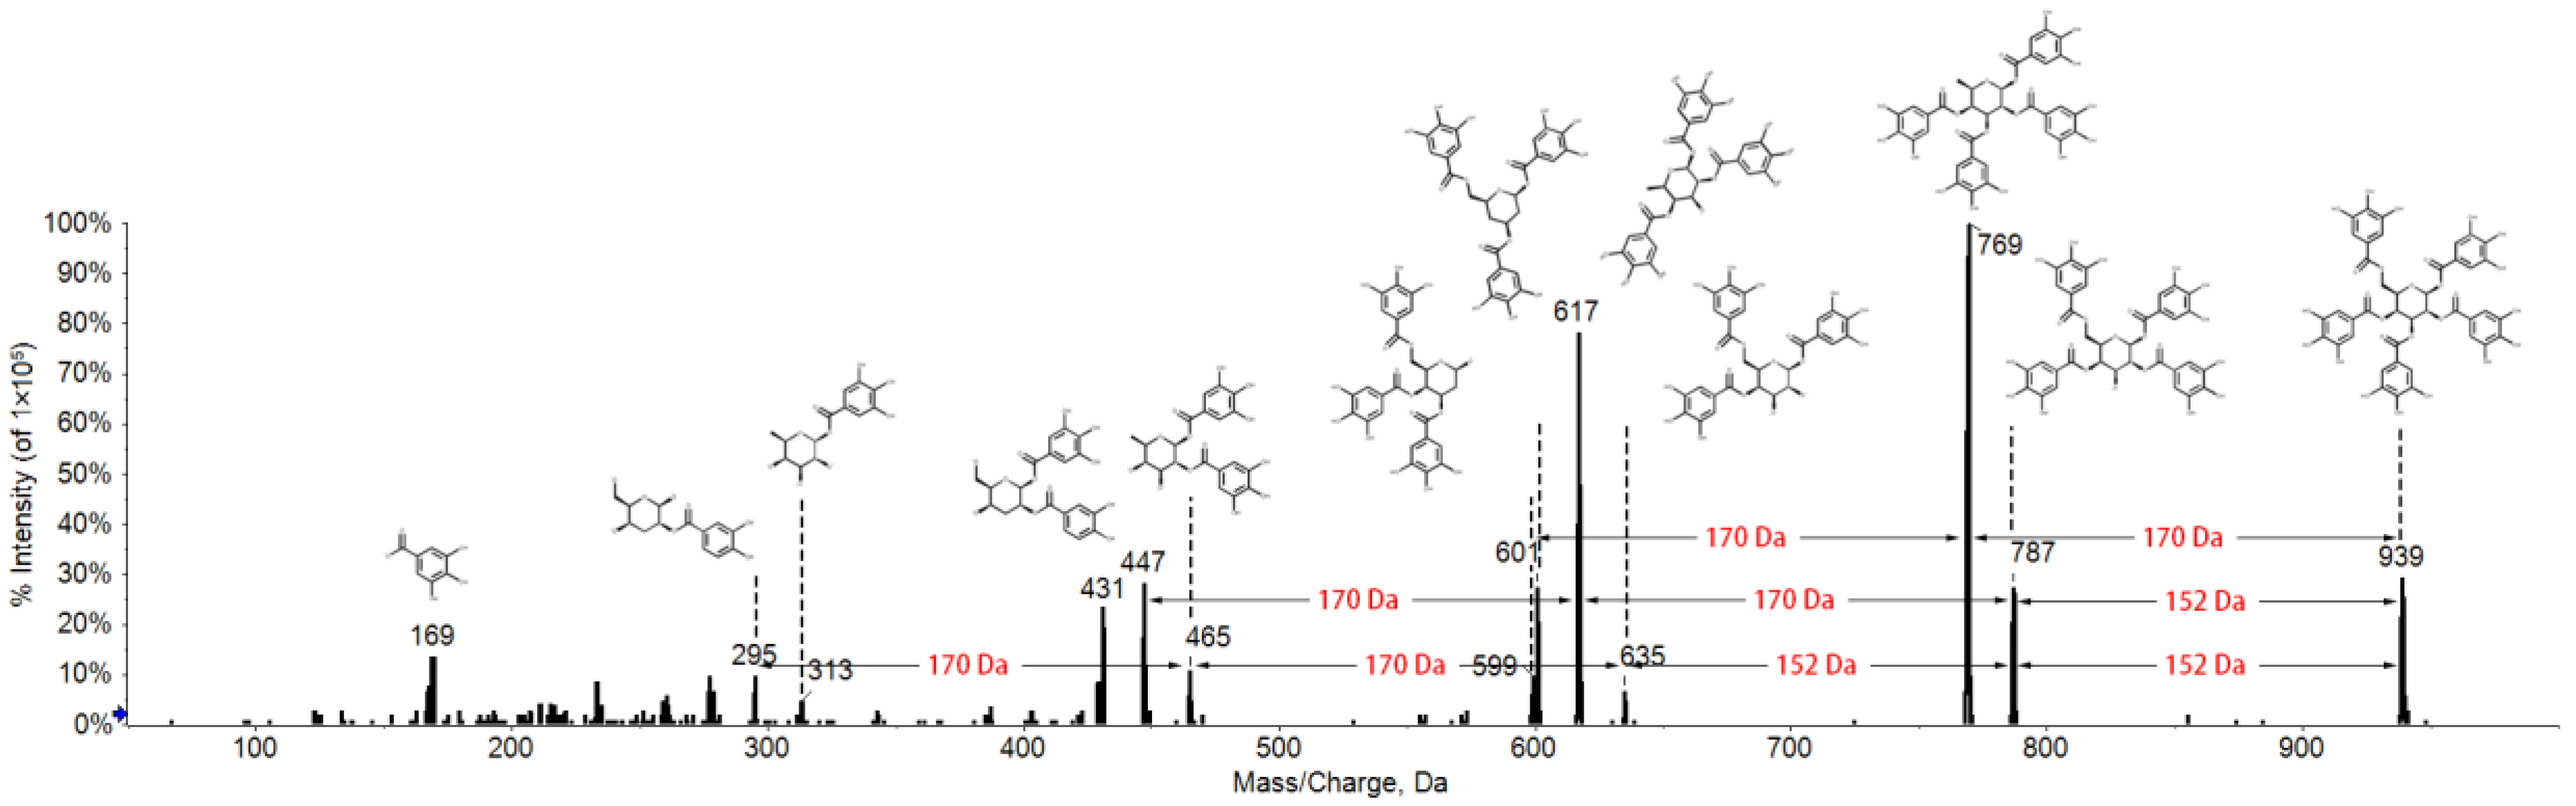
2.1. Fragmentation Behaviors of Gallotannins
2.2. Optimization of Chromatographic Conditions for LC–QTRAP–MS Analysis
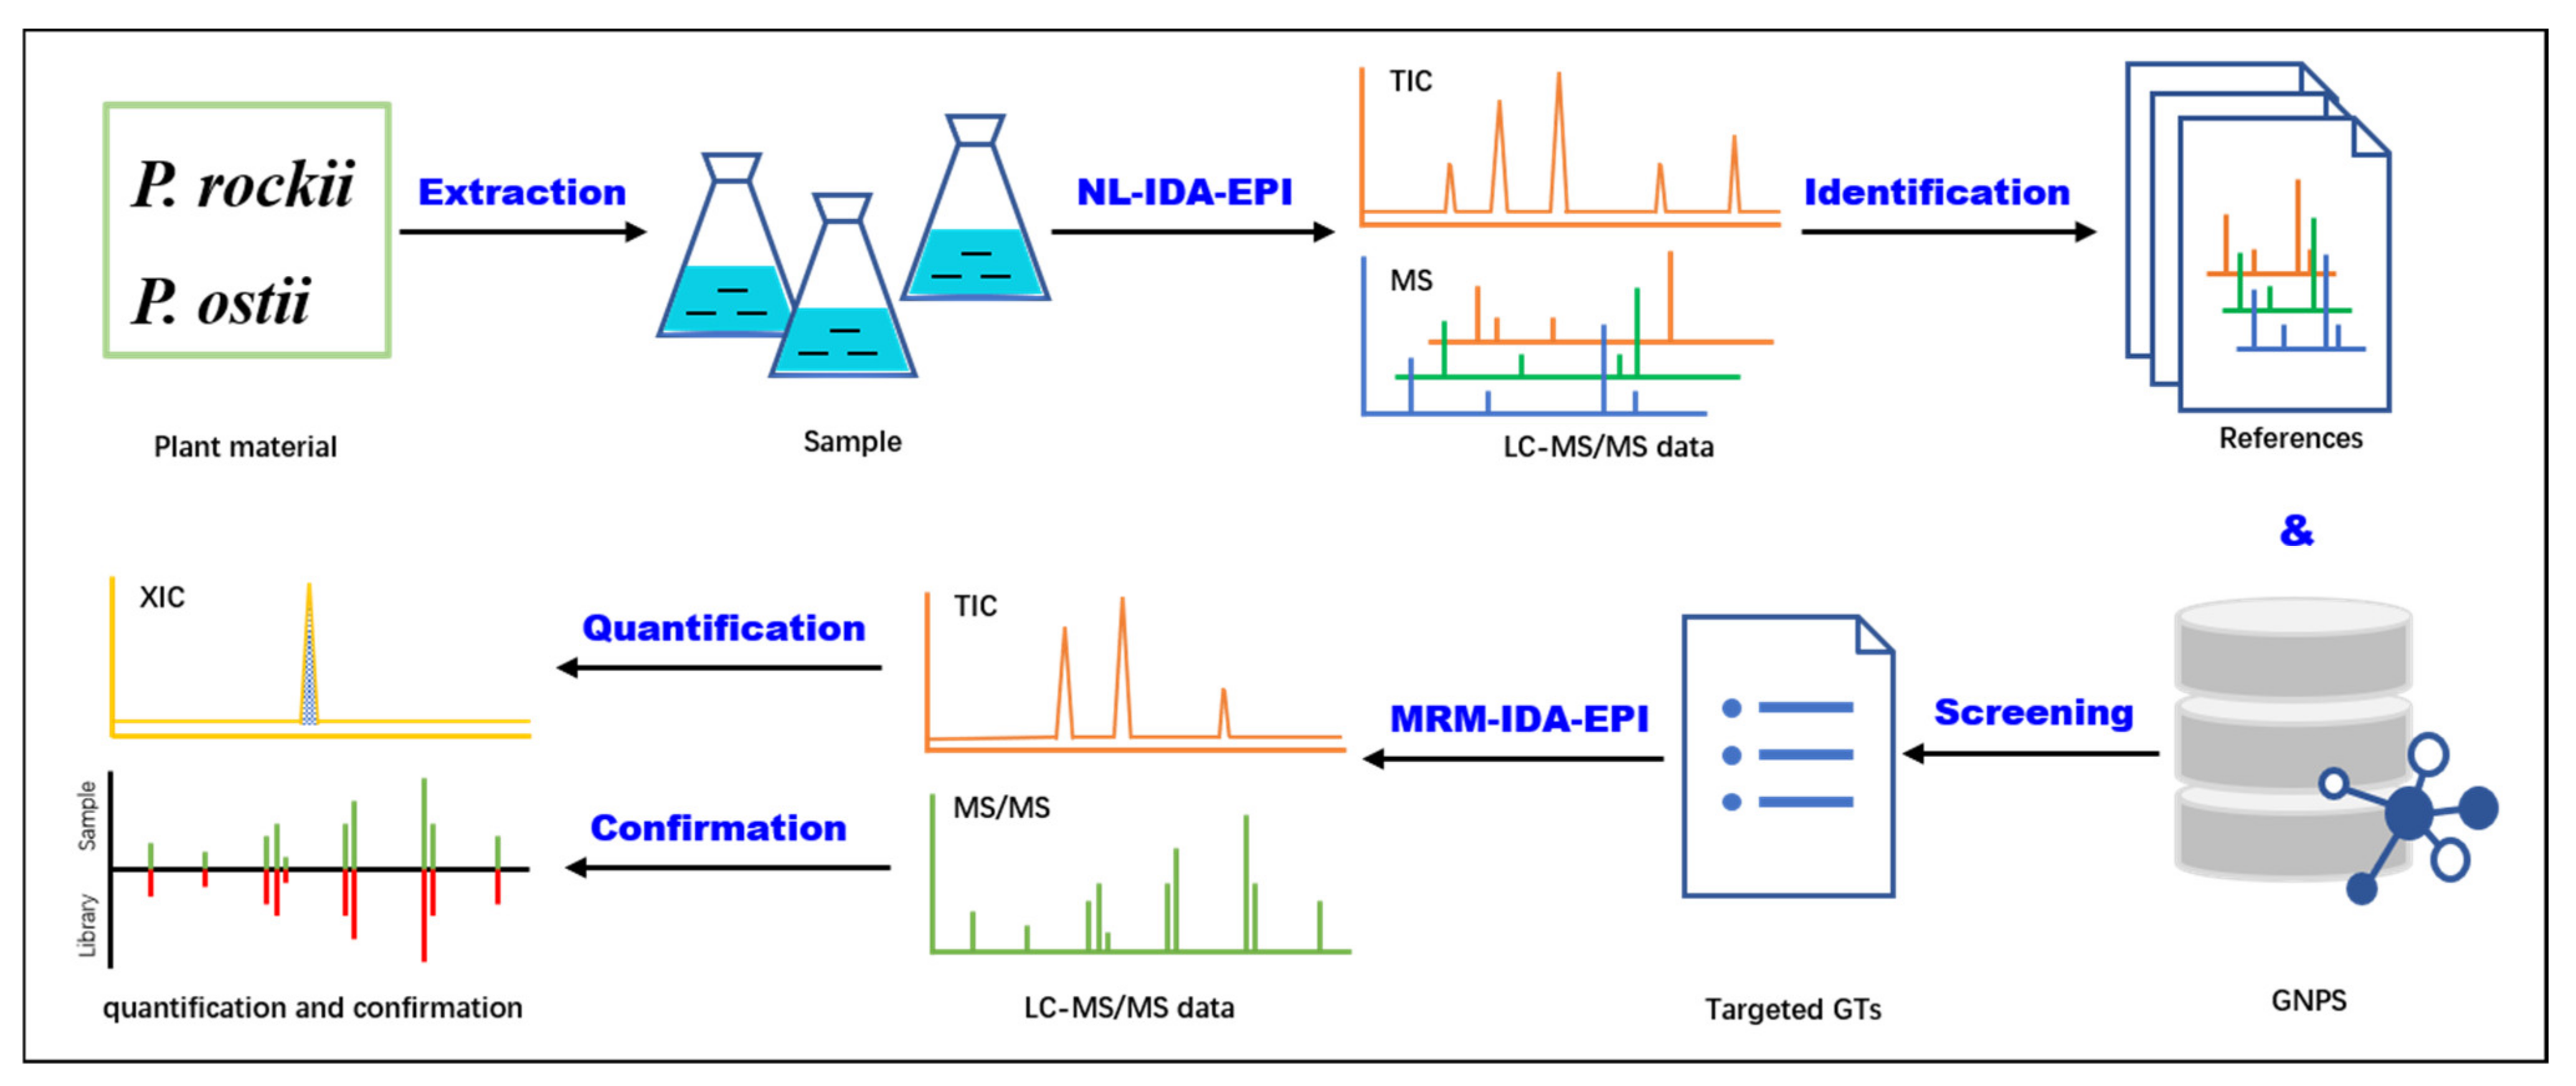
2.3. NL–IDA–EPI for GT Metabolite Identification and Library Construction
2.4. MRM–IDA–EPI for the Simultaneous Identification and Quantification of GTs in P. rockii and P. ostii
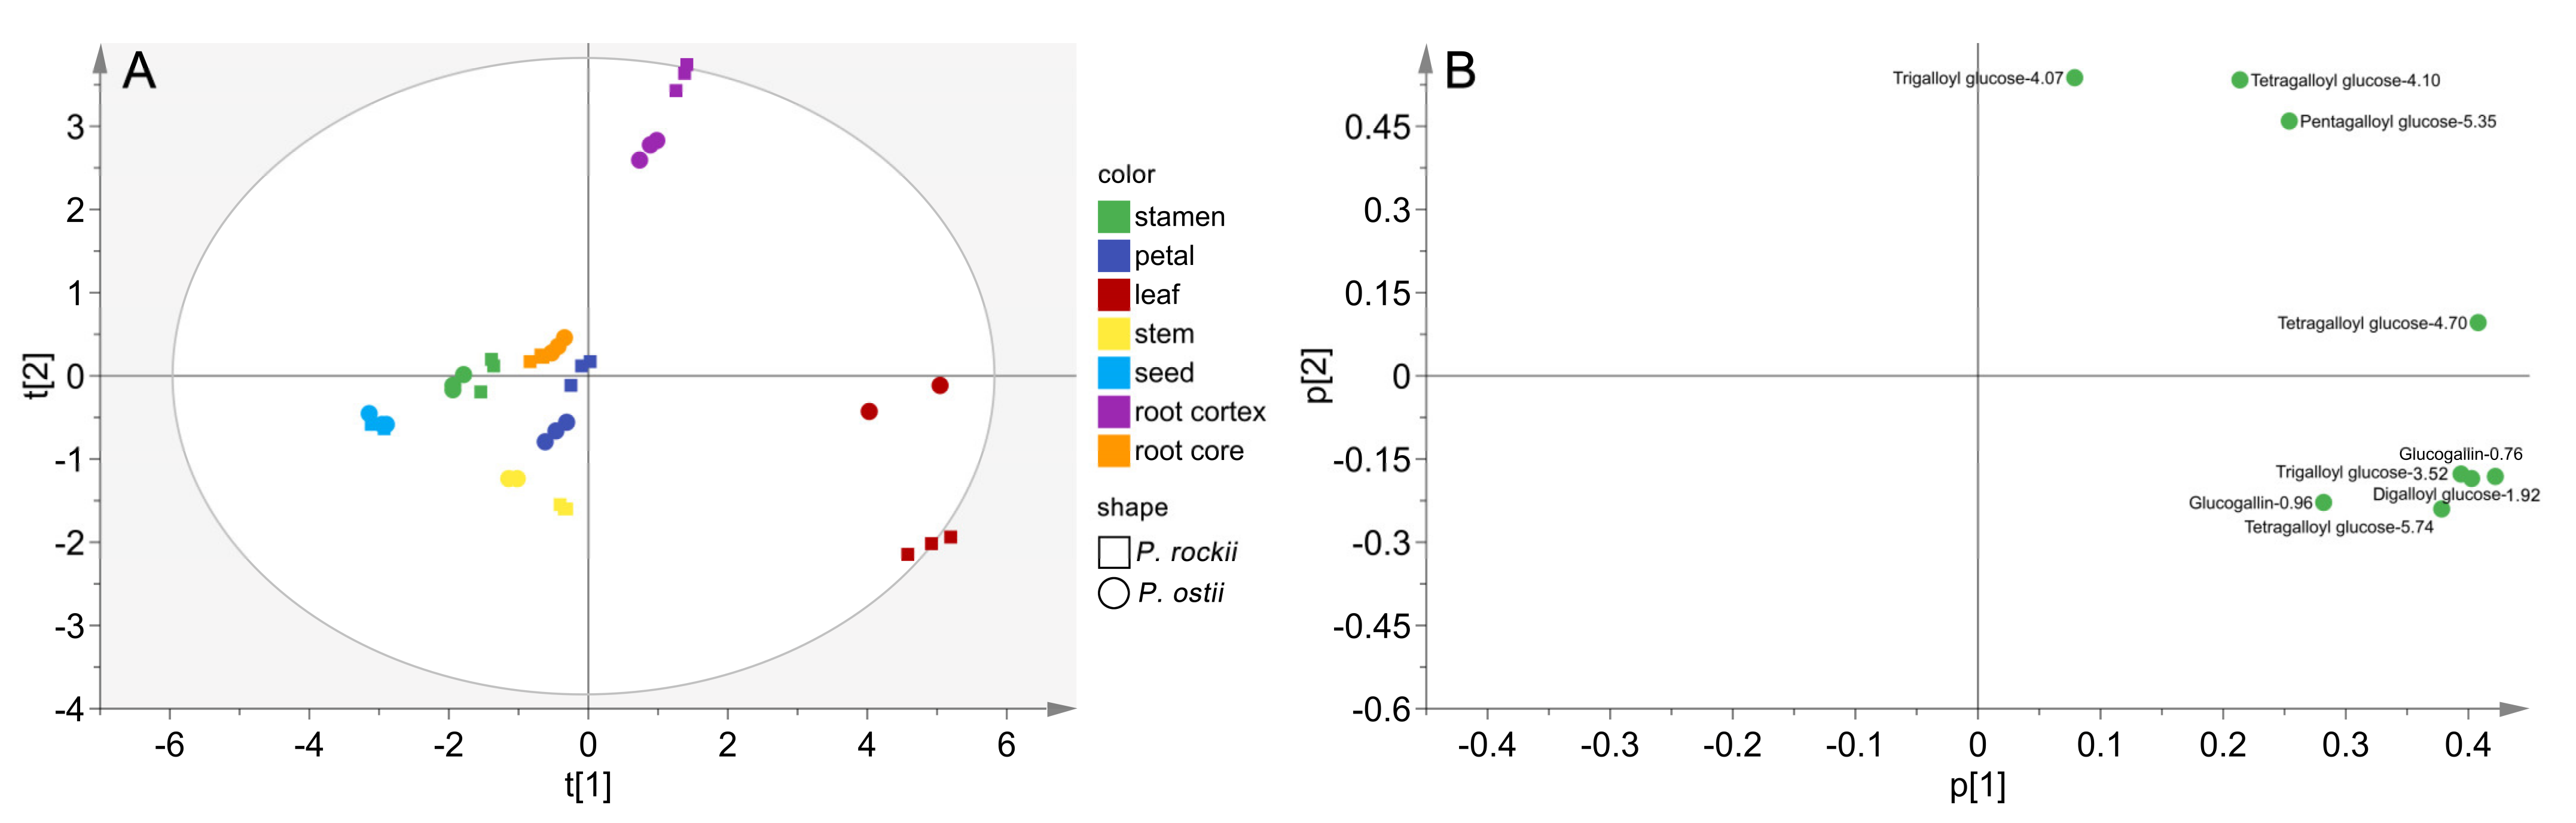
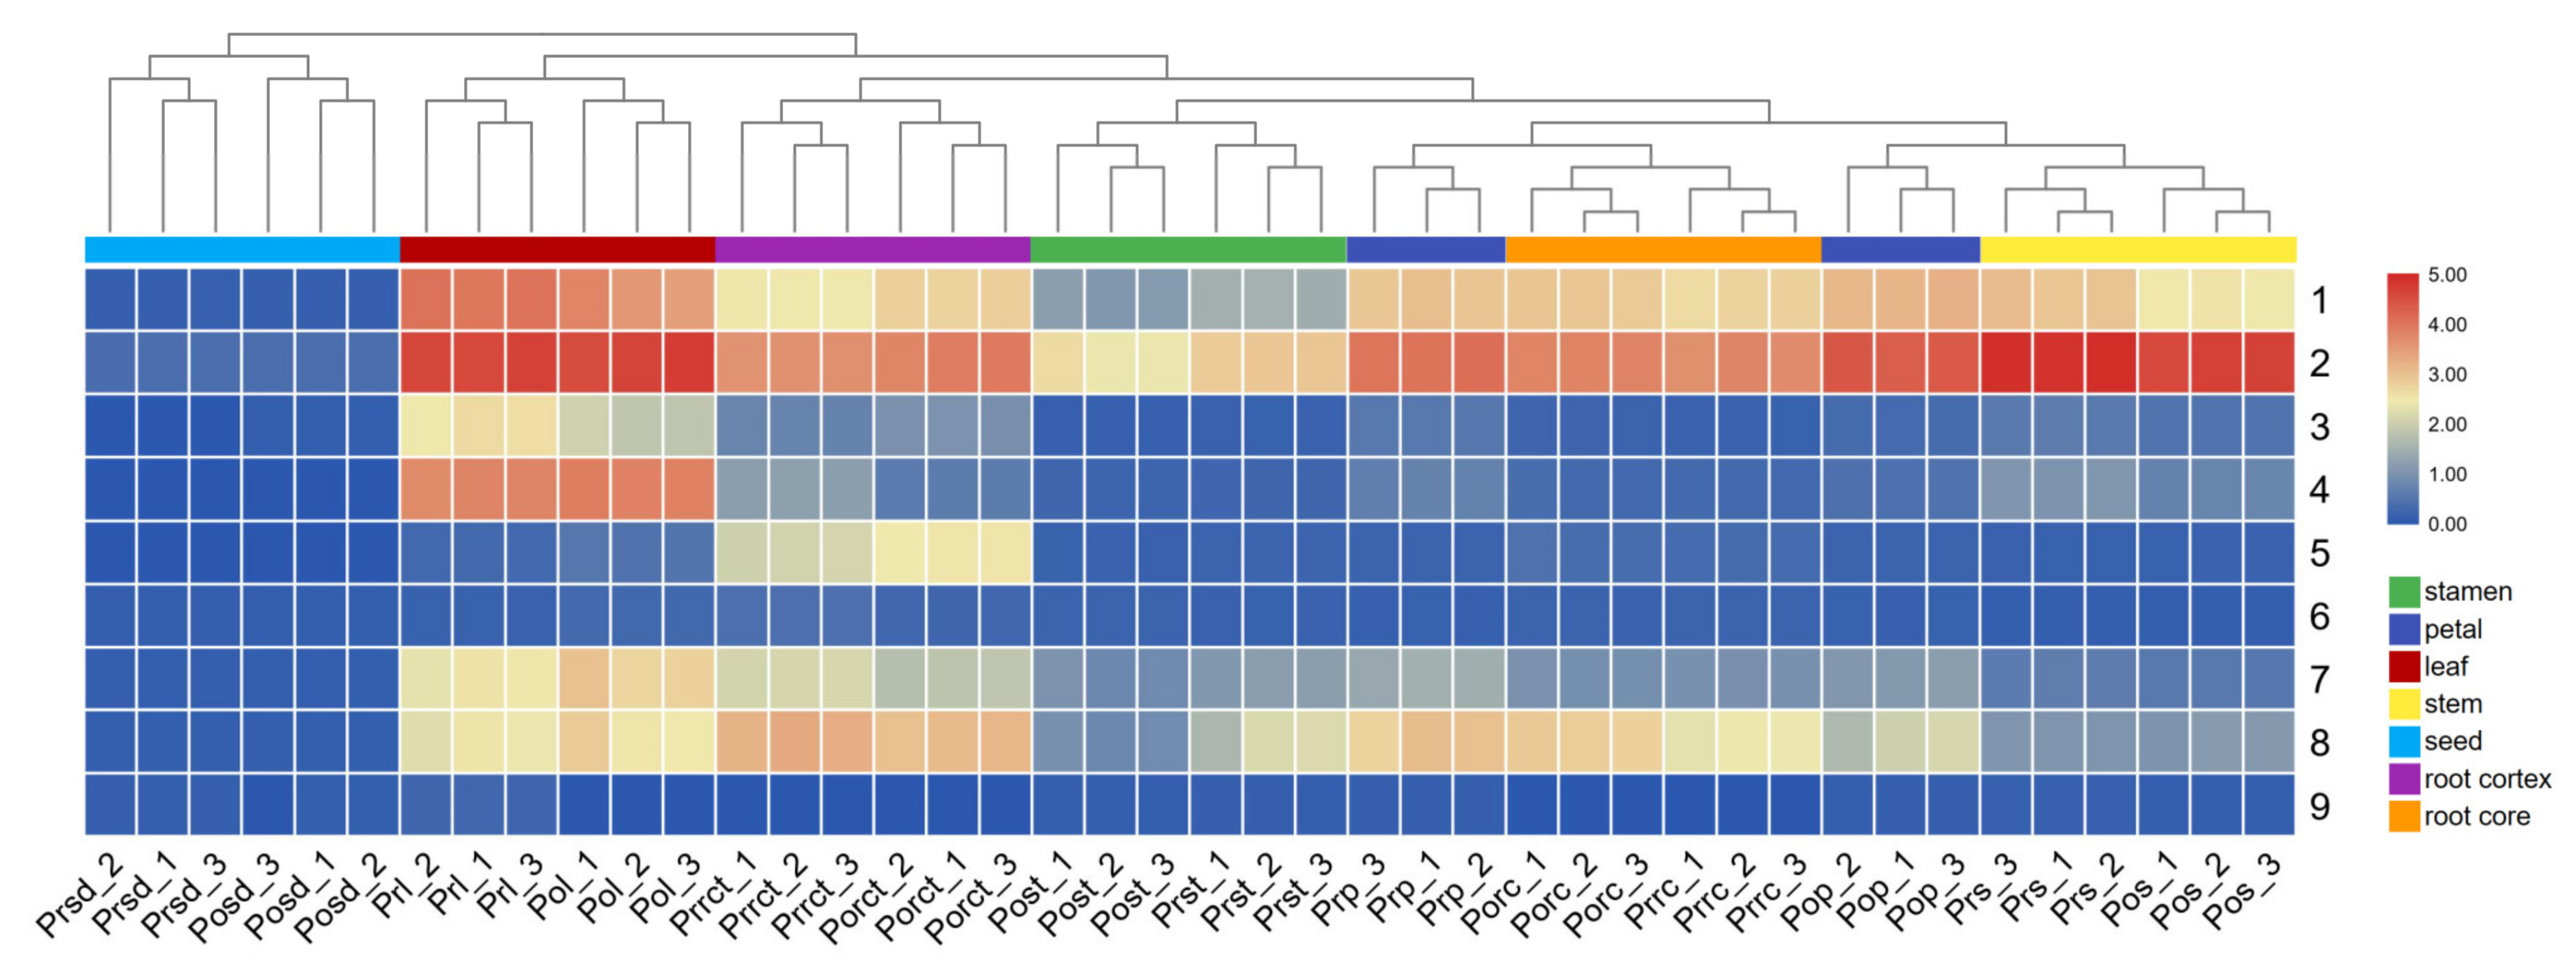
2.5. Spatial Distribution Pattern of Gallotannins in P. rockii and P. ostii
3. Materials and Methods
3.1. Plant Materials
3.2. Chemicals and Reagents
3.3. Sample Preparation
3.4. Liquid Chromatography Separation
3.5. General Parameters of QTRAP–MS
3.6. Non-Targeted NL–IDA–EPI Analysis
3.7. Targeted MRM–IDA–EPI Analysis
3.8. ESI–QTOF–MS Analysis
3.9. Data Processing and Statistical Analysis
4. Conclusions
Supplementary Materials
Author Contributions
Funding
Institutional Review Board Statement
Informed Consent Statement
Data Availability Statement
Acknowledgments
Conflicts of Interest
References
- Tian, F.; Li, B.; Ji, B.; Yang, J.; Zhang, G.; Chen, Y.; Luo, Y. Antioxidant and antimicrobial activities of consecutive extracts from Galla chinensis: The polarity affects the bioactivities. Food Chem. 2009, 113, 173–179. [Google Scholar] [CrossRef]
- Kiss, A.K.; Naruszewicz, M. Polyphenolic compounds characterization and reactive nitrogen species scavenging capacity of Oenothera paradoxa defatted seed extracts. Food Chem. 2012, 131, 485–492. [Google Scholar] [CrossRef]
- Duckstein, S.M.; Stintzing, F.C. Investigation on the phenolic constituents in Hamamelis virginiana leaves by HPLC-DAD and LC-MS/MS. Anal. Bioanal. Chem. 2011, 401, 677–688. [Google Scholar] [CrossRef] [PubMed]
- Panusa, A.; Petrucci, R.; Marrosu, G.; Multari, G.; Gallo, F.R. UHPLC-PDA-ESI-TOF/MS metabolic profiling of Arctostaphylos pungens and Arctostaphylos uva-ursi. A comparative study of phenolic compounds from leaf methanolic extracts. Phytochemistry 2015, 115, 79–88. [Google Scholar] [CrossRef]
- Kiss, A.K.; Piwowarski, J.P. Ellagitannins, gallotannins and their metabolites- the contribution to the anti-inflammatory effect of food products and medicinal plants. Curr. Med. Chem. 2018, 25, 4946–4967. [Google Scholar] [CrossRef]
- Chambi, F.; Chirinos, R.; Pedreschi, R.; Betalleluz-Pallardel, I.; Debaste, F.; Campos, D. Antioxidant potential of hydrolyzed polyphenolic extracts from tara (Caesalpinia spinosa) pods. Ind. Crop. Prod. 2013, 47, 168–175. [Google Scholar] [CrossRef]
- Aguilar-Galvez, A.; Noratto, G.; Chambi, F.; Debaste, F.; Campos, D. Potential of tara (Caesalpinia spinosa) gallotannins and hydrolysates as natural antibacterial compounds. Food Chem. 2014, 156, 301–304. [Google Scholar] [CrossRef]
- Erdèlyi, K.; Kiss, A.; Bakondi, E.; Bai, P.; Szabó, C.; Gergely, P.; Erdödi, F.; Virág, L. Gallotannin inhibits the expression of chemokines and inflammatory cytokines in A549 cells. Mol. Pharmacol. 2005, 68, 895–904. [Google Scholar] [CrossRef]
- Li, L.; Ma, H.; Liu, T.; Ding, Z.; Liu, W.; Gu, Q.; Mu, Y.; Xu, J.; Seeram, N.P.; Huang, X.; et al. Glucitol-core containing gallotannins-enriched red maple (Acer rubrum) leaves extract alleviated obesity via modulating short-chain fatty acid production in high-fat diet-fed mice. J. Funct. Foods 2020, 70, 103970. [Google Scholar] [CrossRef]
- Li, Y.; Kim, J.; Li, J.; Liu, F.; Liu, X.; Himmeldirk, K.; Ren, Y.; Wagner, T.E.; Chen, X. Natural anti-diabetic compound 1,2,3,4,6-penta-O-galloyl-d-glucopyranose binds to insulin receptor and activates insulin-mediated glucose transport signaling pathway. Biochem. Biophys. Res. Commun. 2005, 336, 430–437. [Google Scholar] [CrossRef]
- Lee, H.; Lee, J.Y.; Suh, M.H.; Sim, S.-S.; Lee, M.-W.; Kim, C.J. Hydrolysable tannins depress cardiac papillary muscle contraction and propranolol-induced negative inotropism. Fitoterapia 2010, 81, 820–825. [Google Scholar] [CrossRef] [PubMed]
- Zhang, L.; Liu, P.; Gao, J.; Wang, X.; An, J.; Xu, S.; Deng, R. Profiling and simultaneous quantitative determination of oligostilbenes in Paeonia ostii seed shell from different geographical areas in China and their comparative evaluation. Phytochem. Anal. 2019, 30, 464–473. [Google Scholar] [CrossRef] [PubMed]
- Xiang, J.L.; Yang, C.B.; Beta, T.; Liu, S.X.; Yang, R.Q. Phenolic profile and antioxidant activity of the edible tree peony flower and underlying mechanisms of preventive effect on H2O2-induced oxidative damage in Caco-2 cells. Foods 2019, 8, 471. [Google Scholar] [CrossRef] [PubMed] [Green Version]
- Zhang, Y.; Liu, P.; Gao, J.-Y.; Wang, X.-S.; Yan, M.; Xue, N.-C.; Qu, C.-X.; Deng, R.-X. Paeonia veitchii seeds as a promising high potential by-product: Proximate composition, phytochemical components, bioactivity evaluation and potential applications. Ind. Crop. Prod. 2018, 125, 248–260. [Google Scholar] [CrossRef]
- Li, S.-S.; Wu, Q.; Yin, D.-D.; Feng, C.; Liu, Z.-A.; Wang, L.-S. Phytochemical variation among the traditional Chinese medicine Mu Dan Pi from Paeonia suffruticosa (tree peony). Phytochemistry 2018, 146, 16–24. [Google Scholar] [CrossRef]
- Chinese Pharmacopoeia Commission. The Pharmacopoeia of the People’s Republic of China; Chemical Industry Publishing House: Beijing, China, 2015; pp. 160–161. [Google Scholar]
- Seger, C.; Sturm, S.; Stuppner, H. Mass spectrometry and NMR spectroscopy: Modern high-end detectors for high resolution separation techniques—State of the art in natural product HPLC-MS, HPLC-NMR, and CE-MS hyphenations. Nat. Prod. Rep. 2013, 30, 970–987. [Google Scholar] [CrossRef]
- Jiang, Y.; David, B.; Tu, P.; Barbin, Y. Recent analytical approaches in quality control of traditional Chinese medicines—A review. Anal. Chim. Acta 2010, 657, 9–18. [Google Scholar] [CrossRef]
- Dunn, W.B.; Broadhurst, D.; Atherton, H.J.; Goodacre, R.; Griffin, J.L. Systems level studies of mammalian metabolomes: The roles of mass spectrometry and nuclear magnetic resonance spectroscopy. Chem. Soc. Rev. 2011, 40, 387–426. [Google Scholar] [CrossRef]
- Hendriks, M.M.; Eeuwijk, F.A.; Jellema, R.H.; Westerhuis, J.A.; Reijmers, T.H.; Hoefsloot, H.C.; Smilde, A.K. Data-processing strategies for metabolomics studies. TrAC Trends Anal. Chem. 2011, 30, 1685–1698. [Google Scholar] [CrossRef]
- Yuan, M.; Breitkopf, S.B.; Yang, X.; Asara, J.M. A positive/negative ion–switching, targeted mass spectrometry—Based metabolomics platform for bodily fluids, cells, and fresh and fixed tissue. Nat. Protoc. 2012, 7, 872–881. [Google Scholar] [CrossRef] [Green Version]
- Chen, S.; Kong, H.; Lu, X.; Li, Y.; Yin, P.; Zeng, Z.; Xu, G. Pseudotargeted metabolomics method and its application in serum biomarker discovery for hepatocellular carcinoma based on ultra high-performance liquid chromatography/triple quadrupole mass spectrometry. Anal. Chem. 2013, 85, 8326–8333. [Google Scholar] [CrossRef] [PubMed]
- Yang, J.; Wang, F.; Chen, X.; Qiu, S.; Cui, L.; Hu, L. β-Pentagalloyl-glucose sabotages pancreatic cancer cells and ameliorates cachexia in tumor-bearing mice. Am. J. Chin. Med. 2019, 47, 675–689. [Google Scholar] [CrossRef] [PubMed]
- Zhang, J.; Li, L.; Kim, S.-H.; Hagerman, A.E.; Lü, J. Anti-cancer, anti-diabetic and other pharmacologic and biological activities of penta-galloyl-glucose. Pharm. Res. 2009, 26, 2066–2080. [Google Scholar] [CrossRef] [PubMed] [Green Version]
- Peng, J.; Li, K.; Zhu, W.; Nie, R.; Wang, R.; Li, C. Penta-O-galloyl-β-d-glucose, a hydrolysable tannin from Radix Paeoniae Alba, inhibits adipogenesis and TNF-α-mediated inflammation in 3T3-L1 cells. Chem. Interact. 2019, 302, 156–163. [Google Scholar] [CrossRef]
- Tian, F.; Li, B.; Ji, B.; Zhang, G.; Luo, Y. Identification and structure—Activity relationship of gallotannins separated from Galla chinensis. LWT—Food Sci. Technol. 2009, 42, 1289–1295. [Google Scholar] [CrossRef]
- Dienaitė, L.; Pukalskienė, M.; Pukalskas, A.; Pereira, C.V.; Matias, A.A.; Venskutonis, P.R. Isolation of strong antioxidants from Paeonia Officinalis roots and leaves and evaluation of their bioactivities. Antioxidants 2019, 8, 249. [Google Scholar] [CrossRef] [Green Version]
- He, J.Y.; Dong, Y.Q.; Liu, X.Y.; Wan, Y.L.; Gu, T.W.; Zhou, X.F.; Liu, M.H. Comparison of chemical compositions, antioxidant, and anti-photoaging activities of Paeonia suffruticosa flowers at different flowering stages. Antioxidants 2019, 8, 345. [Google Scholar] [CrossRef] [Green Version]
- Huang, Y.-Q.; Wang, Q.-Y.; Liu, J.-Q.; Hao, Y.-H.; Yuan, B.-F.; Feng, Y.-Q. Isotope labelling—Paired homologous double neutral loss scan-mass spectrometry for profiling of metabolites with a carboxyl group. Analyst 2014, 139, 3446–3454. [Google Scholar] [CrossRef]
- Steen, R.J.C.A.; Bobeldijk, I.; Brinkman, U.A.T. Screening for transformation products of pesticides using tandem mass spectrometric scan modes. J. Chromatogr. A 2001, 915, 129–137. [Google Scholar] [CrossRef]
- Hager, J.W.; Yves, L.B.J. Product ion scanning using a Q-q-Qlinear ion trap (Q TRAPTM) mass spectrometer. Rapid Commun. Mass Spectrom. 2003, 17, 1056–1064. [Google Scholar] [CrossRef]
- Wang, M.; Carver, J.J.; Phelan, V.V.; Sanchez, L.M.; Garg, N.; Peng, Y.; Nguyen, D.D.; Watrous, J.; Kapono, C.A.; Luzzatto-Knaan, T.; et al. Sharing and community curation of mass spectrometry data with Global Natural Products Social Molecular Networking. Nat. Biotechnol. 2016, 34, 828–837. [Google Scholar] [CrossRef] [Green Version]
- Horai, H.; Arita, M.; Kanaya, S.; Nihei, Y.; Ikeda, T.; Suwa, K.; Ojima, Y.; Tanaka, K.; Tanaka, S.; Aoshima, K.; et al. MassBank: A public repository for sharing mass spectral data for life sciences. Biol. Mass Spectrom. 2010, 45, 703–714. [Google Scholar] [CrossRef] [PubMed]
- Sawada, Y.; Nakabayashi, R.; Yamada, Y.; Suzuki, M.; Sato, M.; Sakata, A.; Akiyama, K.; Sakurai, T.; Matsuda, F.; Aoki, T.; et al. RIKEN tandem mass spectral database (ReSpect) for phytochemicals: A plant-specific MS/MS-based data resource and database. Phytochemistry 2012, 82, 38–45. [Google Scholar] [CrossRef] [PubMed] [Green Version]
- Domingo-Almenara, X.; Montenegro-Burke, J.R.; Ivanisevic, J.; Thomas, A.; Sidibé, J.; Teav, T.; Guijas, C.; Aisporna, A.E.; Rinehart, D.; Hoang, L.; et al. XCMS-MRM and METLIN-MRM: A cloud library and public resource for targeted analysis of small molecules. Nat. Methods 2018, 15, 681–684. [Google Scholar] [CrossRef] [PubMed]
- Chen, W.; Gong, L.; Guo, Z.; Wang, W.; Zhang, H.; Liu, X.; Yu, S.; Xiong, L.; Luo, J. A novel integrated method for large-scale detection, identification, and quantification of widely targeted metabolites: Application in the study of rice metabolomics. Mol. Plant 2013, 6, 1769–1780. [Google Scholar] [CrossRef] [PubMed] [Green Version]
- Grundhöfer, P.; Niemetz, R.; Schilling, G.; Gross, G.G. Biosynthesis and subcellular distribution of hydrolyzable tannins. Phytochemistry 2001, 57, 915–927. [Google Scholar] [CrossRef]
- Denzel, K.; Schilling, G.; Gross, G.G. Biosynthesis of gallotannins. Enzymatic conversion of 1,6-digalloylglucose to 1,2,6-trigalloylglucose. Planta 1988, 176, 135–137. [Google Scholar] [CrossRef]
- Bai, Z.-Z.; Tang, J.-M.; Ni, J.; Zheng, T.-T.; Zhou, Y.; Sun, D.-Y.; Li, G.-N.; Liu, P.; Niu, L.-X.; Zhang, Y.-L. Comprehensive metabolite profile of multi-bioactive extract from tree peony (Paeonia ostii and Paeonia rockii) fruits based on MS/MS molecular networking. Food Res. Int. 2021, 148, 110609. [Google Scholar] [CrossRef]
- Chen, C.; Chen, H.; Zhang, Y.; Thomas, H.R.; Frank, M.H.; He, Y.; Xia, R. TBtools: An integrative toolkit developed for interactive analyses of big biological data. Mol. Plant 2020, 13, 1194–1202. [Google Scholar] [CrossRef]


| NO. | RT * | Compound | Formula | [M-H]− | Fragment Ions |
|---|---|---|---|---|---|
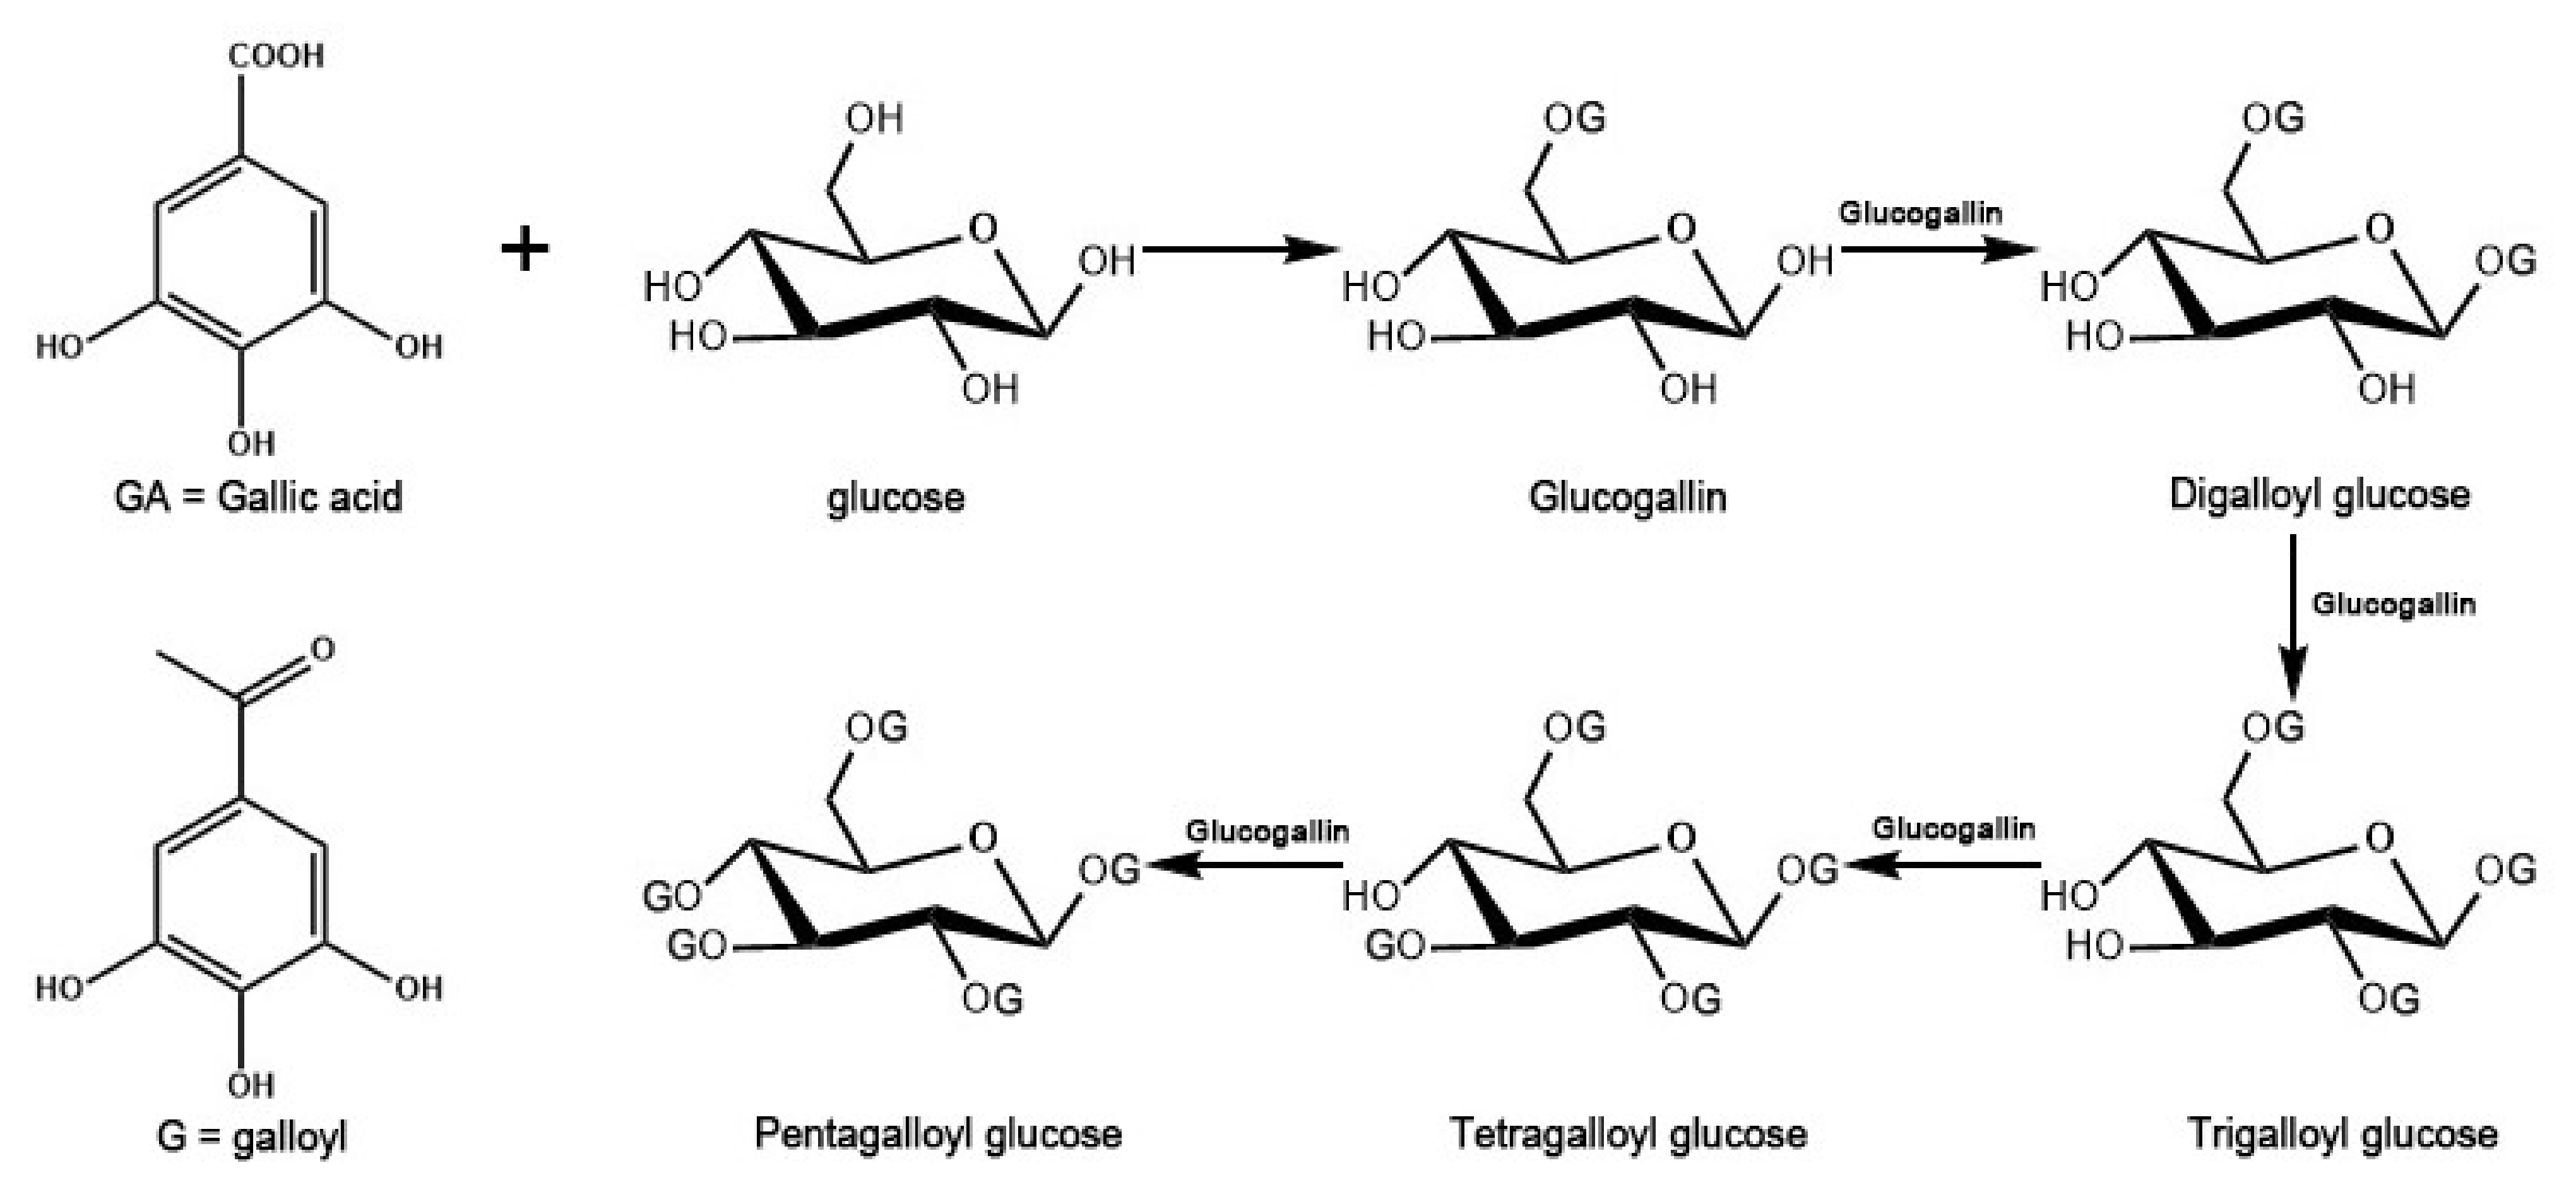
| 1 | 0.76 | Glucogallin | C13H16O10 | 331.1 | 211, 169, 151, 125 |
| 2 | 0.96 | Glucogallin | C13H16O10 | 331.0 | 211, 169, 151, 125 |
| 3 | 1.92 | Digalloyl glucose | C27H24O18 | 483.0 | 313, 271, 211, 169, 125 |
| 4 | 3.52 | Trigalloyl glucose | C27H24O18 | 635.0 | 465, 313, 169, 125 |
| 5 | 4.07 | Trigalloyl glucose | C27H24O18 | 634.9 | 483, 465, 313, 169, 125 |
| 6 | 4.20 | Tetragalloyl glucose | C34H28O22 | 787.0 | 635, 617, 465, 313, 169, 125 |
| 7 | 4.85 | Tetragalloyl glucose | C34H28O22 | 786.7 | 635, 617, 465, 313, 125 |
| 8 | 5.39 | Pentagalloyl glucose | C41H32O26 | 938.8 | 787, 769, 617, 601, 599, 169, 125 |
| 9 | 5.74 | Tetragalloyl glucose | C34H28O22 | 786.9 | 635, 617, 465, 313 |
Publisher’s Note: MDPI stays neutral with regard to jurisdictional claims in published maps and institutional affiliations. |
© 2022 by the authors. Licensee MDPI, Basel, Switzerland. This article is an open access article distributed under the terms and conditions of the Creative Commons Attribution (CC BY) license (https://creativecommons.org/licenses/by/4.0/).
Share and Cite
Bai, Z.; Yu, R.; Zheng, T.; Sun, D.; Zhou, Y.; Tang, J.; Zhu, H.; Li, G.; Niu, L.; Cui, L.; et al. A Novel Strategy for Unveiling Spatial Distribution Pattern of Gallotannins in Paeonia rockii and Paeonia ostii Based on LC–QTRAP–MS. Metabolites 2022, 12, 326. https://doi.org/10.3390/metabo12040326
Bai Z, Yu R, Zheng T, Sun D, Zhou Y, Tang J, Zhu H, Li G, Niu L, Cui L, et al. A Novel Strategy for Unveiling Spatial Distribution Pattern of Gallotannins in Paeonia rockii and Paeonia ostii Based on LC–QTRAP–MS. Metabolites. 2022; 12(4):326. https://doi.org/10.3390/metabo12040326
Chicago/Turabian StyleBai, Zhangzhen, Rui Yu, Tiantian Zheng, Daoyang Sun, Yang Zhou, Junman Tang, Huili Zhu, Guangning Li, Lixin Niu, Lu Cui, and et al. 2022. "A Novel Strategy for Unveiling Spatial Distribution Pattern of Gallotannins in Paeonia rockii and Paeonia ostii Based on LC–QTRAP–MS" Metabolites 12, no. 4: 326. https://doi.org/10.3390/metabo12040326
APA StyleBai, Z., Yu, R., Zheng, T., Sun, D., Zhou, Y., Tang, J., Zhu, H., Li, G., Niu, L., Cui, L., Du, R., Zhang, J., & Zhang, Y. (2022). A Novel Strategy for Unveiling Spatial Distribution Pattern of Gallotannins in Paeonia rockii and Paeonia ostii Based on LC–QTRAP–MS. Metabolites, 12(4), 326. https://doi.org/10.3390/metabo12040326