Article

Untargeted Metabolomics Identify a Panel of Urinary Biomarkers for the Diagnosis of Urothelial Carcinoma of the Bladder, as Compared to Urolithiasis with or without Urinary Tract Infection in Dogs

by
Maria Malvina Tsamouri
1,2,*,
Blythe P. Durbin-Johnson
3,
William T. N. Culp
4,
Carrie A. Palm
5,
Mamta Parikh
6,
Michael S. Kent
4 and
Paramita M. Ghosh
1,2,7,*
1
Veterans Affairs-Northern California Health System, Mather, CA 95655, USA
2
Department of Urologic Surgery, School of Medicine, University of California Davis, Sacramento, CA 95718, USA
3
Department of Public Health Sciences, University of California Davis, Davis, CA 95616, USA
4
Department of Surgical and Radiological Sciences, School of Veterinary Medicine, University of California Davis, Davis, CA 95616, USA
5
Department of Medicine and Epidemiology, School of Veterinary Medicine, University of California Davis, Davis, CA 95616, USA
6
Division of Hematology and Oncology, Department of Internal Medicine, School of Medicine, University of California Davis, Sacramento, CA 95718, USA
7
Department of Biochemistry and Molecular Medicine, School of Medicine, University of California Davis, Sacramento, CA 95718, USA
*
Authors to whom correspondence should be addressed.
Metabolites 2022, 12(3), 200; https://doi.org/10.3390/metabo12030200
Submission received: 15 January 2022 / Revised: 10 February 2022 / Accepted: 22 February 2022 / Published: 24 February 2022
(This article belongs to the Special Issue Metabolomics in the Study of Veterinary Disease)

Abstract

:
Urothelial carcinoma (UC), the most common urologic cancer in dogs, is often diagnosed late because the clinical signs are shared by other non-malignant lower urinary tract disorders (LUTD). The urine-based BRAFV595E test for UC is highly effective only in certain breeds; hence additional non-invasive biomarkers of UC are needed. Here, urine from dogs with UC (n = 27), urolithiasis (n = 8), or urolithiasis with urinary tract infection (UTI) (n = 8) were subjected to untargeted metabolomics analyses, using GC-TOF-MS for primary metabolites, QTOF-MS for complex lipids, and HILIC-QTOF MS for secondary and charged metabolites. After adjusting for age and sex, we identified 1123 known metabolites that were differentially expressed between UC and LUTD. Twenty-seven metabolites were significant (1.5 ≤ log2FC ≤ −1.5, adjusted p-value < 0.05); however, 10 of these could be attributed to treatment-related changes. Of the remaining 17, 6 (hippuric acid, N-Acetylphenylalanine, sarcosine, octanoylcarnitine, N-alpha-methylhistamine, glycerol-3-galactoside) discriminated between UC and LUTD (area under the ROC curve > 0.85). Of the 6 metabolites, only hippuric acid and N-alpha-methylhistamine were discriminatory in both male (n = 20) and female (n = 23) dogs, while sarcosine was an effective discriminator in several breeds, but only in females. Further investigation of these metabolites is warranted for potential use as non-invasive diagnostic biomarkers of dogs with UC that present with LUTD-related clinical signs.

1. Introduction

Urothelial carcinoma (UC) is the most common type of urinary bladder malignancy in dogs, affecting >50,000 dogs annually in the US. Reported breed predilections include Scottish Terriers, Shetland sheepdogs, wirehair fox terriers, West Highland white terriers, and beagles. Middle-aged or elderly female dogs are most commonly affected [1]. Early diagnosis of this disease is often challenging due to non-specific clinical signs, such as stranguria, pollakiuria, and hematuria as well as secondary bacterial infection. These clinical signs are shared by other lower urinary tract disorders (LUTD) such as urinary tract infection (UTI) and urolithiasis [1].
The current mechanisms of detection of UC involve cytopathology, histopathology, and a recently developed urine test to identify BRAFV595E mutations, which are present in ~65–80% of canine UC [2,3]. Since then, many studies have been undertaken to identify additional biomarkers that distinguish canine UC from other diseases, but few, if any, are used clinically. We previously evaluated the expression levels of 5 miRNA associated with UC pathophysiology (miR-34a, let-7c, miR-16, miR-103b, and miR-106b) in the blood and urine of dogs with UC vs. LUTD [4]. These studies indicated a need for unbiased identification of non-invasive markers that distinguish between UC and other LUTD.
The urine is a rich source of metabolites, and multiple studies have evaluated the metabolites present in the urine of dogs with UC. Previous studies have demonstrated differential expression of various metabolites (urea, choline, methylguanidine, citrate, acetone, β-hydroxybutyrate) in the urine of dogs with UC compared to those of healthy dogs [5]. However, a comparison between dogs with UC and other LUTD has not been conducted. Dysuria (straining to urinate), pollakiuria (increase in urination frequency), and haematuria (bloody urine) are also primary signs of canine bladder stones (urocystoliths), with or without secondary UTI. However, there is little evidence of markers that can distinguish between the two. In this study, therefore, we embark on an investigation to differentiate between bladder stones and bladder cancer via urine metabolomics.
Altered metabolic regulation of tumor cells has been recognized as one of the hallmarks of cancer [6]. Metabolomics profile the end-products of gene expression and cell regulatory processes, while also reporting on environmental effects. The cancer microenvironment itself is the richest source of metabolic biomarkers that can report on early and successive changes in metabolism as cancer progresses, integrating the effects of genetic and environmental factors [7]. Metabolomics can be used for the identification of cancer risk factors, the characterization of the tumorigenic potential of certain metabolic pathways, and the discovery of potential diagnostic cancer biomarkers [8].
In this study, we sought to identify a unique set of metabolic markers that can accurately diagnose UC. Previous studies have identified differentially present metabolites in dogs with UC and clinically normal dogs [5,9,10]. Here we hypothesize that differentially present metabolites could distinguish between UC and other LUTD in dogs (especially urolithiasis) that are evaluated for lower urinary tract-related clinical signs. We identify six metabolites (hippuric acid, N-Acetylphenylalanine, sarcosine, octanoylcarnitine, N-α-methylhistamine (NAMH), glycerol-3-galactoside) in the urine of subjects with UC that are distinctively different from those with urolithiasis, with or without UTI (used as the control group). However, only two—hippuric acid and NAMH—could distinguish between UC and control in both males and females, and they were effective mostly in retrievers and in all other breeds, but not in terriers. We also determined that neither urethral obstruction, nor other factors such as spaying/neutering, or the use of antibiotics or NSAID, or the development of metastasis or chemotherapy, affected the expression of these metabolites.

2. Results

2.1. Subject Characteristics

The clinicopathological characteristics of the dogs that participated in this study are shown in Table 1. Forty-three dogs from multiple breeds were recruited, including terriers (12/43, 27.9%), retrievers (6/43, 14%), and shepherds (5/27, 11.6%). In total, 27 had UC, 8 had urolithiasis only, and 8 had both UTI and urolithiasis. We did not collect urine from any dog with UTI alone, nor did we collect urine from any female dogs with urolithiasis. Of the 43 dogs, 20 (46.5%) were female and 23 (53.5%) were male; however, in the UC group, 15 (55.6%) of the animals were female whereas 12 (44.6%) were male (p = 0.009). Median age of the dogs with UC was 11 years (range 6–14 years), whereas dogs with urolithiasis (6.5 years (range 1–13 years)), or UTI + urolithiasis (7 years (range 0.3–12 years)) were significantly younger (p < 0.001).
In the UC group, more than 90% of the animals were castrated/spayed, with only one female (1/15) and one male (1/12) being intact. Similarly, in the control group, 1/5 female and 3/11 male dogs were intact. Several of the dogs presented with urinary obstructions (7/43(16.3%)), including 5/27(18.5%) in the UC group; 3/27 (11.1%) of dogs with UC had already developed metastases at the time of urine collection. Some dogs were actively receiving non-steroidal anti-inflammatory drugs (NSAIDS) (15/43 (34.9%)), including (12/27, 44.4%) in the UC group; 8/43 (18.6%) were also receiving antibiotics, including 7 (25.9%) with UC at the time of urine collection. The others diagnosed with a UTI went on to receive antibiotics after urine was already collected. Of the dogs with UC, only a few had received chemotherapeutics (4/27, 14.8%) at the time urine was collected. However, there was no statistical difference between the dogs with UC vs. those with urolithiasis with or without UTI, with respect to any of these factors.

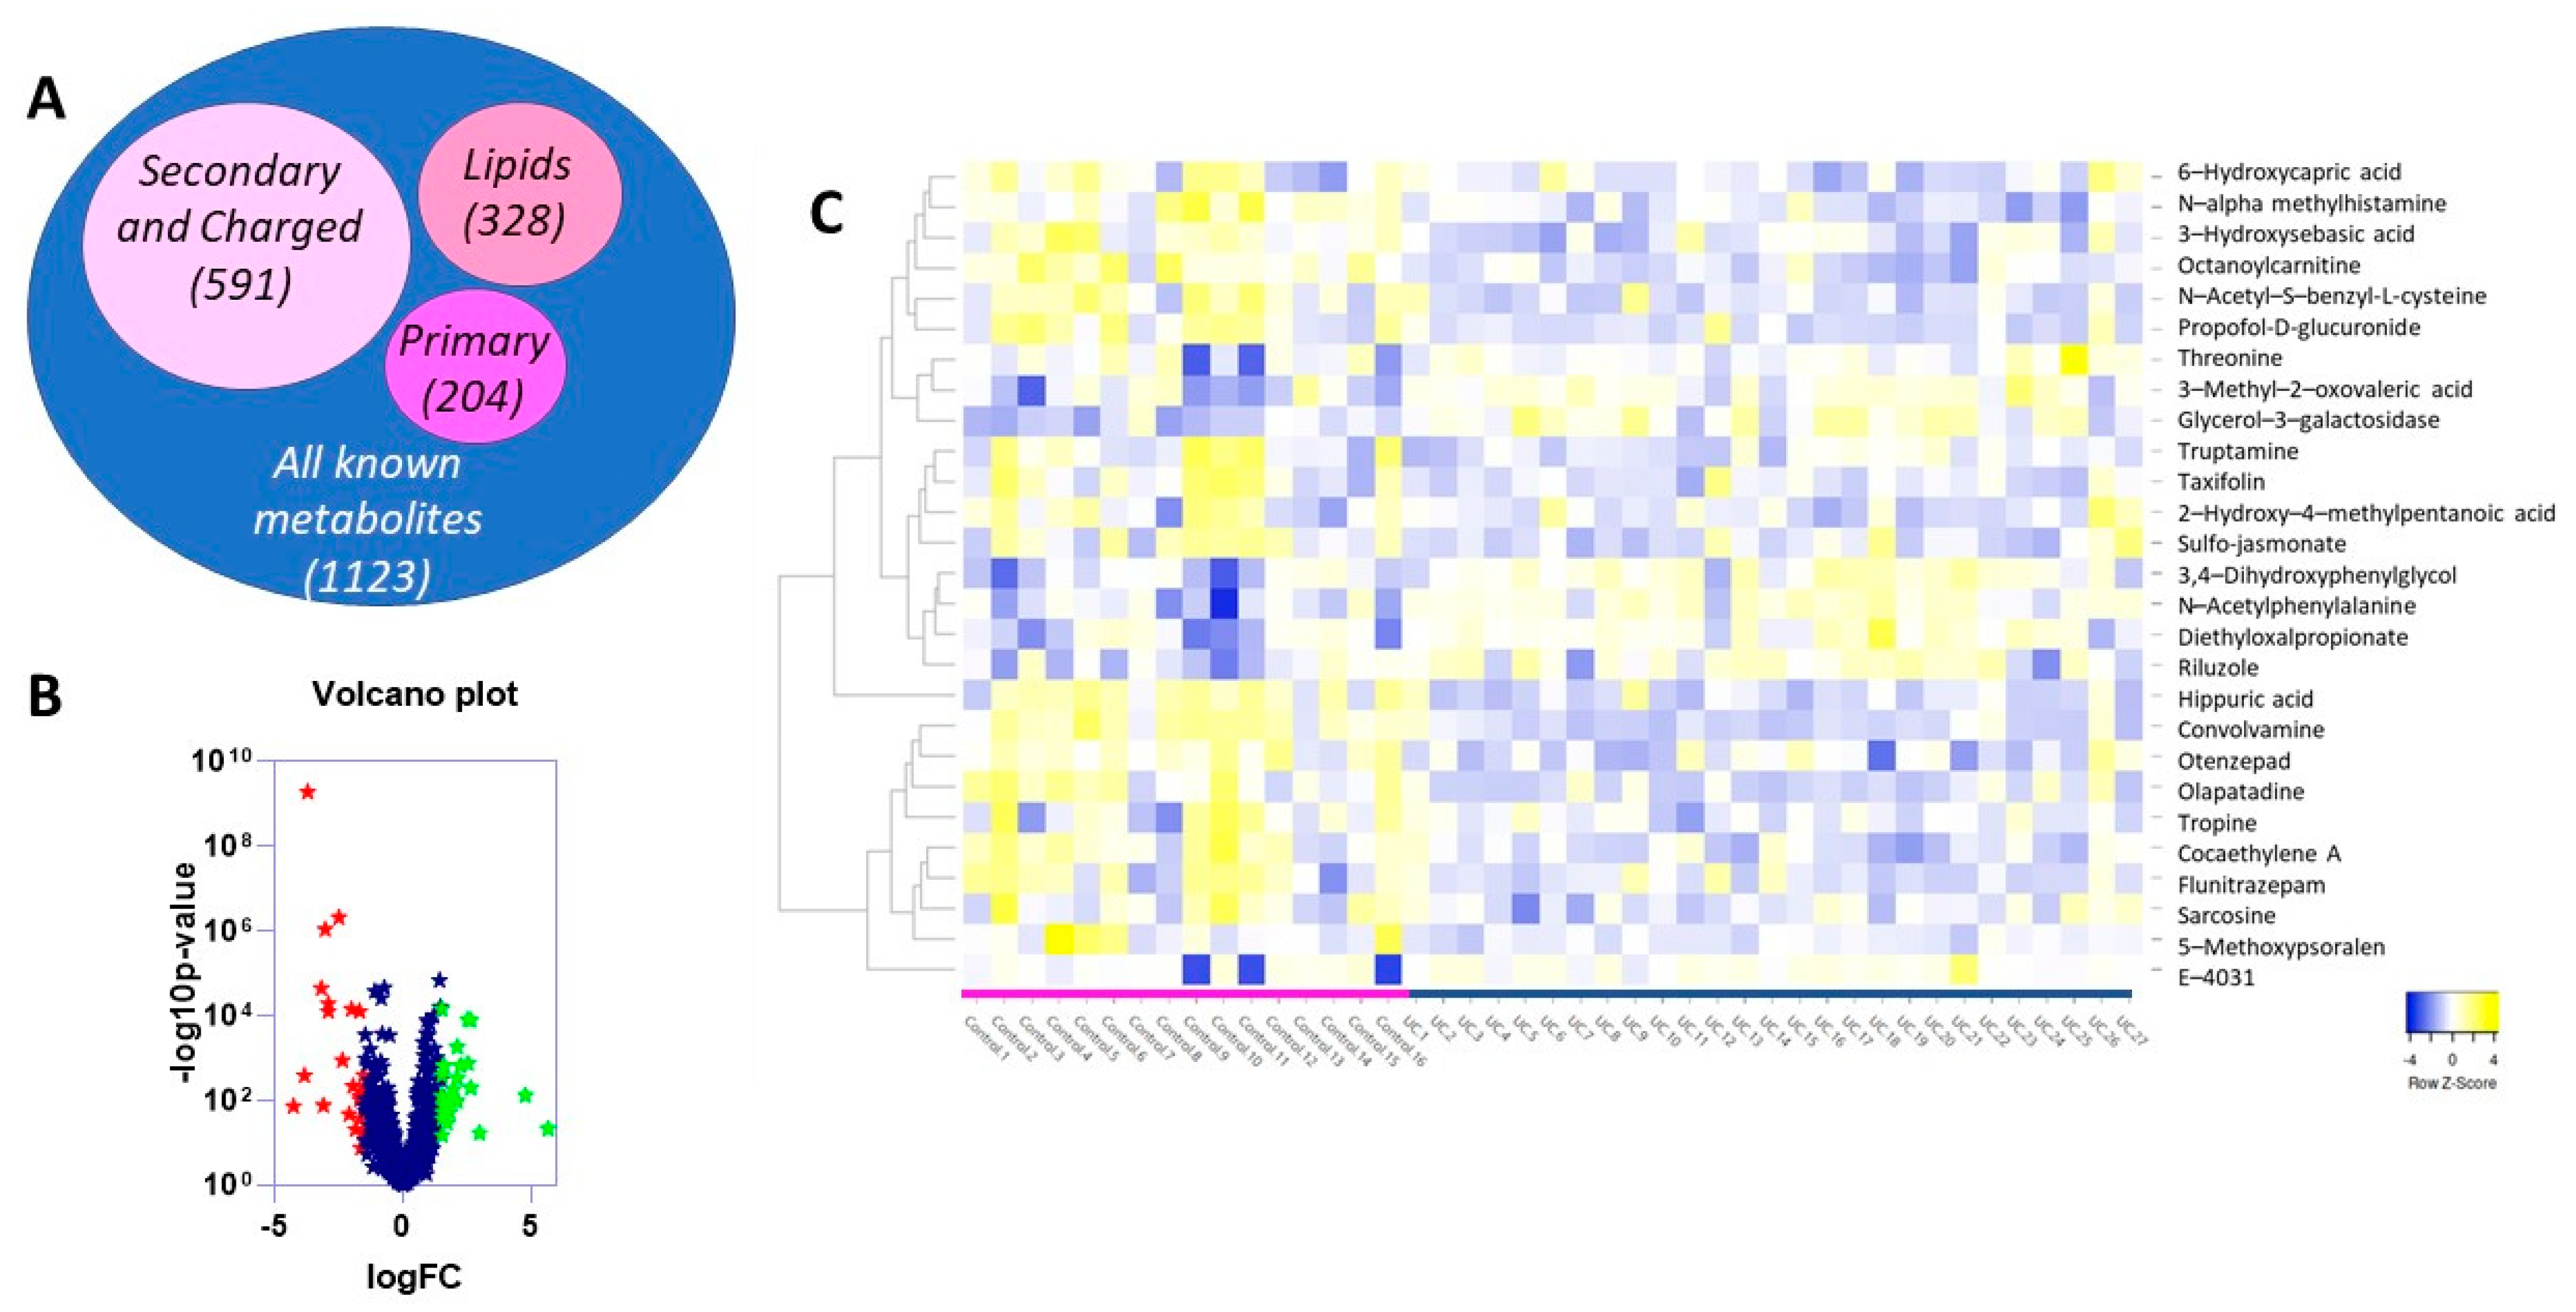
2.2. Differentially Expressed Metabolites in UC vs. Control Reflects Changes in Medication and Diet, as Well as Internal Genetic Alterations Due to Disease Progression

Untargeted metabolomic analysis was conducted for the abovementioned 43 urine samples and normalized to creatinine levels as described in Section 4. Because age and sex were significantly different between UC vs. the urolithiasis and UTI + urolithiasis groups combined (referred herein as the control group), data were adjusted for age and sex. Untargeted analyses identified 6981 compounds (Figure 1A) differentially expressed between the two groups, of which 1123 corresponded to known metabolites (Figure 1B). This included 204 primary metabolites, 328 lipids, and 591 secondary and charged metabolites. Only the known metabolites were analyzed further. Of the 1123 known metabolites, only 27 metabolites (Figure 1C) were considered significant (−1.5 ≥ log2 fold change ≥ 1.5, adjusted p-value < 0.05); 2 primary metabolites and 25 secondary bioamines (Table 2). Of the 27, 8 were upregulated, including one primary metabolite; while 19 were downregulated, including one primary metabolite.
Several of the differentially identified metabolites are considered products of drug metabolism (Table S1). Those downregulated in UCs included: Olapatadine, a metabolite of antihistamines [11]; propofol-β-D-glucuronide, a metabolite of propofol (Pubchem, [12]); Taxifolin (dihydroquercetin), a flavonoid used as an antioxidant in nutritional supplements [13]; Otenzepad, a muscarinic M2 receptor antagonist [14]; 5-methoxypsoralen, an anti-psoriatic agent [15]; and convolvamine, a tropane alkaloid with anxiolytic, anti-depressant, and sedative activity [16]. Metabolites upregulated in UC included E-4031, an experimental class III antiarrhythmic drug [17], Riluzole, a glutamate blocker to treat amyotrophic lateral sclerosis [18], Cocaethylene, formed by the simultaneous administration of ethanol and cocaine [19], and Flunitrazepam, a benzodiazepine used to treat severe insomnia and assist with anesthesia [20]. These drugs were likely received as anesthetic or sedation protocols or used to treat their current or concurrent diseases.

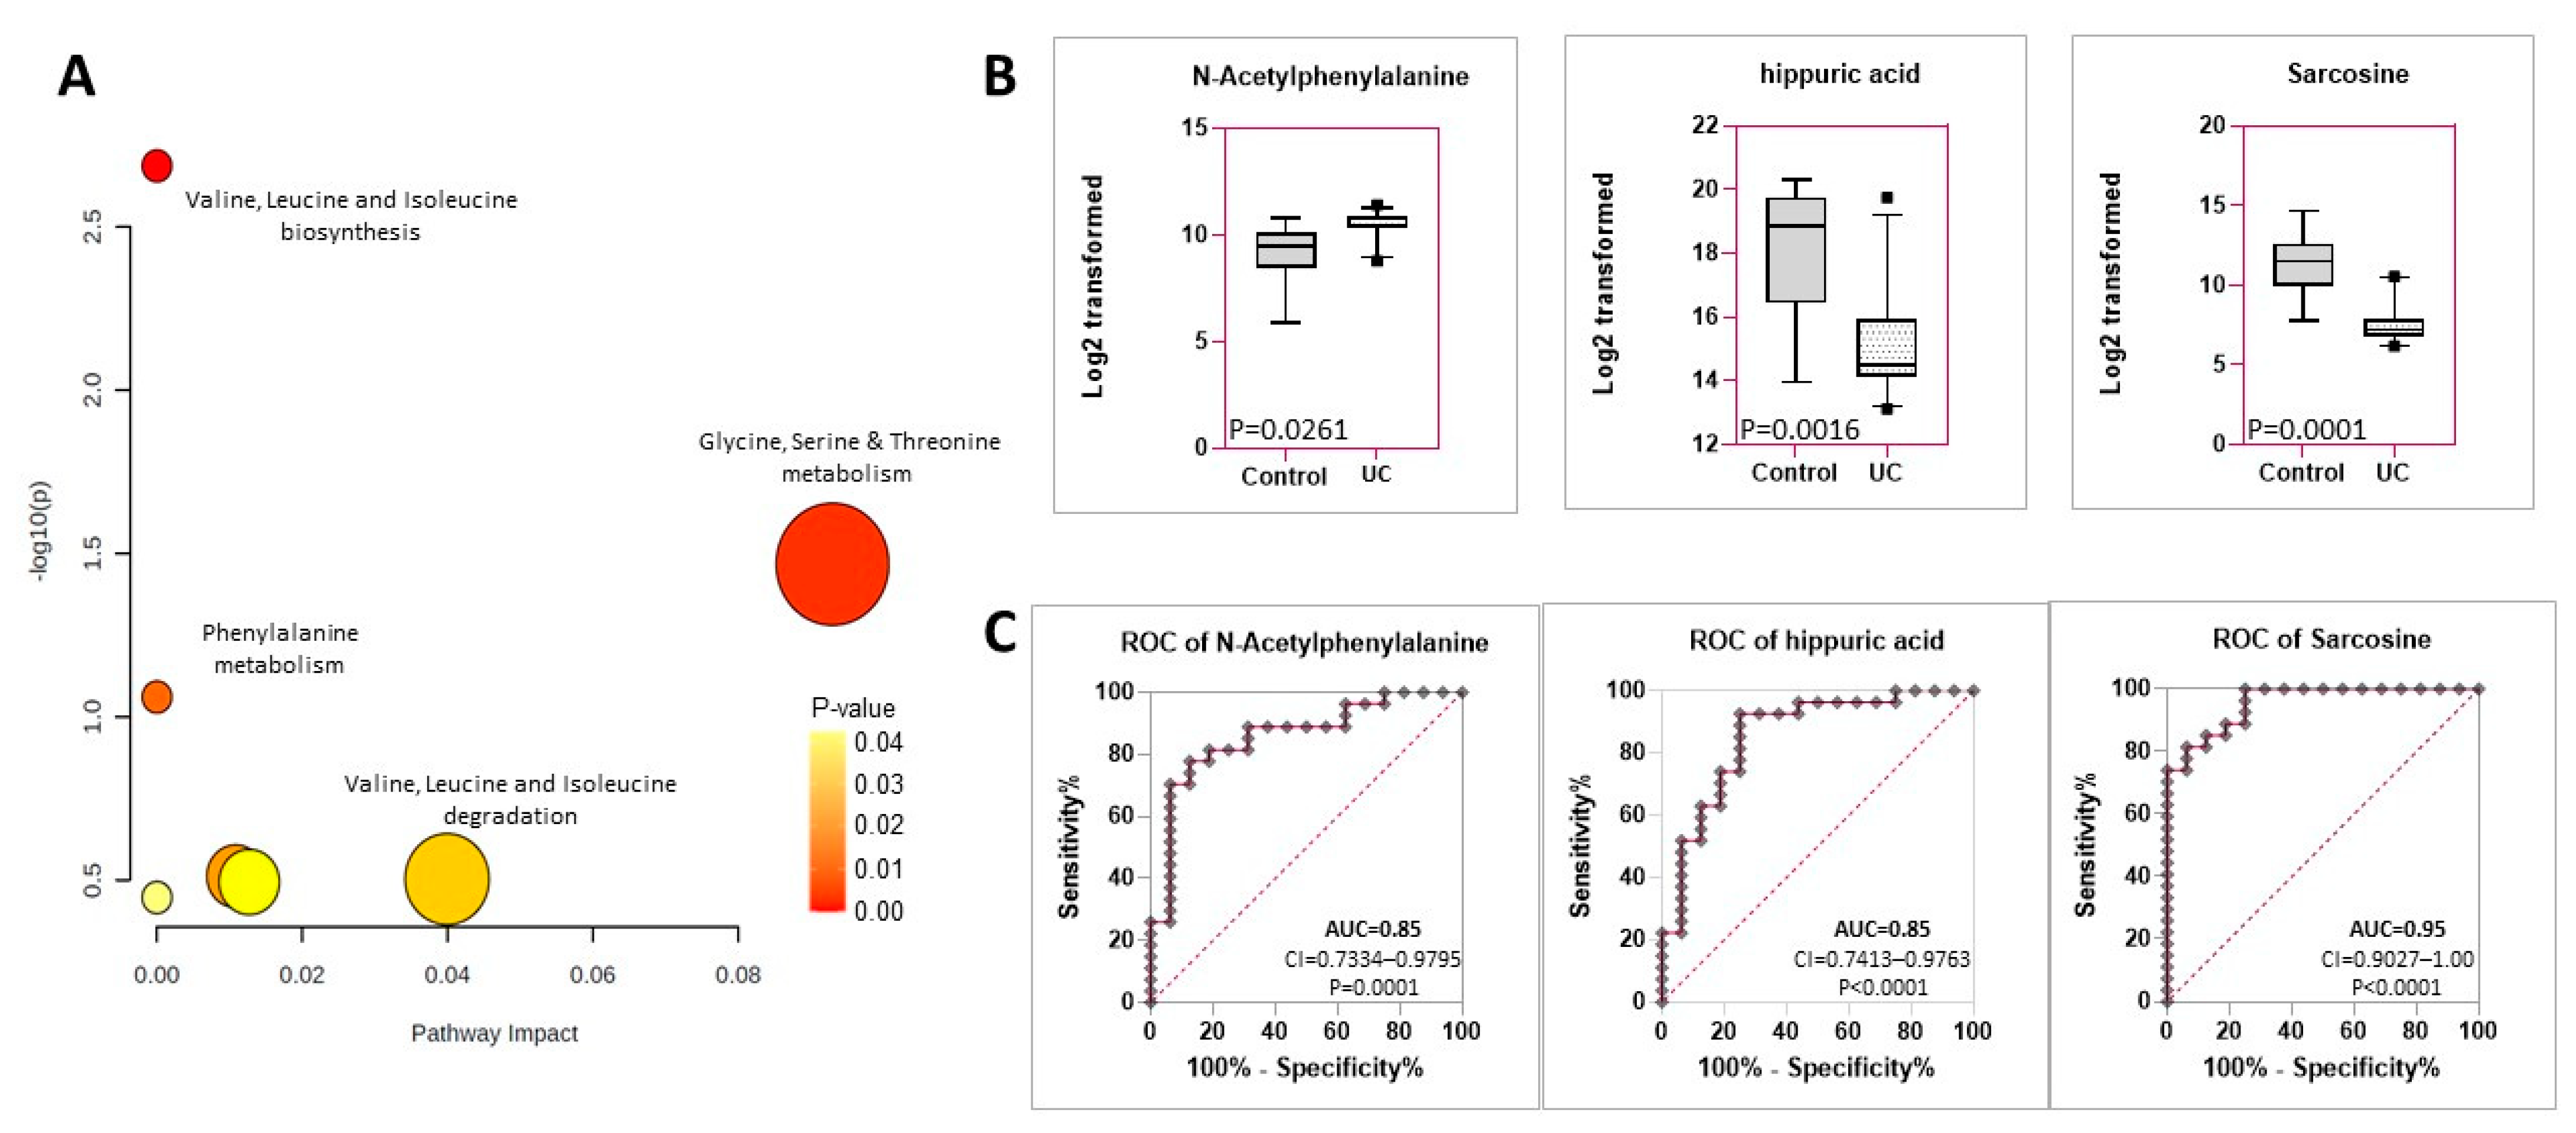
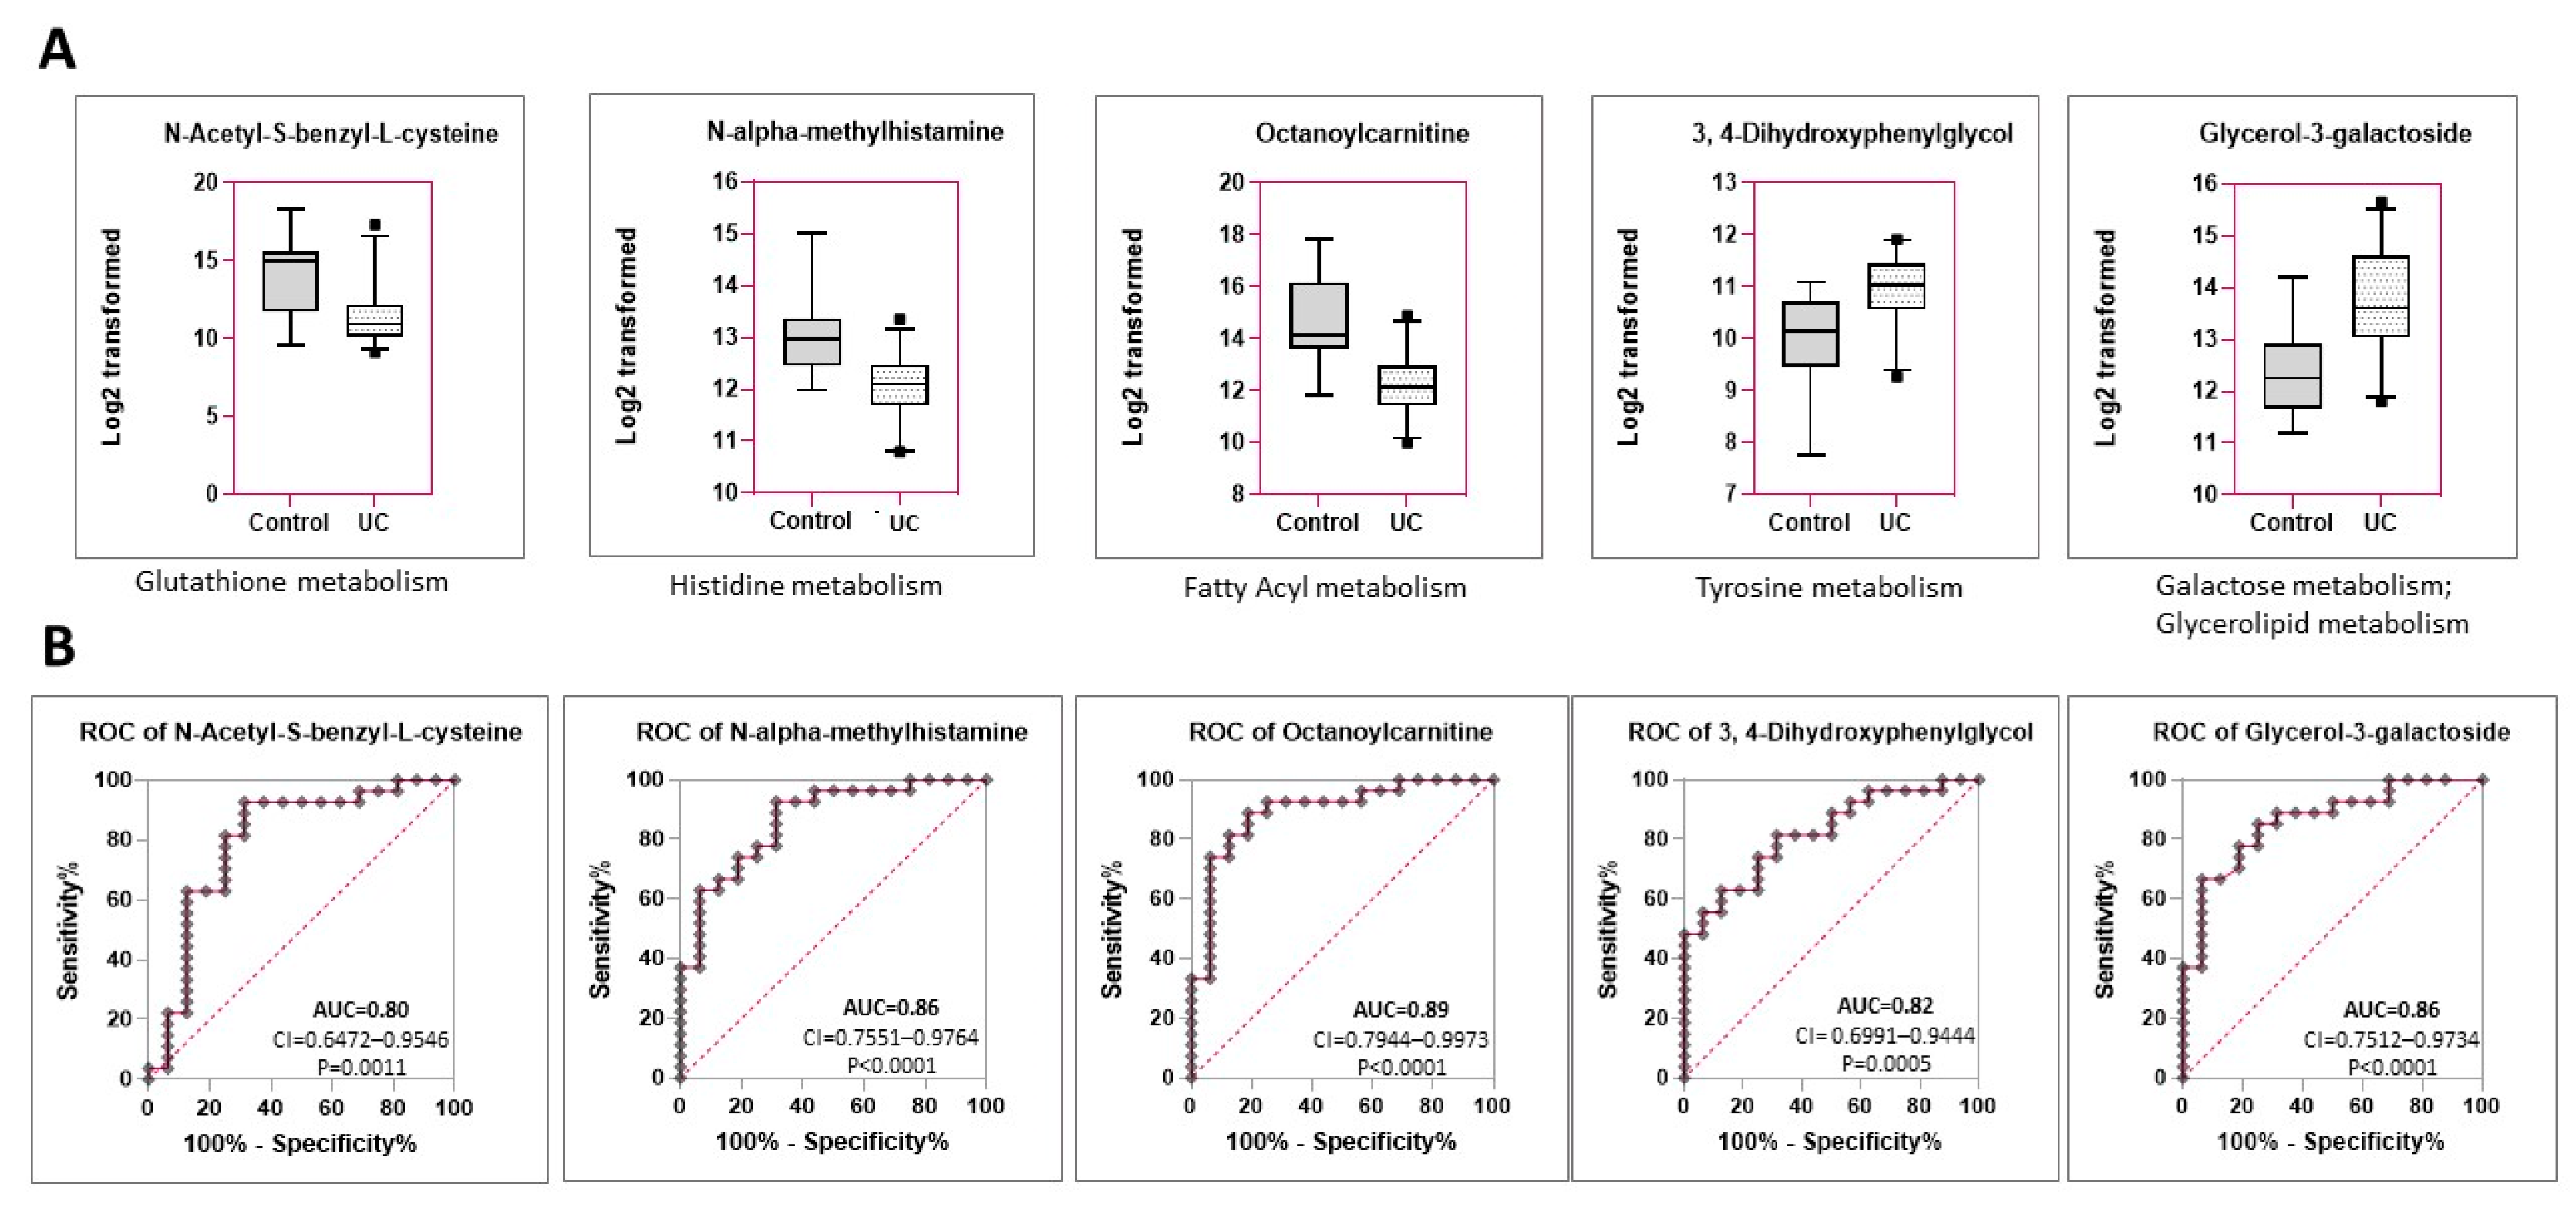
2.3. Identification of Six Metabolites That Are Distinctly Expressed in the Urine of Dogs with Urothelial Carcinoma vs. Urolithiasis with or without a UTI

KEGG pathway analysis was performed to identify the metabolic pathways that are differentially expressed in dogs with UC as compared with the control group. The analysis was performed using differentially expressed metabolites after adjusting for age and sex (Figure 2A). Various pathways were shown to be possibly affected, and the metabolites in each pathway are presented in Table 3. Valine, leucine, and isoleucine biosynthesis pathway (p = 0.00103); glycine, serine and threonine metabolism (p = 0.0178); and phenylalanine metabolism (p = 0.0629) were the most enriched pathways in UC vs. control groups (Figure S1)
We next determined whether specific components of the pathways distinguished between UC and controls. A noteworthy component of the phenylalanine metabolism pathway is hippuric acid, which is significantly decreased in urine from dogs with UC compared to controls (log2FC = −3.55, adjusted p-value = 0.0016) (Figure 2B, Table 2). This metabolite is an acyl glycine produced by the conjugation of glycine and benzoic acid, found normally in the urine as a metabolite of aromatic compounds. Similarly, N-Acetylphenylalanine (Afalanine), also a member of this pathway, was significantly increased in urine from dogs with UC compared to control animals (log2FC = +1.6295, adjusted p-value = 0.0261) (Figure 2B). Other components of this pathway include 5-Methoxypsoralen (commonly upregulated in psoriasis) and Taxifolin (an antioxidant in nutritional supplements), both downregulated in UC but not included in this list as they are likely components of ingested drugs/food supplements.
We next investigated whether components of the phenylalanine metabolism pathway can distinguish between the UC and control groups. The area under the Receiver Operating Characteristics (ROC) curve (AUC) for hippuric acid and NAMH both showed specificity and sensitivity with AUC = 0.85 for both (p = 0.0001 or <0.0001, respectively) (Figure 2C). In contrast, members of the valine, leucine, and isoleucine biosynthesis pathway (L-Threonine, 3-Methyl-2-Oxovaleric acid, 2-hydroxy-4-methylpentanoic acid), although individually differentially expressed between the two groups, did not show a significant ability to distinguish between UC and control (AUC < 0.75) (Figure S2). However, sarcosine, which mapped to the Glycine, Serine and Threonine Metabolism pathway, was also a significant distinguishing factor (AUC = 0.95, p < 0.0001) (Figure 2C) (threonine (Figure S2) is also a component of this pathway). Taken together, alterations of the phenylalanine pathway and the glycine, serine and threonine metabolism pathway were distinctive in UC vs. controls.
Other metabolites differentially expressed in UC vs. control include N-Acetyl-S-benzyl-L-cysteine (log2FC = −3.88, adjusted p-value = 0.0063), NAMH (log2FC = −1.57, adjusted p-value = 0.0084), and Octanoylcarnitine (log2FC = −2.2, adj.p.val. = 0.011), all downregulated in UC compared to controls (Figure 3A, Table 2). On the other hand, 3,4-dihydroxyphenylglycol (DHPG, log2FC = +1.585, adjusted p-value = 0.0111) and glycerol-3-galactoside (log2FC = +1.672, adjusted p-value = 0.0478) were increased in UC compared to controls. Of the above metabolites, the fatty acyl octanoylcarnitine showed the highest ability to distinguish between dogs with UC and control (AUC = 0.8958 (CI:0.7944–0.9973)) (Figure 3B); however, two others were also highly discriminatory (AUC > 0.85), including NAMH, a product of histidine metabolism (AUC = 0.8657, CI:0.7551–0.9764), and glycerol-3-galactoside, a component of both the galactose and the glycerolipid metabolism pathways (AUC = 0.8623, CI = 0.7512–0.9734). Other metabolites tested (Figure S3) failed to sufficiently discriminate between UC vs. control (Figure S4) despite being differentially expressed between the groups. Taken together, these results identify 6 urine-based metabolites (hippuric acid, N-Acetylphenylalanine, sarcosine, octanoylcarnitine, NAMH, glycerol-3-galactoside) that can likely distinguish between UC vs. control groups.

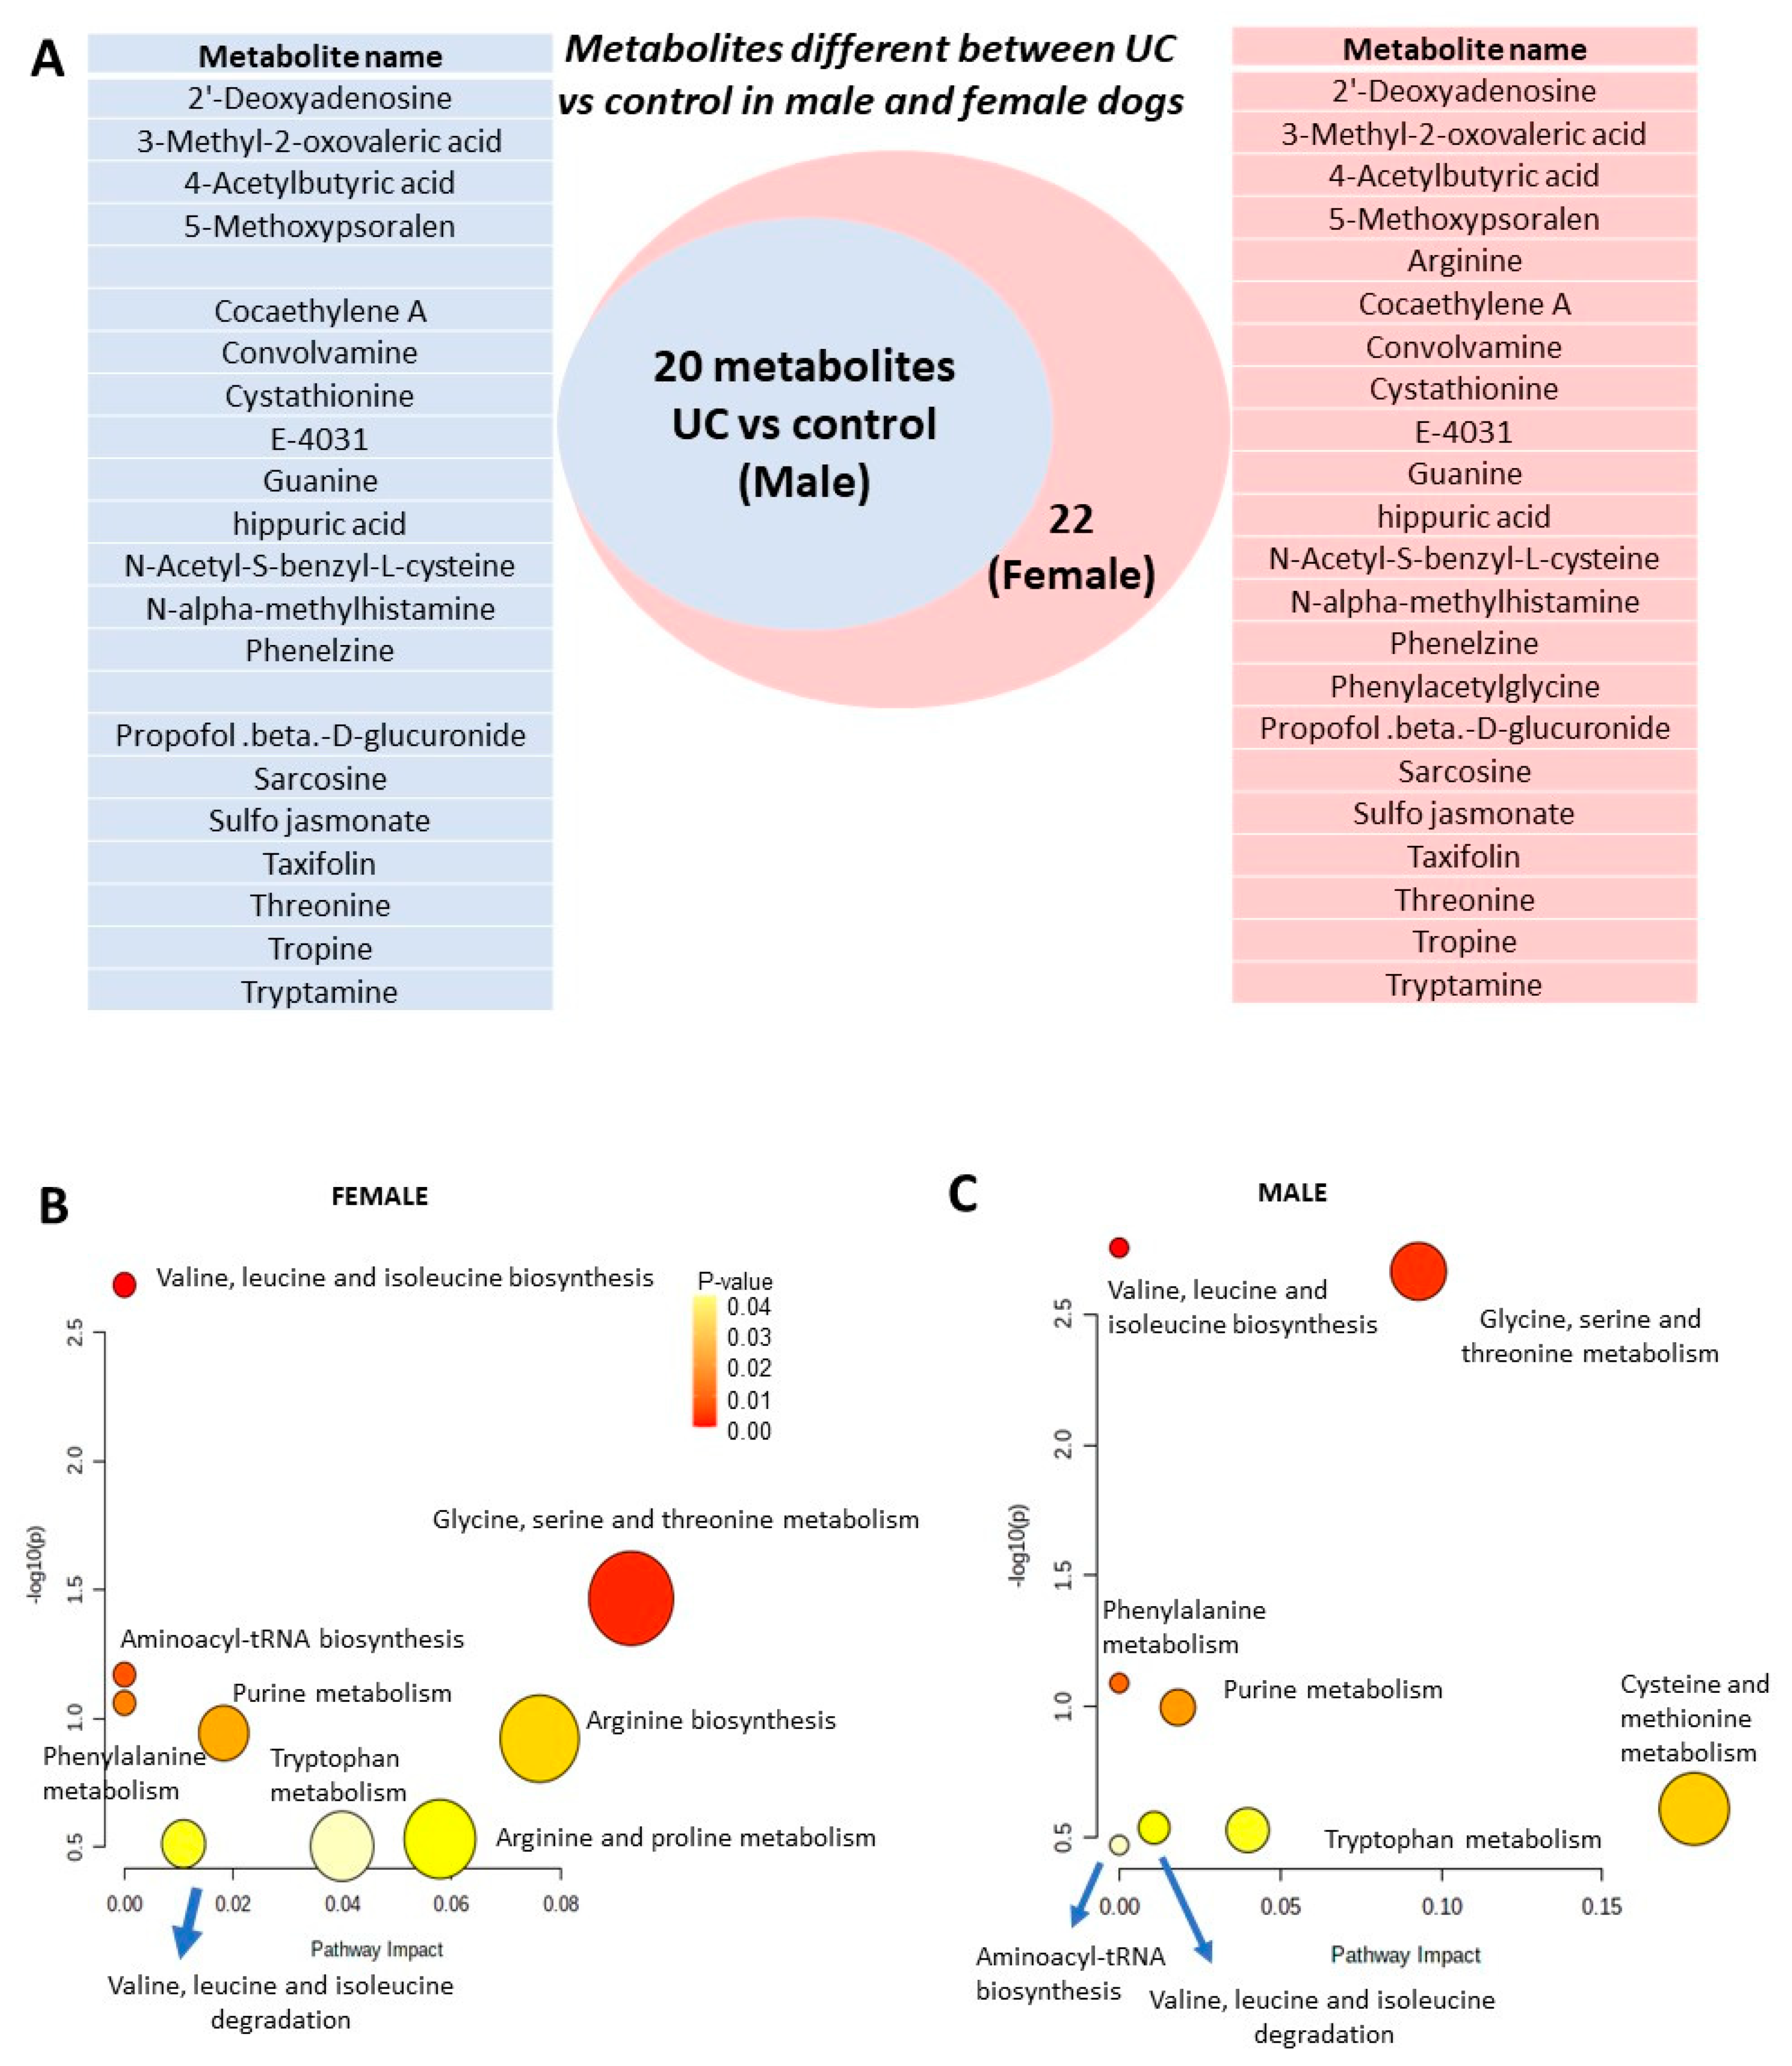
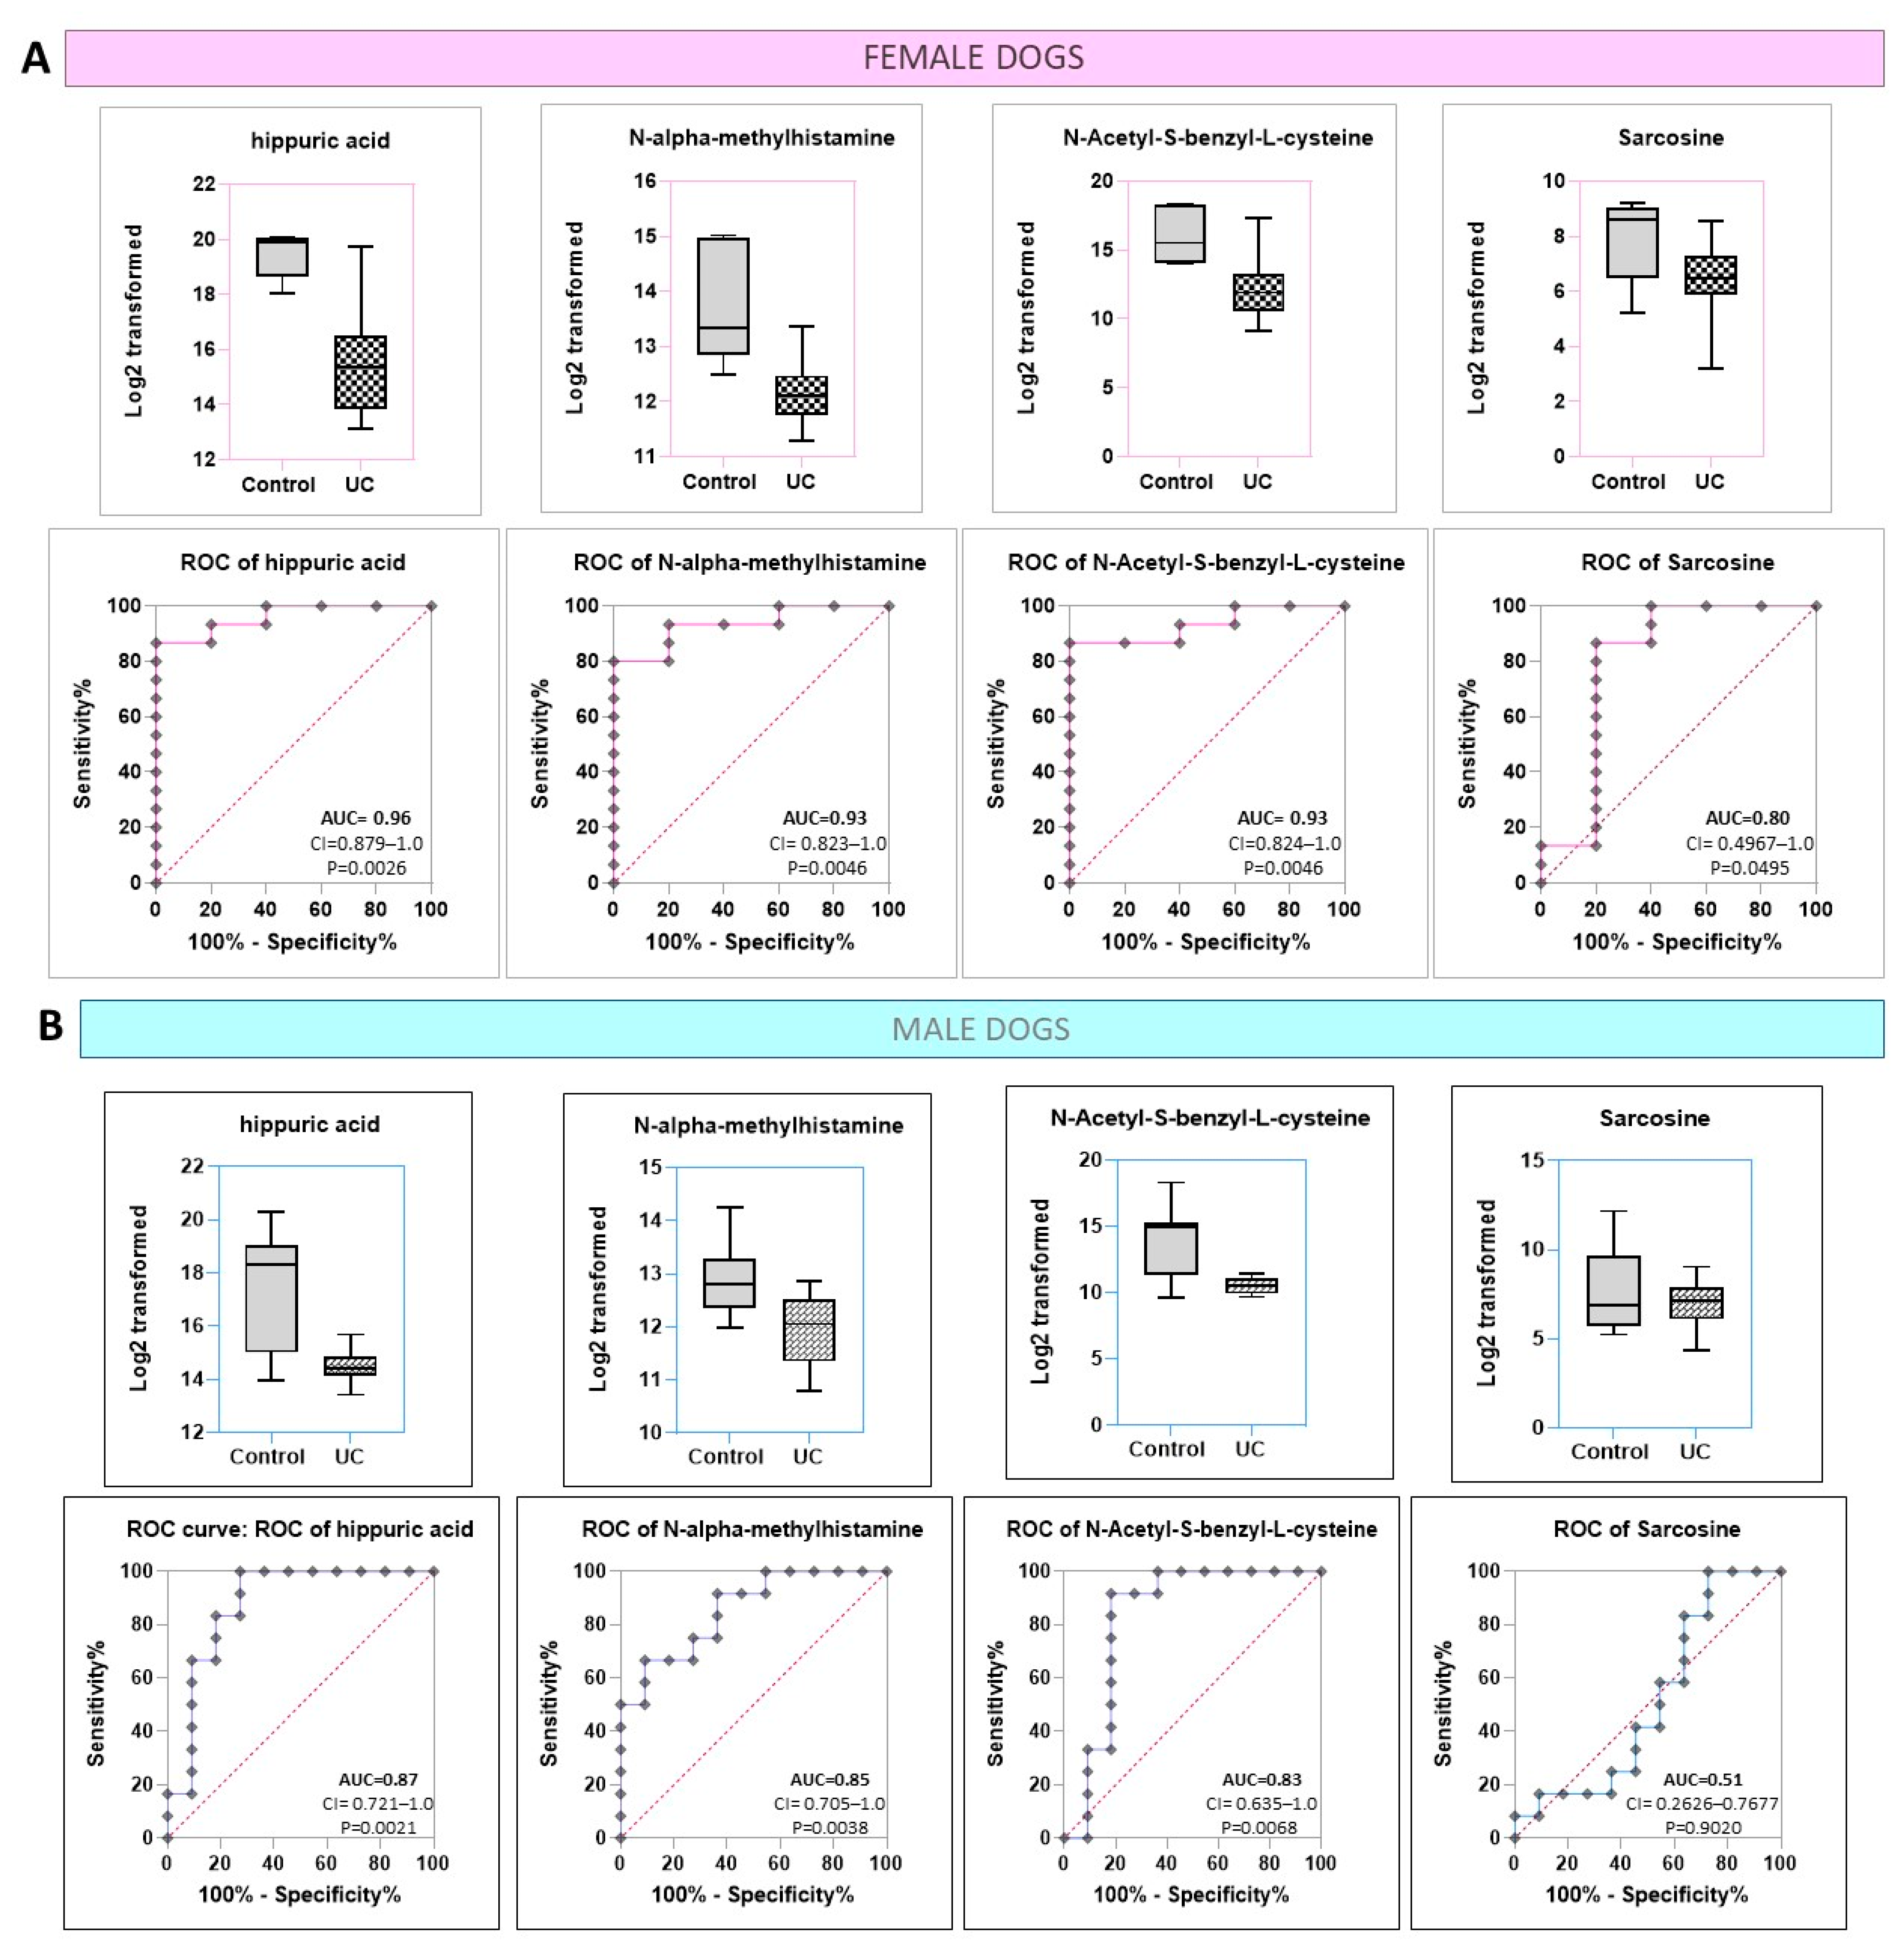
2.4. Hippuric Acid and NAMH Are Discriminatory between UC vs. Control in Both Male and Female Dogs

UC in dogs has a higher prevalence in female than male dogs (~1.8:1 ratio) [21]. We therefore compared the metabolites of male dogs (n = 12) vs. those of female dogs (n = 15). Evaluation of the urine of female dogs with UC (n = 15) and comparing them to the urine of control female dogs (n = 5) identified 22 differentially expressed metabolites (Table S2). Of these, 14 metabolites have been reported as differentially expressed in Table 2, including three of the highly discriminatory metabolites (hippuric acid, NAMH, sarcosine). Male dogs showed a similar differentiation pattern; however, arginine and phenylacetylglycine were differentially expressed in UC vs. control in females but not in males (Figure 4A). The urine of female dogs with UC appeared to be richer in metabolites, with a larger number of pathways represented (Figure 4B) compared to those of male dogs with UC (Figure 4C).
Arginine biosynthesis and arginine and proline metabolism were highly enriched in female dogs but not in males. On the other hand, cysteine and methionine metabolism was enriched in male dogs but not in females. In both females and males, hippuric acid, NAMH, N-Acetyl-S-benzyl-L-cysteine, and sarcosine were differentially expressed between UC and control (Figure 5). However, analysis of the ROC curve for these conditions showed that only three (hippuric acid, NAMH, N-Acetyl-S-benzyl-L-cysteine) were highly discriminatory in females with UC as compared to controls (AUC > 0.85) (Figure 5A). In contrast, in males, only hippuric acid and NAMH were discriminatory (AUC > 0.85) (Figure 5B). Of the rest, some, such as N-Acetylphenylalanine, were significantly discriminatory in females but not in males, whereas others, such as glycerol-3-galactoside and octanoylcarnitine, were discriminatory in males but not in females (Figure S5). Therefore, of the six metabolites identified above, only hippuric acid and NAMH showed promise as markers of UC in both sexes.

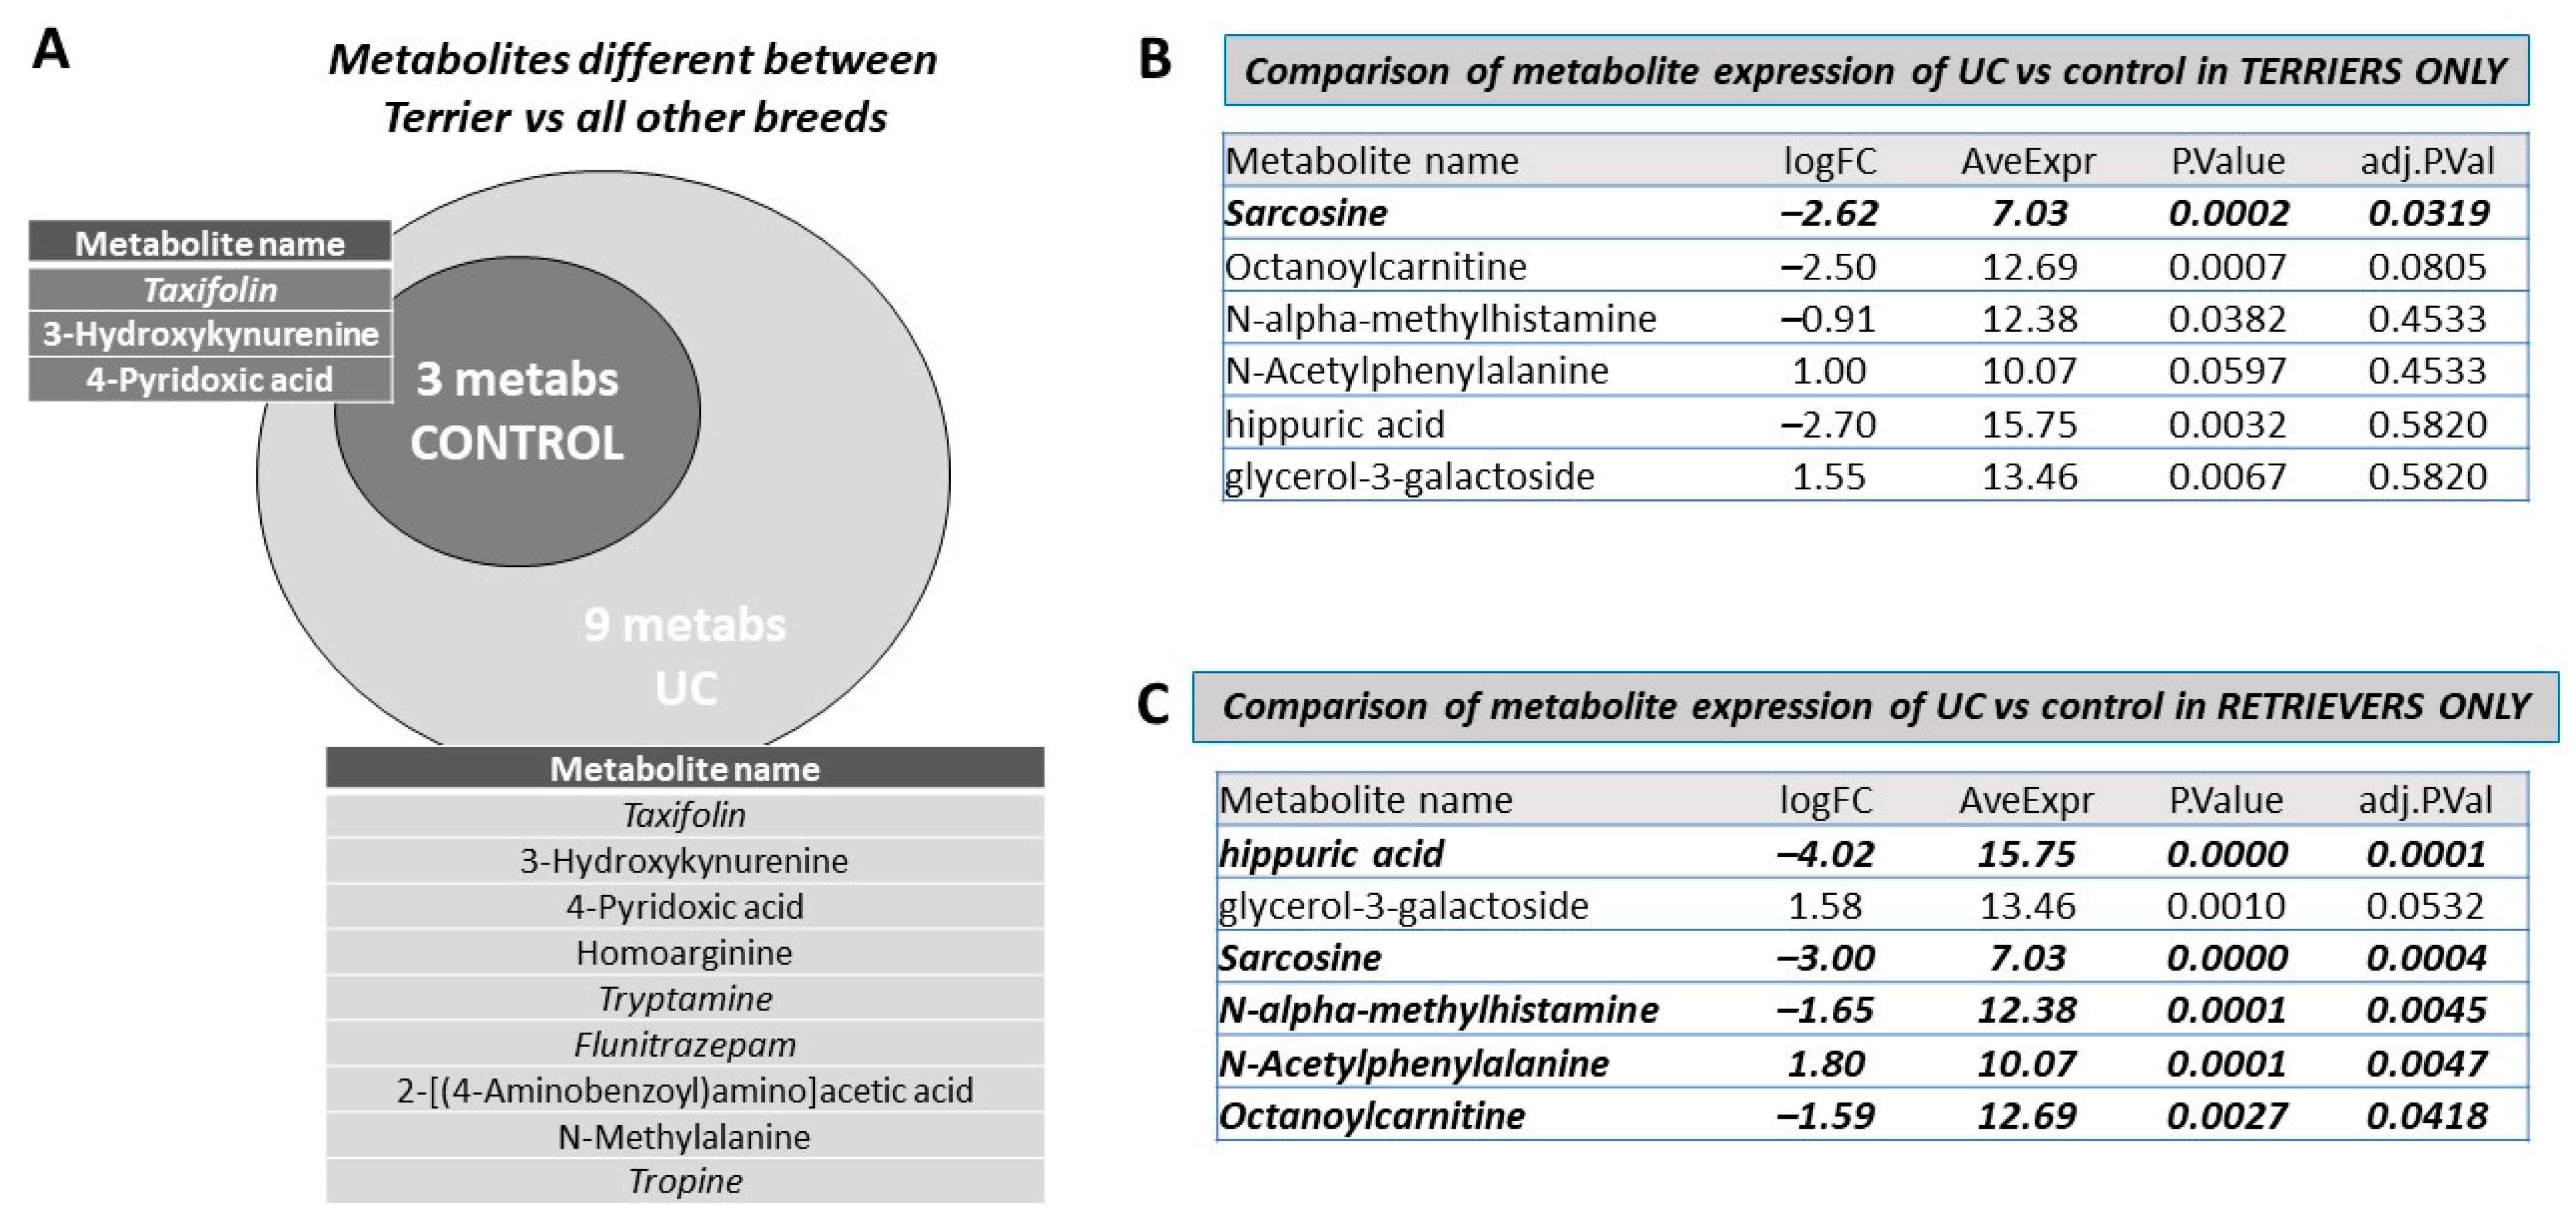
2.5. Breed-Related Differences in Metabolite Expression Show That Changes in Metabolites Observed Are Mostly Driven by Retrievers and Not Terriers

We next investigated whether the differential expression of the 6 metabolites that showed significant ability to discriminate between UC and control (hippuric acid, N-Acetylphenylalanine, sarcosine, octanoylcarnitine, NAMH, glycerol-3-galactoside) was driven by specific breeds. Table 4 shows the different breeds used in this study classified as defined by the American Kennel Club (AKC) and the United Kennel Club (UKC). None of the dogs in the Herding and Hound groups in this study experienced urolithiasis. Hence, we were not able to compare the expression of these metabolites between UC and control within these groups. The Companion breed group was represented by a single animal in the urolithiasis arm, while the Non-Sporting and Working Groups were represented by only one animal each in the UC arm; hence, we could not compare metabolites in UC vs. control in these groups either. The group with the largest number of animals, both in the UC and the control arms, were the terriers and retrievers (Table 4), hence we further investigated the contribution of these groups in the overall differential expression of metabolites.
To establish baselines, we first investigated whether there were any basic differences between terriers and non-terriers with respect to any metabolite. Neither the primary metabolites nor any of the lipids showed any significant differences between the terrier and non-terrier groupings (not shown). However, among biogenic amines, there were significant differences between terrier vs. non-terrier groups in both the UC and the control groups (Table 5). Of these, three (Taxifolin (up); 3-Hydroxykynurenine (down) and 4-Pyridoxic acid (down)) were differentially expressed in terriers compared to non-terrier groups in both the UC and controls, suggesting that these differences were inherent in terriers. However, six other metabolites were differentially expressed in the terrier group in the UC patients examined. Five were upregulated, including tryptamine, tropine, Homoarginine, Flunitrazepam, and N-Methylalanine, while 2-[(4-Aminobenzoyl)amino]acetic acid was down regulated (Figure 6A). In contrast to the terrier group, there were no UC-exclusive differences between those in the retriever and non-retriever groupings (Table S3).
Finally, we investigated whether the six metabolites that were distinctive in UC vs. controls were more discriminatory in terrier vs. retriever groups. Figure 6B demonstrates that, in terriers, of the 6 metabolites mentioned above, only sarcosine (log2FC = −2.62, adjusted p-value = 0.032) was highly discriminatory between UC and controls. In contrast, Figure 6C demonstrates that, in the retriever grouping, 5 of the 6 metabolites mentioned above, namely N-Acetylphenylalanine (log2FC = 1.799, adjusted p-value = 0.0047), N-acetyl-S-benzyl-L cysteine (log2FC = −4.468, adjusted p-value = 0.000293), Octanoylcarnitine (log2FC = −1.593, adjusted p-value = 0.041), sarcosine (log2FC = −2.99, adjusted p-value = 0.000355), NAMH (log2FC = −1.647, adjusted p-value = 0.00452), and hippuric acid (log2FC = −4.022, adjusted p-value = 5.25 × 10⁻⁵), were highly discriminatory. Thus, of the 6 metabolites, only sarcosine showed differential expression in both the terrier and retriever groups. Other metabolites differentially expressed between UC and controls in the terrier and retriever groups are listed in Tables S4 and S5, respectively. When all other breeds were considered, the differential expression of these five metabolites between UC and controls remained statistically significant (Table S5). These results demonstrate that while hippuric acid and NAMH, which were highly distinctive in both male and female dogs between UC and control groups, are discriminatory in the retriever breed grouping and in other breeds, they are not distinctive for the terrier group.

2.6. The Difference in These Metabolites Is Not Affected by Either NSAID or Antibiotic Use, or by Urethral Obstruction

Urethral obstruction was reported in 5 dogs with UC and 2 dogs with urolithiasis (Table 1). Comparison of these dogs in the urethral obstruction group identified 37 metabolites of which only 12 were unique to the urethral obstruction group, while 25 were common with the overall group identified in Table 2 (Table 6). This included all 6 metabolites identified in Figure 2 and Figure 3 as being discriminatory in UC vs. urolithiasis/UTI. Hence, we investigated whether these metabolites are differentially expressed between dogs with urethral obstruction (n = 5) vs. those with no urethral obstruction (n = 22) in the UC group only. This comparison yielded only stearic acid (log2FC = 4.24, adjusted p-value = 0.0067) and palmitic acid (logFC = 4.21, adjusted p-value = 0.0067) as being differentially expressed between the groups (not shown). Thus, both dogs with urethral obstruction and those with no urethral obstruction showed similar discriminatory behavior of the six selected metabolites—hence, urethral obstruction is unlikely to be the cause of the differences seen between the UC and urolithiasis/UTI groups observed in either Table 2 or Table 6. In contrast, nine other metabolites showed significant differential expression between UC vs. control only in subjects experiencing urethral obstruction (2,3-Dihydroxybenzoic acid B, D-Glucosamine, Haloperidol, Metanephrine, Palatinose, and four phospholipids), while four metabolites showed significant differential expression between UC vs. control only in subjects experiencing no urethral obstruction (2′-Deoxyadenosine, 3,4-Dihydroxyphenylglycol, Phenylacetylglycine and Riluzole) (Table 6).
Finally, we observed that in the dogs with UC, 7 received antibiotics and 12 received NSAIDs at the time of urine collection. Therefore, we investigated whether these factors affected the expression of the metabolites differentially expressed in Table 2. However, among those with UC, only piroxicam (the NSAID most commonly used in dogs with UC) was differentially expressed in the urine of those taking NSAID and those not taking an NSAID.
Among dogs with UC, although 13 metabolites were differentially expressed in those taking antibiotics and those not taking antibiotics (Table S6), none coincided with the list of metabolites differentially expressed between the UC and control groups. Because only one dog within the control group was on antibiotics at the time of urine collection, we could not compare metabolite expression between the UC and control groups within the antibiotic use group. Interestingly, most of the metabolites identified as differentially expressed in the antibiotics group, among the ones within the UC group, were identified as either bacterial products (vanillic acid, adipic acid) or food metabolites, perhaps as part of antibiotic administration. Therefore, the six discriminatory metabolites are not likely to be caused by treatment with antibiotics or NSAIDs. Similarly, analyses demonstrated that these changes are not affected by the presence of metastases or by the concurrent use of chemotherapy (data not shown). These results indicate that the six metabolites identified above may be truly inherent to the tumor and not affected by treatments or other conditions.

3. Discussion

Clinically, dogs with UC and those with urocystoliths or UTI present with very similar clinical signs, including stranguria, pollakiuria, and hematuria, as well as secondary bacterial infection [1], and it is often difficult to differentially diagnose between malignancy and other non-malignant diseases of the lower urinary tract. While a clinical test is available for the detection of UC in the urine, namely the BRAFV595E mutation analysis, this test was found to be more effective in terriers (73% carry the mutation), than in other breeds (36% carry the mutation) (p < 0.05) [22]. In the present study, we used urine from dogs of multiple breeds to determine whether subjects with UC may be distinguished from those with urocystoliths with or without UTI (combined in this study as the control group) prior to expensive imaging studies. We identify six metabolites (hippuric acid, N-Acetylphenylalanine, sarcosine, octanoylcarnitine, NAMH, glycerol-3-galactoside) in the urine of subjects with UC as compared to the control group. However, further analyses showed that not all six can be used in both female and male dogs; in fact, of the six, only two—hippuric acid and NAMH (both significantly downregulated in UC)—are able to distinguish between UC and controls in both males and females. Additionally, these two metabolites were distinctly different in UC vs. controls, mostly in retrievers and in all other breeds, whereas they were not discriminatory between the two groups in terriers. On the other hand, sarcosine discriminated between UC and controls in all breeds, but only in female dogs. We also determined that neither urethral obstruction, nor other factors such as spaying/neutering, or the use of antibiotics or NSAID, or the development of metastasis or chemotherapy, affected the expression of these six metabolites.
Hippuric acid is a prominent member of the phenylalanine metabolism pathway and is produced downstream of L-phenylalanine [23]. Urinary hippuric acid has been previously thought to be a harbinger of environmental toxic solvent exposures; however, recent data indicate that hippuric acid is excreted daily in the urine, even in the absence of organic solvent exposure [24]. Amino acid catabolism is a crucial component for cancer cell proliferation and progression, as it is involved in various processes such as nucleotide synthesis, lipogenesis, metastasis, epigenetic modifications, and evasion of tumor recognition by the immune system [25]. Phenylalanine is one of the essential amino acids, and the importance of phenylalanine metabolism has been identified in several human cancers, including colorectal cancer [26] and oral squamous cell [27] and non-small cell lung carcinoma, whereas phenylalanine restriction was associated with decreased tumor invasion in melanoma [28]. This study identified N-Acetylphenylalanine, an N-acetylated form of phenylalanine (Pubchem, [12]), to be significantly upregulated in the UC group, indicating a probable role of this metabolite in canine UC. On the other hand, hippuric acid, an intermediate of phenylalanine metabolism, was strongly downregulated in the UC group as compared to the control group. Hippuric acid has been shown to be significantly downregulated in the urine of human patients with non-muscle invasive [29,30] and, very recently, high-grade bladder cancer (BlCa) [31]. It is important to note that decreases in hippuric acid levels have also been seen in conjunction with aging [32], because dogs with UC were in general older than controls, although age and sex differences were accounted for in the biostatistical analysis described. Hippuric acid is also a major regulator of calcium oxalate lithiasis [33], the most common type of stones in urolithiasis, and high levels of hippuric acid was thought to dissolve calcium oxalate stones. Therefore, loss of hippuric acid in UC is not simply a case of lack of this metabolite in patients with stones. Loss of hippuric acid has also been associated with frailty and changes in gut microflora [32]—possibly due to lack of adequate nutrition associated with the onset of carcinoma. A major cause of concern is the lack of hippuric acid excretion, which could also indicate its accumulation in the kidney, or an inability to metabolize phenylalanine. Thus, we believe that loss of urinary hippuric acid would be a strong candidate for an indicator of UC development in dogs.
The glycine, serine, and threonine metabolic pathway was also found to be significantly upregulated in the urine of dogs with UC vs. the control group. Glycine is used for the biosynthesis of glutathione, the main antioxidant used to scavenge reactive-oxygen species (ROS) produced by cancer cells and maintain redox homeostasis. Serine also contributes to ROS elimination, either by direct conversion to glycine by the enzyme serine hydroxymethyltransferase or by fueling the folate cycle with the side production of NADPH [25,34]. Sarcosine (also called N-methyl-glycine) is a methylated form of glycine, and threonine can be also be converted to glycine. Threonine was significantly upregulated in UC compared to controls (FC = 1.8; adjusted p-value = 0.0378), while sarcosine was downregulated (FC = −3.34; adjusted p-value = 0.0001), indicating the accumulation of threonine in UC patients that is not converted to glycine. However, of the two, only loss of sarcosine showed a sufficient discriminatory ability to discriminate between the two conditions (AUC = 0.95) and was included in the final panel of six metabolites. It is important to note that of all the metabolites, sarcosine was the only one that showed discriminatory properties in all dog breeds; however, its discrimination ability is only confined to female dogs. Increased sarcosine urinary levels in humans with prostate cancer have the potential as a diagnostic biomarker [35]. It is curious as to why sarcosine is not discriminatory between UC and controls in males as well—although it is downregulated in UC in males as well as in females. Similar to hippuric acid, sarcosine is also downregulated with age in humans, and increases with dietary restrictions [36]. It is to be noted that sarcosine is an ingredient of toothpaste and is thought to fight cavities, and is also used for treating mental health disorders, including schizophrenia and depression [37]. Similar to glycine, sarcosine also activates the N-methyl-D-aspartate (NMDA) receptor and blocks the GlyT1 (type 1 glycine) transporter. Significantly, the efficacy of sarcosine was enhanced in female schizophrenic patients compared to males [38], suggesting a female-specific mechanism.
The other significant metabolite downregulated in UC is NAMH, a histamine agonist selective for the receptor subtype H3 that lowers blood pressure and heart rate. NAMH is reportedly promoted in Helicobacter pylori-infected human gastric mucosa, and was suggested to act directly on histamine H(2) receptors (H2Rs) as well as to stimulate acid secretion [39]. It is also used to treat migraines in humans [40]. NAMH has previously been shown to play a role in bladder cancer. In a study of non-muscle invasive bladder cancer (NMIBC) in human patients, a disease not usually seen in dogs, urinary NAMH levels were seen to increase with treatment with intravesical Bacillus Calmette-Guérin (BCG), the most effective therapy for high-grade NMIBC, and decrease when the treatment was attenuated [41]. Further, urinary NAMH levels increased after BCG immunotherapy in patients who responded, compared to those who did not respond [41]. While most canine UC is muscle invasive, the above adds further evidence that urinary NAMH levels are low in untreated bladder cancer.
Of the three other metabolites that were found to be discriminatory between UC and control when all animals were considered, N-Acetyl-S-benzyl-L-cysteine (Benzylmercapturic acid) is a metabolite of toluene that is used in the diagnosis of toluene exposure. Toluene has been proposed as a marker of UTI that can be used by an electronic nose for diagnosis of this disease [42]; hence it is likely increased in UTI and not decreased in UC. Next, lipid remodeling is one of the hallmarks of cancer, and lipids have been recognized to regulate multiple other hallmarks of cancer as well, by providing the energy required to sustain tumor proliferation, migration, and invasion while evading cell death by immune recognition, tumor suppressors, or apoptotic mechanisms [43]. Even though lipids can be obtained either from the diet or be synthesized by other substrates, cancer cells largely rely on de novo fatty acid synthesis [44]. The Glycerolipid/Free Fatty acid (GL/FFA) cycle, the interface between synthesis of GL from FFA and glycerol and GL hydrolysis for the production of FFA, plays an important role in cancer, especially during cancer-associated cachexia (e.g., a state of nutrient deprivation) [45]. Glycerol-3-galactoside, a possible metabolite of glycerolipid synthesis, was increased in UC versus the control group, probably indicating a role for this pathway in canine UC. Finally, octanoylcarnitine forms when carnitine is covalently linked with the medium-chain fatty acid, octanoic acid [46], and can be oxidized through mitochondrial β-oxidation for the production of acetyl-coA [47]. Acetyl-coA can then be used for the production of FFA, fueling the TCA cycle [48] or for epigenetic modifications through the addition of acetyl groups [6]. Octanoylcarnitine was significantly downregulated in dogs with UC as compared with the control group, as has been shown in the blood of women with breast cancer [49], potentially indicating the increased demand of this metabolites in tumor cells. Other fatty acyls that were differentially expressed in UC vs. control included 6-hydroxycaproic acid and 3-hydroxysebacic acid, but these metabolites lacked sufficient discriminatory power to distinguish between the two groups.
One of the most important results of this study is that while all six metabolites, except glycerol-3-galactoside, were discriminatory in the retriever group and in other breeds, only sarcosine was discriminatory in the terrier group. This is important because the BRAFV595E mutation is more prevalent in terriers with UC than in other breeds with UC. Therefore, it is important to identify other putative agents that in the future can be developed into markers of UC in other breeds, perhaps in combination with BRAF. It is obvious from the results that terriers are different from other breeds, not only with respect to the presence of the BRAF mutation in UC, but also in other respects—such as the inability of 5 of the 6 metabolites to discriminate between UC and controls in these breeds.
As mentioned above, all 6 metabolites were differentially present in the retriever breed grouping with UC vs. controls, but only one (sarcosine) was discriminatory in terriers. However, the term “terrier” represents a group of breeds that are somewhat heterogeneous. Furthermore, only hippuric acid and NAMH were statistically significant when we stratified the analysis to females and males. This could be related to the smaller sample size when we stratified the samples for the different comparisons. Thus, hippuric acid and NAMH can be tested further as markers of UC in both male and female dogs of various species, including retriever breeds, but is not likely to be discriminating in terrier breeds. Further studies should be conducted in a larger cohort of dogs of multiple breeds of both sexes, to further characterize potential breed-related and sex-related differences in biomarker expression and UC pathophysiology. A limitation of the current study is that the results from the discovery cohort were used to construct the ROC curves. The use of additional cohorts to test the markers identified will correct this drawback.

4. Materials and Methods

4.1. Urine Collection and Handling

Urine collection was approved by UC Davis Institutional Animal Care and Use Committee (IACUC) and clinical trials review boards, under the protocol # 20416. All dogs participating in the study were privately owned, screened, and recruited at the UC Davis Veterinary Medical Teaching Hospital (VMTH) between 2011 and 2020, with informed owner consent. A sample of 1 mL of urine was collected from patients with confirmed UC (n = 27), urolithiasis (n = 8), or UTI + urolithiasis (n = 8). Inclusion criteria for dogs with UC were defined as the presence of naturally occurring UC of the urinary bladder and/or urethra that had been previously confirmed through histopathology or cytologically by a board-certified veterinary pathologist and retrieved from the medical records of the patient. Exclusion criteria included lack of definite diagnosis of UC, incomplete medical history, and presence of another malignancy of the urinary tract. Inclusion criteria for the control group included the confirmation of urolithiasis through urinalysis and UTI by bacterial culture (urolithiasis and UTI group) or urolithiasis with a negative urinary culture (urolithiasis group). Exclusion criteria included the presence of a malignancy of the urinary tract. For all dogs, age, weight, breed, castration status, and medical history were recorded. Urine samples were centrifuged (5 min, 3000 RPM, 4 °C), the supernatant was collected, filtered through a 0.22 μm filter (Millipore Sigma SLGVM33RS Medical Millex® GV Sterile Syringe Filter, Merck, Temecula, CA, USA), and stored at −80 °C until further analysis.

4.2. Urinary Creatinine Levels

Ten microliters of urine was used to assess urinary creatinine levels using the Creatinine Parameter Assay Kit (R&D Systems, cat.# KGE005), according to manufacturer’s instructions. Curve expert Professional software (v2.6.5) was used for the generation of standard curves and calculation of creatinine levels.

4.3. Metabolomic Analyses

For the initial metabolomic analysis, urine samples were normalized to creatinine levels, and 0.5 mL of urine from each dog was submitted to the West Coast Metabolomics Center, UC Davis [50,51]. The samples were spiked with a recovery standard cocktail, extracted in methanol, and dried under vacuum to remove organic solvents. The extracts were separated into three fractions and characterized using three independent platforms, as described below. The reproducibility of the extraction protocol was assessed by the recovery of the xenobiotic compounds spiked in every urine sample prior to extraction:
  • Primary metabolites: Using derivatization and GC-TOF MS, primary metabolites such as amino acids, sugars, and hydroxyl acids were profiled. The BinBase database used has over 1200 primary metabolites and the ability to annotate unknown metabolites [52].
  • Complex lipids: >350 lipids covering 12 lipid classes (e.g., ceramides, cholesteryl esters, free fatty acids, phosphatidyl-cholines, -serines and -ethanolamines, lysophospholipids, sphingomyelins, and triacylglycerols) were quantified from an acetonitrile/isopropanol gradient on a charged surface hybrid (CSH) LC column and positive and negative electrospray ionization QTOF MS. The LipidBLAST library has 200,000 MS/MS lipid spectra.
  • Secondary and charged metabolites: Charged, complex hydrophilic compounds such as cholines, nucleotides, nucleosides, methylated, and acetylated amines were measured using HILC QTOF MS; >100 secondary compounds were screened using the standards on this platform. Exposomes, such as metabolites from pharmaceutical drugs, were detected through untargeted analysis.
Data from all three platforms were integrated in a single report to provide an overview of the metabolic status of each dog.

4.4. Statistical Analyses

R package limma v.3.46.0 was used for the statistical analyses of the metabolomics raw data in this study, incorporating variance weights from the limma function vooma. Analyses were adjusted for age and sex by including these as covariates in models. For the assessment of differentially expressed metabolites between the groups, data were log2 transformed and normalized using cyclic loess normalization. Metabolites were considered statistically significant when the adjusted p-value was ≤0.05 and log2fold change was ≥1.5 or ≤−1.5. Heatmapper [53] was used to generate a heatmap of differentially expressed metabolites, using Complete Linkage as the clustering method with Spearman Rank correlation as a distance measurement method. Pathway and Enrichment analyses were performed using MetaboAnalyst [54] 5.0 using the Homo sapiens Kyoto Encyclopedia of Genes and Genomes (KEGG) metabolic pathway database. The hypergeometric test was used as an Over-Representation Analysis, and relative betweenness centrality was the measure for Pathway Topology Analysis. GraphPad Prism v9.2.0 was used to construct box plots, volcano plots, and receiver operating statistics (ROC) curves for in-sample predictions. The Human Metabolome Database [55] was used to delineate the function of various metabolites.

Supplementary Materials

The following supporting information can be downloaded a: https://www.mdpi.com/article/10.3390/metabo12030200/s1, Figure S1: KEGG Pathway Analysis in canine UC (n = 27) as compared to the control group (n = 16) based on 1123 known metabolites identified as differentially expressed between urothelial carcinoma and the control group, Figure S2: Box plots showing the differential expression of components of the Valine, leucine and isoleucine biosynthesis pathway, Figure S3: Box plots showing the differential expression of components of various pathways, Figure S4: ROC curves for the metabolites shown in Supplementary Figure S3, Table S1: Functional and pathway analysis of metabolites that are differentially expressed between Urothelial Carcinoma and Control groups, after adjusting for age and sex, Table S2: Comparison of primary metabolites and biological amines from the urine of male and female dogs that show significant differences in the Urothelial Carcinoma vs. Control arms, Table S3: Differences in metabolites from the urine of retriever vs. non-retriever in the Urothelial Carcinoma and Control arms, Table S4: Comparison of primary metabolites and biological amines from the urine of terriers only that show significant differences in the Urothelial Carcinoma (UC) vs. Control arms, Table S5: Comparison of primary metabolites and biological amines from the urine of retrievers only that show significant differences in the Urothelial Carcinoma (UC) vs. Control arms, Table S6: Comparison of primary metabolites and biological amines from the urine of dogs with Urothelial Carcinoma who had been exposed to antibiotics prior to urine collection vs. those who had not.

Author Contributions

Conceptualization and methodology, M.M.T. and P.M.G.; resources, W.T.N.C. and C.A.P.; validation, M.M.T.; formal analysis, B.P.D.-J.; data curation, B.P.D.-J., M.M.T. and P.M.G.; writing—original draft preparation, M.M.T.; writing—review and editing, M.M.T., B.P.D.-J., W.T.N.C., C.A.P., M.P., M.S.K. and P.M.G.; supervision, M.S.K. and P.M.G.; project administration, P.M.G.; funding acquisition, M.M.T., M.P. and P.M.G. All authors have read and agreed to the published version of the manuscript.

Funding

This research was funded by Maxine Adler and Lodric Maddox Graduate Student Fellowship Awards, UC Davis School of Veterinary Medicine (MMT), and by grants from the University of California Comprehensive Cancer Center (UCDCCC) (the UC Davis Comprehensive Cancer Center Support Grant awarded by the National Cancer Institute (NCI P30CA093373)) (M.P., P.M.G.).

Institutional Review Board Statement

The animal study protocol was approved by the Institutional Animal Care and Use Committee of the University of California at Davis (protocol # 20416).

Informed Consent Statement

Informed consent was obtained from the owners of all subjects involved in the study.

Data Availability Statement

All relevant available data is presented in Supplementary Materials.

Acknowledgments

The contents reported/presented within do not represent the views of the Department of Veterans Affairs or the United States Government. The authors are grateful to the technicians at the West Coast Metabolomics Center for the conduct of the metabolomics analysis.

Conflicts of Interest

The authors declare no conflict of interest. The funders had no role in the design of the study; in the collection, analyses, or interpretation of data; in the writing of the manuscript; or in the decision to publish the results.

References

  1. Fulkerson, C.M.; Knapp, D.W. Management of Transitional Cell Carcinoma of the Urinary Bladder in Dogs: A Review. Vet. J. 2015, 205, 217–225. [Google Scholar] [CrossRef] [PubMed]
  2. Aupperle-Lellbach, H.; Grassinger, J.; Hohloch, C.; Kehl, A.; Pantke, P. Diagnostic value of the BRAF variant V595E in urine samples, smears and biopsies from canine transitional cell carcinoma. Tierarztl. Prax. Ausg. K Kleintiere Heimtiere 2018, 46, 289–295. [Google Scholar] [CrossRef] [PubMed]
  3. Mochizuki, H.; Shapiro, S.G.; Breen, M. Detection of BRAF Mutation in Urine DNA as a Molecular Diagnostic for Canine Urothelial and Prostatic Carcinoma. PLoS ONE 2015, 10, e0144170. [Google Scholar] [CrossRef] [PubMed]
  4. Kent, M.S.; Zwingenberger, A.; Westropp, J.L.; Barrett, L.E.; Durbin-Johnson, B.P.; Ghosh, P.; Vinall, R.L. MicroRNA Profiling of Dogs with Transitional Cell Carcinoma of the Bladder Using Blood and Urine Samples. BMC Vet. Res. 2017, 13, 339. [Google Scholar] [CrossRef] [PubMed] [Green Version]
  5. Zhang, J.; Wei, S.; Liu, L.; Nagana Gowda, G.A.; Bonney, P.; Stewart, J.; Knapp, D.W.; Raftery, D. NMR-Based Metabolomics Study of Canine Bladder Cancer. Biochim. Biophys. Acta 2012, 1822, 1807–1814. [Google Scholar] [CrossRef] [PubMed] [Green Version]
  6. Pavlova, N.N.; Thompson, C.B. The Emerging Hallmarks of Cancer Metabolism. Cell Metab. 2016, 23, 27–47. [Google Scholar] [CrossRef] [PubMed] [Green Version]
  7. Fiehn, O. Metabolomics—The Link between Genotypes and Phenotypes. Plant Mol. Biol. 2002, 48, 155–171. [Google Scholar] [CrossRef]
  8. Schmidt, D.R.; Patel, R.; Kirsch, D.G.; Lewis, C.A.; Vander Heiden, M.G.; Locasale, J.W. Metabolomics in Cancer Research and Emerging Applications in Clinical Oncology. Cancer J. Clin. 2021, 71, 333–358. [Google Scholar] [CrossRef]
  9. Dill, A.L.; Ifa, D.R.; Manicke, N.E.; Costa, A.B.; Ramos-Vara, J.A.; Knapp, D.W.; Cooks, R.G. Lipid Profiles of Canine Invasive Transitional Cell Carcinoma of the Urinary Bladder and Adjacent Normal Tissue by Desorption Electrospray Ionization Imaging Mass Spectrometry. Anal. Chem. 2009, 81, 8758–8764. [Google Scholar] [CrossRef] [Green Version]
  10. D’Hue, C.A.; Dhawan, D.; Peat, T.; Ramos-Vara, J.; Jarmusch, A.; Knapp, D.W.; Cooks, R.G. Fatty Acid Patterns Detected By Ambient Ionization Mass Spectrometry in Canine Invasive Urothelial Carcinoma From Dogs of Different Breeds. Bladder Cancer 2018, 4, 283–291. [Google Scholar] [CrossRef] [Green Version]
  11. Rosenwasser, L.J.; O’Brien, T.; Weyne, J. Mast Cell Stabilization and Anti-Histamine Effects of Olopatadine Ophthalmic Solution: A Review of Pre-Clinical and Clinical Research. Curr. Med. Res. Opin. 2005, 21, 1377–1387. [Google Scholar] [CrossRef] [PubMed]
  12. Kim, S.; Chen, J.; Cheng, T.; Gindulyte, A.; He, J.; He, S.; Li, Q.; Shoemaker, B.A.; Thiessen, P.A.; Yu, B.; et al. PubChem in 2021: New Data Content and Improved Web Interfaces. Nucleic Acids Res. 2021, 49, D1388–D1395. [Google Scholar] [CrossRef] [PubMed]
  13. Sunil, C.; Xu, B. An Insight into the Health-Promoting Effects of Taxifolin (Dihydroquercetin). Phytochemistry 2019, 166, 112066. [Google Scholar] [CrossRef] [PubMed]
  14. Mitchelson, F.; Lanzafame, A.; Christopoulos, A. The Interaction of Otenzepad (AF-DX 116) with Allosteric Modulators and Competitive Antagonists at a Muscarinic M2 Receptor. Life Sci. 1999, 64, 559. [Google Scholar] [CrossRef]
  15. McNeely, W.; Goa, K.L. 5-Methoxypsoralen. A Review of Its Effects in Psoriasis and Vitiligo. Drugs 1998, 56, 667–690. [Google Scholar] [CrossRef]
  16. Balkrishna, A.; Thakur, P.; Varshney, A. Phytochemical Profile, Pharmacological Attributes and Medicinal Properties of Convolvulus Prostratus—A Cognitive Enhancer Herb for the Management of Neurodegenerative Etiologies. Front. Pharm. 2020, 11, 171. [Google Scholar] [CrossRef] [Green Version]
  17. Xie, J.T.; Yuan, C.S.; Zhou, Z.; January, C.T. Enhancement of Delayed Afterdepolarizations and Triggered Activity by Class III Antiarrhythmic Drugs: Multiple Effects of E-4031 and Dofetilide. Methods Find Exp. Clin. Pharm. 2000, 22, 67–76. [Google Scholar] [CrossRef]
  18. Miller, R.G.; Mitchell, J.D.; Moore, D.H. Riluzole for Amyotrophic Lateral Sclerosis (ALS)/Motor Neuron Disease (MND). Cochrane Database Syst. Rev. 2012, 65, CD001447. [Google Scholar] [CrossRef]
  19. Andrews, P. Cocaethylene Toxicity. J. Addict. Dis. 1997, 16, 75–84. [Google Scholar] [CrossRef]
  20. Druid, H.; Holmgren, P.; Ahlner, J. Flunitrazepam: An Evaluation of Use, Abuse and Toxicity. Forensic Sci. Int. 2001, 122, 136–141. [Google Scholar] [CrossRef]
  21. Knapp, D.W.; Ramos-Vara, J.A.; Moore, G.E.; Dhawan, D.; Bonney, P.L.; Young, K.E. Urinary Bladder Cancer in Dogs, a Naturally Occurring Model for Cancer Biology and Drug Development. ILAR J. 2014, 55, 100–118. [Google Scholar] [CrossRef] [PubMed]
  22. Grassinger, J.M.; Merz, S.; Aupperle-Lellbach, H.; Erhard, H.; Klopfleisch, R. Correlation of BRAF Variant V595E, Breed, Histological Grade and Cyclooxygenase-2 Expression in Canine Transitional Cell Carcinomas. Vet. Sci. 2019, 6, 31. [Google Scholar] [CrossRef] [PubMed] [Green Version]
  23. Drug-Induced Phospholipidosis-Pathological Aspects and Its Prediction. Available online: https://www.jstage.jst.go.jp/article/tox/21/1/21_1_9/_article/-char/ja/ (accessed on 9 January 2022).
  24. Pero, R.W. Health Consequences of Catabolic Synthesis of Hippuric Acid in Humans. Curr. Clin. Pharm. 2010, 5, 67–73. [Google Scholar] [CrossRef] [PubMed] [Green Version]
  25. Lieu, E.L.; Nguyen, T.; Rhyne, S.; Kim, J. Amino Acids in Cancer. Exp. Mol. Med. 2020, 52, 15–30. [Google Scholar] [CrossRef] [PubMed]
  26. Cai, Y.; Rattray, N.J.W.; Zhang, Q.; Mironova, V.; Santos-Neto, A.; Muca, E.; Vollmar, A.K.R.; Hsu, K.-S.; Rattray, Z.; Cross, J.R.; et al. Tumor Tissue-Specific Biomarkers of Colorectal Cancer by Anatomic Location and Stage. Metabolites 2020, 10, 257. [Google Scholar] [CrossRef] [PubMed]
  27. Tsai, C.-K.; Lin, C.-Y.; Kang, C.-J.; Liao, C.-T.; Wang, W.-L.; Chiang, M.-H.; Yen, T.-C.; Lin, G. Nuclear Magnetic Resonance Metabolomics Biomarkers for Identifying High Risk Patients with Extranodal Extension in Oral Squamous Cell Carcinoma. J. Clin. Med. 2020, 9, E951. [Google Scholar] [CrossRef] [Green Version]
  28. Pelayo, B.A.; Fu, Y.-M.; Meadows, G.G. Decreased Tissue Plasminogen Activator and Increased Plasminogen Activator Inhibitors and Increased Activator Protein-1 and Specific Promoter 1 Are Associated with Inhibition of Invasion in Human A375 Melanoma Deprived of Tyrosine and Phenylalanine. Int. J. Oncol. 2001, 18, 877–883. [Google Scholar] [CrossRef]
  29. Loras, A.; Martínez-Bisbal, M.C.; Quintás, G.; Gil, S.; Martínez-Máñez, R.; Ruiz-Cerdá, J.L. Urinary Metabolic Signatures Detect Recurrences in Non-Muscle Invasive Bladder Cancer. Cancers 2019, 11, 914. [Google Scholar] [CrossRef] [Green Version]
  30. Loras, A.; Trassierra, M.; Sanjuan-Herráez, D.; Martínez-Bisbal, M.C.; Castell, J.V.; Quintás, G.; Ruiz-Cerdá, J.L. Bladder Cancer Recurrence Surveillance by Urine Metabolomics Analysis. Sci. Rep. 2018, 8, 9172. [Google Scholar] [CrossRef] [Green Version]
  31. Łuczykowski, K.; Warmuzińska, N.; Operacz, S.; Stryjak, I.; Bogusiewicz, J.; Jacyna, J.; Wawrzyniak, R.; Struck-Lewicka, W.; Markuszewski, M.J.; Bojko, B. Metabolic Evaluation of Urine from Patients Diagnosed with High Grade (HG) Bladder Cancer by SPME-LC-MS Method. Molecules 2021, 26, 2194. [Google Scholar] [CrossRef]
  32. De Simone, G.; Balducci, C.; Forloni, G.; Pastorelli, R.; Brunelli, L. Hippuric Acid: Could Became a Barometer for Frailty and Geriatric Syndromes? Ageing Res. Rev. 2021, 72, 101466. [Google Scholar] [CrossRef] [PubMed]
  33. Atanassova, S.S.; Gutzow, I.S. Hippuric Acid as a Significant Regulator of Supersaturation in Calcium Oxalate Lithiasis: The Physiological Evidence. BioMed Res. Int. 2013, 2013, 374950. [Google Scholar] [CrossRef] [PubMed] [Green Version]
  34. Amelio, I.; Cutruzzolá, F.; Antonov, A.; Agostini, M.; Melino, G. Serine and Glycine Metabolism in Cancer. Trends Biochem. Sci. 2014, 39, 191–198. [Google Scholar] [CrossRef] [PubMed]
  35. Sreekumar, A.; Poisson, L.M.; Rajendiran, T.M.; Khan, A.P.; Cao, Q.; Yu, J.; Laxman, B.; Mehra, R.; Lonigro, R.J.; Li, Y.; et al. Metabolomic Profiles Delineate Potential Role for Sarcosine in Prostate Cancer Progression. Nature 2009, 457, 910–914. [Google Scholar] [CrossRef] [Green Version]
  36. Walters, R.O.; Arias, E.; Diaz, A.; Burgos, E.S.; Guan, F.; Tiano, S.; Mao, K.; Green, C.L.; Qiu, Y.; Shah, H.; et al. Sarcosine Is Uniquely Modulated by Aging and Dietary Restriction in Rodents and Humans. Cell Rep. 2018, 25, 663–676.e6. [Google Scholar] [CrossRef] [Green Version]
  37. Hashimoto, K. Targeting of NMDA Receptors in New Treatments for Schizophrenia. Expert Opin. Ther. Targets 2014, 18, 1049–1063. [Google Scholar] [CrossRef]
  38. Efficacy and Cognitive Effect of Sarcosine (N-Methylglycine) in Patients with Schizophrenia: A Systematic Review and Meta-Analysis of Double-Blind Randomised Controlled Trials. Available online: https://pubmed.ncbi.nlm.nih.gov/32122256/ (accessed on 9 January 2022).
  39. Saitoh, T.; Fukushima, Y.; Otsuka, H.; Ishikawa, M.; Tamai, M.; Takahashi, H.; Mori, H.; Asano, T.; Anai, M.; Ishikawa, T.; et al. Effects of N-Alpha-Methyl-Histamine on Human H(2) Receptors Expressed in CHO Cells. Gut 2002, 50, 786–789. [Google Scholar] [CrossRef] [Green Version]
  40. Millán-Guerrero, R.O.; Isais-Millán, R.; Guzmán-Chávez, B.; Castillo-Varela, G. N Alpha Methyl Histamine versus Propranolol in Migraine Prophylaxis. Can. J. Neurol. Sci. 2014, 41, 233–238. [Google Scholar] [CrossRef] [Green Version]
  41. Simsekoglu, M.F.; Kaleler, I.; Onal, B.; Demirdag, C.; Citgez, S.; Uslu, E.; Erozenci, A.; Talat, Z. Do Urinary Mast Cell Mediators Predict Immune Response to BCG in Patients with Primary High-Grade Non-Muscle Invasive Bladder Cancer? Int. J. Clin. Pract. 2021, 75, e13959. [Google Scholar] [CrossRef]
  42. Dospinescu, V.-M.; Tiele, A.; Covington, J.A. Sniffing Out Urinary Tract Infection—Diagnosis Based on Volatile Organic Compounds and Smell Profile. Biosensors 2020, 10, 83. [Google Scholar] [CrossRef]
  43. Molendijk, J.; Robinson, H.; Djuric, Z.; Hill, M.M. Lipid Mechanisms in Hallmarks of Cancer. Mol. Omics 2020, 16, 6–18. [Google Scholar] [CrossRef] [PubMed]
  44. Mounier, C.; Bouraoui, L.; Rassart, E. Lipogenesis in Cancer Progression (Review). Int. J. Oncol. 2014, 45, 485–492. [Google Scholar] [CrossRef] [PubMed] [Green Version]
  45. Prentki, M.; Madiraju, S.R.M. Glycerolipid Metabolism and Signaling in Health and Disease. Endocr. Rev. 2008, 29, 647–676. [Google Scholar] [CrossRef] [Green Version]
  46. Octanoylcarnitine—Bioblast. Available online: https://www.mitofit.org/index.php/Octanoylcarnitine (accessed on 21 November 2021).
  47. Schönfeld, P.; Wojtczak, L. Short- and Medium-Chain Fatty Acids in Energy Metabolism: The Cellular Perspective. J. Lipid. Res. 2016, 57, 943–954. [Google Scholar] [CrossRef] [PubMed] [Green Version]
  48. Currie, E.; Schulze, A.; Zechner, R.; Walther, T.C.; Farese, R.V. Cellular Fatty Acid Metabolism and Cancer. Cell Metab. 2013, 18, 153–161. [Google Scholar] [CrossRef] [Green Version]
  49. Park, J.; Shin, Y.; Kim, T.H.; Kim, D.-H.; Lee, A. Plasma Metabolites as Possible Biomarkers for Diagnosis of Breast Cancer. PLoS ONE 2019, 14, e0225129. [Google Scholar] [CrossRef]
  50. Kind, T.; Cho, E.; Park, T.D.; Deng, N.; Liu, Z.; Lee, T.; Fiehn, O.; Kim, J. Interstitial Cystitis-Associated Urinary Metabolites Identified by Mass-Spectrometry Based Metabolomics Analysis. Sci. Rep. 2016, 6, 39227. [Google Scholar] [CrossRef] [Green Version]
  51. Wittmann, B.M.; Stirdivant, S.M.; Mitchell, M.W.; Wulff, J.E.; McDunn, J.E.; Li, Z.; Dennis-Barrie, A.; Neri, B.P.; Milburn, M.V.; Lotan, Y.; et al. Bladder Cancer Biomarker Discovery Using Global Metabolomic Profiling of Urine. PLoS ONE 2014, 9, e115870. [Google Scholar] [CrossRef]
  52. Kind, T.; Wohlgemuth, G.; Lee, D.Y.; Lu, Y.; Palazoglu, M.; Shahbaz, S.; Fiehn, O. FiehnLib: Mass Spectral and Retention Index Libraries for Metabolomics Based on Quadrupole and Time-of-Flight Gas Chromatography/Mass Spectrometry. Anal. Chem. 2009, 81, 10038–10048. [Google Scholar] [CrossRef] [Green Version]
  53. Babicki, S.; Arndt, D.; Marcu, A.; Liang, Y.; Grant, J.R.; Maciejewski, A.; Wishart, D.S. Heatmapper: Web-Enabled Heat Mapping for All. Nucleic Acids Res. 2016, 44, W147–W153. [Google Scholar] [CrossRef]
  54. Pang, Z.; Chong, J.; Zhou, G.; de Lima Morais, D.A.; Chang, L.; Barrette, M.; Gauthier, C.; Jacques, P.-É.; Li, S.; Xia, J. MetaboAnalyst 5.0: Narrowing the Gap between Raw Spectra and Functional Insights. Nucleic Acids Res. 2021, 49, W388–W396. [Google Scholar] [CrossRef] [PubMed]
  55. Wishart, D.S.; Feunang, Y.D.; Marcu, A.; Guo, A.C.; Liang, K.; Vázquez-Fresno, R.; Sajed, T.; Johnson, D.; Li, C.; Karu, N.; et al. HMDB 4.0: The Human Metabolome Database for 2018. Nucleic Acids Res. 2018, 46, D608–D617. [Google Scholar] [CrossRef] [PubMed]
Figure 1. Identification of 17 metabolites differentially expressed between urine of dogs with UC vs. control. (A) Nested Venn Diagram depicting the different types of metabolites identified as differentially expressed between the urine of dogs with urothelial carcinoma and control dogs. (B) Volcano plot depicting differentially expressed metabolites between UC and control groups. Red stars represent significantly downregulated metabolites (logFC ≤ −1.5 and adjusted p-value < 0.05) whereas green stars represent significantly upregulated metabolites (logFC ≥ 1.5 and adjusted p-value < 0.05). (C) Heatmap showing 17 differentially expressed metabolites in UC (right) vs. control (left) groups. These represent the final 17 metabolites after those related to treatment were removed. Complete Linkage was used as the clustering method with Spearman Rank correlation as a distance measurement method.
Metabolites 12 00200 g001
Figure 2. Pathway analysis revealing differentially expressed pathways between urine of dogs with UC vs. control. (A) KEGG Pathway Analysis in canine UC as compared to the control group based on the 27 initial metabolites identified as differentially expressed between UC and controls. The color intensity indicates the p–value (indicated in inset), whereas the size of each circle indicates the number of metabolites included in the pathway. (B) Box plots showing the differential expression of components of the phenylalanine metabolism pathway (N-Acetylphenylalanine (Afalanine); Hippuric Acid) and the Glycine, Serine, and Threonine Metabolism pathways (sarcosine). All p–values are adjusted p-values. (C) ROC curves for the above metabolites. Area under the ROC curve (AUC) is calculated as % sensitivity vs. 100-% specificity. AUC > 0.85 is highly discriminatory.
Metabolites 12 00200 g002
Figure 3. Three additional metabolites, not in the above pathways, were also differentially expressed, and could distinguish between UC and control. (A) Box plots showing the differential expression of additional metabolites significantly different between UC and controls of which three are downregulated (N-Acetyl-S-benzyl-L-cysteine, N-alpha-methylhistamine, and Octanoylcarnitine) and two are upregulated (3,4-Dihydroxyphenylglycol and glycerol-3-galactoside). Related pathways are listed below the plot. (B) ROC curves for the above metabolites. Area under the ROC curve (AUC) is calculated as sensitivity percentage vs. 100-specificity percentage. AUC > 0.85 is considered to be highly discriminatory. Thus, only three of the five metabolites were considered highly discriminatory (Octanoylcarnitine, N-alpha-methylhistamine, and glycerol-3-galactoside).
Metabolites 12 00200 g003
Figure 4. (A) Venn diagram demonstrating differentially expressed urine metabolites in UC vs. controls among male and female dogs. Differentially expressed metabolites in each group are outlined in the inset accompanying each group. (B) KEGG Pathway Analysis in canine UC as compared to the control group in female dogs only. The color intensity indicates the p-value (indicated in inset), whereas the size of each circle indicates the number of metabolites included in the pathway. (C) KEGG Pathway Analysis in canine UC as compared to the control group in male dogs only. The color intensity indicates the p-value (indicated in inset), whereas the size of each circle indicates the number of metabolites included in the pathway.
Metabolites 12 00200 g004
Figure 5. Comparison of the expression of specific metabolites in male and female dogs with UC vs. controls. (A) Box plots showing the differential expression of four metabolites significantly different between UC vs. control (hippuric acid, N-Acetyl-S-benzyl-L-cysteine, N-alpha-methylhistamine, and sarcosine) in female dogs. The lower level shows ROC curves for the above metabolites. Only three of the four metabolites were considered highly discriminatory (hippuric acid, N-Acetyl-S-benzyl-L-cysteine, N-alpha-methylhistamine) (AUC > 0.85). (B) Box plots showing the differential expression of four metabolites significantly different between UC vs. control in male dogs. The lower level shows ROC curves for the above metabolites. Only two of the four metabolites were considered highly discriminatory (hippuric acid, N-alpha-methylhistamine) (AUC > 0.85).
Metabolites 12 00200 g005
Figure 6. Breed specific differences between UC vs. control. (A) Venn diagram demonstrating differentially expressed metabolites in terrier breeds vs. all other breeds among dogs with UC only and comparing it with differentially expressed metabolites in terriers and all other breeds among control dogs. Differentially expressed metabolites in each group are outlined in the inset accompanying each group. (B) Differential expression between UC vs. control of the six metabolites in terrier breeds only. Note that, of the six metabolites deemed highly discriminatory in Figure 2 and Figure 3 (highlighted in bold), only sarcosine was differentially expressed in terrier breeds. (C) Differential expression between UC and controls of the six metabolites in retriever breeds only. Note that, of the six metabolites deemed highly discriminatory in Figure 2 and Figure 3, five were differentially expressed in retriever breeds. Glycerol-3-galactoside was not differentially expressed in either terrier breeds or in retriever breed groupings.
Metabolites 12 00200 g006
Table 1. Subject characteristics by group. All comparisons shown are between Urinary Carcinoma (UC) (n = 27) and controls (urolithiasis n = 8, Urinary Tract Infection (UTI) + urolithiasis, n = 8). Age is significantly different between groups (p < 0.001), with an older mean age in the UC group compared to the other two groups. The distribution of sexes also differs significantly between groups (p = 0.00921), with only male dogs in this study having urolithiasis.
UC (n = 27)Urolithiasis Only (n = 8)UTI and Urolithiasis (n = 8)All Subjects (n = 43)p-Value
Age <0.001
Mean (SD)10.9 (1.9)7.2 (3.9)6.2 (4.6)9.3 (3.5)
Median (Range)11 (6–14)6.5 (1–13)7 (0.3–12)10 (0.3–14)
Gender 0.00921
Female15 (55.6%)05 (62.5%)20 (46.5%)
Male12 (44.4%)8 (100%)3 (37.5%)23 (53.5%)
Breed
Terrier5 (18.5%)4 (50%)3 (37.5%)12 (27.9%)0.20218
Shepherd5 (18.5%)005 (11.6%)0.34365
Retriever5 (18.5%)01 (12.5%)6 (14%)0.60082
Others12 (44.4%)4 (50%)4 (50%)20 (46.5%)
Conditions
Castrated/Spayed25 (92.6%)6 (75%)6 (75%)37 (86%)0.17918
Urethral obstruction5 (18.5%)1 (12.5%)1 (12.5%)7 (16.3%)1.00000
Presence of
metastasis
3 (11.1%)003 (7%)
Treatments
Antibiotics7 (25.9%)01 (12.5%)8 (18.6%)0.30230
NSAIDS12 (44.4%)3 (37.5%)015 (34.9%)0.07110
Chemotherapy4 (14.8%)004 (9.3%)
p-value for age is from an ANOVA F-test and p-values for categorical variables are from Fisher’s Exact Tests.
Table 2. Metabolites that are differentially expressed between Urinary Carcinoma and control groups, after adjusting for age and sex (adjusted p-value < 0.05; −1.5 ≥ logFC ≥ 1.5). Highlighted in grey are compounds that are probably metabolites of ingested drugs these dogs had received as part of their anesthetic or sedation protocols, or drugs being used to treat their current or concurrent diseases.
PlatformMetabolite NamelogFCAveExprp Valueadj.p.Val.
Primary metabolites (GCTOF MS)glycerol-3-galactoside1.672213.46480.00060.0478
hippuric acid−3.554615.755<0.00010.0016
Secondary and charged metabolites (HILIC-QTOF MS)E-40314.42266.82630.00140.0314
Riluzole2.307310.94530.00130.0305
Diethyloxalpropionate1.82989.83140.00180.0387
3-Methyl-2-oxovaleric acid1.816611.3829<0.00010.0022
Threonine1.811211.59280.00170.0378
N-Acetylphenylalanine1.629510.07060.0010.0261
3,4-Dihydroxyphenylglycol1.58510.70240.00020.0111
N-alpha-methylhistamine−1.578412.3780.00010.0084
3-Hydroxysebacic acid−1.838211.2460.00070.0217
5-Methoxypsoralen−1.90076.59290.00090.026
6-Hydroxycaproic acid−2.169312.42070.00050.0194
Octanoylcarnitine−2.201412.69270.00020.0111
Otenzepad−2.27378.52510.00070.0217
2-Hydroxy-4-methylpentanoic acid−2.35689.710.00050.0194
Taxifolin−2.38799.41810.00040.0186
Sulfo jasmonate−2.673310.58360.00080.0253
Tryptamine−2.82799.42390.00010.0097
Flunitrazepam−2.97257.25480.00020.0097
Sarcosine−3.34287.0257<0.00010.0001
Cocaethylene A−3.39427.7349<0.00010.0002
Propofol. beta.-D-glucuronide−3.692211.05990.00020.0097
N-Acetyl-S-benzyl-L-cysteine−3.887612.1560.00010.0063
Olopatadine−3.89018.64560.00020.0097
Convolvamine−4.01418.3401<0.00010.0001
Tropine−4.13929.540.00010.0084
After eliminating the drug-related products, 17 metabolites were found to be differentially expressed, likely due to internal genetic or tumor microenvironmental changes associated with disease progression (Table S1), with 11 downregulated and 6 upregulated in UC compared to controls.
Table 3. KEGG Pathway analysis in canine Urinary Carcinoma as compared to the control group. Number refers to the number of the metabolites in this study out of all the metabolites of the pathway in the parentheses. FDR: False Discovery rate.
Pathway NameMetabolitesp Value
Valine, Leucine and Isoleucine BiosynthesisL-Threonine, 3-Methyl-2-Oxovaleric acid, 2-hydroxy-4-methylpentanoic acid0.00103
Glycine, Serine and Threonine MetabolismSarcosine, L-Threonine0.00178
Phenylalanine MetabolismHippuric acid, N-Acetylphenylalanine, 5-Methoxypsoralen, Taxifolin0.00629
Valine, Leucine, and Isoleucine Degradation3-Methyl-2-Oxovaleric acid, L-Threonine0.231
Tryptophan MetabolismTryptamine0.236
Tyrosine Metabolism3-4-Dihydroxyphenylglycol0.241
Aminoacyl-tRNA BiosynthesisL-Threonine0.271
Table 4. Breed variations in Urinary Carcinoma and urolithiasis/urinary tract (U/UTI) infection.
GroupBreedDefined byUC (n = 27)U/UTI (n = 16)
HerdingAustralian Cattle Dog AKC10
Australian Shepherd AKC20
Border Collie AKC10
Collie MixAKC10
German ShepherdAKC10
Shepherd MixAKC20
Shetland Sheepdog AKC10
HoundBeagle AKC10
DachshundAKC10
Rhodesian RidgebackAKC10
Non-sportingBichon Frise AKC02
DalmatianAKC10
French BulldogAKC01
SportingBrittany/Spaniel mixAKC01
Golden RetrieverAKC21
Labrador RetrieverAKC20
Labrador Retriever MixAKC10
TerrierAmerican Pit Bull TerrierUKC01
Miniature SchnauzerAKC12
Terrier MixAKC13
West Highland White Terrier AKC31
Yorkshire TerrierAKC01
CompanionChihuahua mixAKC01
Miniature PinscherAKC20
PomeranianAKC10
WorkingGreat PyreneesAKC01
MastiffAKC10
RottweilerAKC01
Considered to be high-risk for UC.
Table 5. Differences in metabolites from the urine of terrier breeds and non-terrier breeds in the Urinary Carcinoma (UC) arm and control arm.
Terrier vs. Non-Terrier
UCControl
Metabolite NamelogFCAveExprp Valueadj.p.Val.logFCAveExprp Valueadj.p.Val.
Taxifolin3.323449.41806.57 × 10−50.01913.24529.41800.00010.0376
3-Hydroxykynurenine−7.852013.87567.22 × 10−50.0191−7.743813.87560.00010.0376
4-Pyridoxic acid−2.264012.01449.73 × 10−50.0191−2.211812.01440.00010.0376
Homoarginine2.43868.339700.00020.0358
Tryptamine3.25559.42390.00030.0359
Flunitrazepam3.35567.25480.00040.0359
2-[(4-Aminobenzoyl) amino]acetic acid−2.479713.97700.00040.0359
N-Methylalanine3.3594710.89140.00060.0461
Tropine4.24909.53990.00070.0468
Table 6. Differentially expressed metabolites in urine of dogs with urethral obstruction suffering from Urinary Carcinoma (UC) vs. control dogs (log FC ≥ 1.5 and adj. p-value ≤ 0.05). Bolded are the ones that were highly discriminatory between UC and control.
Urethral ObstructionNo Urethral Obstruction
Metabolite NameAveExprlogFCp Valueadj.p.VallogFCp Valueadj.p.Val
2,3-Dihydroxybenzoic acid B10.632.590.00310.0473
2’-Deoxyadenosine9.38 −1.520.00170.0341
2-Hydroxy-4-methylpentanoic acid9.71−2.110.00150.0319−2.450.00070.0218
3,4-Dihydroxyphenylglycol10.70 1.610.00040.0160
3-Hydroxysebacic acid11.25−1.920.00010.0064−2.080.00010.0057
3-Methyl-2-oxovaleric acid11.381.820.00000.00051.900.00000.0008
4-Acetylbutyric acid13.372.380.00090.02712.330.00220.0422
5-Methoxypsoralen6.59−1.830.00100.0271−2.050.00070.0218
6-Hydroxycaproic acid12.42−1.910.00150.0319−2.240.00060.0218
Cer d36:19.78−2.090.00050.0472
Cer d42:2 Isomer A10.95−1.640.00060.0472
Cer-NS d34:1; Cer-NS d18:1/16:0;8.82−3.070.00050.0472
Cocaethylene A7.73−3.190.00000.0005−3.450.00000.0006
Convolvamine8.34−4.170.00000.0000−4.150.00000.0000
D-Glucosamine9.50−1.630.00250.0424
Diethyloxalpropionate9.831.880.00100.02711.990.00110.0255
E-40316.834.480.00120.02944.700.00130.0307
FA 24:1 (nervonic acid)10.661.720.00040.0472
Flunitrazepam7.25−2.980.00010.0064−3.240.00010.0072
glycerol-3-galactoside13.461.690.00030.02961.810.00030.0299
Haloperidol7.69−3.140.00260.0424
hippuric acid15.75−3.680.00000.0003−3.720.00000.0009
Lobelanidine9.60−1.520.00160.0321−1.690.00110.0255
Metanephrine10.03−1.620.00210.0393
N-Acetylphenylalanine10.071.720.00030.01381.770.00050.0196
N-Acetyl-S-benzyl-L-cysteine12.16−3.960.00000.0020−4.120.00000.0031
N-alpha-methylhistamine12.38−1.520.00010.0064−1.540.00030.0111
N-Methylalanine10.89−2.150.00190.0376−2.270.00220.0422
Octanoylcarnitine12.69−2.220.00010.0064−2.320.00020.0077
Olopatadine8.65−3.950.00010.0064−4.350.00010.0047
Otenzepad8.53−2.220.00070.0227−2.330.00080.0225
Palatinose11.853.380.00230.0418
Phenylacetylglycine12.62 1.500.00080.0225
Propofol. beta.-D-glucuronide11.06−4.030.00000.0010−4.240.00000.0014
Riluzole10.95 2.250.00260.0487
Sarcosine7.03−3.220.00000.0001−3.460.00000.0001
Sulfo jasmonate10.58−2.640.00080.0246−2.810.00080.0225
Taxifolin9.42−2.490.00010.0064−2.680.00010.0072
Tropine9.54−4.280.00000.0012−4.410.00000.0021
Tryptamine9.42−2.740.00020.0069−2.920.00020.0077
Publisher’s Note: MDPI stays neutral with regard to jurisdictional claims in published maps and institutional affiliations.

