


Metabolites of De Novo Purine Synthesis: Metabolic Regulators and Cytotoxic Compounds

 ,
,
Abstract
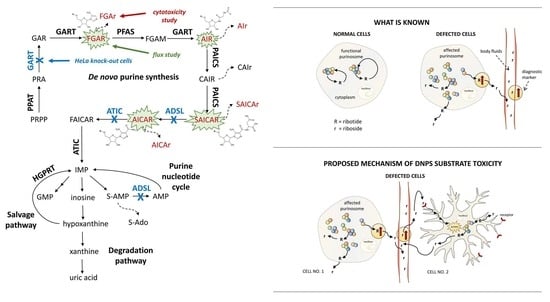
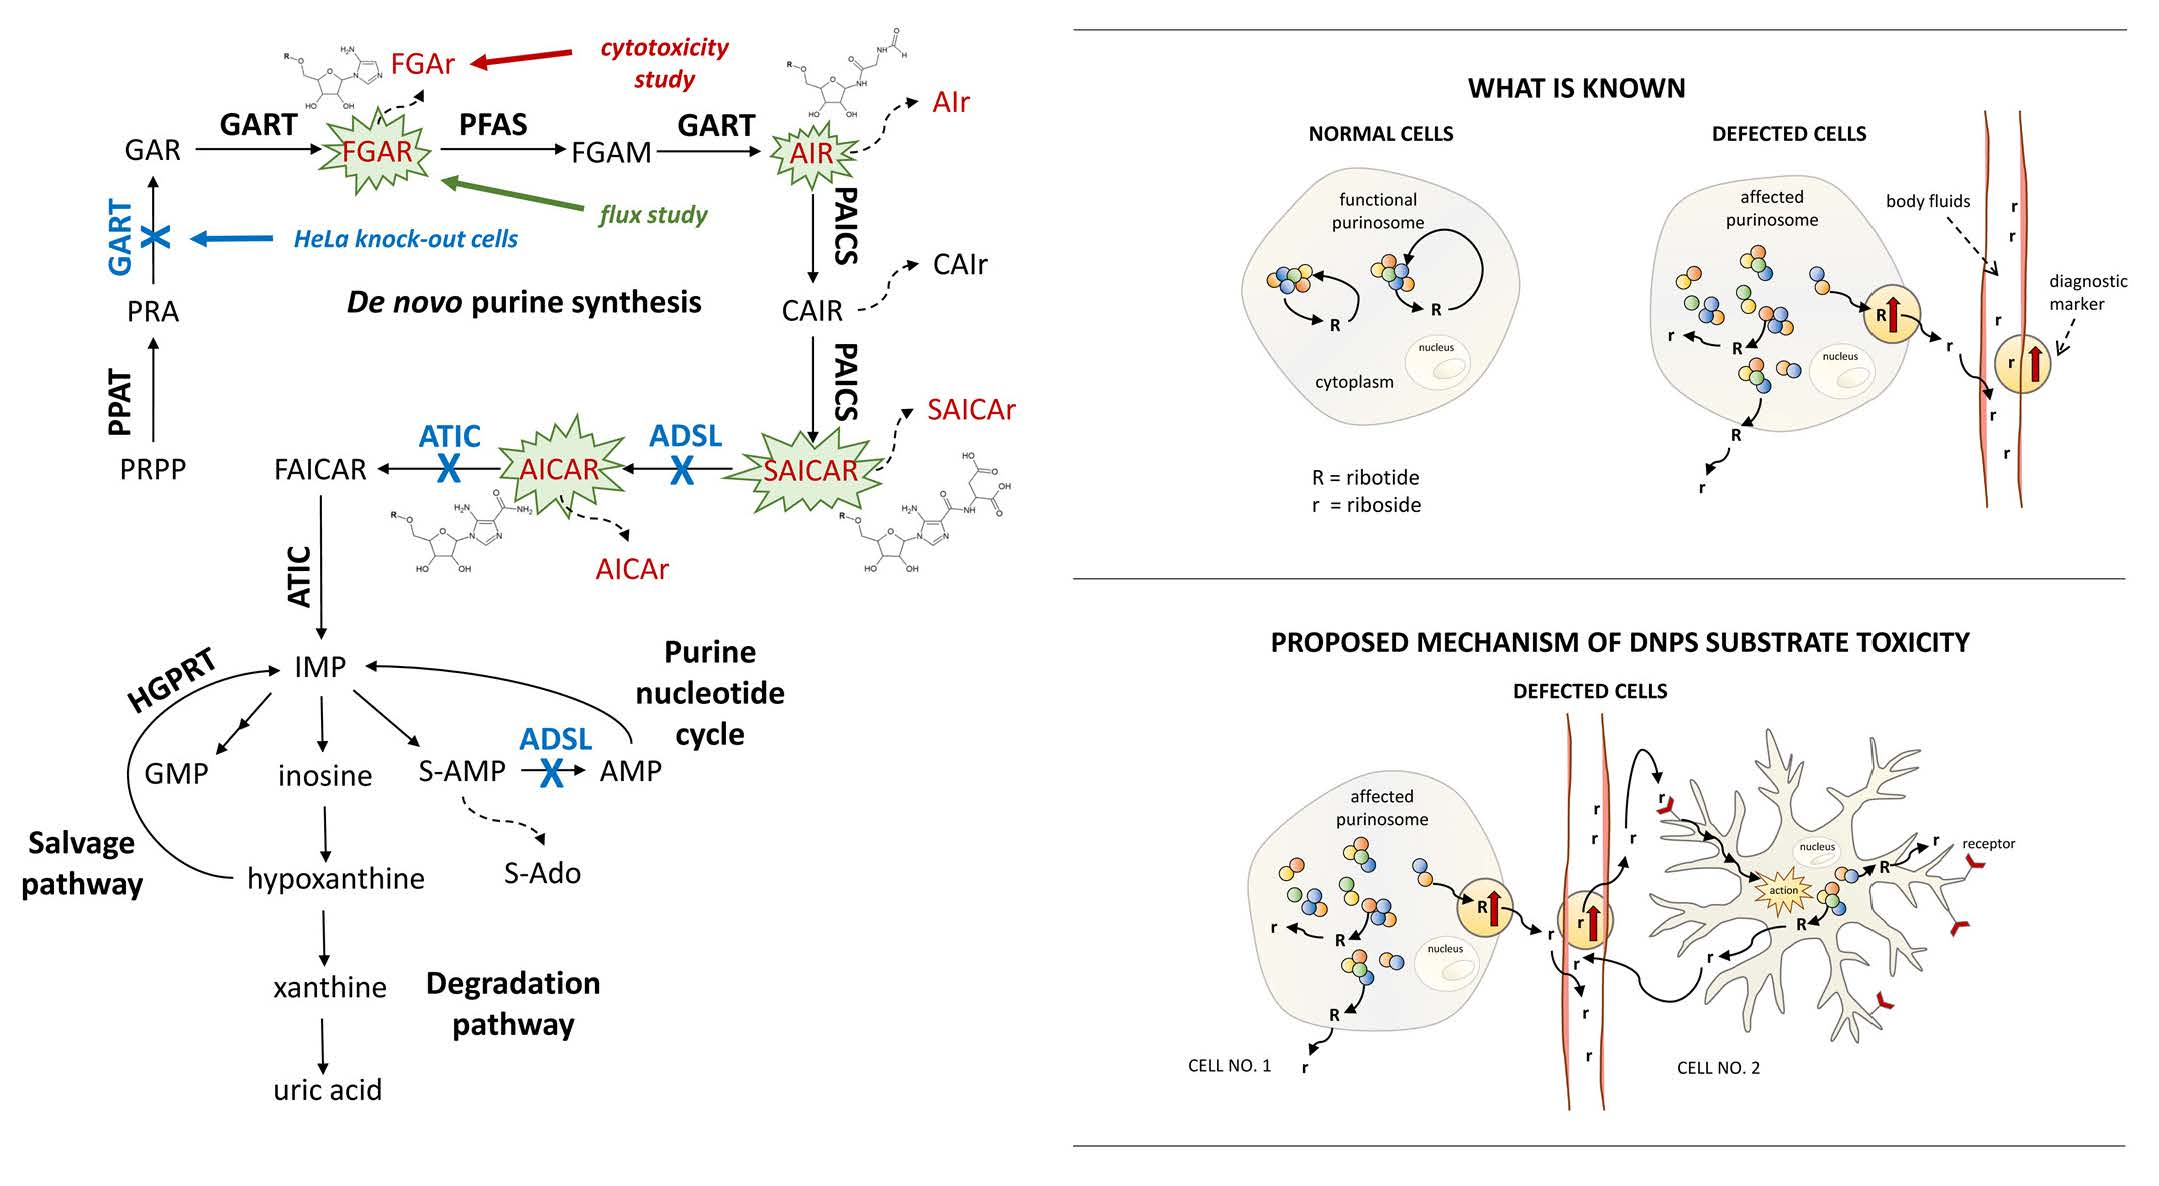
1. Introduction
2. Materials and Methods
2.1. Cell Lines
2.2. Chemicals
2.3. Flux Experiment with Isotopically Labeled Metabolites and LC-MS/MS Measurement
2.4. Cell Viability in the Presence of DNPS Metabolites: FGAR, FGAr, AIR, AIr, SAICAR, SAICAr, AICAR, AICAr in HeLa, CAD 5, HepG2, K562, Skin Fibroblasts, HeLa GART KO, ADSL KO, GART-ADSL KO Cells
3. Results
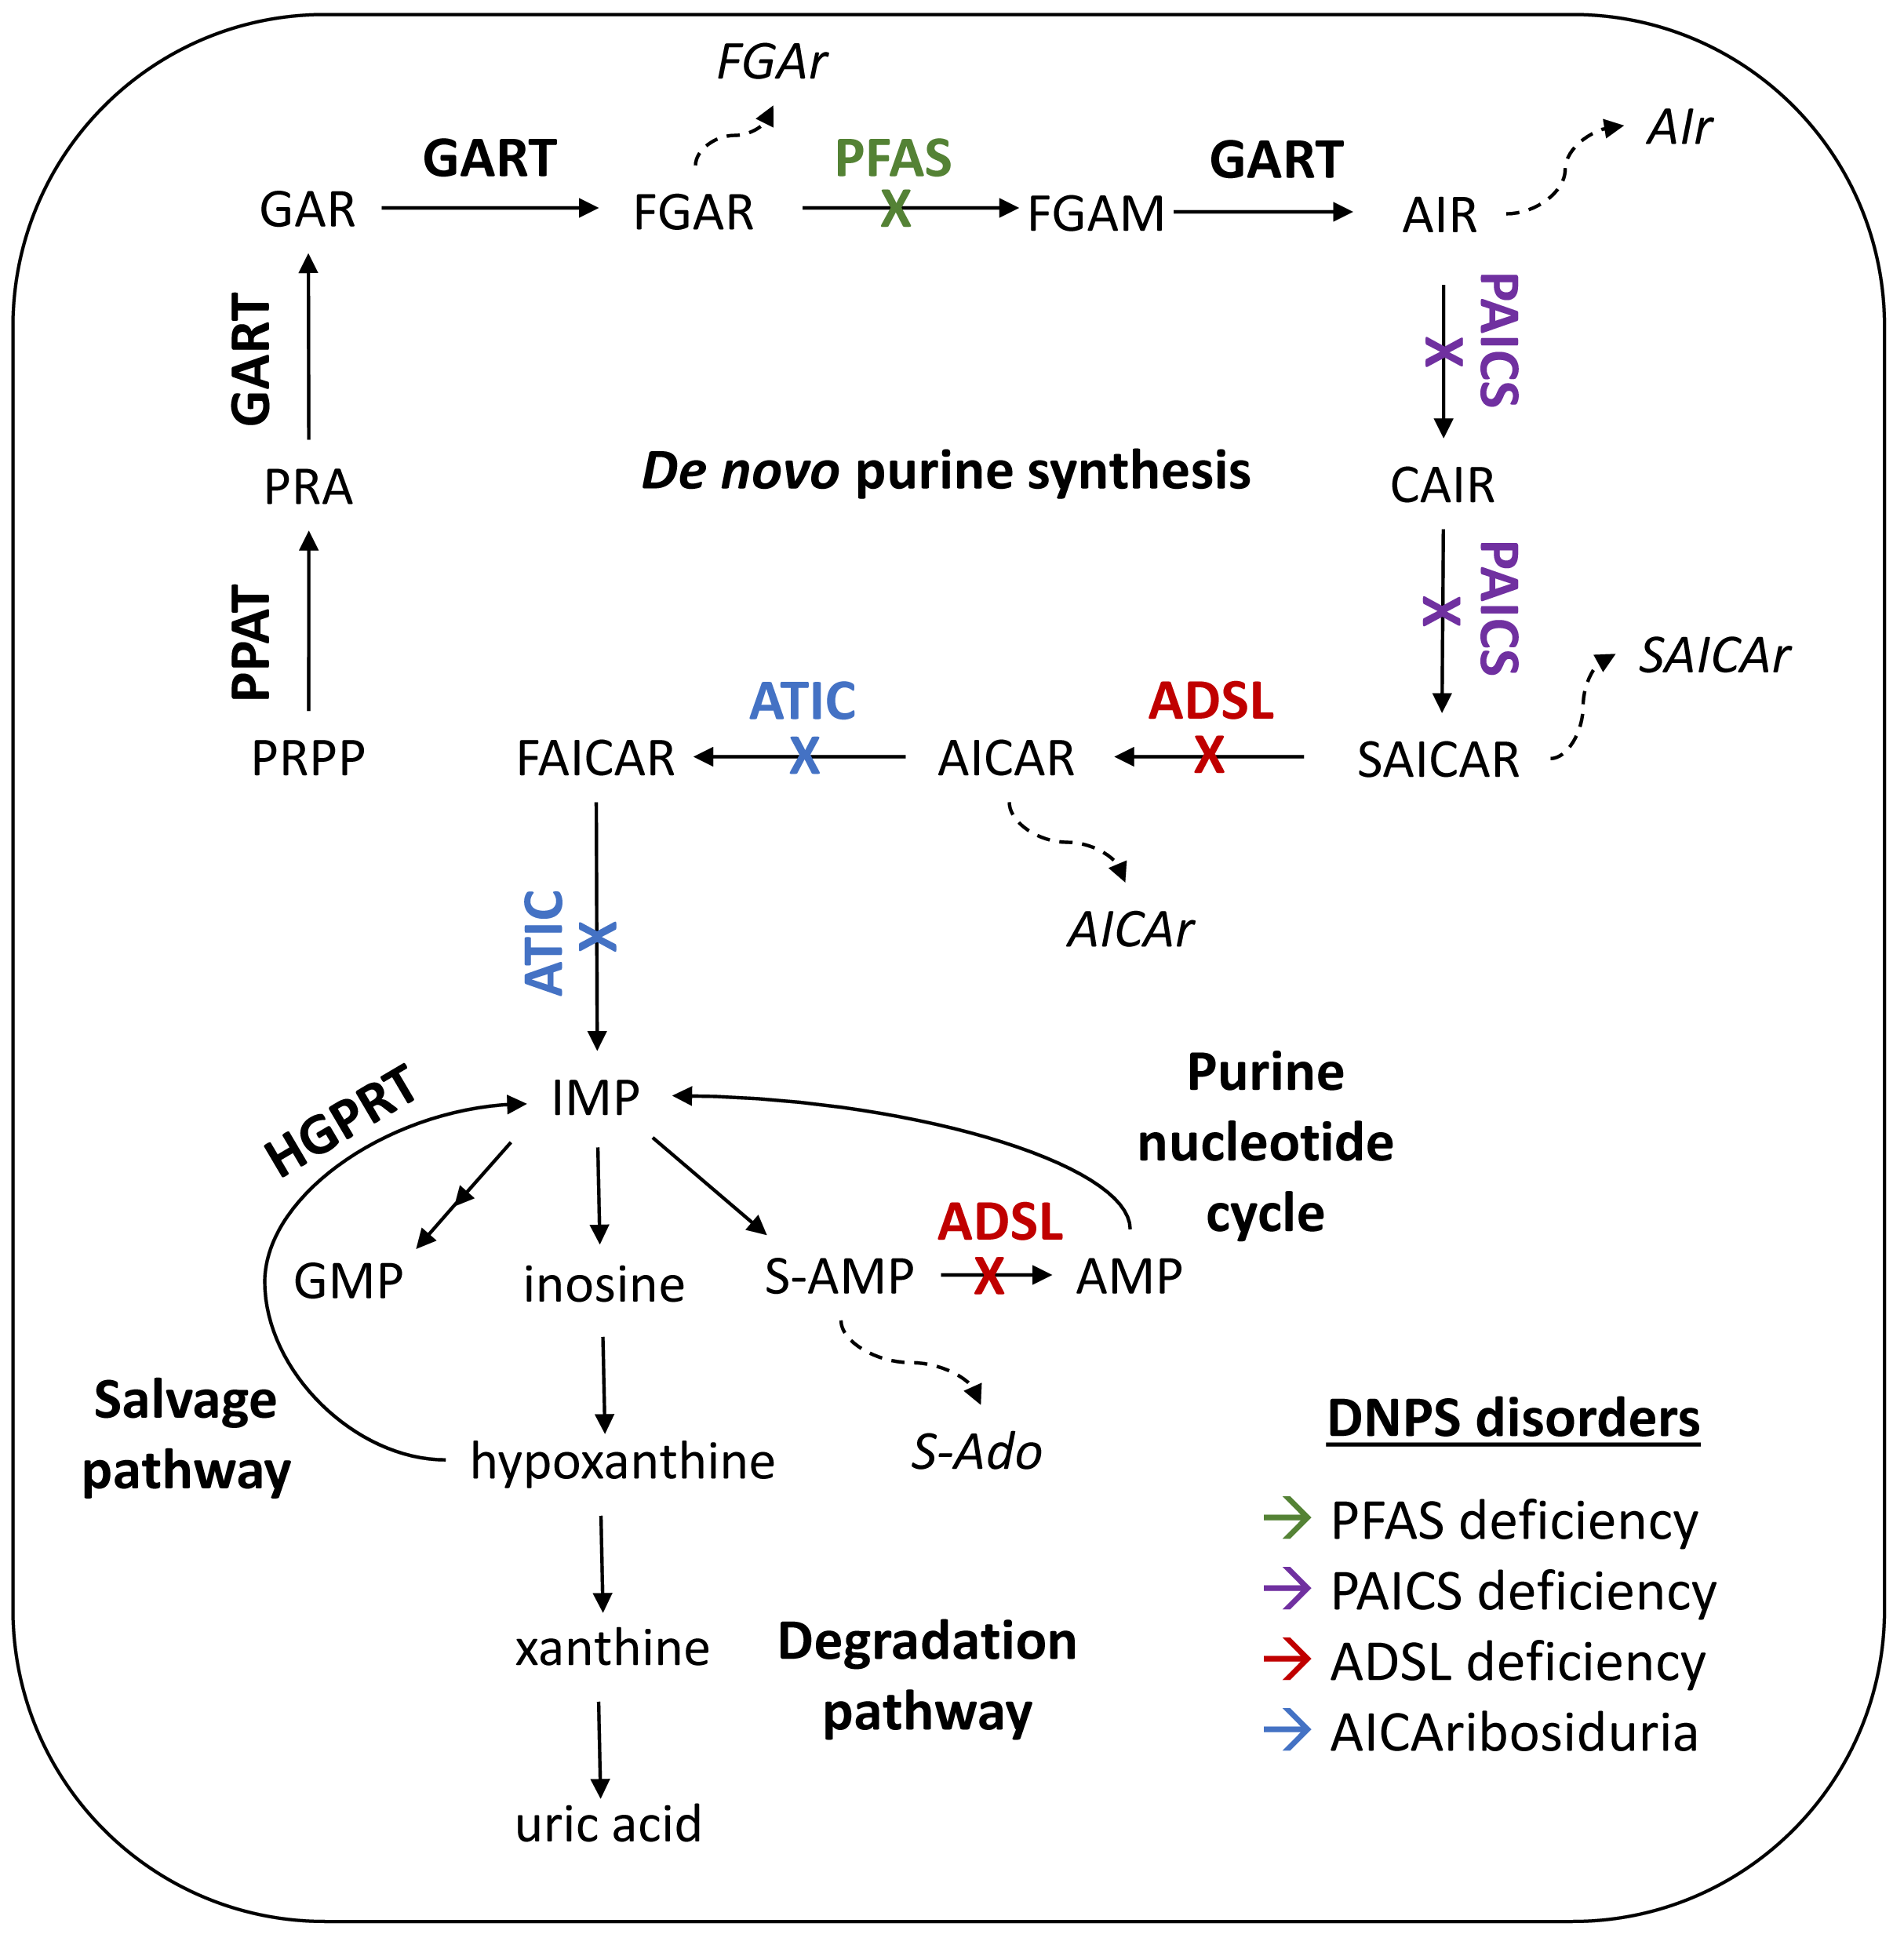
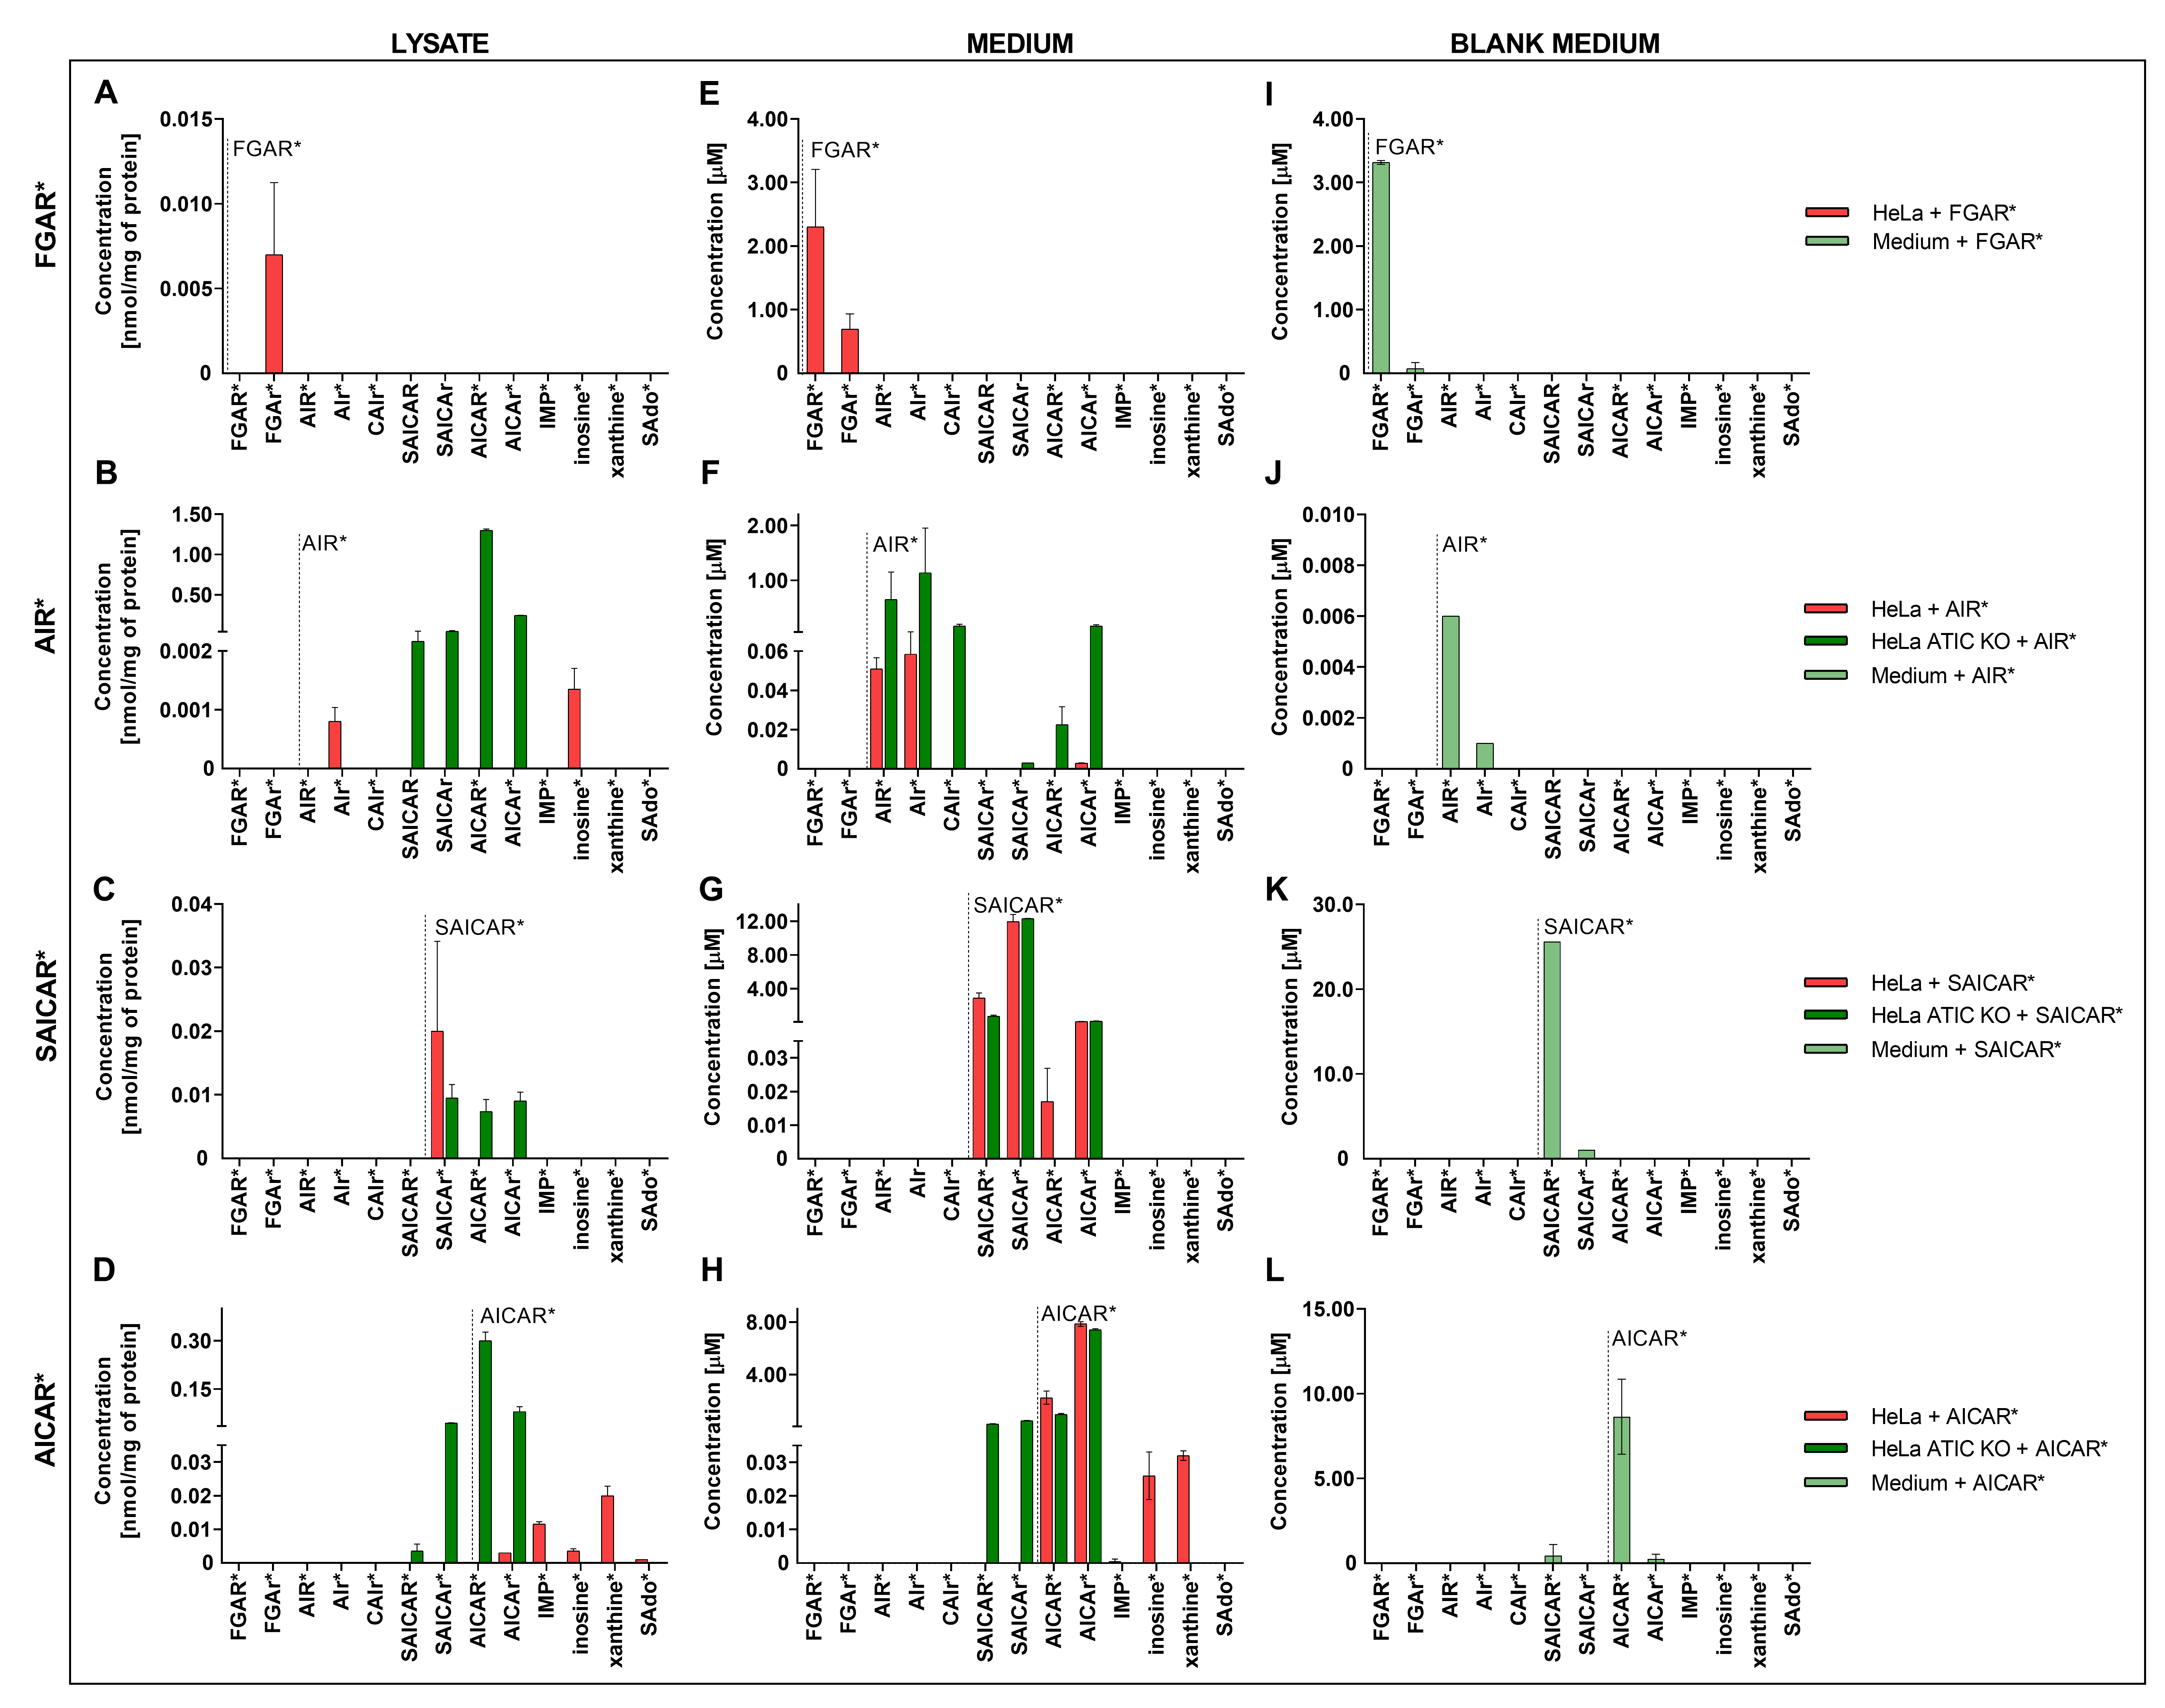
3.1. Distribution of DNPS Metabolites within Cells
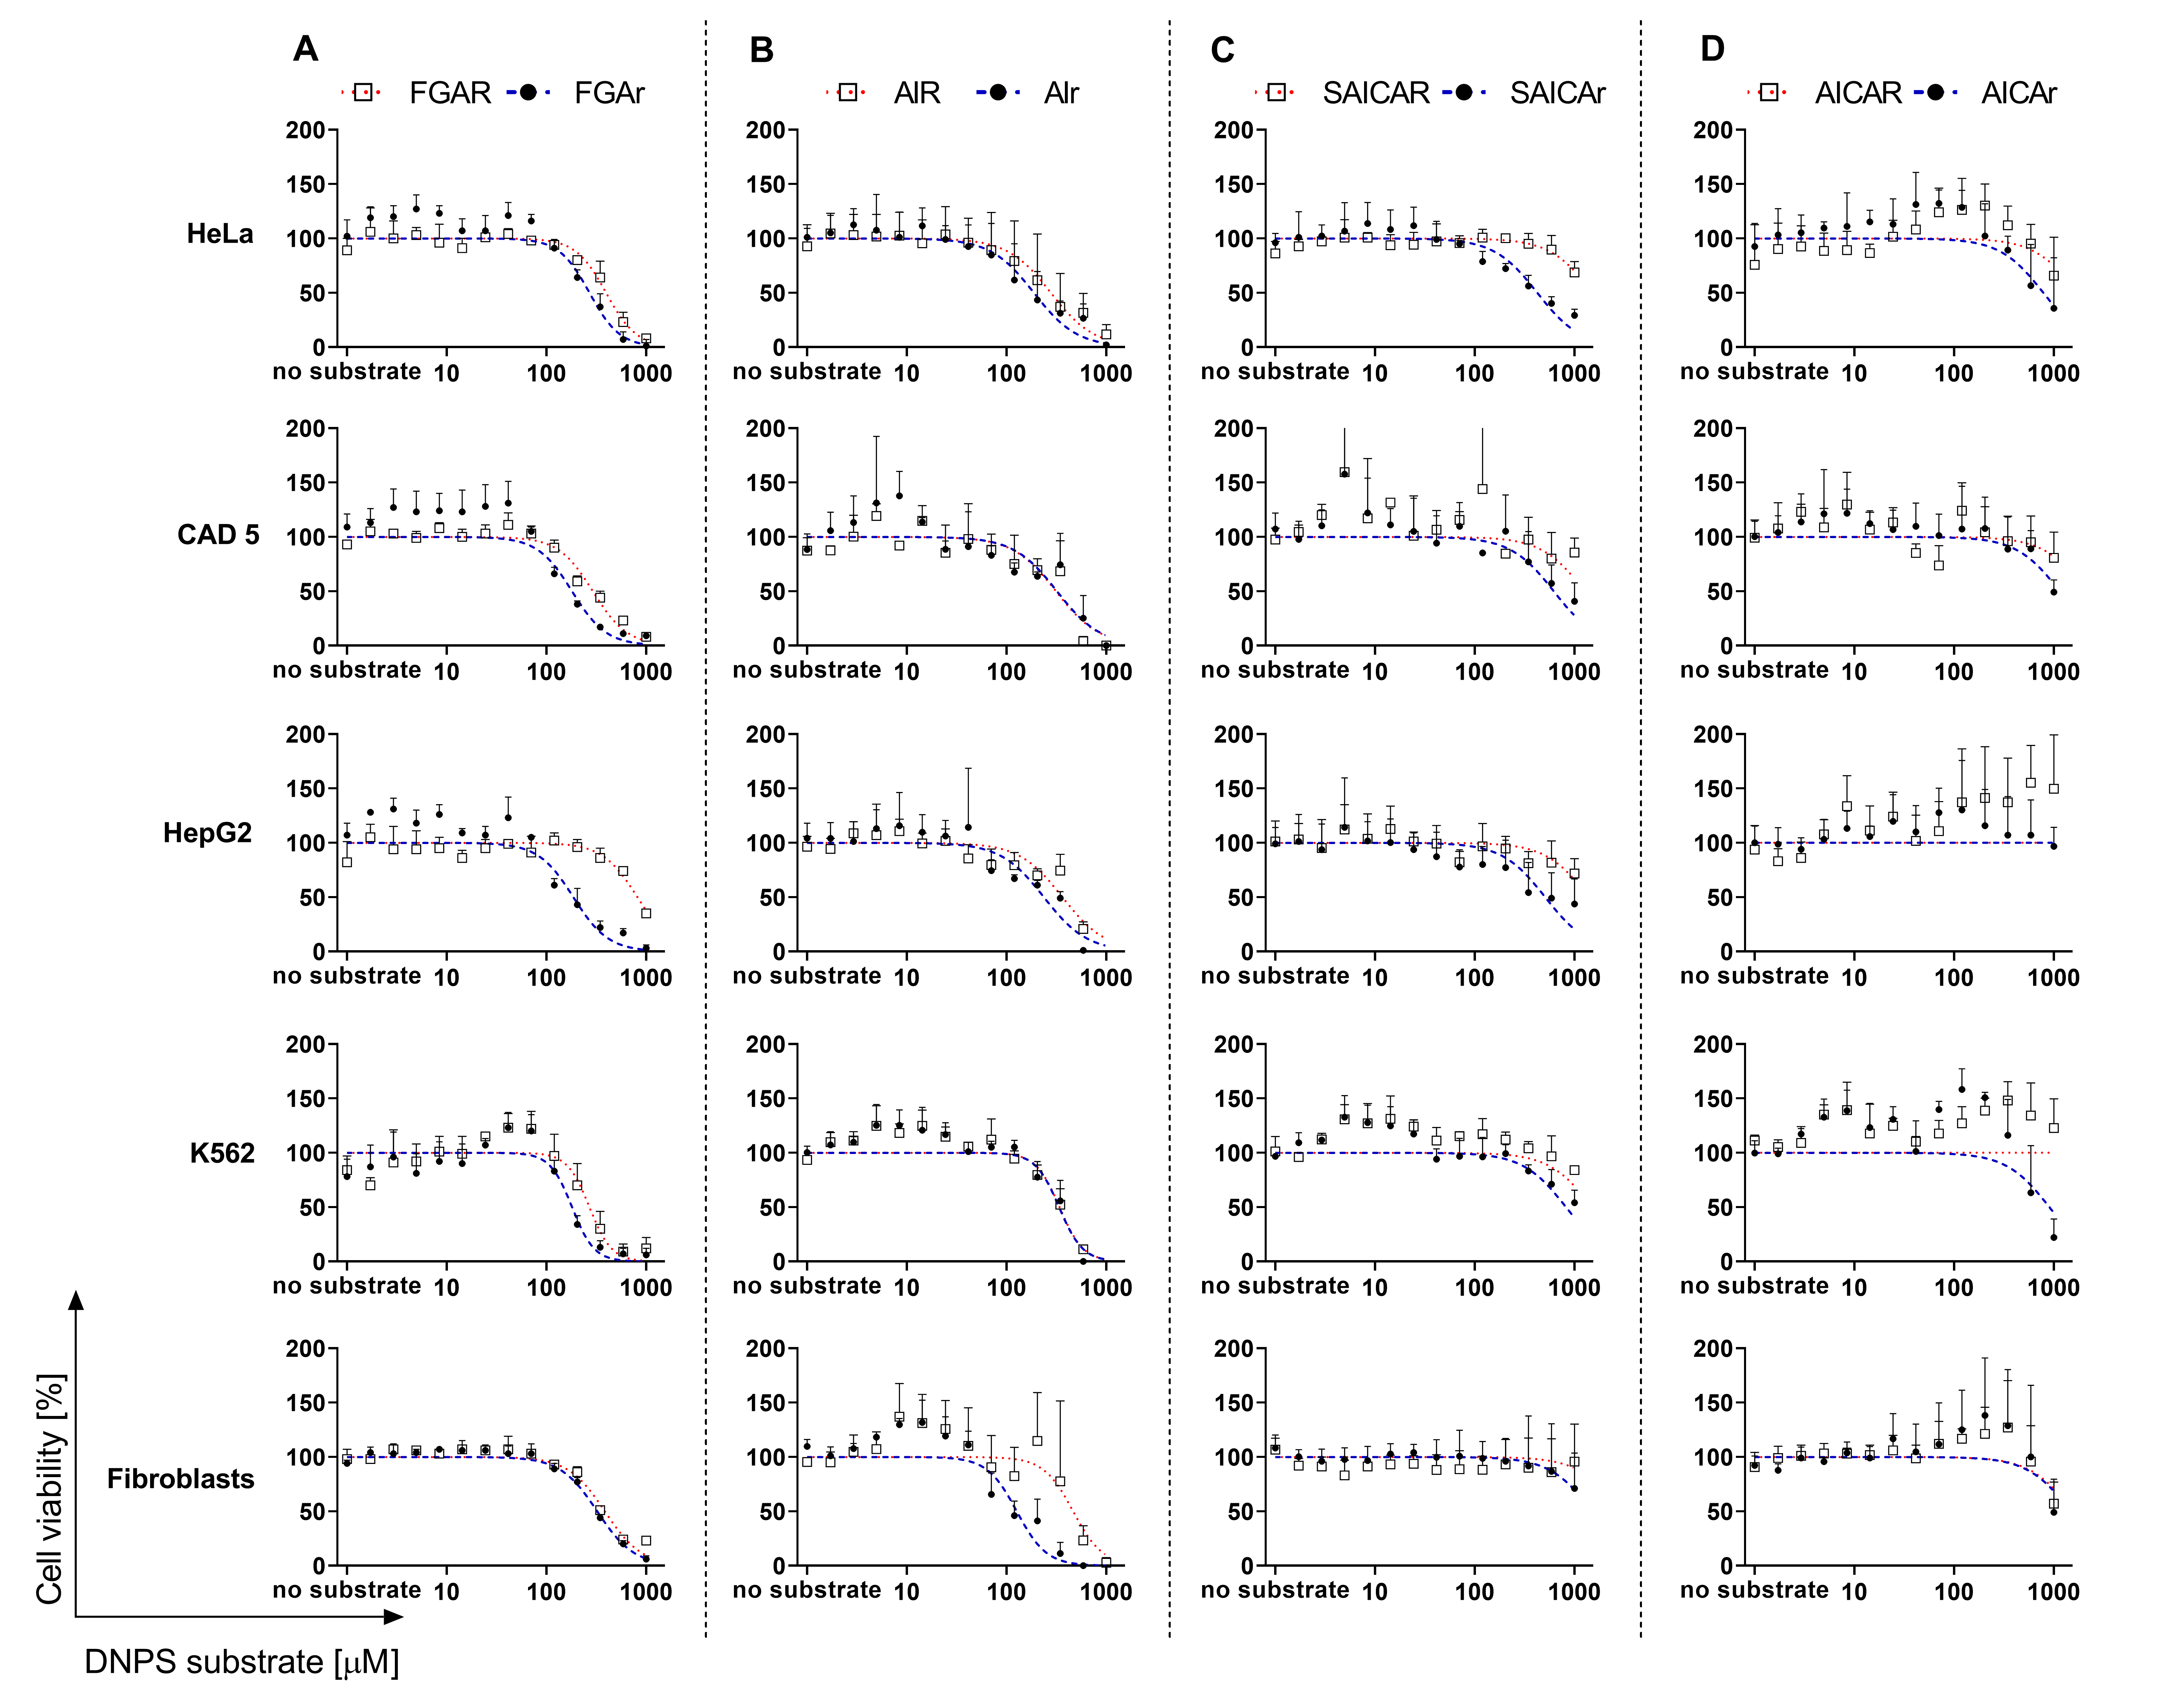
3.2. Cell Viability in the Presence of DNPS Metabolites
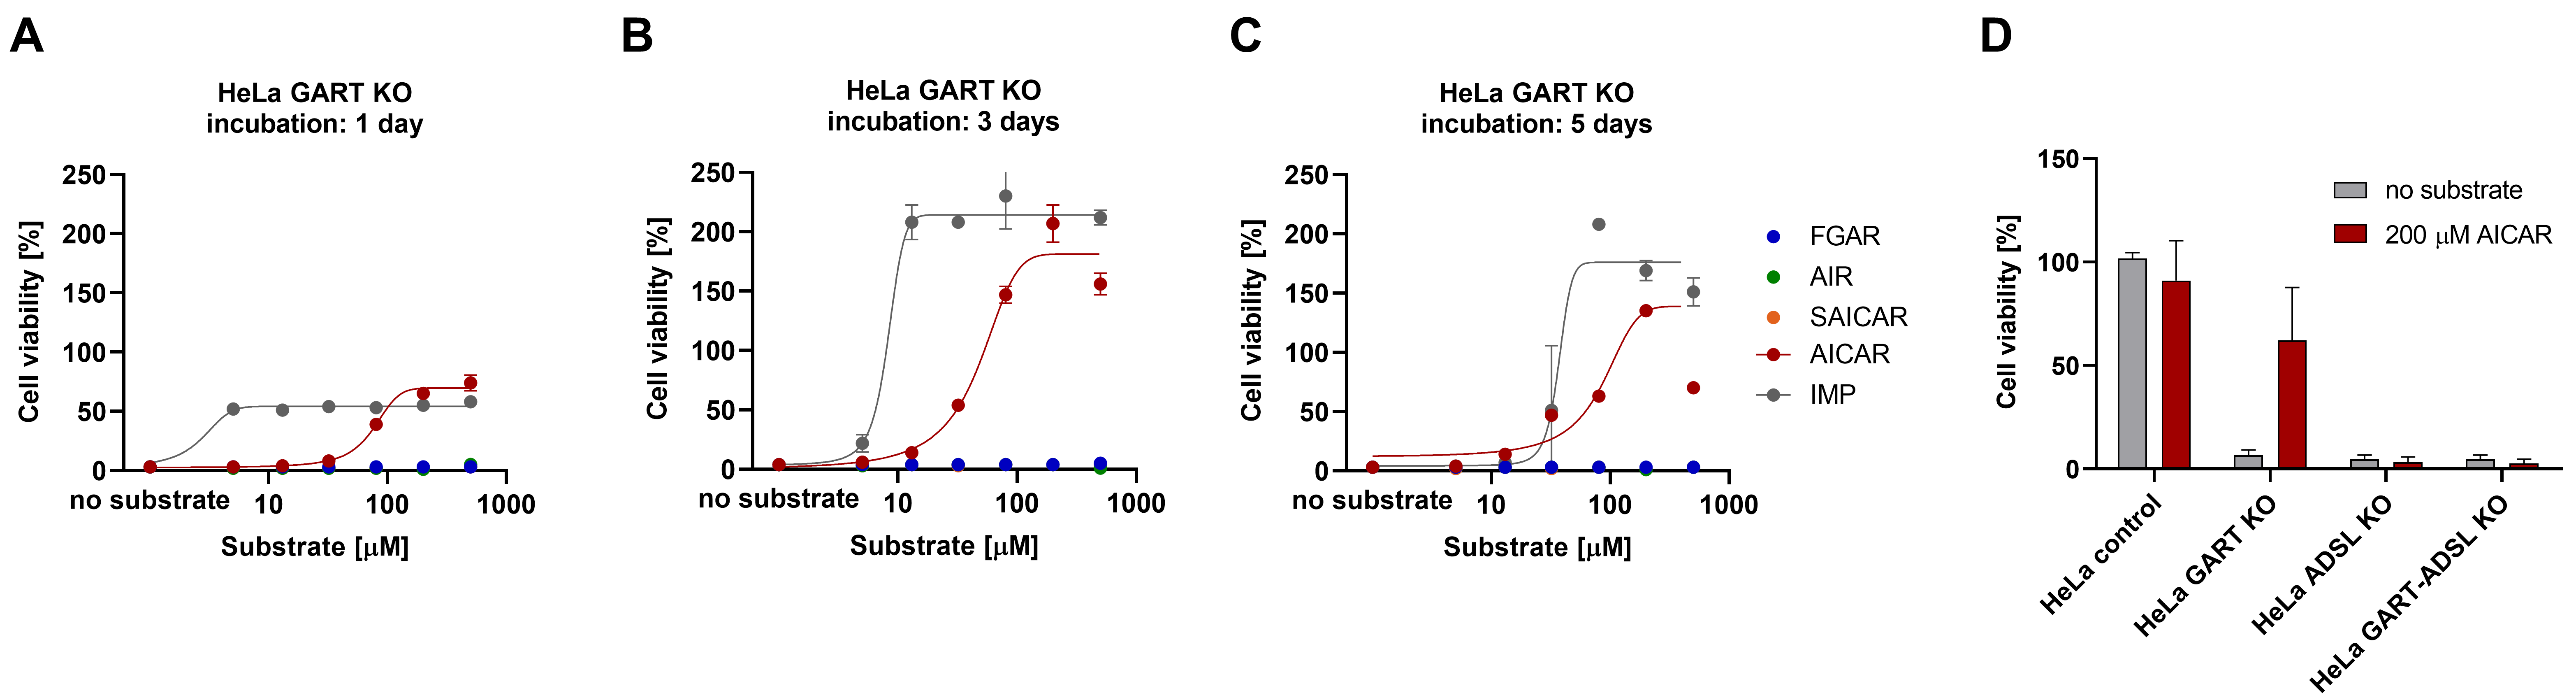
3.3. AICAR Restores the Viability of HeLa GART KO Cells
4. Discussion
5. Conclusions
Supplementary Materials
Author Contributions
Funding
Institutional Review Board Statement
Informed Consent Statement
Data Availability Statement
Conflicts of Interest
References
- Krijt, M.; Souckova, O.; Baresova, V.; Skopova, V.; Zikanova, M. Metabolic Tools for Identification of New Mutations of Enzymes Engaged in Purine Synthesis Leading to Neurological Impairment. Folia Biol. 2019, 65, 152–157. [Google Scholar]
- Marie, S.; Heron, B.; Bitoun, P.; Timmerman, T.; van den Berghe, G.; Vincent, M.F. AICA-ribosiduria: A novel, neurologically devastating inborn error of purine biosynthesis caused by mutation of ATIC. Am. J. Hum. Genet. 2004, 74, 1276–1281. [Google Scholar] [CrossRef] [PubMed]
- Pelet, A.; Skopova, V.; Steuerwald, U.; Baresova, V.; Zarhrate, M.; Plaza, J.M.; Hnizda, A.; Krijt, M.; Souckova, O.; Wibrand, F.; et al. PAICS deficiency, a new defect of de novo purine synthesis resulting in multiple congenital anomalies and fatal outcome. Hum. Mol. Genet. 2019, 28, 3805–3814. [Google Scholar] [CrossRef] [PubMed]
- Ramond, F.; Rio, M.; Heron, B.; Imbard, A.; Marie, S.; Billemaz, K.; Denomme-Pichon, A.S.; Kuentz, P.; Ceballos, I.; Piraud, M.; et al. AICA-ribosiduria due to ATIC deficiency: Delineation of the phenotype with three novel cases, and long-term update on the first case. J. Inherit. Metab. Dis. 2020, 43, 1254–1264. [Google Scholar] [CrossRef]
- Jurecka, A.; Zikanova, M.; Kmoch, S.; Tylki-Szymanska, A. Adenylosuccinate lyase deficiency. J. Inherit. Metab. Dis. 2015, 38, 231–242. [Google Scholar] [CrossRef] [PubMed]
- Stone, T.W.; Roberts, L.A.; Morris, B.J.; Jones, P.A.; Ogilvy, H.A.; Behan, W.M.; Duley, J.A.; Simmonds, H.A.; Vincent, M.F.; van den Berghe, G. Succinylpurines induce neuronal damage in the rat brain. Adv. Exp. Med. Biol. 1998, 431, 185–189. [Google Scholar] [CrossRef]
- Jaeken, J.; van den Bergh, F.; Vincent, M.F.; Casaer, P.; van den Berghe, G. Adenylosuccinase deficiency: A newly recognized variant. J. Inherit. Metab. Dis. 1992, 15, 416–418. [Google Scholar] [CrossRef]
- Jaeken, J.; van den Berghe, G. An infantile autistic syndrome characterised by the presence of succinylpurines in body fluids. Lancet 1984, 2, 1058–1061. [Google Scholar]
- Zikanova, M.; Skopova, V.; Hnizda, A.; Krijt, J.; Kmoch, S. Biochemical and structural analysis of 14 mutant adsl enzyme complexes and correlation to phenotypic heterogeneity of adenylosuccinate lyase deficiency. Hum. Mutat. 2010, 31, 445–455. [Google Scholar] [CrossRef]
- Krijt, J.; Kmoch, S.; Hartmannova, H.; Havlicek, V.; Sebesta, I. Identification and determination of succinyladenosine in human cerebrospinal fluid. J. Chromatogr. B Biomed. Sci. Appl. 1999, 726, 53–58. [Google Scholar] [CrossRef]
- Adenylosuccinate Lyase Deficiency. Available online: https://www.adenylosuccinatelyasedeficiency.com/ (accessed on 28 March 2022).
- Race, V.; Marie, S.; Kienlen-Campard, P.; Hermans, E.; Octave, J.N.; van den Berghe, G.; Vincent, M.F. Adenylosuccinate lyase deficiency: Study of physiopathologic mechanism(s). Nucleosides Nucleotides Nucleic Acids 2004, 23, 1227–1229. [Google Scholar] [CrossRef] [PubMed]
- Van den Bergh, F.; Vincent, M.F.; Jaeken, J.; van den Berghe, G. Radiochemical assay of adenylosuccinase: Demonstration of parallel loss of activity toward both adenylosuccinate and succinylaminoimidazole carboxamide ribotide in liver of patients with the enzyme defect. Anal. Biochem. 1991, 193, 287–291. [Google Scholar] [CrossRef] [PubMed]
- Van den Berghe, G.; Jaeken, J. Adenylosuccinase deficiency. Adv. Exp. Med. Biol. 1986, 195 Pt A, 27–33. [Google Scholar] [CrossRef]
- Van den Bergh, F.; Vincent, M.F.; Jaeken, J.; van den Berghe, G. Functional studies in fibroblasts of adenylosuccinase-deficient children. J. Inherit. Metab. Dis. 1993, 16, 425–434. [Google Scholar] [CrossRef]
- Lee, H.; DeLoache, W.C.; Dueber, J.E. Spatial organization of enzymes for metabolic engineering. Metab. Eng. 2012, 14, 242–251. [Google Scholar] [CrossRef] [PubMed]
- An, S.; Kumar, R.; Sheets, E.D.; Benkovic, S.J. Reversible compartmentalization of de novo purine biosynthetic complexes in living cells. Science 2008, 320, 103–106. [Google Scholar] [CrossRef] [PubMed]
- Baresova, V.; Skopova, V.; Sikora, J.; Patterson, D.; Sovova, J.; Zikanova, M.; Kmoch, S. Mutations of ATIC and ADSL affect purinosome assembly in cultured skin fibroblasts from patients with AICA-ribosiduria and ADSL deficiency. Hum. Mol. Genet. 2012, 21, 1534–1543. [Google Scholar] [CrossRef] [PubMed]
- Deng, Y.; Gam, J.; French, J.B.; Zhao, H.; An, S.; Benkovic, S.J. Mapping protein-protein proximity in the purinosome. J. Biol. Chem. 2012, 287, 36201–36207. [Google Scholar] [CrossRef]
- Chan, C.Y.; Zhao, H.; Pugh, R.J.; Pedley, A.M.; French, J.; Jones, S.A.; Zhuang, X.; Jinnah, H.; Huang, T.J.; Benkovic, S.J. Purinosome formation as a function of the cell cycle. Proc. Natl. Acad. Sci. USA 2015, 112, 1368–1373. [Google Scholar] [CrossRef]
- Proschel, M.; Detsch, R.; Boccaccini, A.R.; Sonnewald, U. Engineering of Metabolic Pathways by Artificial Enzyme Channels. Front. Bioeng. Biotechnol. 2015, 3, 168. [Google Scholar] [CrossRef]
- Spurr, I.B.; Birts, C.N.; Cuda, F.; Benkovic, S.J.; Blaydes, J.P.; Tavassoli, A. Targeting tumour proliferation with a small-molecule inhibitor of AICAR transformylase homodimerization. ChemBioChem 2012, 13, 1628–1634. [Google Scholar] [CrossRef]
- Van den Berghe, G.; Vincent, M.F.; Jaeken, J. Inborn errors of the purine nucleotide cycle: Adenylosuccinase deficiency. J. Inherit. Metab. Dis. 1997, 20, 193–202. [Google Scholar] [CrossRef]
- Vincent, M.F.; van den Berghe, G. Influence of succinylpurines on the binding of adenosine to a particulate fraction of rat cerebral cortex. Adv. Exp. Med. Biol. 1989, 253, 441–445. [Google Scholar] [CrossRef]
- Garcia, D.; Shaw, R.J. AMPK: Mechanisms of Cellular Energy Sensing and Restoration of Metabolic Balance. Mol. Cell 2017, 66, 789–800. [Google Scholar] [CrossRef]
- Hardie, D.G. The AMP-activated protein kinase pathway—New players upstream and downstream. J. Cell Sci. 2004, 117 Pt 23, 5479–5487. [Google Scholar] [CrossRef]
- Jose, C.; Hebert-Chatelain, E.; Bellance, N.; Larendra, A.; Su, M.; Nouette-Gaulain, K.; Rossignol, R. AICAR inhibits cancer cell growth and triggers cell-type distinct effects on OXPHOS biogenesis, oxidative stress and Akt activation. Biochim. Biophys. Acta 2011, 1807, 707–718. [Google Scholar] [CrossRef]
- Keller, K.E.; Tan, I.S.; Lee, Y.S. SAICAR stimulates pyruvate kinase isoform M2 and promotes cancer cell survival in glucose-limited conditions. Science 2012, 338, 1069–1072. [Google Scholar] [CrossRef]
- Liu, X.; Chhipa, R.R.; Pooya, S.; Wortman, M.; Yachyshin, S.; Chow, L.M.; Kumar, A.; Zhou, X.; Sun, Y.; Quinn, B.; et al. Discrete mechanisms of mTOR and cell cycle regulation by AMPK agonists independent of AMPK. Proc. Natl. Acad. Sci. USA 2014, 111, E435–E444. [Google Scholar] [CrossRef]
- Lopez, J.M.; Santidrian, A.F.; Campas, C.; Gil, J. 5-Aminoimidazole-4-carboxamide riboside induces apoptosis in Jurkat cells, but the AMP-activated protein kinase is not involved. Biochem. J. 2003, 370 Pt 3, 1027–1032. [Google Scholar] [CrossRef]
- Racanelli, A.C.; Rothbart, S.B.; Heyer, C.L.; Moran, R.G. Therapeutics by cytotoxic metabolite accumulation: Pemetrexed causes ZMP accumulation, AMPK activation, and mammalian target of rapamycin inhibition. Cancer Res. 2009, 69, 5467–5474. [Google Scholar] [CrossRef]
- Su, C.C.; Hsieh, K.L.; Liu, P.L.; Yeh, H.C.; Huang, S.P.; Fang, S.H.; Cheng, W.C.; Huang, K.H.; Chiu, F.Y.; Lin, I.L.; et al. AICAR Induces Apoptosis and Inhibits Migration and Invasion in Prostate Cancer Cells through an AMPK/mTOR-Dependent Pathway. Int. J. Mol. Sci. 2019, 20, 1647. [Google Scholar] [CrossRef]
- Ali, E.S.; Sahu, U.; Villa, E.; O’Hara, B.P.; Gao, P.; Beaudet, C.; Wood, A.W.; Asara, J.M.; Ben-Sahra, I. ERK2 Phosphorylates PFAS to Mediate Posttranslational Control of De Novo Purine Synthesis. Mol. Cell 2020, 78, 1178–1191.e6. [Google Scholar] [CrossRef]
- Goswami, M.T.; Chen, G.; Chakravarthi, B.V.; Pathi, S.S.; Anand, S.K.; Carskadon, S.L.; Giordano, T.J.; Chinnaiyan, A.M.; Thomas, D.G.; Palanisamy, N.; et al. Role and regulation of coordinately expressed de novo purine biosynthetic enzymes PPAT and PAICS in lung cancer. Oncotarget 2015, 6, 23445–23461. [Google Scholar] [CrossRef]
- Chakravarthi, B.; Rodriguez Pena, M.D.C.; Agarwal, S.; Chandrashekar, D.S.; Hodigere Balasubramanya, S.A.; Jabboure, F.J.; Matoso, A.; Bivalacqua, T.J.; Rezaei, K.; Chaux, A.; et al. A Role for De Novo Purine Metabolic Enzyme PAICS in Bladder Cancer Progression. Neoplasia 2018, 20, 894–904. [Google Scholar] [CrossRef]
- Chakravarthi, B.V.; Goswami, M.T.; Pathi, S.S.; Dodson, M.; Chandrashekar, D.S.; Agarwal, S.; Nepal, S.; Hodigere Balasubramanya, S.A.; Siddiqui, J.; Lonigro, R.J.; et al. Expression and Role of PAICS, a De Novo Purine Biosynthetic Gene in Prostate Cancer. Prostate 2017, 77, 10–21. [Google Scholar] [CrossRef]
- Jiang, T.; Sanchez-Rivera, F.J.; Soto-Feliciano, Y.M.; Yang, Q.; Song, C.Q.; Bhuatkar, A.; Haynes, C.M.; Hemann, M.T.; Xue, W. Targeting the De Novo Purine Synthesis Pathway through Adenylosuccinate Lyase Depletion Impairs Liver Cancer Growth by Perturbing Mitochondrial Function. Hepatology 2021, 74, 233–247. [Google Scholar] [CrossRef]
- Lv, Y.; Wang, X.; Li, X.; Xu, G.; Bai, Y.; Wu, J.; Piao, Y.; Shi, Y.; Xiang, R.; Wang, L. Nucleotide de novo synthesis increases breast cancer stemness and metastasis via cGMP-PKG-MAPK signaling pathway. PLoS Biol. 2020, 18, e3000872. [Google Scholar] [CrossRef]
- Meng, M.; Chen, Y.; Jia, J.; Li, L.; Yang, S. Knockdown of PAICS inhibits malignant proliferation of human breast cancer cell lines. Biol. Res. 2018, 51, 24. [Google Scholar] [CrossRef]
- Zhang, H.; Xia, P.; Liu, J.; Chen, Z.; Ma, W.; Yuan, Y. ATIC inhibits autophagy in hepatocellular cancer through the AKT/FOXO3 pathway and serves as a prognostic signature for modeling patient survival. Int. J. Biol. Sci. 2021, 17, 4442–4458. [Google Scholar] [CrossRef]
- Zhou, S.; Yan, Y.; Chen, X.; Wang, X.; Zeng, S.; Qian, L.; Wei, J.; Yang, X.; Zhou, Y.; Gong, Z.; et al. Roles of highly expressed PAICS in lung adenocarcinoma. Gene 2019, 692, 1–8. [Google Scholar] [CrossRef]
- Baresova, V.; Krijt, M.; Skopova, V.; Souckova, O.; Kmoch, S.; Zikanova, M. CRISPR-Cas9 induced mutations along de novo purine synthesis in HeLa cells result in accumulation of individual enzyme substrates and affect purinosome formation. Mol. Genet. Metab. 2016, 119, 270–277. [Google Scholar] [CrossRef] [PubMed]
- Furukawa, J.; Inoue, K.; Maeda, J.; Yasujima, T.; Ohta, K.; Kanai, Y.; Takada, T.; Matsuo, H.; Yuasa, H. Functional identification of SLC43A3 as an equilibrative nucleobase transporter involved in purine salvage in mammals. Sci. Rep. 2015, 5, 15057. [Google Scholar] [CrossRef] [PubMed]
- Pastor-Anglada, M.; Perez-Torras, S. Emerging Roles of Nucleoside Transporters. Front. Pharmacol. 2018, 9, 606. [Google Scholar] [CrossRef]
- Zikanova, M.; Krijt, J.; Hartmannova, H.; Kmoch, S. Preparation of 5-amino-4-imidazole-N-succinocarboxamide ribotide, 5-amino-4-imidazole-N-succinocarboxamide riboside and succinyladenosine, compounds usable in diagnosis and research of adenylosuccinate lyase deficiency. J. Inherit. Metab. Dis. 2005, 28, 493–499. [Google Scholar] [CrossRef] [PubMed]
- Madrova, L.; Krijt, M.; Baresova, V.; Vaclavik, J.; Friedecky, D.; Dobesova, D.; Souckova, O.; Skopova, V.; Adam, T.; Zikanova, M. Mass spectrometric analysis of purine de novo biosynthesis intermediates. PLoS ONE 2018, 13, e0208947. [Google Scholar] [CrossRef]
- Scientific Instrument Services (SIS) by Adaptas Solutions. Available online: https://www.sisweb.com/mstools/isotope.htm (accessed on 28 March 2022).
- Hayes, D.P. Nutritional hormesis. Eur. J. Clin. Nutr. 2007, 61, 147–159. [Google Scholar] [CrossRef]
- Mouchegh, K.; Zikanova, M.; Hoffmann, G.F.; Kretzschmar, B.; Kuhn, T.; Mildenberger, E.; Stoltenburg-Didinger, G.; Krijt, J.; Dvorakova, L.; Honzik, T.; et al. Lethal fetal and early neonatal presentation of adenylosuccinate lyase deficiency: Observation of 6 patients in 4 families. J. Pediatr. 2007, 150, 57–61.e2. [Google Scholar] [CrossRef]
- Bonan, C.D. Ectonucleotidases and nucleotide/nucleoside transporters as pharmacological targets for neurological disorders. CNS Neurol. Disord. Drug Targets 2012, 11, 739–750. [Google Scholar] [CrossRef]
- Keller, K.E.; Doctor, Z.M.; Dwyer, Z.W.; Lee, Y.S. SAICAR induces protein kinase activity of PKM2 that is necessary for sustained proliferative signaling of cancer cells. Mol. Cell 2014, 53, 700–709. [Google Scholar] [CrossRef]
- Boison, D. Adenosine as a neuromodulator in neurological diseases. Curr. Opin. Pharmacol. 2008, 8, 2–7. [Google Scholar] [CrossRef]
- Fumagalli, M.; Lecca, D.; Abbracchio, M.P.; Ceruti, S. Pathophysiological Role of Purines and Pyrimidines in Neurodevelopment: Unveiling New Pharmacological Approaches to Congenital Brain Diseases. Front. Pharmacol. 2017, 8, 941. [Google Scholar] [CrossRef]
- Burnstock, G. Pathophysiology and therapeutic potential of purinergic signaling. Pharmacol. Rev. 2006, 58, 58–86. [Google Scholar] [CrossRef]
- Lara, D.R.; Dall’Igna, O.P.; Ghisolfi, E.S.; Brunstein, M.G. Involvement of adenosine in the neurobiology of schizophrenia and its therapeutic implications. Prog. Neuropsychopharmacol. Biol. Psychiatry 2006, 30, 617–629. [Google Scholar] [CrossRef]
- Ipata, P.L.; Camici, M.; Micheli, V.; Tozz, M.G. Metabolic network of nucleosides in the brain. Curr. Top. Med. Chem. 2011, 11, 909–922. [Google Scholar] [CrossRef]
- Pastor-Anglada, M.; Felipe, A.; Casado, F.J. Transport and mode of action of nucleoside derivatives used in chemical and antiviral therapies. Trends Pharmacol. Sci. 1998, 19, 424–430. [Google Scholar] [CrossRef]
- Douillet, D.C.; Pinson, B.; Ceschin, J.; Hurlimann, H.C.; Saint-Marc, C.; Laporte, D.; Claverol, S.; Konrad, M.; Bonneu, M.; Daignan-Fornier, B. Metabolomics and proteomics identify the toxic form and the associated cellular binding targets of the anti-proliferative drug AICAR. J. Biol. Chem. 2019, 294, 805–815. [Google Scholar] [CrossRef]
- Scudiero, O.; Nigro, E.; Monaco, M.L.; Oliviero, G.; Polito, R.; Borbone, N.; D’Errico, S.; Mayol, L.; Daniele, A.; Piccialli, G. New synthetic AICAR derivatives with enhanced AMPK and ACC activation. J. Enzyme Inhib. Med. Chem. 2016, 31, 748–753. [Google Scholar] [CrossRef]
- Menze, M.A.; Chakraborty, N.; Clavenna, M.; Banerjee, M.; Liu, X.H.; Toner, M.; Hand, S.C. Metabolic preconditioning of cells with AICAR-riboside: Improved cryopreservation and cell-type specific impacts on energetics and proliferation. Cryobiology 2010, 61, 79–88. [Google Scholar] [CrossRef][Green Version]
- Gadalla, A.E.; Pearson, T.; Currie, A.J.; Dale, N.; Hawley, S.A.; Sheehan, M.; Hirst, W.; Michel, A.D.; Randall, A.; Hardie, D.G.; et al. AICA riboside both activates AMP-activated protein kinase and competes with adenosine for the nucleoside transporter in the CA1 region of the rat hippocampus. J. Neurochem. 2004, 88, 1272–1282. [Google Scholar] [CrossRef]
- Young, M.E.; Radda, G.K.; Leighton, B. Activation of glycogen phosphorylase and glycogenolysis in rat skeletal muscle by AICAR—An activator of AMP-activated protein kinase. FEBS Lett. 1996, 382, 43–47. [Google Scholar] [CrossRef]
- Estramareix, B.; David, S. Biosynthesis of thiamine: Origin of the methyl carbon atom of the pyrimidine moiety in Salmonella typhimurium. Biochem. Biophys. Res. Commun. 1986, 134, 1136–1141. [Google Scholar] [CrossRef] [PubMed]
- Ali, I.; Lone, M.N.; Aboul-Enein, H.Y. Imidazoles as potential anticancer agents. MedChemComm 2017, 8, 1742–1773. [Google Scholar] [CrossRef] [PubMed]


| IC50 (μM) | |||||
|---|---|---|---|---|---|
| Metabolite/Cells | HeLa | CAD 5 | HepG2 | K562 | Fibroblasts |
| FGAR | 396 | 292 | 816 | 270 | 385 |
| FGAr | 270 | 181 | 186 | 181 | 323 |
| AIR | 219 | 313 | 264 | 341 | 466 |
| AIr | 157 | 332 [3] | 237 | 337 | 120 [3] |
| SAICAR | 1532 | 1269 | 1396 | 1506 | 2957 |
| SAICAr | 424 | 618 [3] | 509 | 823 | 1804 [3] |
| AICAR | 1726 | 2132 | – † | – † | 1554 |
| AICAr | 785 | 1146 | – † | 902 | 1478 |
Publisher’s Note: MDPI stays neutral with regard to jurisdictional claims in published maps and institutional affiliations. |
© 2022 by the authors. Licensee MDPI, Basel, Switzerland. This article is an open access article distributed under the terms and conditions of the Creative Commons Attribution (CC BY) license (https://creativecommons.org/licenses/by/4.0/).
Share and Cite
Souckova, O.; Skopova, V.; Baresova, V.; Sedlak, D.; Bleyer, A.J.; Kmoch, S.; Zikanova, M. Metabolites of De Novo Purine Synthesis: Metabolic Regulators and Cytotoxic Compounds. Metabolites 2022, 12, 1210. https://doi.org/10.3390/metabo12121210
Souckova O, Skopova V, Baresova V, Sedlak D, Bleyer AJ, Kmoch S, Zikanova M. Metabolites of De Novo Purine Synthesis: Metabolic Regulators and Cytotoxic Compounds. Metabolites. 2022; 12(12):1210. https://doi.org/10.3390/metabo12121210
Chicago/Turabian StyleSouckova, Olga, Vaclava Skopova, Veronika Baresova, David Sedlak, Anthony J. Bleyer, Stanislav Kmoch, and Marie Zikanova. 2022. "Metabolites of De Novo Purine Synthesis: Metabolic Regulators and Cytotoxic Compounds" Metabolites 12, no. 12: 1210. https://doi.org/10.3390/metabo12121210
APA StyleSouckova, O., Skopova, V., Baresova, V., Sedlak, D., Bleyer, A. J., Kmoch, S., & Zikanova, M. (2022). Metabolites of De Novo Purine Synthesis: Metabolic Regulators and Cytotoxic Compounds. Metabolites, 12(12), 1210. https://doi.org/10.3390/metabo12121210