

Isolated Effects of Plasma Freezing versus Thawing on Metabolite Stability

Abstract
1. Introduction
2. Materials and Methods
2.1. Plasma Procurement and Handling
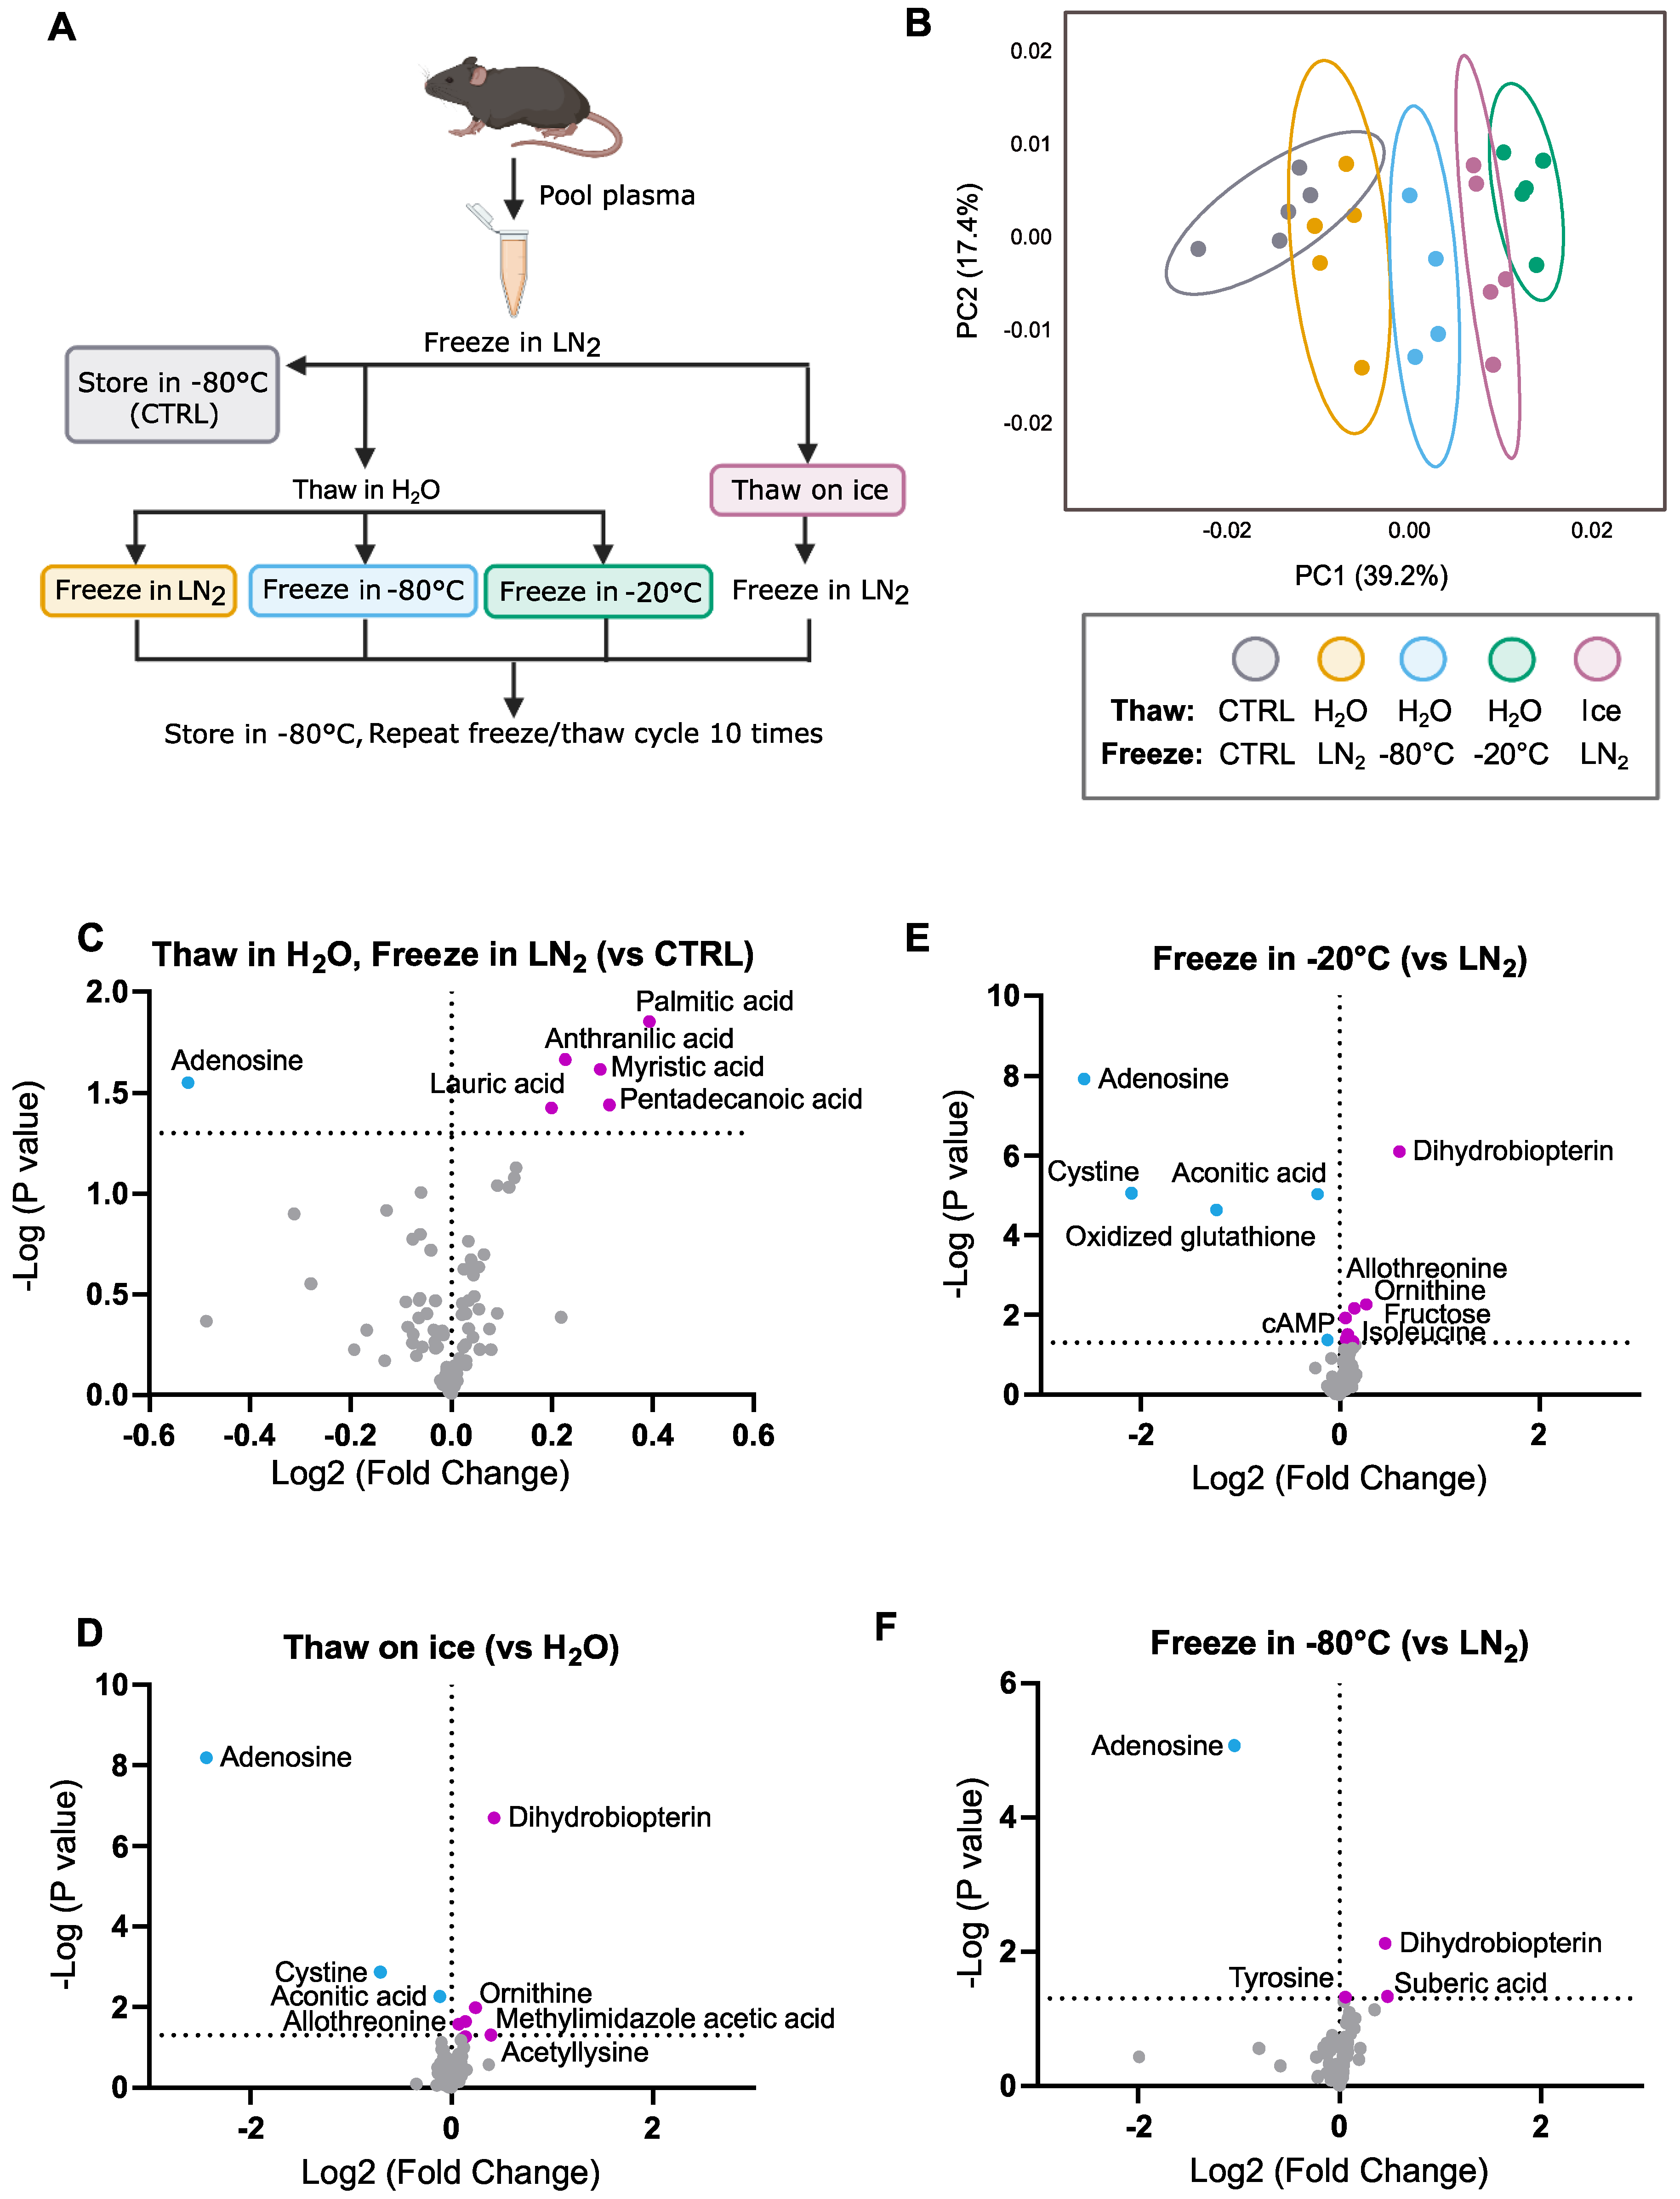
2.2. Freeze–Thaw Conditions
- (1)
- Control: Samples remained in −80 °C storage for 10 days.
- (2)
- Thaw in H2O, Freeze in LN2: Samples were rapidly thawed in an RT (20 °C) water bath with gentle agitation until completely liquid (about 1 min). Samples were then snap-frozen in LN2 and returned to −80 °C storage. This procedure was performed each day for a total of 10 days (10 freeze–thaw cycles).
- (3)
- Thaw in H2O, Freeze in −80 °C: Samples were thawed in an RT water bath with gentle agitation until completely liquid (about 1 min). Samples were then returned to −80 °C storage (1–2 min until frozen). This procedure was performed each day for a total of 10 days (10 freeze–thaw cycles).
- (4)
- Thaw in H2O, Freeze in −20 °C: Samples were thawed in an RT water bath with gentle agitation until completely liquid (about 1 min). Samples were then transferred to −20 °C storage until completely frozen (about 4 h). After samples were frozen, they were moved to −80 °C storage. This procedure was performed each day for a total of 10 days (10 freeze–thaw cycles).
- (5)
- Thaw on Ice, Freeze in LN2: Samples were thawed on ice until completely liquid (~20 min). Samples were then snap-frozen in LN2 and returned to −80 °C storage. This procedure was performed each day for a total of 10 days (10 freeze–thaw cycles).
2.3. Metabolite Extraction
2.4. LC–MS Analysis
2.5. Mass Spectrometry and Data Analysis
2.6. Quantification and Statistical Analysis
3. Results
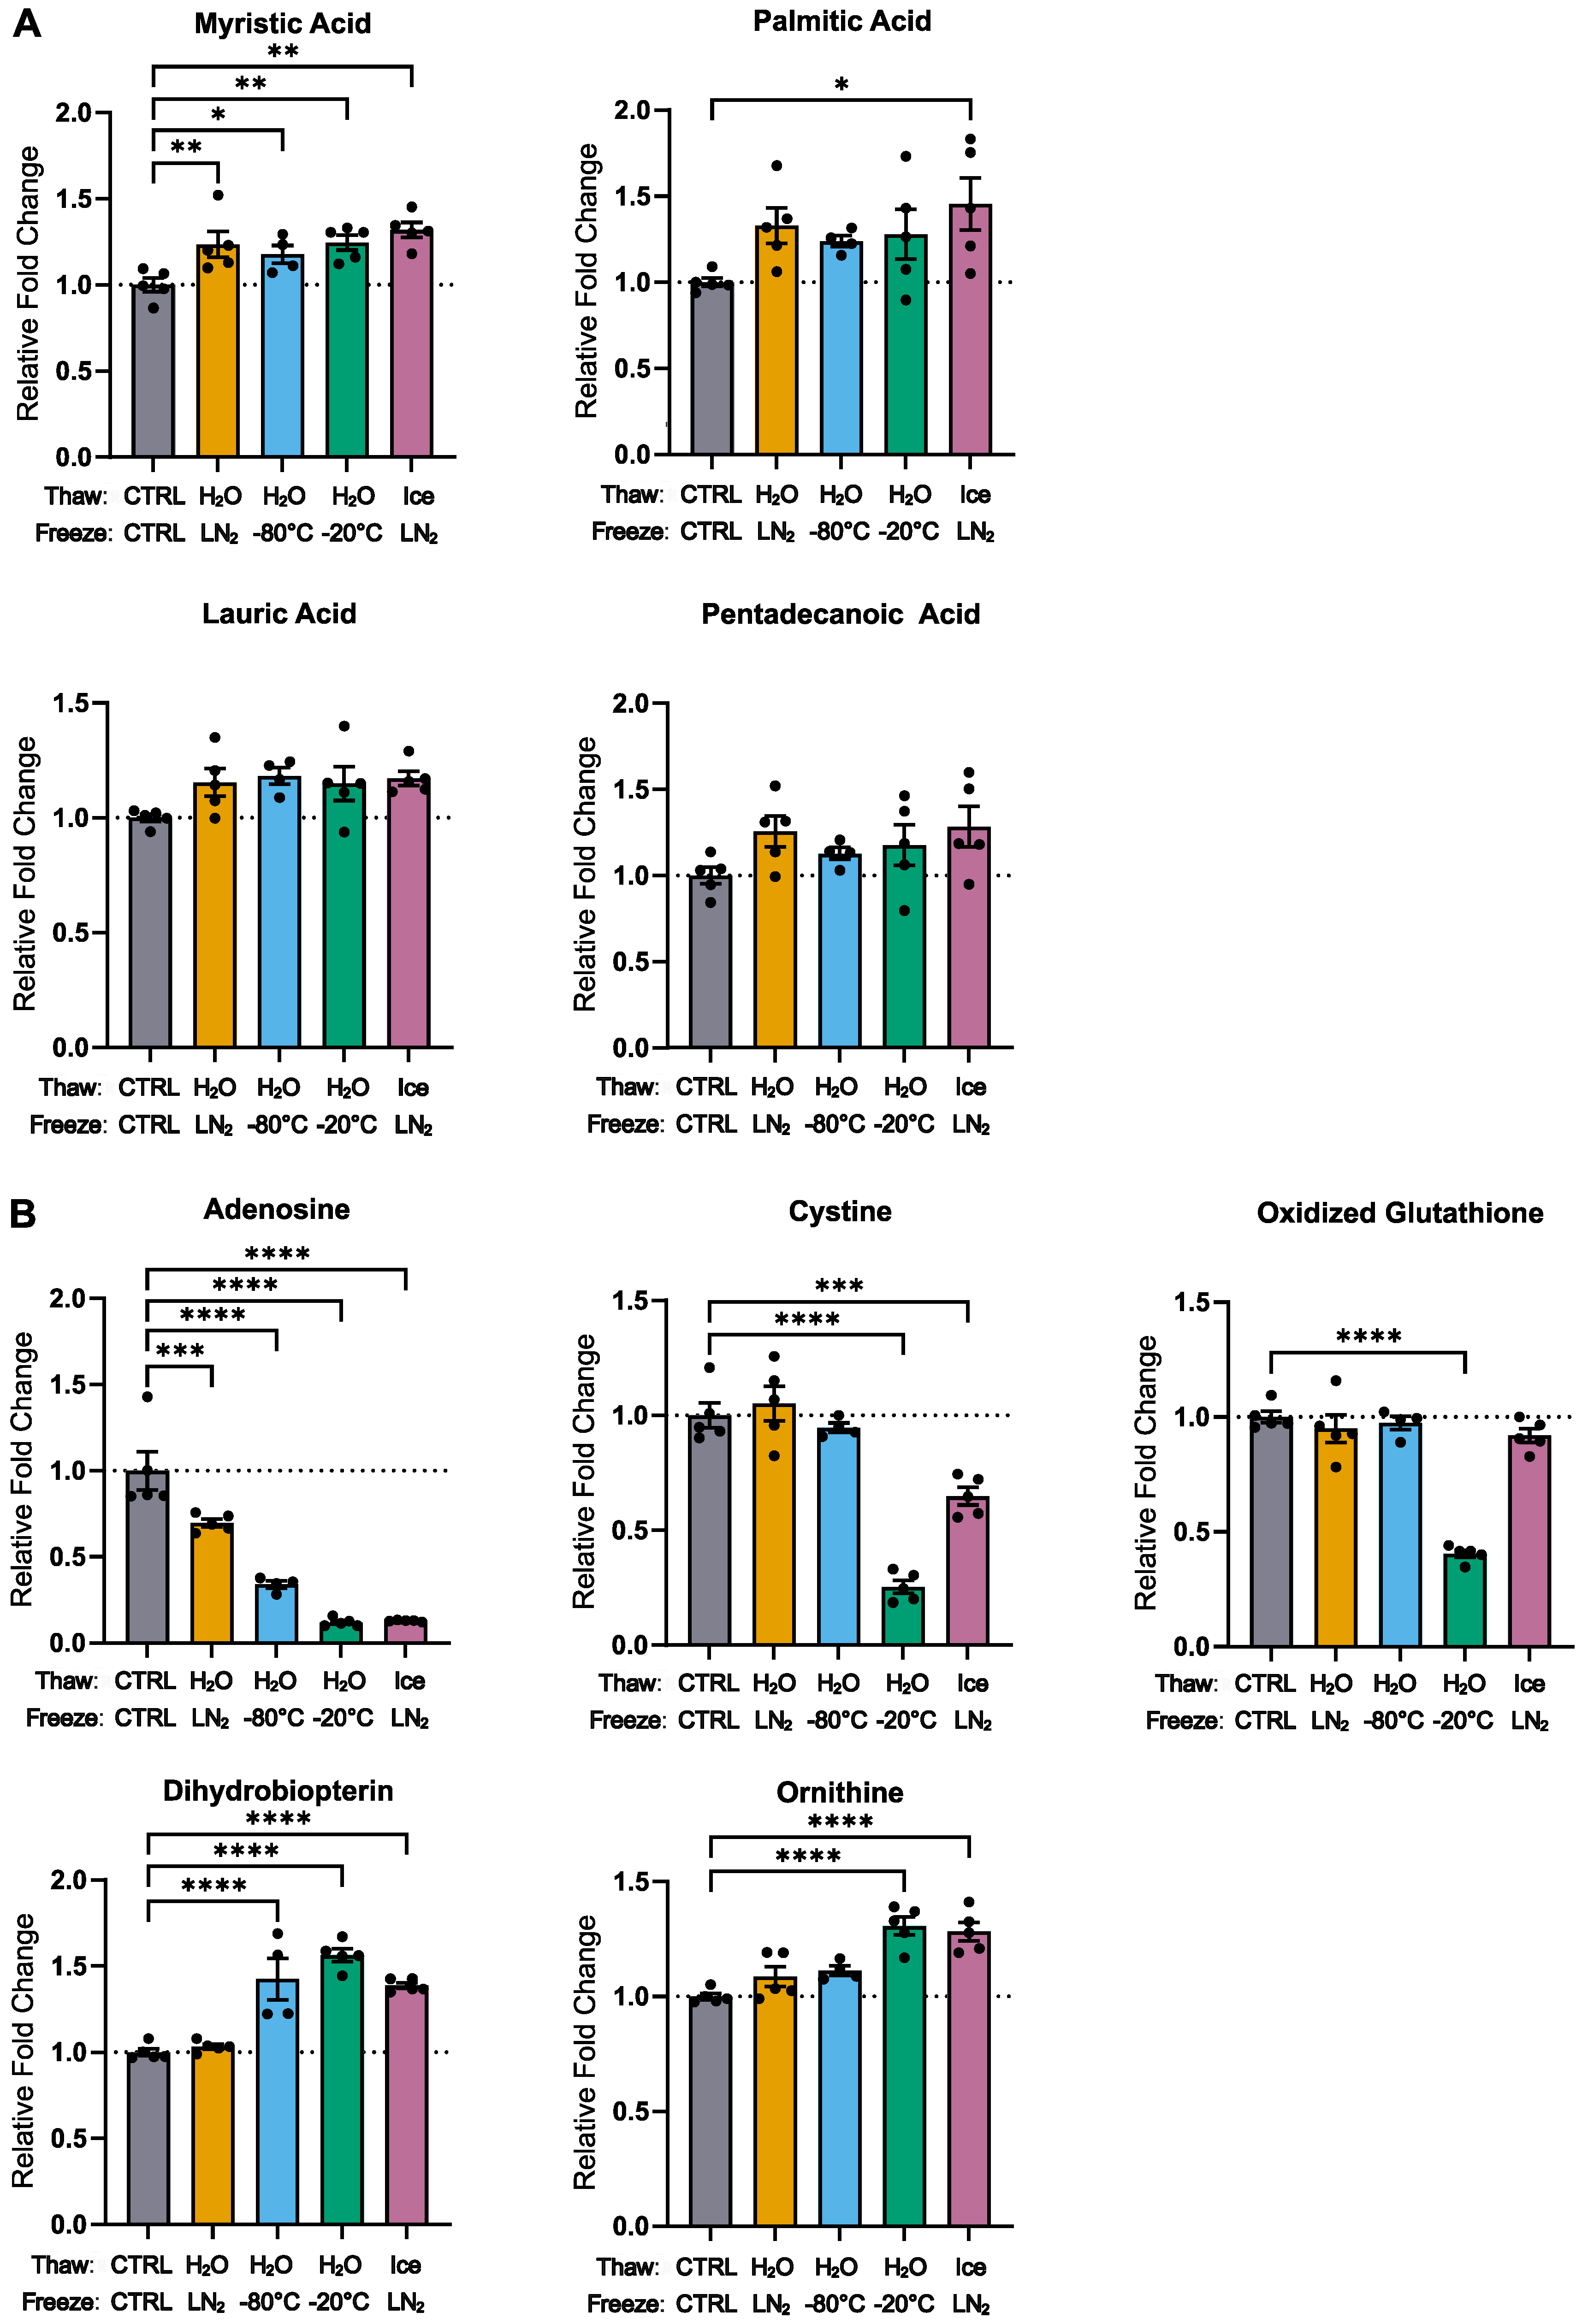
3.1. General Trends
3.2. Effects of 10 Freeze–Thaw Cycles (LN2 Snap-Freeze, RT Water Rapid Thaw) vs. Chronic −80 °C Storage
3.3. Effects of Thawing on Ice vs. Water (10 Cycles, LN2 Snap-Freeze)
3.4. Effects of Freezing in −20 °C vs. LN2 (10 Cycles, RT Water Rapid Thaw)
3.5. Effects of Freezing in −80 °C vs. LN2 (10 Cycles, RT Water Rapid Thaw)
4. Discussion
5. Conclusions
Supplementary Materials
Author Contributions
Funding
Institutional Review Board Statement
Informed Consent Statement
Data Availability Statement
Acknowledgments
Conflicts of Interest
References
- Comstock, G.W.; Burke, A.E.; Norkus, E.P.; Gordon, G.B.; Hoffman, S.C.; Helzlsouer, K.J. Effects of repeated freeze-thaw cycles on concentrations of cholesterol, micronutrients, and hormones in human plasma and serum. Clin. Chem. 2001, 47, 139–142. [Google Scholar] [CrossRef] [PubMed]
- Torell, F.; Bennett, K.; Rannar, S.; Lundstedt-Enkel, K.; Lundstedt, T.; Trygg, J. The effects of thawing on the plasma metabolome: Evaluating differences between thawed plasma and multi-organ samples. Metabolomics 2017, 13, 66. [Google Scholar] [CrossRef] [PubMed]
- Deprez, S.; Sweatman, B.C.; Connor, S.C.; Haselden, J.N.; Waterfield, C.J. Optimisation of collection, storage and preparation of rat plasma for 1H NMR spectroscopic analysis in toxicology studies to determine inherent variation in biochemical profiles. J. Pharm. Biomed. Anal. 2002, 30, 1297–1310. [Google Scholar] [CrossRef]
- Keshavan, A.; Heslegrave, A.; Zetterberg, H.; Schott, J.M. Stability of blood-based biomarkers of Alzheimer’s disease over multiple freeze-thaw cycles. Alzheimers Dement. 2018, 10, 448–451. [Google Scholar] [CrossRef]
- Yin, P.; Peter, A.; Franken, H.; Zhao, X.; Neukamm, S.S.; Rosenbaum, L.; Lucio, M.; Zell, A.; Häring, H.-U.; Xu, G.; et al. Preanalytical aspects and sample quality assessment in metabolomics studies of human blood. Clin. Chem. 2013, 59, 833–845. [Google Scholar] [CrossRef] [PubMed]
- An, Z.; Shi, C.; Li, P.; Liu, L. Stability of amino acids and related amines in human serum under different preprocessing and pre-storage conditions based on iTRAQ((R))-LC-MS/MS. Biol. Open 2021, 10, bio055020. [Google Scholar] [CrossRef]
- Chen, D.; Han, W.; Huan, T.; Li, L.; Li, L. Effects of Freeze-Thaw Cycles of Blood Samples on High-Coverage Quantitative Metabolomics. Anal. Chem. 2020, 92, 9265–9272. [Google Scholar] [CrossRef]
- Wang, F.; Debik, J.; Andreassen, T.; Euceda, L.R.; Haukaas, T.H.; Cannet, C.; Schäfer, H.; Bathen, T.F.; Giskeødegård, G.F. Effect of Repeated Freeze-Thaw Cycles on NMR-Measured Lipoproteins and Metabolites in Biofluids. J. Proteome Res. 2019, 18, 3681–3688. [Google Scholar] [CrossRef]
- Anton, G.; Wilson, R.; Yu, Z.H.; Prehn, C.; Zukunft, S.; Adamski, J.; Heir, M.; Meisinger, C.; Römisch-Margl, W.; Wang-Sattler, R.; et al. Pre-analytical sample quality: Metabolite ratios as an intrinsic marker for prolonged room temperature exposure of serum samples. PLoS ONE 2015, 10, e0121495. [Google Scholar] [CrossRef]
- Breier, M.; Wahl, S.; Prehn, C.; Fugmann, M.; Ferrari, U.; Weise, M.; Banning, F.; Seissler, J.; Grallert, H.; Adamski, J.; et al. Targeted metabolomics identifies reliable and stable metabolites in human serum and plasma samples. PLoS ONE 2014, 9, e89728. [Google Scholar] [CrossRef]
- Pinto, J.; Domingues, M.R.; Galhano, E.; Pita, C.; Mdo, C.A.; Carreira, I.M.; Gil, A.M. Human plasma stability during handling and storage: Impact on NMR metabolomics. Analyst 2014, 139, 1168–1177. [Google Scholar] [CrossRef] [PubMed]
- Cuhadar, S.; Koseoglu, M.; Atay, A.; Dirican, A. The effect of storage time and freeze-thaw cycles on the stability of serum samples. Biochem. Med. 2013, 23, 70–77. [Google Scholar] [CrossRef] [PubMed]
- Fliniaux, O.; Gaillard, G.; Lion, A.; Cailleu, D.; Mesnard, F.; Betsou, F. Influence of common preanalytical variations on the metabolic profile of serum samples in biobanks. J. Biomol. NMR 2011, 51, 457–465. [Google Scholar] [CrossRef]
- Wood, J.T.; Williams, J.S.; Pandarinathan, L.; Courville, A.; Keplinger, M.R.; Janero, D.R.; Vouros, P.; Makriyannis, A.; Lammi-Keefe, C.J. Comprehensive profiling of the human circulating endocannabinoid metabolome: Clinical sampling and sample storage parameters. Clin. Chem. Lab. Med. 2008, 46, 1289–1295. [Google Scholar] [CrossRef] [PubMed]
- Teahan, O.; Gamble, S.; Holmes, E.; Waxman, J.; Nicholson, J.K.; Bevan, C.; Keun, H.C. Impact of analytical bias in metabonomic studies of human blood serum and plasma. Anal. Chem. 2006, 78, 4307–4318. [Google Scholar] [CrossRef] [PubMed]
- Mitchell, B.L.; Yasui, Y.; Li, C.I.; Fitzpatrick, A.L.; Lampe, P.D. Impact of freeze-thaw cycles and storage time on plasma samples used in mass spectrometry based biomarker discovery projects. Cancer Inf. 2005, 1, 98–104. [Google Scholar] [CrossRef]
- Li, B.; Tang, J.; Yang, Q.; Li, S.; Cui, X.; Li, Y.; Chen, Y.; Xue, W.; Li, X.; Zhu, F. NOREVA: Normalization and evaluation of MS-based metabolomics data. Nucleic Acids Res. 2017, 45, W162–W170. [Google Scholar] [CrossRef]
- Pang, Z.; Chong, J.; Zhou, G.; de Morais, D.A.L.; Chang, L.; Barrette, M.; Gauthier, C.; Jacques, P.-É.; Li, S.; Xia, J. MetaboAnalyst 5.0: Narrowing the gap between raw spectra and functional insights. Nucleic Acids Res. 2021, 49, W388–W396. [Google Scholar] [CrossRef]
- Metsalu, T.; Vilo, J. ClustVis: A web tool for visualizing clustering of multivariate data using Principal Component Analysis and heatmap. Nucleic Acids Res. 2015, 43, W566–W570. [Google Scholar] [CrossRef]
- Hamilton, J.A. Medium-chain fatty acid binding to albumin and transfer to phospholipid bilayers. Proc. Natl. Acad. Sci. USA 1989, 86, 2663–2667. [Google Scholar] [CrossRef]
- Hamilton, J.A.; Cistola, D.P. Transfer of oleic acid between albumin and phospholipid vesicles. Proc. Natl. Acad. Sci. USA 1986, 83, 82–86. [Google Scholar] [CrossRef] [PubMed]
- Pikal-Cleland, K.A.; Rodriguez-Hornedo, N.; Amidon, G.L.; Carpenter, J.F. Protein denaturation during freezing and thawing in phosphate buffer systems: Monomeric and tetrameric beta-galactosidase. Arch. Biochem. Biophys. 2000, 384, 398–406. [Google Scholar] [CrossRef] [PubMed]
- Franks, F. Biophysics and Biochemistry at Low Temperatures; Cambridge University Press: Cambridge, UK, 1985; p. 210. [Google Scholar]
- Roessl, U.; Leitgeb, S.; Nidetzky, B. Protein freeze concentration and micro-segregation analysed in a temperature-controlled freeze container. Biotechnol. Rep. 2015, 6, 108–111. [Google Scholar] [CrossRef] [PubMed]
- Sun, M.; Hines, N.; Scerbo, D.; Buchanan, J.; Wu, C.; Eyck, P.T.; Zepada-Orozco, D.; Taylor, E.B.; Jalal, D.I. Allopurinol Lowers Serum Urate but Does Not Reduce Oxidative Stress in CKD. Antioxidants 2022, 11, 1297. [Google Scholar] [CrossRef] [PubMed]


| Study Citation | Analytical Method | of Peaks/Metabolites Analyzed | of Freeze–Thaw Cycles (1 = Control) | Thawing in Water | Freezing in LN2 | Varied Thawing and Freezing | ||||||
|---|---|---|---|---|---|---|---|---|---|---|---|---|
| Water Thaw, LN2 Freeze | Water Thaw, −20 °C Freeze | Water Thaw, −80 °C Freeze | Ice Thaw, LN2 Freeze | RT Thaw, LN2 Freeze | Ice Thaw, −80 °C Freeze | RT Thaw, −20 °C Freeze | RT Thaw, −40 °C Freeze | RT Thaw, −80 °C Freeze | ||||
| This study | LC–MS | 87 | 1, 10 | X | X | X | X | |||||
| An et al. 2021 [6] | iTRAQ-LC–MS/MS | 30 | 1, 2, 3, 4 | X | ||||||||
| Chen et al. 2020 [7] | LC–MS/MS | 150 | 1, 2, 3, 4, 5 | X | ||||||||
| Wang et al. 2019 [8] | NMR | 20 | 1, 2, 3, 4, 5 | X | ||||||||
| Keshavan et al. 2018 [4] | Assay | 4 | 1, 2, 3, 4 | X | ||||||||
| Torell et al. 2017 [2] | GC-TOF-MS | 46 | 1, 2 | X | ||||||||
| Anton et al. 2015 [9] | FIA-ESI-MS/MS | 127 | 1, 2, 3, 4 | X | X | X | X | |||||
| Breier et al. 2014 [10] | ESI-LC–MS/MS | 188 | 1, 2, 3 | ?1 | ?1 | |||||||
| Pinto et al. 2014 [11] | NMR | 8 * | 1, 2, 3, 4, 5 | X | ||||||||
| Cuhadar et al. 2013 [12] | Assay | 17 | 1, 2, 3, 4, 5, 6, 7, 8, 9, 10 | X | ||||||||
| Yin et al. 2013 [5] | UPLC-qTOF-MS | 706 | 1, 2, 4 | X | ||||||||
| Fliniaux et al. 2011 [13] | NMR | 8 * | 1, 5, 10 | X | ||||||||
| Wood et al. 2008 [14] | LC–MS | 15 | 1, 2, 3, 4 | ?2 | ?2 | |||||||
| Teahan et al. 2006 [15] | NMR | 10 * | 0, 1 3 | X | ||||||||
| Mitchell et al. 2005 [16] | C-MALDI-TOF-MS | 2153 ** | 1, 2, 3, 4, 5 | X 4 | ||||||||
| Deprez et al. 2002 [3] | NMR | 30 * | 0, 1 3 | X | ||||||||
| Comstock et al. 2001 [1] | Assay | 22 | 1, 2, 3, 4, 6, 10 | X 4 | ||||||||
Publisher’s Note: MDPI stays neutral with regard to jurisdictional claims in published maps and institutional affiliations. |
© 2022 by the authors. Licensee MDPI, Basel, Switzerland. This article is an open access article distributed under the terms and conditions of the Creative Commons Attribution (CC BY) license (https://creativecommons.org/licenses/by/4.0/).
Share and Cite
Buchanan, J.L.; Tormes Vaquerano, J.; Taylor, E.B. Isolated Effects of Plasma Freezing versus Thawing on Metabolite Stability. Metabolites 2022, 12, 1098. https://doi.org/10.3390/metabo12111098
Buchanan JL, Tormes Vaquerano J, Taylor EB. Isolated Effects of Plasma Freezing versus Thawing on Metabolite Stability. Metabolites. 2022; 12(11):1098. https://doi.org/10.3390/metabo12111098
Chicago/Turabian StyleBuchanan, Jane L., Jovan Tormes Vaquerano, and Eric B. Taylor. 2022. "Isolated Effects of Plasma Freezing versus Thawing on Metabolite Stability" Metabolites 12, no. 11: 1098. https://doi.org/10.3390/metabo12111098
APA StyleBuchanan, J. L., Tormes Vaquerano, J., & Taylor, E. B. (2022). Isolated Effects of Plasma Freezing versus Thawing on Metabolite Stability. Metabolites, 12(11), 1098. https://doi.org/10.3390/metabo12111098