
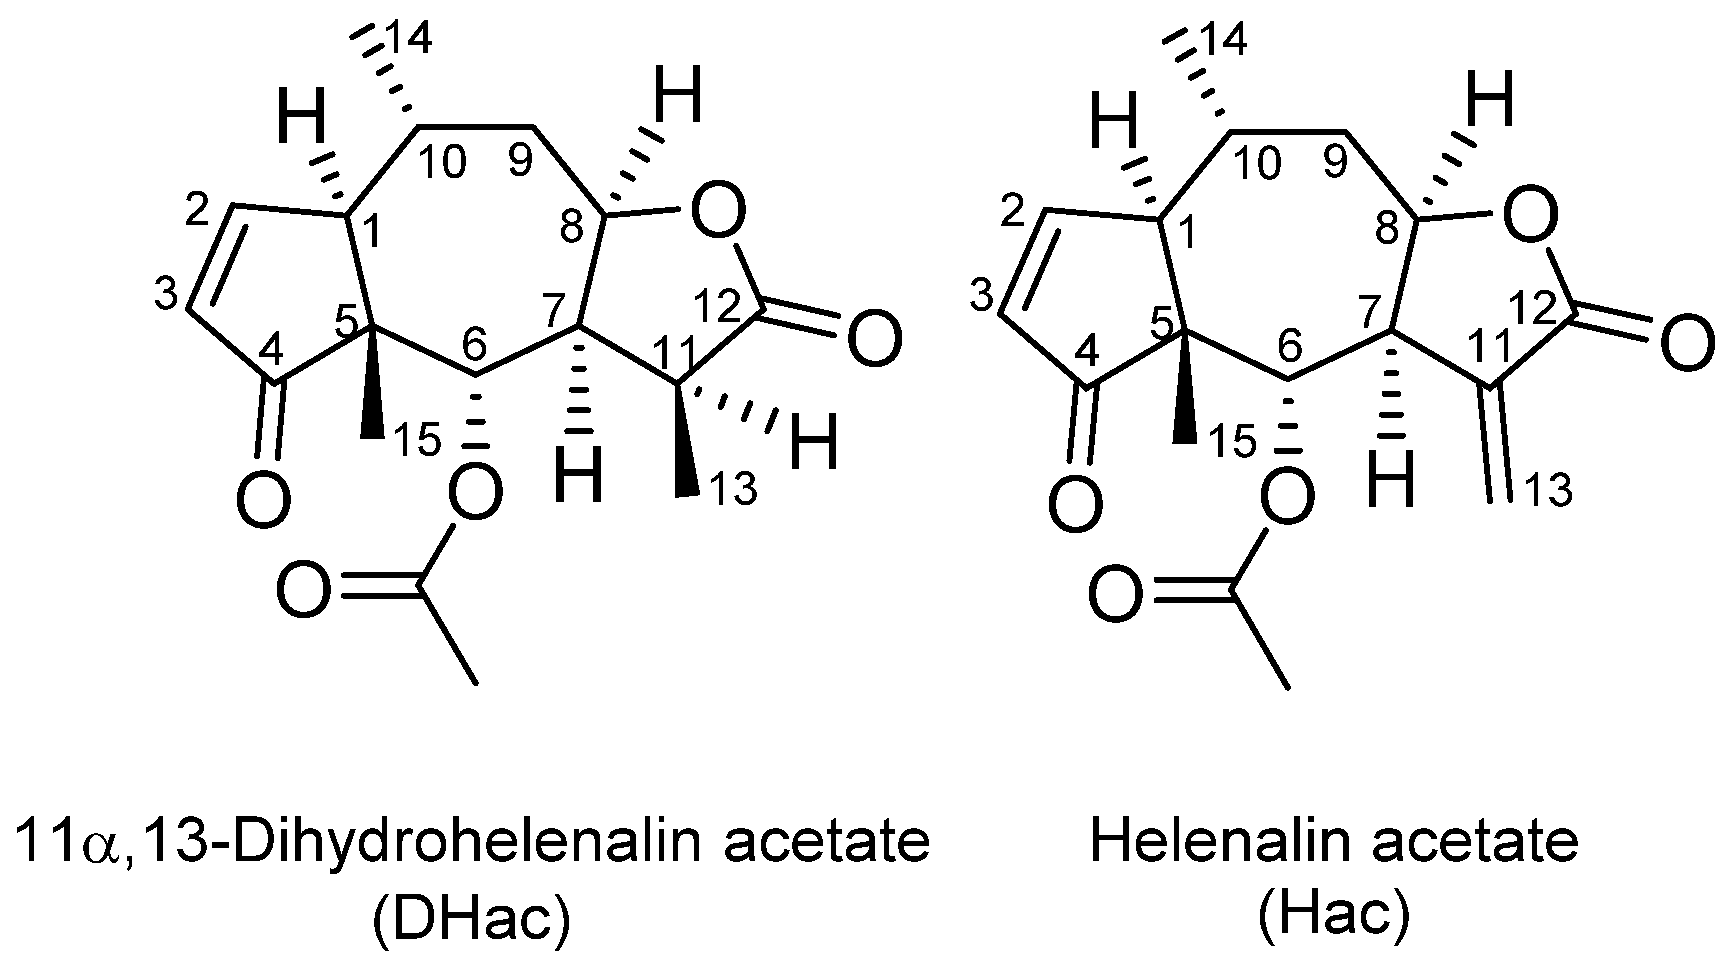
In Vitro Metabolism of Helenalin Acetate and 11α,13-Dihydrohelenalin Acetate: Natural Sesquiterpene Lactones from Arnica

 , , and
Abstract
:
1. Introduction
2. Results and Discussion
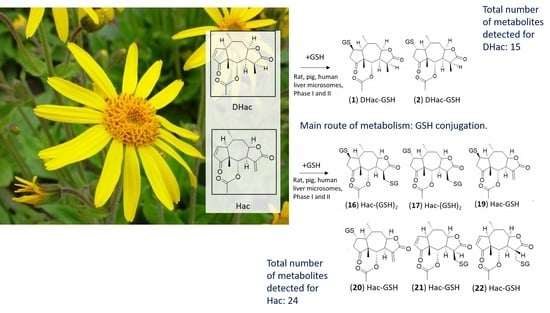
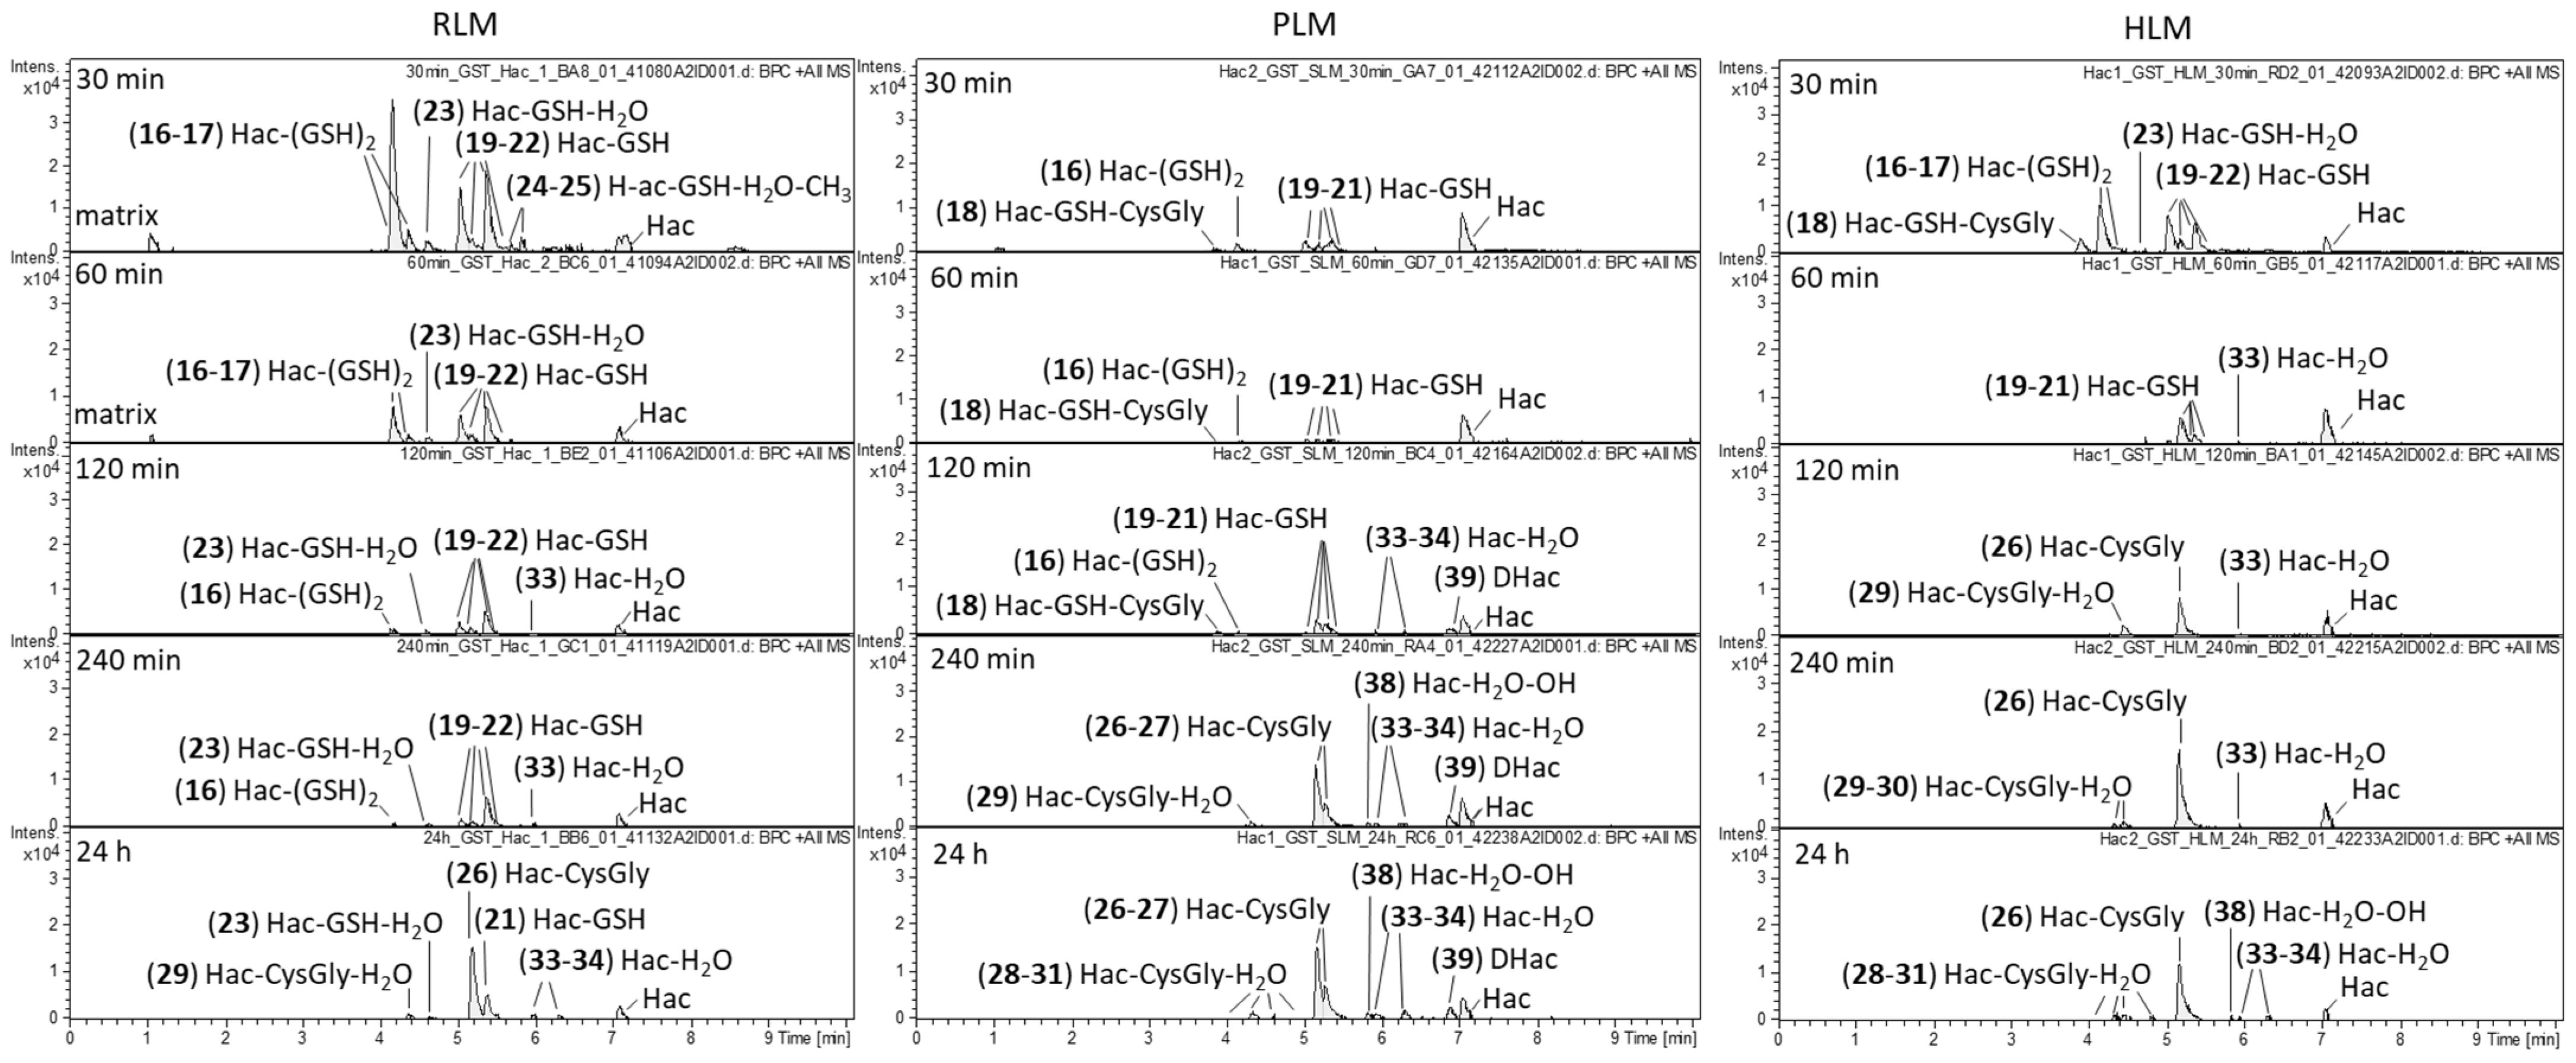
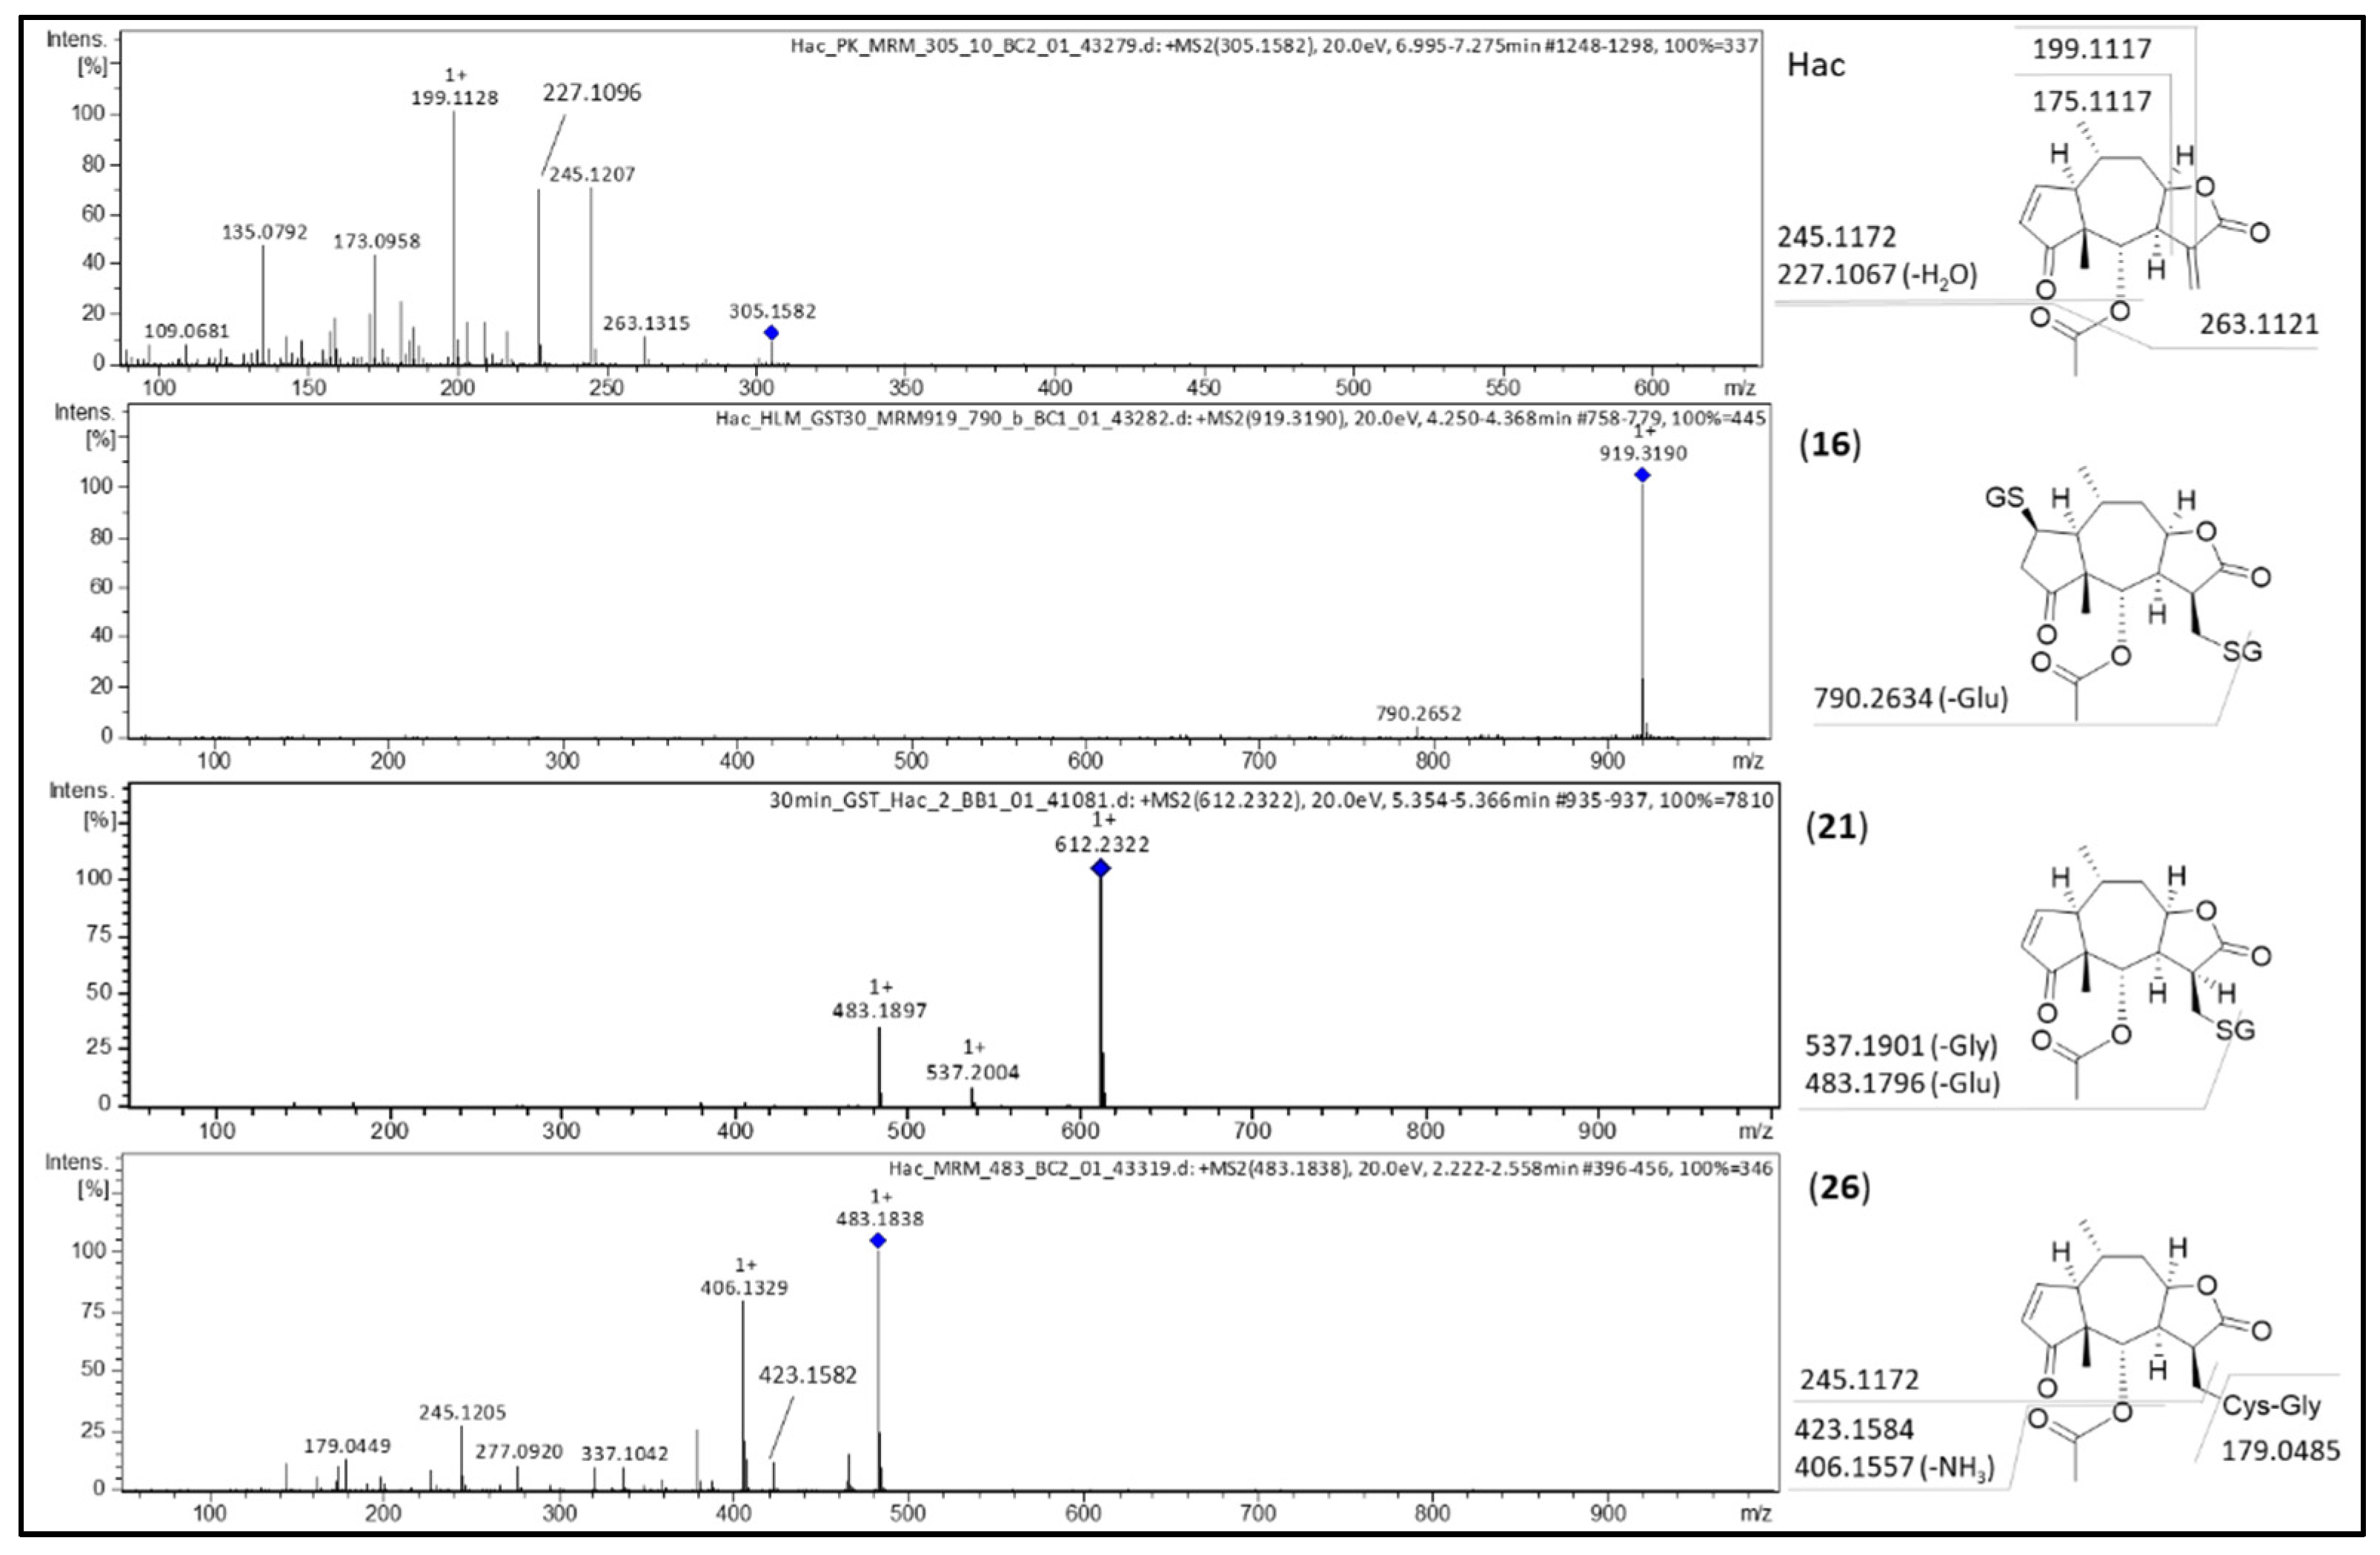
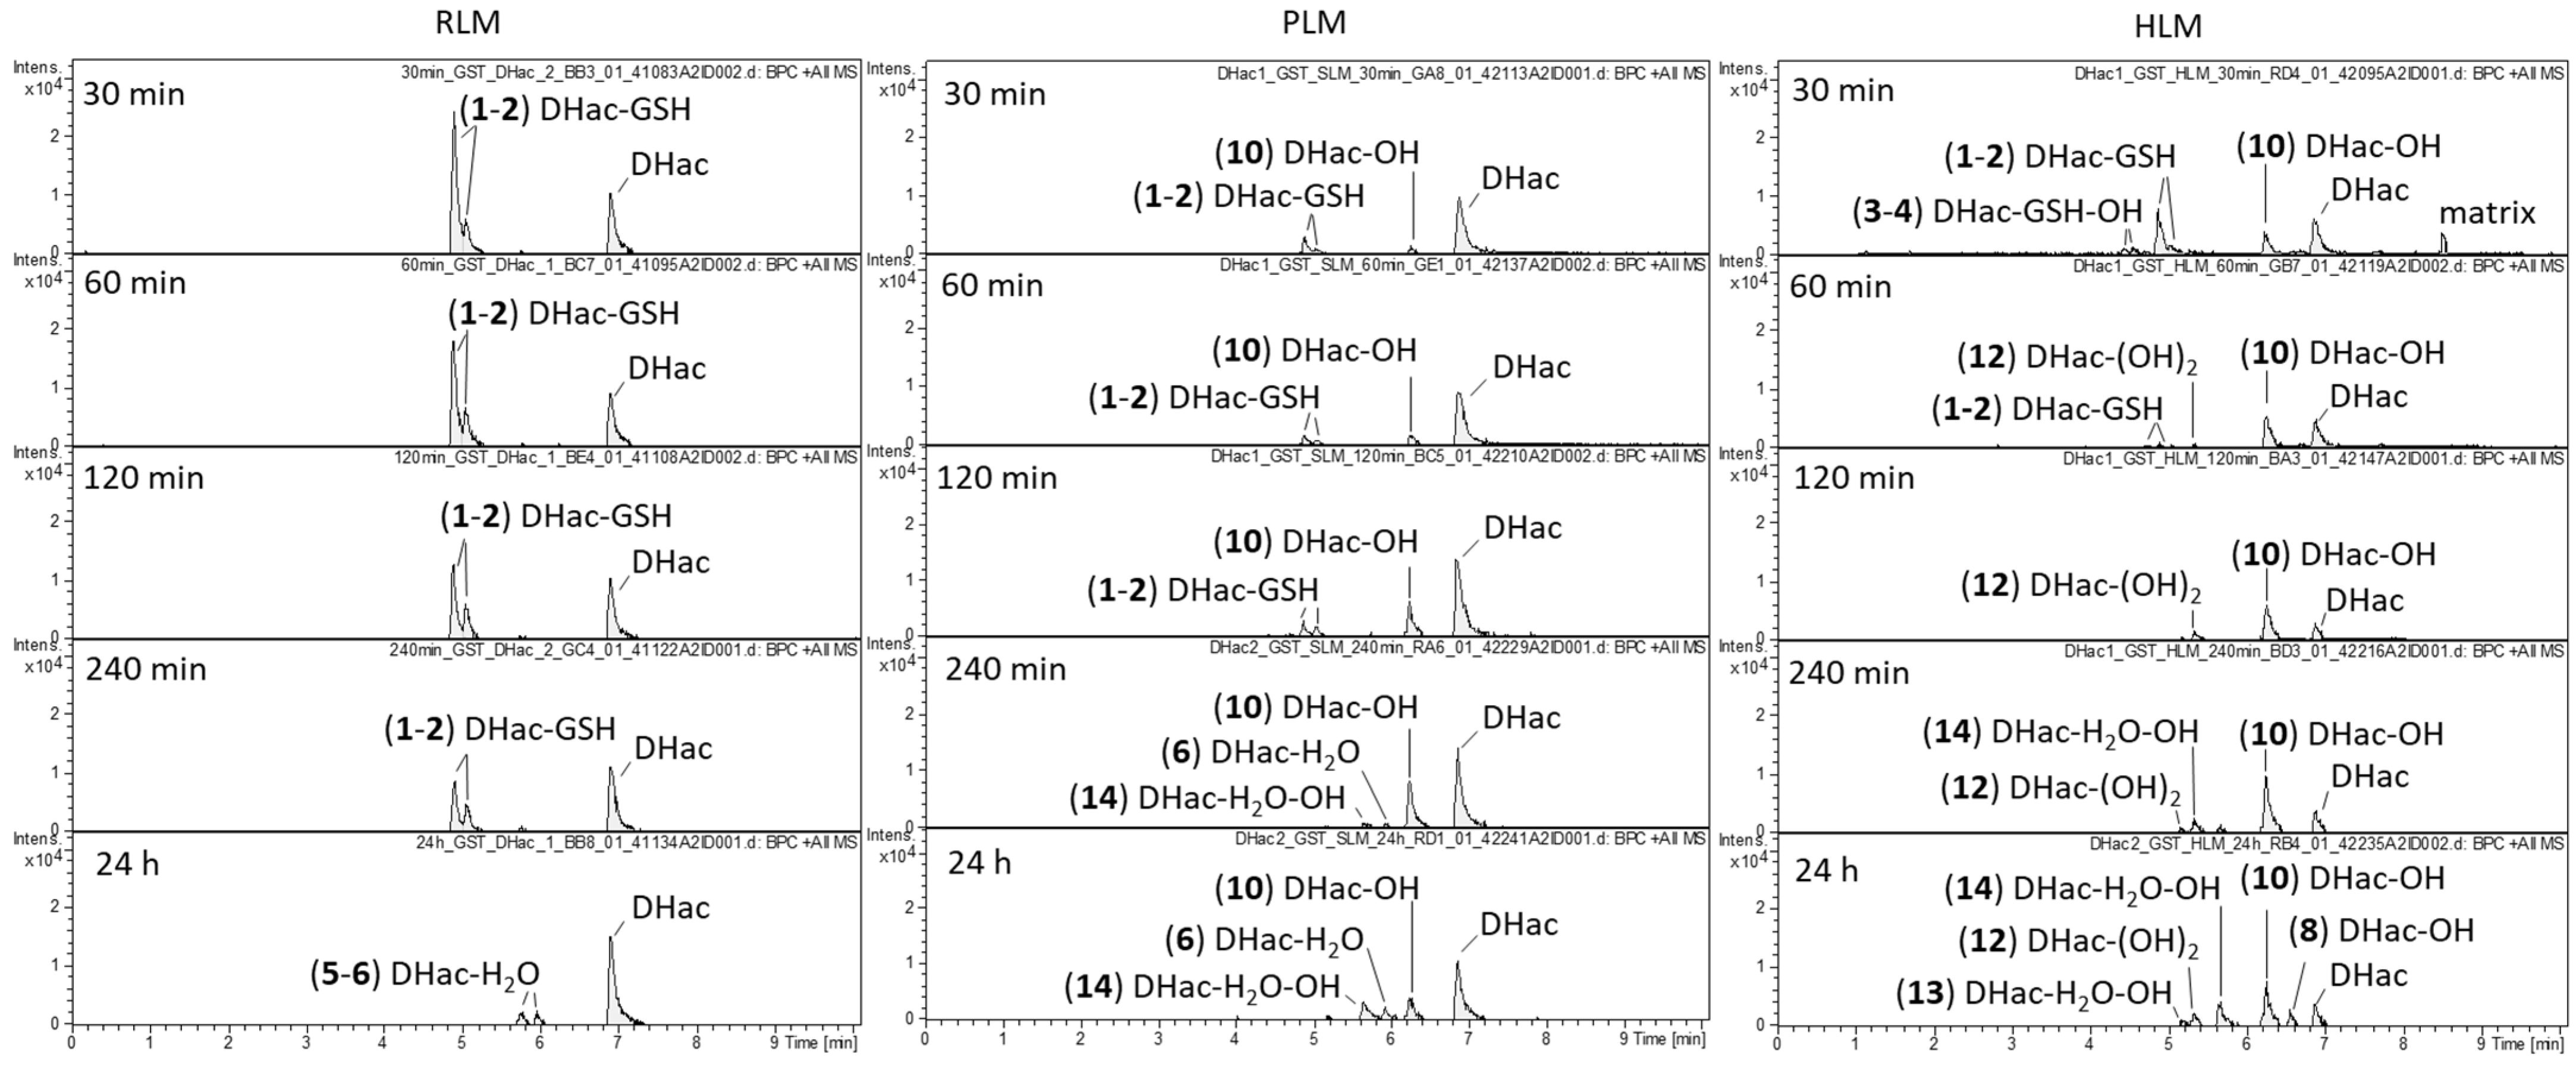
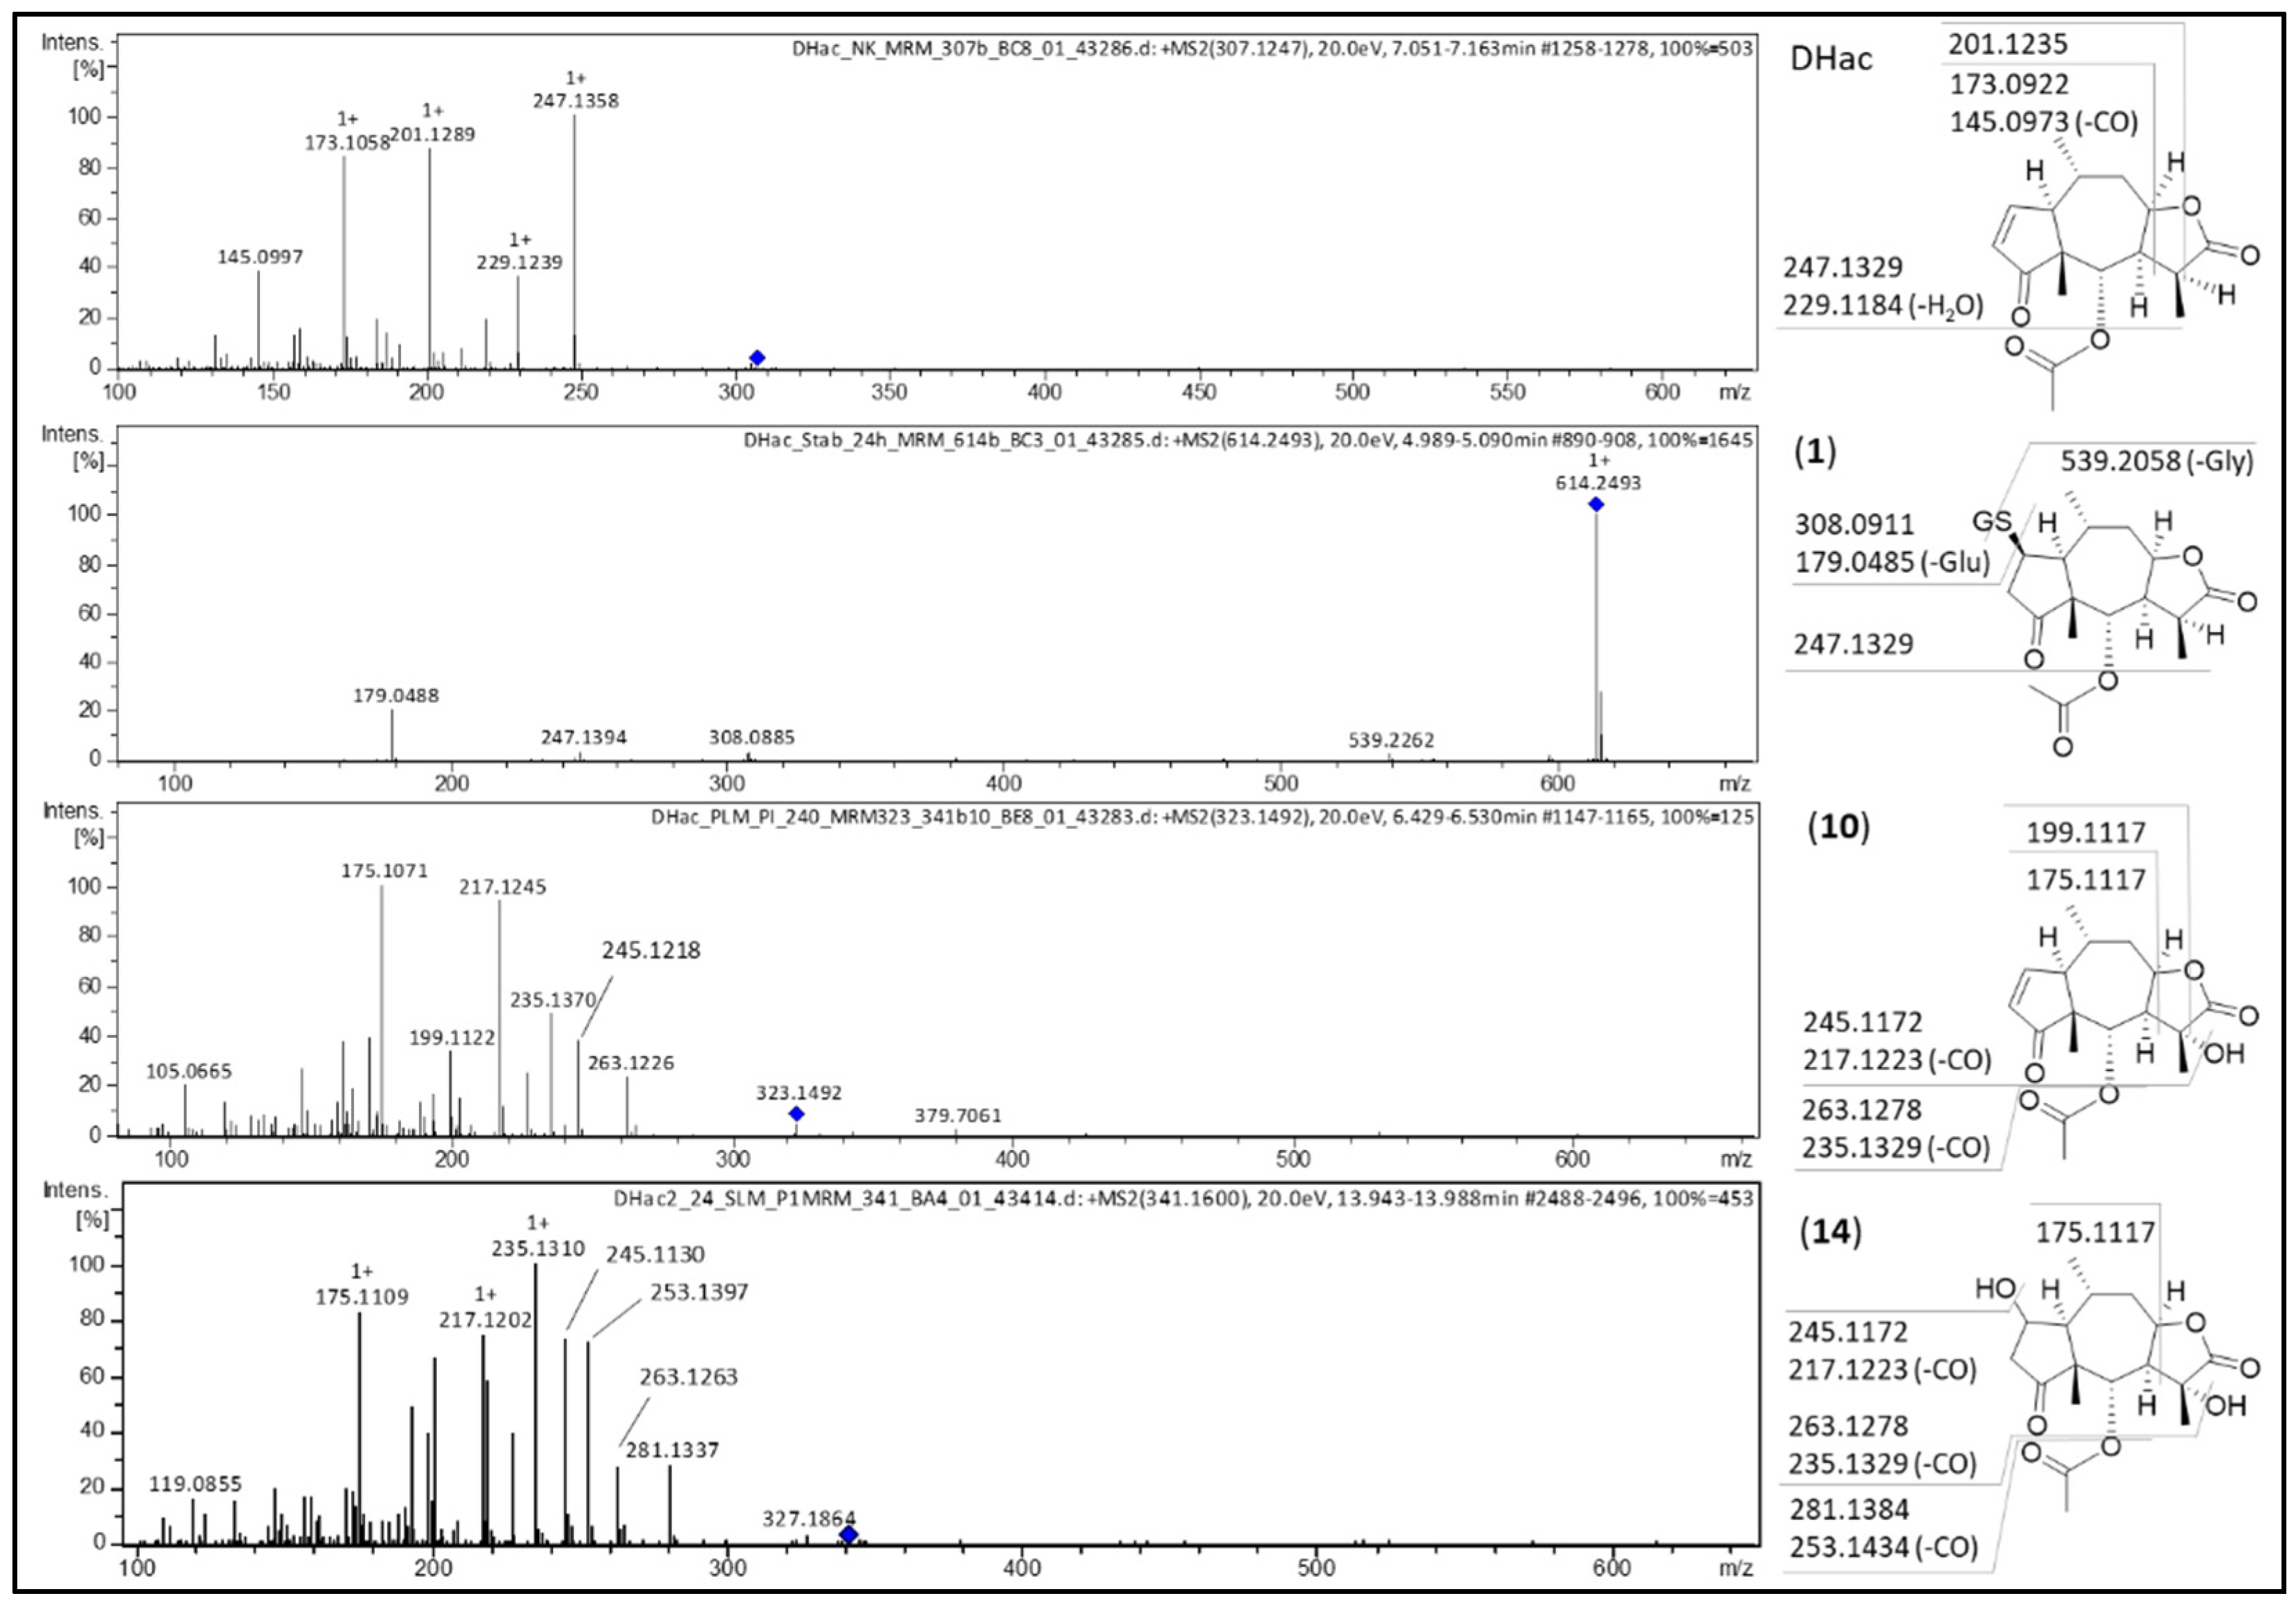
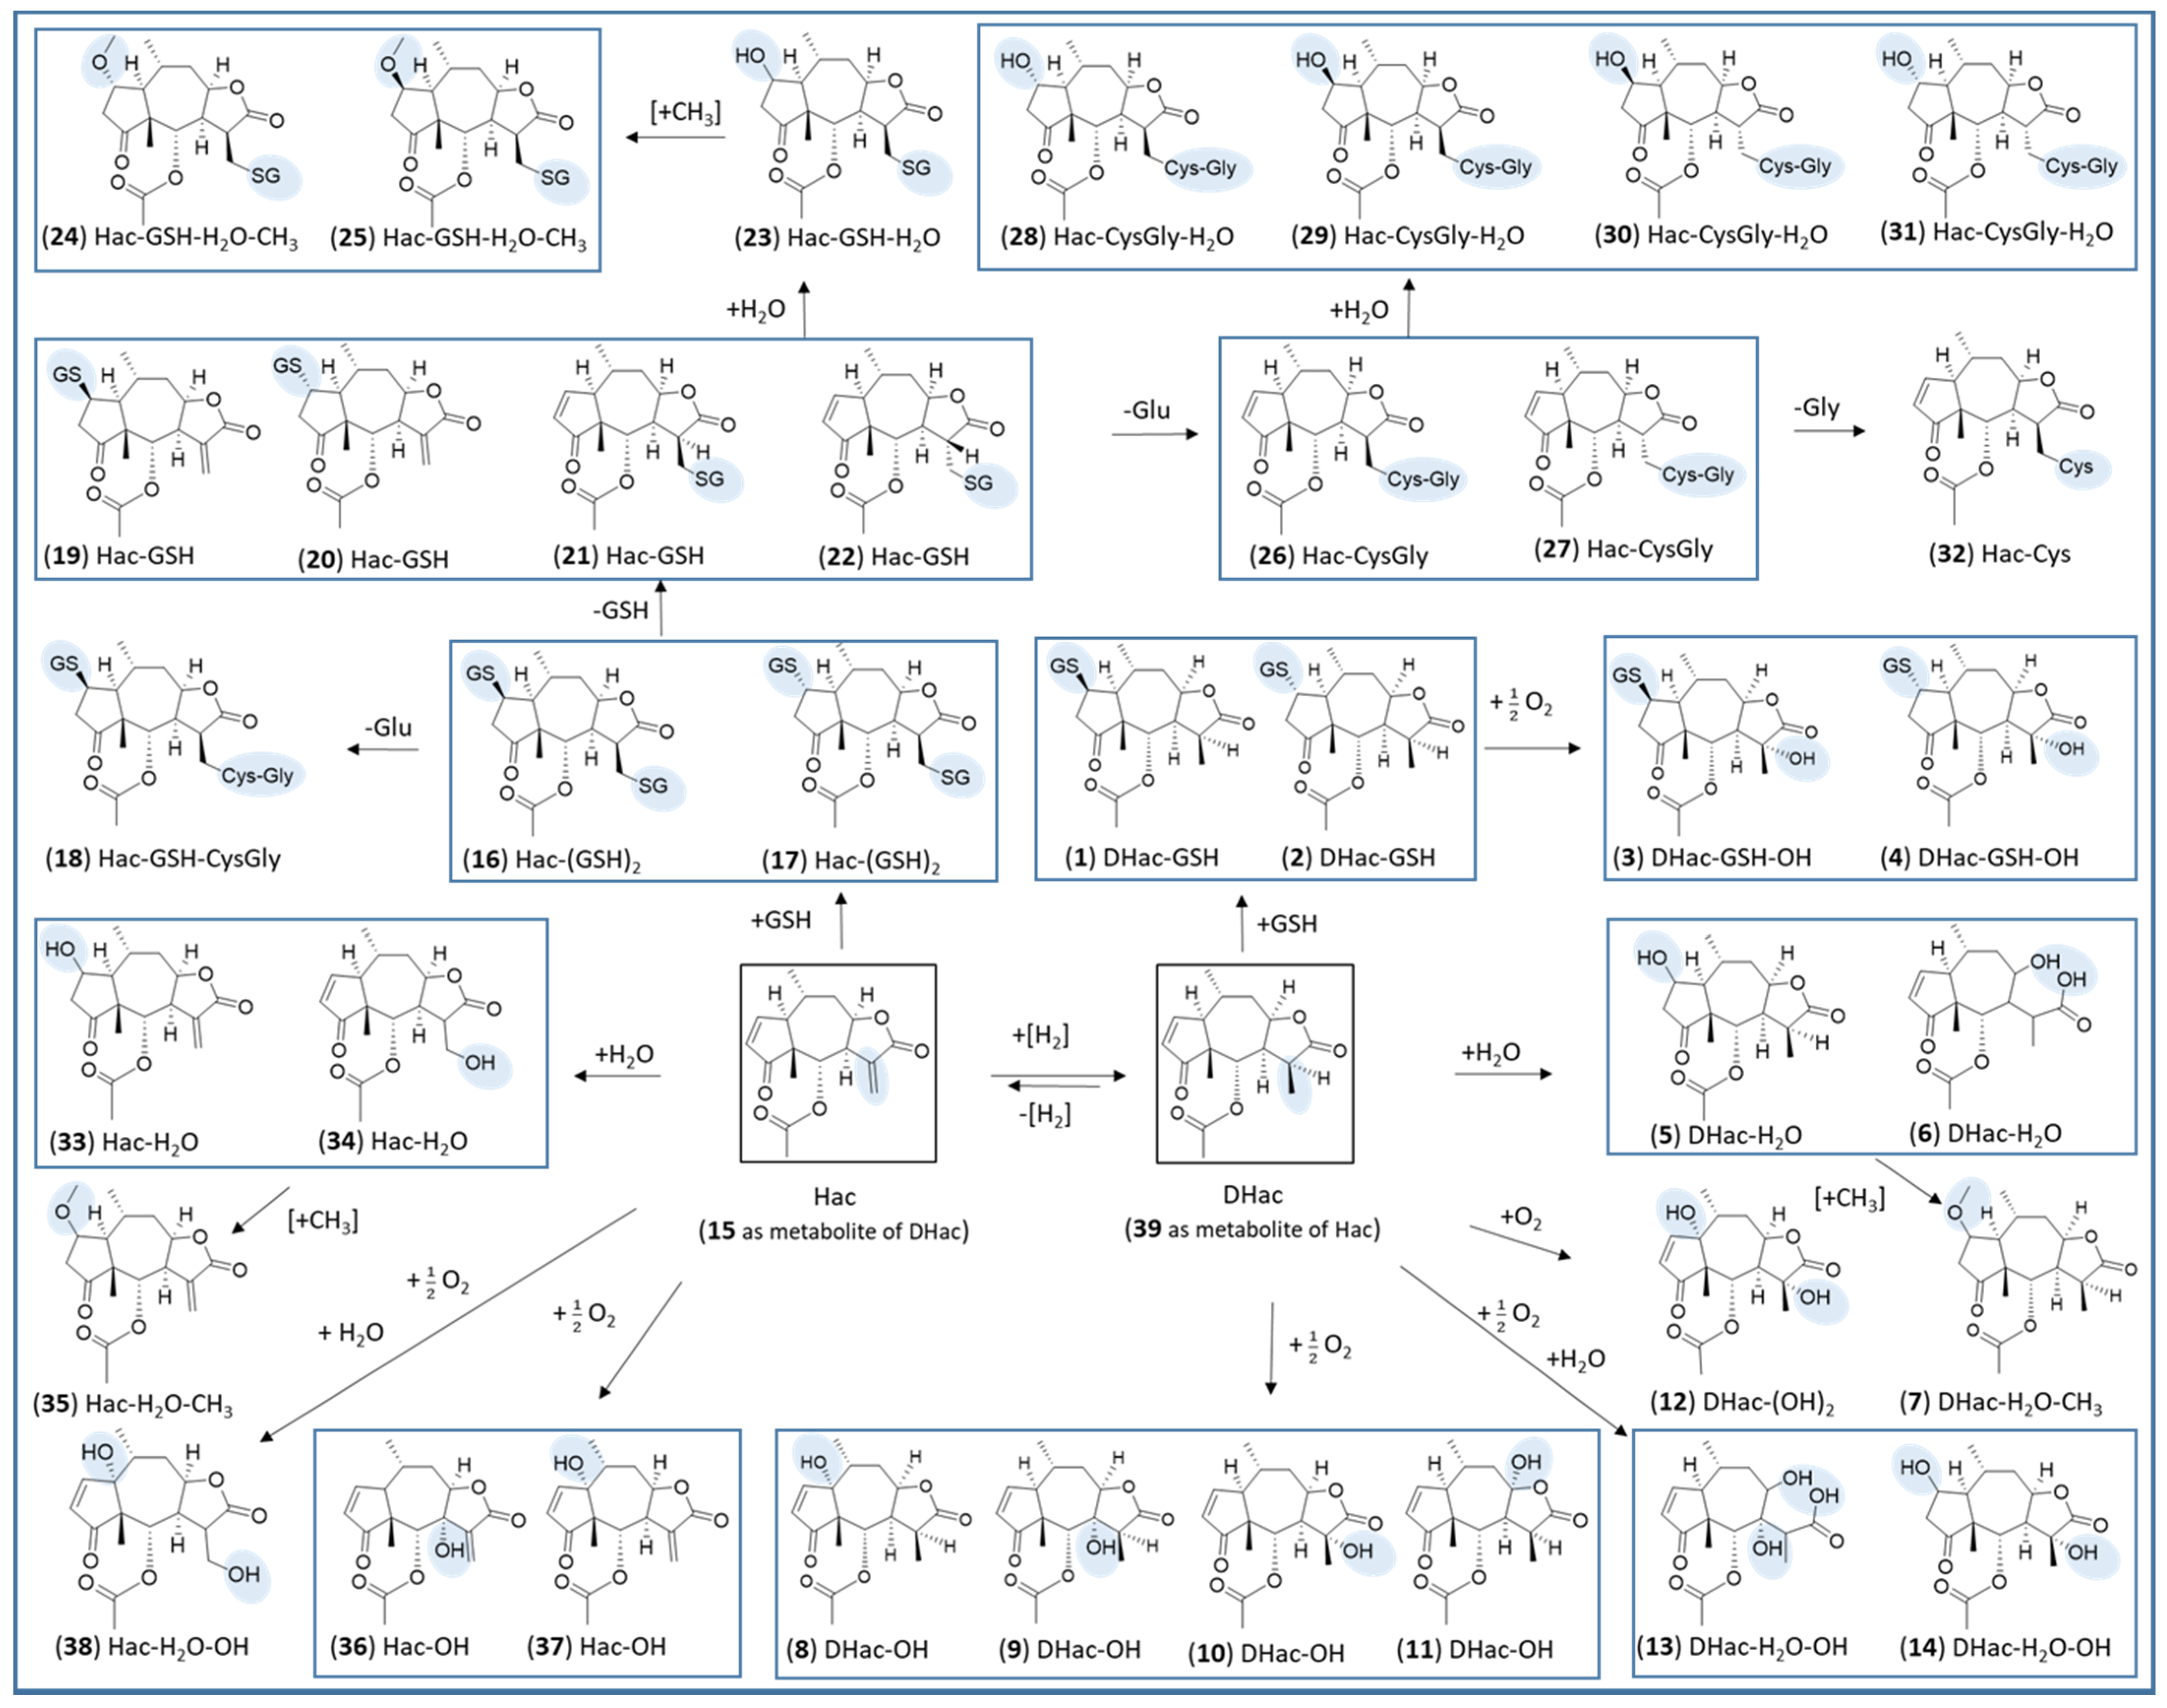
2.1. Phase I Metabolism
2.2. Phase II Metabolism (Glucuronidation and Sulfation)
2.3. Combined Phase I and Phase II Metabolism
3. Materials and Methods
3.1. Chemicals and Materials
3.2. Incubation with Liver Microsomes or Liver Cytosol
3.2.1. Phase I Metabolism
3.2.2. Phase II Metabolism
3.3. UHPLC-QqTOF MS Analysis
4. Conclusions
Supplementary Materials
Author Contributions
Funding
Institutional Review Board Statement
Informed Consent Statement
Data Availability Statement
Acknowledgments
Conflicts of Interest
References
- Savoia, D. Recent updates and perspectives on leishmaniasis. J. Infect. Dev. Ctries. 2015, 9, 588–596. [Google Scholar] [CrossRef] [PubMed] [Green Version]
- Leishmaniasis. Available online: https://www.who.int/news-room/fact-sheets/detail/leishmaniasis (accessed on 15 April 2020).
- Tamiru, H.F.; Mashalla, Y.J.; Mohammed, R.; Tshweneagae, G.T. Cutaneous leishmaniasis a neglected tropical disease: Community knowledge, attitude and practices in an endemic area, Northwest Ethiopia. BMC Infect. Dis. 2019, 19, 855. [Google Scholar] [CrossRef] [PubMed] [Green Version]
- McGwire, B.S.; Satoskar, A.R. Leishmaniasis: Clinical syndromes and treatment. QJM Int. J. Med. 2014, 107, 7–14. [Google Scholar] [CrossRef] [PubMed] [Green Version]
- Azim, M.; Khan, S.A.; Ullah, S.; Ullah, S.; Anjum, S.I. Therapeutic advances in the topical treatment of cutaneous leishmaniasis: A review. PLoS Negl. Trop. Dis. 2021, 15, e0009099. [Google Scholar] [CrossRef] [PubMed]
- Schmidt, T.J.; Nour, A.M.M.; Khalid, S.A.; Kaiser, M.; Brun, R. Quantitative Structure—Antiprotozoal Activity Relationships of Sesquiterpene Lactones. Molecules 2009, 14, 2062–2076. [Google Scholar] [CrossRef] [PubMed]
- Llurba-Montesino, N.; Kaiser, M.; Brun, R.; Schmidt, T.J. Search for Antiprotozoal Activity in Herbal Medicinal Preparations; New Natural Leads against Neglected Tropical Diseases. Molecules 2015, 20, 14118–14138. [Google Scholar] [CrossRef] [Green Version]
- Robledo, S.M.; Vélez, I.D.; Schmidt, T.J. Arnica Tincture Cures Cutaneous Leishmaniasis in Golden Hamsters. Molecules 2018, 23, 150. [Google Scholar] [CrossRef] [Green Version]
- European Directorate for the Quality of Medicines & HealthCare (EDQM). Arnicae flos. In European Pharmacopoeia, 10th ed.; Council of Europe: Strasbourg, France, 2020. [Google Scholar]
- European Medicines Agency (EMA). Assessment Report on Arnica montana L., Flos. Available online: https://www.ema.europa.eu/en/medicines/herbal/arnicae-flos (accessed on 9 November 2021).
- Perry, N.B.; Burgess, E.J.; Guitián, M.A.R.; Franco, R.R.; Mosquera, E.L.; Smallfield, B.M.; Joyce, N.I.; Littlejohn, R.P. Sesquiterpene Lactones in Arnica montana: Helenalin and Dihydrohelenalin Chemotypes in Spain. Planta Med. 2009, 75, 660–666. [Google Scholar] [CrossRef] [Green Version]
- Schmidt, T.J.; Matthiesen, U.; Willuhn, G. On the Stability of Sesquiterpene Lactones in the Officinal Arnica Tincture of the German Pharmacopoeia1. Planta Med. 2000, 66, 678–681. [Google Scholar] [CrossRef] [PubMed]
- Ekenäs, C.; Rosén, J.; Wagner, S.; Merfort, I.; Backlund, A.; Andreasen, K. Secondary chemistry and ribosomal DNA data congruencies in Arnica (Asteraceae). Cladistics 2009, 25, 78–92. [Google Scholar] [CrossRef] [PubMed]
- Tosun, F.; Beutler, J.A.; Ransom, T.T.; Miski, M. Anatolicin, a Highly Potent and Selective Cytotoxic Sesquiterpene Coumarin from the Root Extract of Heptaptera anatolica. Molecules 2019, 24, 1153. [Google Scholar] [CrossRef] [Green Version]
- Elso, O.G.; Clavin, M.; Hernandez, N.; Sgarlata, T.; Bach, H.; Catalan, C.A.N.; Aguilera, E.; Alvarez, G.; Sülsen, V.P. Antiprotozoal Compounds from Urolepis hecatantha (Asteraceae). Evid.-Based Complementary Altern. Med. 2021, 2021, 6622894. [Google Scholar] [CrossRef]
- Schmidt, T.J.; Lyß, G.; Pahl, H.L.; Merfort, I. Helenanolide type sesquiterpene lactones. Part 5: The role of glutathione addition under physiological conditions. Bioorg. Med. Chem. 1999, 7, 2849–2855. [Google Scholar] [CrossRef]
- Jancova, P.; Anzenbacher, P.; Anzenbacherova, E. Phase II drug metabolizing enzymes. Biomed. Pap. 2010, 154, 103–116. [Google Scholar] [CrossRef] [PubMed] [Green Version]
- Schmidt, T.J. Glutathione Adducts of Helenalin and 11α,13-Dihydrohelenalin Acetate Inhibit Glutathione S-Transferase from Horse Liver. Planta Med. 2000, 66, 106–109. [Google Scholar] [CrossRef] [PubMed]
- Jodynis-Liebert, J.; Murias, M.; Błoszyk, E. Effect of Sesquiterpene Lactones on Antioxidant Enzymes and Some Drug-Metabolizing Enzymes in Rat Liver and Kidney. Planta Med. 2000, 66, 199–205. [Google Scholar] [CrossRef]
- Chapman, D.E.; Holbrook, D.J.; Chaney, S.G.; Hall, I.H.; Lee, K.-H. In vitro inhibition of mouse hepatic mixed-function oxidase enzymes by helenalin and alantolactone. Biochem. Pharmacol. 1989, 38, 3913–3923. [Google Scholar] [CrossRef]
- Schmidt, T.J. Toxic Activities of Sesquiterpene Lactones: Structural and Biochemical Aspects. Curr. Org. Chem. 1999, 3, 577–608. [Google Scholar]
- Tekko, I.A.; Bonner, M.C.; Bowen, R.D.; Williams, A.C. Permeation of bioactive constituents from Arnica montana preparations through human skin in-vitro. J. Pharm. Pharmacol. 2006, 58, 1167–1176. [Google Scholar] [CrossRef] [PubMed]
- Fan, J.; de Lannoy, I.A. Pharmacokinetics. Biochem. Pharmacol. 2014, 87, 93–120. [Google Scholar] [CrossRef] [PubMed]
- Asha, S.; Vidyavathi, M. Role of Human Liver Microsomes in In Vitro Metabolism of Drugs—A Review. Appl. Biochem. Biotechnol. 2010, 160, 1699–1722. [Google Scholar] [CrossRef]
- Sohl, C.D.; Cheng, Q.; Guengerich, F.P. Chromatographic assays of drug oxidation by human cytochrome P450 3A4. Nat. Protoc. 2009, 4, 1252–1257. [Google Scholar] [CrossRef] [PubMed] [Green Version]
- Broch, H.; Msellem, M.; Viani, R.; Vasilescu, D. Electrostatic properties of glutathione: A quantum molecular study. Int. J. Quantum Chem. 1993, 48, 49–63. [Google Scholar] [CrossRef]
- Salleh, N.A.M.; Ismail, S.; Ab Halim, M.R. Effects of Curcuma xanthorrhiza extracts and their constituents on phase II drug-metabolizing enzymes activity. Pharmacogn. Res. 2016, 8, 309–315. [Google Scholar] [CrossRef] [PubMed] [Green Version]
- Schmidt, T.J. Helenanolide-type sesquiterpene lactones—III. Rates and stereochemistry in the reaction of helenalin and related helenanolides with sulfhydryl containing biomolecules. Bioorg. Med. Chem. 1997, 5, 645–653. [Google Scholar] [CrossRef]
- Rittle, J.; Green, M.T. Cytochrome P450 Compound I: Capture, Characterization, and C-H Bond Activation Kinetics. Science 2010, 330, 933–937. [Google Scholar] [CrossRef] [PubMed] [Green Version]
- de Montellano, P.R.O. Hydrocarbon Hydroxylation by Cytochrome P450 Enzymes. Chem. Rev. 2010, 110, 932–948. [Google Scholar] [CrossRef] [Green Version]
- Resch, V.; Seidler, C.; Chen, B.-S.; Degeling, I.; Hanefeld, U. On the Michael Addition of Water to α,β-Unsaturated Ketones Using Amino Acids. Eur. J. Org. Chem. 2013, 2013, 7697–7704. [Google Scholar] [CrossRef] [Green Version]
- Gomez-Bombarelli, R.; Calle, E.; Casado, J. Mechanisms of Lactone Hydrolysis in Neutral and Alkaline Conditions. J. Org. Chem. 2013, 78, 6868–6879. [Google Scholar] [CrossRef]
- Yao, D.; Li, Z.; Huo, C.; Wang, Y.; Wu, Y.; Zhang, M.; Li, L.; Shi, Q.; Kiyota, H.; Shi, X. Identification of in vitro and in vivo metabolites of alantolactone by UPLC-TOF-MS/MS. J. Chromatogr. B 2016, 1033–1034, 250–260. [Google Scholar] [CrossRef] [PubMed]
- Heilmann, J.; Wasescha, M.R.; Schmidt, T.J. The influence of glutathione and cysteine levels on the cytotoxicity of helenanolide type sesquiterpene lactones against KB cells. Bioorg. Med. Chem. 2001, 9, 2189–2194. [Google Scholar] [CrossRef]
- De Rooij, B.M.; Commandeur, J.N.M.; Vermeulen, N.P.E. Mercapturic acids as biomarkers of exposure to electrophilic chemicals:applications to environmental and industrial chemicals. Biomarkers 1998, 3, 239–303. [Google Scholar] [CrossRef]
- Peng, Z.; Wang, Y.; Gu, X.; Guo, X.; Yan, C. Study on the pharmacokinetics and metabolism of costunolide and dehydrocostus lactone in rats by HPLC-UV and UPLC-Q-TOF/MS. Biomed. Chromatogr. 2014, 28, 1325–1334. [Google Scholar] [CrossRef] [PubMed]
- Zhou, B.; Ye, J.; Yang, N.; Chen, L.; Zhuo, Z.; Mao, L.; Liu, Q.; Lan, G.; Ning, J.; Ge, G.; et al. Metabolism and pharmacokinetics of alantolactone and isoalantolactone in rats: Thiol conjugation as a potential metabolic pathway. J. Chromatogr. B 2018, 1072, 370–378. [Google Scholar] [CrossRef]
- Yu, Z.; Chen, Z.; Li, Q.; Yang, K.; Huang, Z.; Wang, W.; Zhao, S.; Hu, H. What dominates the changeable pharmacokinetics of natural sesquiterpene lactones and diterpene lactones: A review focusing on absorption and metabolism. Drug Metab. Rev. 2021, 53, 122–140. [Google Scholar] [CrossRef] [PubMed]
- Lake, B.G. Preparation and Characterization of Microsomal Fractions for Studies on Xenobiotic Metabolism; IRL Press: Oxford, UK, 1987; pp. 183–215. [Google Scholar]
- Bradford, M.M. A rapid and sensitive method for the quantitation of microgram quantities of protein utilizing the principle of protein-dye binding. Anal. Biochem. 1976, 72, 248–254. [Google Scholar] [CrossRef]
- Wong, C.C.; Meinl, W.; Glatt, H.-R.; Barron, D.; Stalmach, A.; Steiling, H.; Crozier, A.; Williamson, G. In vitro and in vivo conjugation of dietary hydroxycinnamic acids by UDP-glucuronosyltransferases and sulfotransferases in humans. J. Nutr. Biochem. 2010, 21, 1060–1068. [Google Scholar] [CrossRef]
- Wu, X.; Murphy, P.; Cunnick, J.; Hendrich, S. Synthesis and characterization of deoxynivalenol glucuronide: Its comparative immunotoxicity with deoxynivalenol. Food Chem. Toxicol. 2007, 45, 1846–1855. [Google Scholar] [CrossRef] [PubMed] [Green Version]
- European Medicines Agency (EMA). ICH Guideline M3(R2) on Non-Clinical Safety Studies for the Conduct of Human Clinical Trials and Marketing Authorisation for Pharmaceuticals. Available online: https://www.ema.europa.eu/en/ich-m3-r2-non-clinical-safety-studies-conduct-human-clinical-trials-pharmaceuticals (accessed on 9 November 2021).


| No. | Metabolite | Biotransformation | Rt (min) | Formula | [M+H]+ (m/z) | Δm (mDa) a | Δm (ppm) a |
|---|---|---|---|---|---|---|---|
| 1 | DHac-GSH | GSH conjugation | 4.9 | C27H39N3O11S | 614.2379 | 0.0 | 0.0 |
| 2 | DHac-GSH | GSH conjugation | 5.1 | C27H39N3O11S | 614.2372 | −0.7 | −1.1 |
| 3 | DHac-GSH-OH | GSH conjugation, hydroxylation | 4.4 | C27H39N3O12S | 630.2346 | 1.9 | 3.0 |
| 4 | DHac-GSH-OH | GSH conjugation, hydroxylation | 4.5 | C27H39N3O12S | 630.2333 | 0.6 | 1.0 |
| 5 | DHac-H2O | water addition | 5.8 | C17H24O6 | 325.1648 | 0.2 | 0.6 |
| 6 | DHac-H2O | water addition | 6.0 | C17H24O6 | 325.1643 | −0.3 | −0.9 |
| 7 | DHac-H2O-CH3 | water addition, O-methylation | 7.7 | C18H26O6 | 339.1822 | 2.0 | 5.9 |
| 8 | DHac-OH | hydroxylation | 5.1 | C17H22O6 | 323.1482 | −0.8 | −2.5 |
| 9 | DHac-OH | hydroxylation | 5.8 | C17H22O6 | 323.1498 | 0.8 | 2.5 |
| 10 | DHac-OH | hydroxylation | 6.3 | C17H22O6 | 323.1500 | 1.0 | 3.1 |
| 11 | DHac-OH | hydroxylation | 6.6 | C17H22O6 | 323.1484 | −0.6 | −1.9 |
| 12 | DHac-(OH)2 | hydroxylation | 5.3 | C17H22O7 | 339.1452 | 1.4 | 4.1 |
| 13 | DHac-H2O-OH | water addition, hydroxylation | 5.2 | C17H24O7 | 341.1583 | −1.2 | −3.5 |
| 14 | DHac-H2O-OH | water addition, hydroxylation | 5.7 | C17H24O7 | 341.1614 | 1.9 | 5.6 |
| 15 | Hac | dehydrogenation | 7.1 | C17H20O5 | 305.1373 | −1.1 | −3.6 |
| No. | Metabolite | Biotransformation | Rt (min) | Formula | [M+H]+ (m/z) | Δm (mDa) a | Δm (ppm) a |
|---|---|---|---|---|---|---|---|
| 16 | Hac-(GSH)2 | GSH conjugation | 4.2 | C37H54N6O17S2 | 919.3017 | 4.3 | 4.7 |
| 17 | Hac-(GSH)2 | GSH conjugation | 4.4 | C37H54N6O17S2 | 919.3043 | 1.7 | 1.8 |
| 18 | Hac-GSH-CysGly | GSH conjugation; cleavage of Glu | 3.9 | C32H47N5O14S2 | 790.2672 | 3.8 | 4.8 |
| 19 | Hac-GSH | GSH conjugation | 5.0 | C27H37N3O11S | 612.2245 | 2.3 | 3.8 |
| 20 | Hac-GSH | GSH conjugation | 5.2 | C27H37N3O11S | 612.2204 | −1.8 | −2.9 |
| 21 | Hac-GSH | GSH conjugation | 5.4 | C27H37N3O11S | 612.2231 | 0.9 | 1.5 |
| 22 | Hac-GSH | GSH conjugation | 5.6 | C27H37N3O11S | 612.2217 | 0.5 | 0.8 |
| 23 | Hac-GSH-H2O | GSH conjugation; water addition | 4.6 | C27H39N3O12S | 630.2311 | −1.6 | −2.5 |
| 24 | Hac-GSH-H2O-CH3 | GSH conjugation; water addition; O-methylation | 5.6 | C28H41N3O12S | 644.2513 | 2.9 | 4.5 |
| 25 | Hac-GSH-H2O-CH3 | GSH conjugation; water addition; O-methylation | 5.7 | C28H41N3O12S | 644.2460 | −2.4 | −3.7 |
| 26 | Hac-CysGly | GSH conjugation, cleavage of Glu | 5.1 | C22H30N2O8S | 483.1814 | 1.8 | 3.7 |
| 27 | Hac-CysGly | GSH conjugation, cleavage of Glu | 5.3 | C22H30N2O8S | 483.1814 | 1.8 | 3.7 |
| 28 | Hac-CysGly-H2O | GSH conjugation, cleavage of Glu | 4.0 | C22H32N2O9S | 501.1885 | −1.6 | −3.2 |
| 29 | Hac-CysGly-H2O | GSH conjugation, cleavage of Glu, water addition | 4.3 | C22H32N2O9S | 501.1925 | 2.4 | 4.8 |
| 30 | Hac-CysGly-H2O | GSH conjugation, cleavage of Glu; water addition | 4.6 | C22H32N2O9S | 501.1917 | 1.6 | 3.2 |
| 31 | Hac-CysGly-H2O | GSH conjugation, cleavage of Glu; water addition | 4.8 | C22H32N2O9S | 501.1881 | −2.0 | −4.0 |
| 32 | Hac-Cys | Cys conjugation/GSH conjugation, cleavage of Glu and Gly | 5.4 | C20H27NO7S | 426.1599 | 1.8 | 4.2 |
| 33 | Hac-H2O | water addition | 6.0 | C17H22O6 | 323.1480 | −1.0 | −3.1 |
| 34 | Hac-H2O | water addition | 6.3 | C17H22O6 | 323.1483 | −0.7 | −2.2 |
| 35 | Hac-H2O-CH3 | water addition; O-methylation | 7.9 | C18H24O6 | 337.1657 | 1.1 | 3.3 |
| 36 | Hac-OH | hydroxylation | 5.4 | C17H20O6 | 321.1314 | −1.9 | −5.9 |
| 37 | Hac-OH | hydroxylation | 6.7 | C17H20O6 | 321.1332 | −0.1 | −0.3 |
| 38 | Hac-H2O-OH | water addition, hydroxylation | 5.8 | C17H22O7 | 339.1448 | 1.0 | 2.9 |
| 39 | DHac | hydrogenation | 6.9 | C17H22O5 | 307.1525 | −1.5 | −4.9 |
Publisher’s Note: MDPI stays neutral with regard to jurisdictional claims in published maps and institutional affiliations. |
© 2022 by the authors. Licensee MDPI, Basel, Switzerland. This article is an open access article distributed under the terms and conditions of the Creative Commons Attribution (CC BY) license (https://creativecommons.org/licenses/by/4.0/).
Share and Cite
Jürgens, F.M.; Behrens, M.; Humpf, H.-U.; Robledo, S.M.; Schmidt, T.J. In Vitro Metabolism of Helenalin Acetate and 11α,13-Dihydrohelenalin Acetate: Natural Sesquiterpene Lactones from Arnica. Metabolites 2022, 12, 88. https://doi.org/10.3390/metabo12010088
Jürgens FM, Behrens M, Humpf H-U, Robledo SM, Schmidt TJ. In Vitro Metabolism of Helenalin Acetate and 11α,13-Dihydrohelenalin Acetate: Natural Sesquiterpene Lactones from Arnica. Metabolites. 2022; 12(1):88. https://doi.org/10.3390/metabo12010088
Chicago/Turabian StyleJürgens, Franziska M., Matthias Behrens, Hans-Ulrich Humpf, Sara M. Robledo, and Thomas J. Schmidt. 2022. "In Vitro Metabolism of Helenalin Acetate and 11α,13-Dihydrohelenalin Acetate: Natural Sesquiterpene Lactones from Arnica" Metabolites 12, no. 1: 88. https://doi.org/10.3390/metabo12010088
APA StyleJürgens, F. M., Behrens, M., Humpf, H.-U., Robledo, S. M., & Schmidt, T. J. (2022). In Vitro Metabolism of Helenalin Acetate and 11α,13-Dihydrohelenalin Acetate: Natural Sesquiterpene Lactones from Arnica. Metabolites, 12(1), 88. https://doi.org/10.3390/metabo12010088