
Validation of Urinary Charged Metabolite Profiles in Colorectal Cancer Using Capillary Electrophoresis-Mass Spectrometry

 , , , and
Abstract
:1. Introduction
2. Results
3. Discussion
4. Materials and Methods
4.1. Study Subjects
4.2. Metabolomic Analysis and Data Analysis
Supplementary Materials
Author Contributions
Funding
Institutional Review Board Statement
Informed Consent Statement
Data Availability Statement
Acknowledgments
Conflicts of Interest
References
- Cancer Statistics; Cancer Information Service, National Cancer Center: Tsukiji, Japan, 2019; Vital Statistics of Japan, Ministry of Health, Labour and Welfare; Available online: https://ganjoho.jp/reg_stat/statistics/data/dl/en.html (accessed on 25 September 2021).
- OECD Health Statistics. 2021. Available online: https://stats.oecd.org/Index.aspx?ThemeTreeId=9 (accessed on 25 September 2021).
- Vogelstein, B.; Fearon, E.R.; Hamilton, S.R.; Kern, S.E.; Preisinger, A.C.; Leppert, M.; Nakamura, Y.; White, R.; Smits, A.M.; Bos, J.L. Genetic alterations during coloreatal-tumor development. N. Engl. J. Med. 1988, 319, 525–532. [Google Scholar] [CrossRef] [Green Version]
- Winawer, S.J.; Zauber, A.G.; Ho, M.N.; O’Brien, M.J.; Gottlieb, L.S.; Sternberg, S.S.; Waye, J.D.; Schapiro, M.; Bond, J.H.; Panish, J.F.; et al. Prevention of colorectal cancer by colonoscopic polypectomy. The National Polyp Study Workgroup. N. Engl. J. Med. 1993, 329, 1977–1981. [Google Scholar] [CrossRef] [PubMed]
- Simon, J.B. Colonic polyps, occult blood, and chance. JAMA 1990, 264, 84–85. [Google Scholar] [CrossRef] [PubMed]
- Chika, U.; Masayoshi, M. A review of false negative findings in immunological fecal occult blood testing. J. Gastrointest Cancer Screen 2007, 45, 204–213. [Google Scholar]
- de Zwart, I.M.; Griffioen, G.; Shaw, M.P.; Lamers, C.B.; de Roos, A. Barium enema and endoscopy for the detection of colorectal neoplasia: Sensitivity, specificity, complications and its determinants. Clin. Radiol. 2001, 56, 401–409. [Google Scholar] [CrossRef]
- Graser, A.; Stieber, P.; Nagel, D.; Schäfer, C.; Horst, D.; Becker, C.R.; Nikolaou, K.; Lottes, A.; Geisbüsch, S.; Kramer, H.; et al. Comparison of CT colonography, colonoscopy, sigmoidoscopy and faecal occult blood tests for the detection of advanced adenoma in an average risk population. Gut 2009, 58, 241–248. [Google Scholar] [CrossRef] [PubMed] [Green Version]
- Locker, G.Y.; Hamilton, S.; Harris, J.; Jessup, J.M.; Kemeny, N.; Macdonald, J.S.; Somerfield, M.R.; Hayes, D.F.; Bast, R.C., Jr. ASCO: ASCO 2006 update of recommendations for the use of tumor markers in gastrointestinal cancer. J. Clin. Oncol. 2006, 24, 5313–5327. [Google Scholar] [CrossRef]
- Roth, A.D.; Tejpar, S.; Delorenzi, M.; Yan, P.; Fiocca, R.; Klingbiel, D.; Dietrich, D.; Biesmans, B.; Bodoky, G.; Barone, C.; et al. Prognostic role of KRAS and BRAF in stage II and III resected colon cancer: Results of the translational study on the PETACC-3, EORTC 40993, SAKK 60-00 trial. J. Clin. Oncol. 2010, 28, 466–474. [Google Scholar] [CrossRef]
- Schetter, A.J.; Harris, C.C. Alterations of microRNAs contribute to colon carcinogenesis. Semin. Oncol. 2011, 38, 734–742. [Google Scholar] [CrossRef] [Green Version]
- Hashiguchi, Y.; Muro, K.; Saito, Y.; Ito, Y.; Ajioka, Y.; Hamaguchi, T.; Hasegawa, K.; Hotta, K.; Ishida, H.; Ishiguro, M.; et al. Japanese Society for Cancer of the Colon and Rectum. Int. J. Clin. Oncol. 2020, 25, 1–42. [Google Scholar] [CrossRef] [Green Version]
- Mazaki, J.; Katsumata, K.; Kasahara, K.; Tago, T.; Wada, T.; Kuwabara, H.; Enomoto, M.; Ishizaki, T.; Nagakawa, Y.; Tsuchida, A. Neutrophil-to-lymphocyte ratio is a prognostic factor for colon cancer: A propensity score analysis. BMC Cancer 2020, 20, 922. [Google Scholar] [CrossRef]
- Udo, R.; Katsumata, K.; Kuwabara, H.; Enomoto, M.; Ishizaki, T.; Sunamura, M.; Nagakawa, Y.; Soya, R.; Sugimoto, M.; Tsuchida, A. Urinary charged metabolite profling of colorectal cancer using capillary electrophoresis-mass spectrometry. Sci. Rep. 2020, 10, 21057. [Google Scholar] [CrossRef]
- Reo, N.V. NMR-based metabolomics. Drug Chem. Toxicol. 2002, 25, 375–382. [Google Scholar] [CrossRef]
- Aharoni, A.; Ric de Vos, C.H.; Verhoeven, H.A.; Maliepaard, C.A.; Kruppa, G.; Bino, R.; Goodenowe, D.B. Nontargeted metabolome analysis by use of Fourier Transform Ion Cyclotron mass spectrometry. Omics 2002, 6, 217–234. [Google Scholar] [CrossRef]
- Soga, T.; Ohashi, Y.; Ueno, Y.; Naraoka, H.; Tomita, M.; Nishioka, T. Quantitative metabolome analysis using capillary electrophoresis mass spectrometry. J. Proteome Res. 2003, 2, 488–494. [Google Scholar] [CrossRef] [PubMed]
- Fiehn, O.; Kopka, J.; Dörmann, P.; Altmann, T.; Trethewey, R.N.; Willmitzer, L. Metabolite profiling for plant functional genomics. Nat. Biotechnol. 2000, 18, 1157–1161. [Google Scholar] [CrossRef] [PubMed]
- Plumb, R.; Granger, J.; Stumpf, C.; Wilson, I.D.; Evans, J.A.; Lenz, E.M. Metabonomic analysis of mouse urine by liquid-chromatography-time of flight mass spectrometry (LC-TOFMS): Detection of strain, diurnal and gender differences. Analyst 2003, 128, 819–823. [Google Scholar] [CrossRef] [PubMed]
- Hirayama, A.; Kami, K.; Sugimoto, M.; Sugawara, M.; Toki, N.; Onozuka, H.; Kinoshita, T.; Saito, N.; Ochiai, A.; Tomita, M.; et al. Quantitative metabolome profiling of colon and stomach cancer microenvironment by capillary electrophoresis time-of-flight mass spectrometry. Cancer Res. 2009, 69, 4918–4925. [Google Scholar] [CrossRef] [PubMed] [Green Version]
- Gatenby, R.A.; Gillies, R.J. Why do cancers have high aerobic glycolysis? Nat. Rev. Cancer 2004, 4, 891–899. [Google Scholar] [CrossRef]
- Kim, J.W.; Dang, C.V. Cancer’s molecular sweet tooth and the Warburg effect. Cancer Res. 2006, 66, 8927–8930. [Google Scholar] [CrossRef] [Green Version]
- Denko, N.C. Hypoxia, HIF1 and glucose metabolism in the solid tumour. Nat. Rev. Cancer 2008, 8, 705–713. [Google Scholar] [CrossRef] [PubMed]
- Vander Heiden, M.G.; Cantley, L.C.; Thompson, C.B. Understanding the Warburg effect: The metabolic requirements of cell proliferation. Science 2009, 324, 1029–1033. [Google Scholar] [CrossRef] [Green Version]
- Sasaki, M.; Okamoto, M.; Sato, C.; Sugio, K.; Soejima, J.; Iwama, T.; Ikeuchi, T.; Tonomura, A.; Miyaki, M.; Sasazuki, T. Loss of constitutional heterozygosity in colorectal tumors from patients with familial polyposis coli and those with nonpolyposis colorectal carcinoma. Cancer Res. 1989, 49, 4402–4406. [Google Scholar] [PubMed]
- Cancer Genome Atlas Network. Comprehensive molecular characterization of human colon and rectal cancer. Nature 2012, 487, 330–337. [Google Scholar] [CrossRef] [PubMed] [Green Version]
- Erisman, M.D.; Rothberg, P.G.; Diehl, R.E.; Morse, C.C.; Spandorfer, J.M.; Astrin, S.M. Deregulation of c-myc gene expression in human colon carcinoma is not accompanied by amplification or rearrangement of the gene. Mol. Cell. Biol. 1985, 5, 1969–1976. [Google Scholar]
- Sikora, K.; Chan, S.; Evan, G.; Gabra, H.; Markham, N.; Stewart, J.; Watson, J. C-myc oncogene expression in colorectal cancer. Cancer 1987, 59, 1289–1295. [Google Scholar] [CrossRef]
- Satoh, K.; Yachida, S.; Sugimoto, M.; Oshima, M.; Nakagawa, T.; Akamoto, S.; Tabata, S.; Saitoh, K.; Kato, K.; Sato, S.; et al. Global metabolic reprogramming of colorectal cancer occurs at adenoma stage and is induced by MYC. Proc. Natl. Acad. Sci. USA 2017, 114, E7697–E7706. [Google Scholar] [CrossRef] [Green Version]
- Nakajima, T.; Katsumata, K.; Kuwabara, H.; Soya, R.; Enomoto, M.; Ishizaki, T.; Tsuchida, A.; Mori, M.; Hiwatari, K.; Soga, T.; et al. Urinary polyamine biomarker panels with machine-learning differentiated colorectal cancers, benign disease, and healthy controls. Int. J. Mol. Sci. 2018, 19, 756. [Google Scholar] [CrossRef] [PubMed]


| Group | Age | Gender | |||
|---|---|---|---|---|---|
| n | Mean | SD | Male | Female | |
| HC | 36 | 49.1 | 12.2 | 28 | 8 |
| AD | 34 | 65.9 | 14.0 | 26 | 8 |
| CRC | 214 | 68.8 | 11.8 | 117 | 97 |
| HC vs. AD | Parameter | 95% CI | Odds Ratio | 95% CI | p | ||
|---|---|---|---|---|---|---|---|
| N8-Acetylspermidine | 3.94 × 10³ | −1.53 × 10³ | 2.32 × 10³ | 2.03 | 0.0650 | 63.2 | 0.69 |
| N1,N8-Diacetylspermidine | 3.94 × 10³ | −9.57 × 10³ | 1.74 × 10⁴ | 2.68 | 0.0910 | 79.2 | 0.57 |
| 2-Oxoglutarate | 29.1 | −29.9 | 88.0 | 3.51 | 0.275 | 44.7 | 0.33 |
| (Intercept) | −1.10 | −2.59 | 0.401 | - | - | - | 0.15 |
| AD vs. CRC | Parameter | 95% CI | Odds Ratio | 95% CI | p | ||
|---|---|---|---|---|---|---|---|
| N8-Acetylspermidine | 1.24 × 10² | −1.09 × 10³ | 1.45 × 10³ | 1.67 | 0.0110 | 4.12 × 10² | 0.85 |
| N1,N8-Diacetylspermidine | 5.01 × 10³ | −4006.923 | 1.43 × 10⁴ | 1.25 × 10² | 0.0210 | 9.98 × 10⁵ | 0.28 |
| Citrate | 5.19 | 2.30 | 8.59 | 6.18 × 10³ | 47.9 | 1.87 × 10⁶ | 0.0010 |
| Citrulline | 1.11 × 10³ | 2.37 × 10² | 2.22 × 10⁴ | 2.04 × 10⁵ | 13.6 | 4.16 × 10¹⁰ | 0.030 |
| (Intercept) | −0.780 | −2.26 | 0.575 | - | - | - | 0.28 |
| HC vs. AD + CRC | Parameter | 95% CI | Odds Ratio | 95% CI | p | ||
|---|---|---|---|---|---|---|---|
| N8-Acetylspermidine | 1.27 × 10³ | −1.49 × 10² | 2.81 × 10³ | 1.94 × 10² | 0.540 | 1.15 × 10⁵ | 0.090 |
| N1,N8-Diacetylspermidine | 8.20 × 10³ | −1.86 × 10³ | 1.87 × 10⁴ | 2.73 × 10³ | 0.167 | 6.85 × 10⁷ | 0.12 |
| Citrate | 7.88 | 4.56 | 11.7 | 5.69 × 10⁵ | 2135.038 | 3.68 × 10⁸ | <0.0001 |
| (Intercept) | −1.58 | −3.11 | −0.183 | - | - | - | 0.030 |
| Positive | Negative | Total | |||
|---|---|---|---|---|---|
| (n) | (%) | (n) | (%) | (n) | |
| CEA | 147 | 69 | 66 | 31 | 213 |
| CA19-9 | 175 | 82.2 | 38 | 17.8 | 213 |
| MLR (HC vs. AD + CRC) | 242 | 85.2 | 42 | 14.8 | 284 |
| Item | Log-Rank Test | Wilcoxon Test |
|---|---|---|
| Metabolites | ||
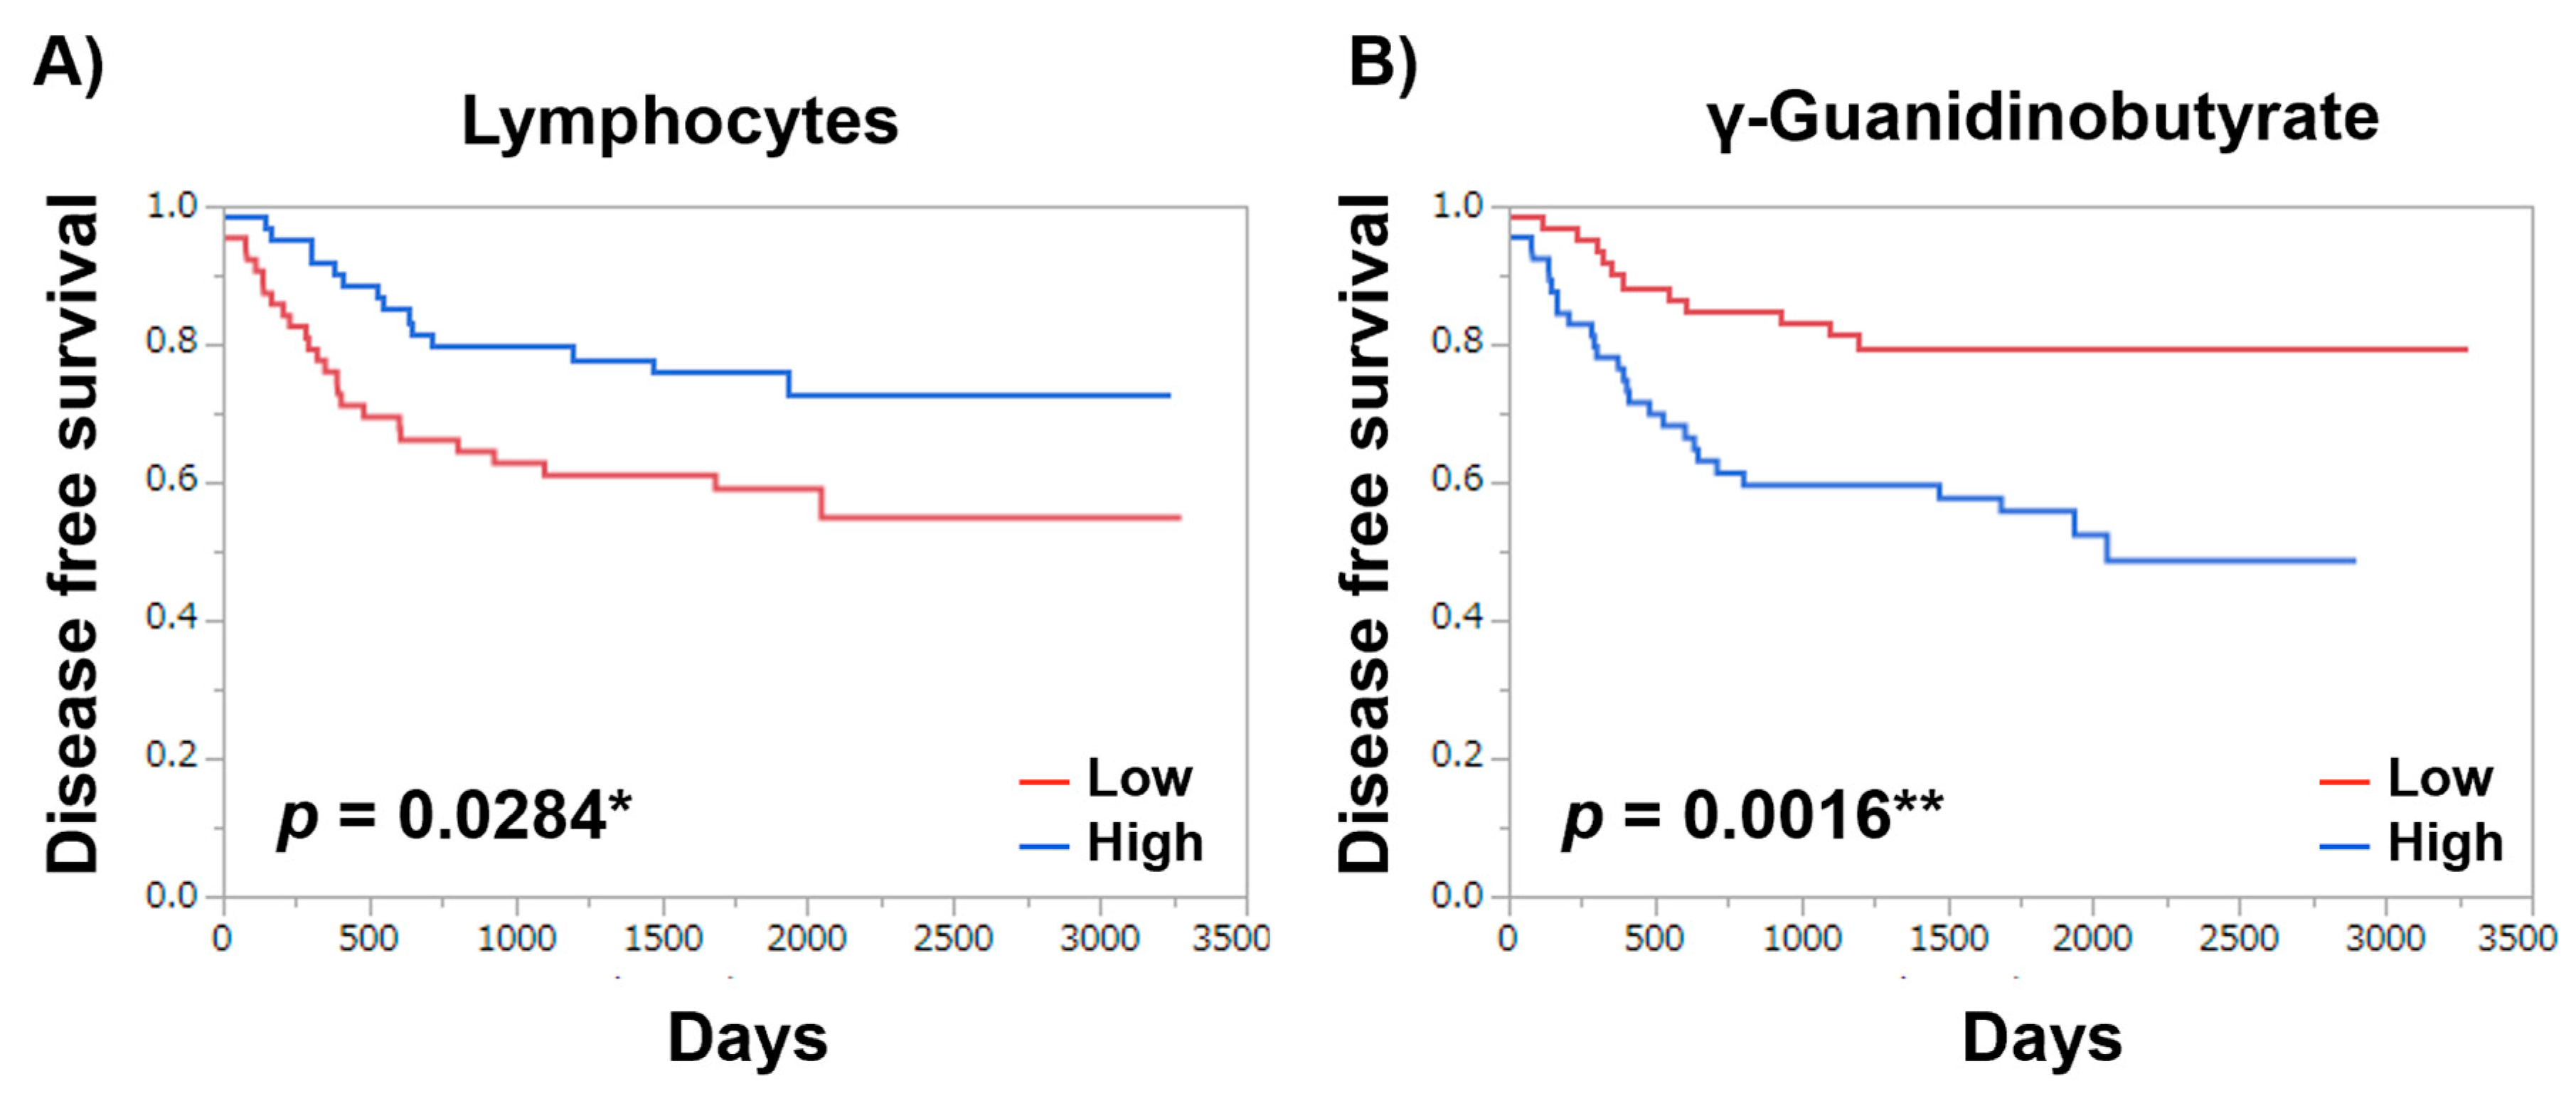
| γ-Guanidinobutyrate | 0.0016 ** | 0.0028 ** |
| Asn | 0.0315 * | 0.0400 * |
| 3-Methylhistidine | 0.0365 * | 0.0731 |
| 1-Metyladenosine | 0.0348 * | 0.0404 * |
| 3-Hydroxybutyrate | 0.0297 * | 0.0390 * |
| N-Acetylglutamate | 0.0046 ** | 0.0132 * |
| Hippurate | 0.0162 * | 0.0277 * |
| Met | 0.0437 * | 0.0599 |
| 7,8-Dihydrobiopterin | 0.0434 * | 0.0831 |
| GABA | 0.0525 ** | 0.0235 * |
| Sebacate | 0.0063 ** | 0.0025 ** |
| Other clinical parameters | ||
| NLR | 0.1183 | 0.1369 |
| WBC | 0.2164 | 0.2886 |
| Neutrophils | 0.0754 | 0.0585 |
| Lymphocytes | 0.0284 * | 0.0193 * |
Publisher’s Note: MDPI stays neutral with regard to jurisdictional claims in published maps and institutional affiliations. |
© 2022 by the authors. Licensee MDPI, Basel, Switzerland. This article is an open access article distributed under the terms and conditions of the Creative Commons Attribution (CC BY) license (https://creativecommons.org/licenses/by/4.0/).
Share and Cite
Sakurai, T.; Katsumata, K.; Udo, R.; Tago, T.; Kasahara, K.; Mazaki, J.; Kuwabara, H.; Kawakita, H.; Enomoto, M.; Ishizaki, T.; et al. Validation of Urinary Charged Metabolite Profiles in Colorectal Cancer Using Capillary Electrophoresis-Mass Spectrometry. Metabolites 2022, 12, 59. https://doi.org/10.3390/metabo12010059
Sakurai T, Katsumata K, Udo R, Tago T, Kasahara K, Mazaki J, Kuwabara H, Kawakita H, Enomoto M, Ishizaki T, et al. Validation of Urinary Charged Metabolite Profiles in Colorectal Cancer Using Capillary Electrophoresis-Mass Spectrometry. Metabolites. 2022; 12(1):59. https://doi.org/10.3390/metabo12010059
Chicago/Turabian StyleSakurai, Toru, Kenji Katsumata, Ryutaro Udo, Tomoya Tago, Kenta Kasahara, Junichi Mazaki, Hiroshi Kuwabara, Hideaki Kawakita, Masanobu Enomoto, Tetsuo Ishizaki, and et al. 2022. "Validation of Urinary Charged Metabolite Profiles in Colorectal Cancer Using Capillary Electrophoresis-Mass Spectrometry" Metabolites 12, no. 1: 59. https://doi.org/10.3390/metabo12010059
APA StyleSakurai, T., Katsumata, K., Udo, R., Tago, T., Kasahara, K., Mazaki, J., Kuwabara, H., Kawakita, H., Enomoto, M., Ishizaki, T., Nemoto, Y., Osaka, Y., Nagakawa, Y., Sugimoto, M., & Tsuchida, A. (2022). Validation of Urinary Charged Metabolite Profiles in Colorectal Cancer Using Capillary Electrophoresis-Mass Spectrometry. Metabolites, 12(1), 59. https://doi.org/10.3390/metabo12010059