Article

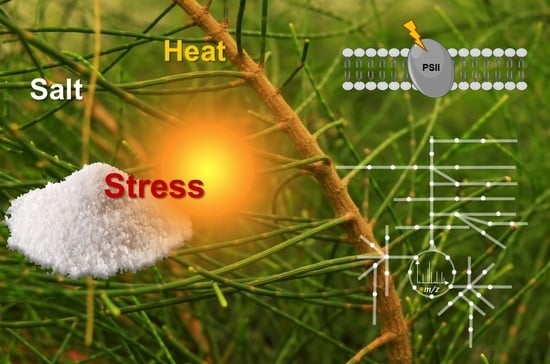
Will Casuarina glauca Stress Resilience Be Maintained in the Face of Climate Change?

by
Tiago F. Jorge
1,
José C. Ramalho
2,3,
Saleh Alseekh
4,5,
Isabel P. Pais
3,6,
António E. Leitão
2,3,
Ana P. Rodrigues
2,
Paula Scotti-Campos
3,6,
Ana I. Ribeiro-Barros
2,3,
Alisdair R. Fernie
4,5 and
Carla António
1,*,†
1
Plant Metabolomics Laboratory, Instituto de Tecnologia Química e Biológica António Xavier, Universidade Nova de Lisboa (ITQB NOVA), Avenida da República, 2780-157 Oeiras, Portugal
2
Plant Stress & Biodiversity Lab, Centro de Estudos Florestais (CEF), Instituto Superior de Agronomia (ISA), Universidade de Lisboa (ULisboa), Tapada da Ajuda, 1349-017 Lisboa and Quinta do Marquês, Portugal
3
GeoBioSciences, GeoTechnologies and GeoEngineering (GeoBioTec), Faculdade de Ciências e Tecnologia (FCT), Universidade NOVA de Lisboa (UNL), 2829-516 Monte de Caparica, Portugal
4
Central Metabolism Group, Max Planck Institute of Molecular Plant Physiology, 14476 Potsdam-Golm, Germany
5
Center of Plant Systems Biology and Biotechnology, 4000 Plovdiv, Bulgaria
6
Unidade de Investigação em Biotecnologia e Recursos Genéticos, Instituto Nacional de Investigação Agrária e Veterinária, I.P. (INIAV), 2784-505 Oeiras, Portugal
*
Author to whom correspondence should be addressed.
Current address: Plant Metabolomics Lab Portugal, Centro de Estudos Florestais (CEF), Instituto Superior de Agronomia (ISA), Universidade de Lisboa (ULisboa), Tapada da Ajuda, 1349-017 Lisboa, Portugal.
Metabolites 2021, 11(9), 593; https://doi.org/10.3390/metabo11090593
Submission received: 10 August 2021 / Revised: 30 August 2021 / Accepted: 31 August 2021 / Published: 2 September 2021

Abstract

:
Actinorhizal plants have been regarded as promising species in the current climate change context due to their high tolerance to a multitude of abiotic stresses. While combined salt-heat stress effects have been studied in crop species, their impact on the model actinorhizal plant, Casuarina glauca, has not yet been fully addressed. The effect of single salt (400 mM NaCl) and heat (control at 26/22 °C, supra optimal temperatures at 35/22 °C and 45/22 °C day/night) conditions on C. glauca branchlets was characterised at the physiological level, and stress-induced metabolite changes were characterised by mass spectrometry-based metabolomics. C. glauca could withstand single salt and heat conditions. However, the harshest stress condition (400 mM NaCl, 45 °C) revealed photosynthetic impairments due to mesophyll and membrane permeability limitations as well as major stress-specific differential responses in C and N metabolism. The increased activity of enzymatic ROS scavengers was, however, revealed to be sufficient to control the plant oxidative status. Although C. glauca could tolerate single salt and heat stresses, their negative interaction enhanced the effects of salt stress. Results demonstrated that C. glauca responses to combined salt-heat stress could be explained as a sum of the responses from each single applied stress.

Graphical Abstract

1. Introduction

By the end of the 21st century, CO2 levels and global temperatures are expected to rise by 700 ppm and 1.5 °C, respectively [1]. Consequently, higher surface temperatures, frequent heat waves and intense precipitation events are likely to occur around the globe. These (stress)-factors negatively affect plant growth and development and trigger highly complex adaptive responses initiated by stress perception, signal transduction and the activation of stress-related genes and metabolites [2,3]. Most studies to date have focused on plant responses to a single stress and as such, do not mimic the natural environmental conditions wherein a combination of stresses is known to occur [4]. Recent studies have, however, demonstrated that combined stresses cannot be regarded as a sum of the responses induced from each single stress. In these studies, stress combinations elicited specific physiological, biochemical and metabolic responses due to a cross-talk of synergistic or antagonistic effects that are controlled by opposing signalling pathways [5,6,7,8,9]. Combined exposure to salt and heat stress has been shown to provide both positive and negative interactions in physiological traits [4,10,11,12]. In wheat (Triticum aestivum L. and Triticum durum Desf.), combined salt-heat stress promoted the uptake of toxic Na+ ions from salt stress and enhanced the heat stress-induced transpiration rate [13]. In tomato (Solanum lycopersicum L.), combined salt-heat stress ameliorated the effects of salt stress through the accumulation of glycine betaine and trehalose (well-known osmolytes), which helped improve plant performance by mitigating both photosynthetic damages and overaccumulation of reactive oxygen species (ROS) [14]. Single salt and heat stresses are known to trigger common molecular responses in plants [15]. An excess of Na+ ions in the soil can severely induce both osmotic and ionic stress within plant tissues leading to an impairment of the photosynthetic machinery and an accumulation of ROS that affect plant growth and metabolism [16,17]. Likewise, heat stress impairs the plant photosynthetic apparatus and metabolism due to a disruption of cell membrane fluidity that promotes overaccumulation of ROS and affects protein and enzyme stabilities [18,19]. Under single salt or heat stresses, plants were also reported to synthesize and accumulate osmolytes that play key roles in the regulation of osmotic potential and stabilization of biomolecules [20].
While the effects of a salt-heat stress combination have been mainly studied in crop species, their impact on ecologically important species has not yet been addressed. Actinorhizal plants are increasingly regarded as important species in the current climate change context [21,22] due to their ability to tolerate harsh environmental conditions [23,24]. This group of perennial dicotyledonous angiosperms establish root-nodule symbiosis with the N-fixation bacteria Frankia [24] and have a remarkable economic and ecological importance, often being used in the production of biomass and reclamation of degraded soils [25].
The model actinorhizal plant, Casuarina glauca Sieber (family Casuarinaceae), is native to Australia and widely distributed in areas where salt and heat stresses are likely to occur simultaneously (e.g., the Mediterranean, arid and semi-arid climates) [26,27]. The salt-stress tolerance of this species and the contribution of the symbiotic bacteria Frankia Thr strain have been thoroughly assessed at the physiological and biochemical levels [28,29,30,31,32,33,34,35,36]. These studies reported that, after exposing C. glauca Sieb. Ex Spreng nodulated (NOD+) and non-nodulated (KNO3+) plants up to 600 mM NaCl, an early salt-stress exposure (i.e., 200 mM NaCl) impairs the plant-bacteria symbiotic association [30]. Moreover, C. glauca plants withstand increasing salt concentrations by maintaining a controlled oxidative environment inside the cells and performing osmotic adjustments that contribute to a nearly stable photosynthetic machinery up to 400 mM NaCl [28,32]. These findings were supported by mass spectrometry (MS)-based proteomics studies that reported maintenance of the proteome stability at the highest salt-stress levels [36]. MS-based metabolomics studies revealed metabolite divergences in amino acid metabolism between NOD+ and KNO3+ plants and suggested that a flavonoid-based secondary antioxidant system complements ascorbate-glutathione cycle components that support the maintenance of a stable oxidative environment within the cell [33,35].
Given the highly promising tolerance of C. glauca to abiotic stresses, the effects of both single and combined exposure to salt and heat stress were investigated in C. glauca branchlets through physiological and MS-based metabolomics analyses in order to (i) evaluate the impact of combined salt-heat stress in the photosynthetic functioning (ii) characterise stress-induced metabolite changes, and (iii) identify key physiological and metabolite cross-responses associated with combined salt-heat stress in this species.

2. Results

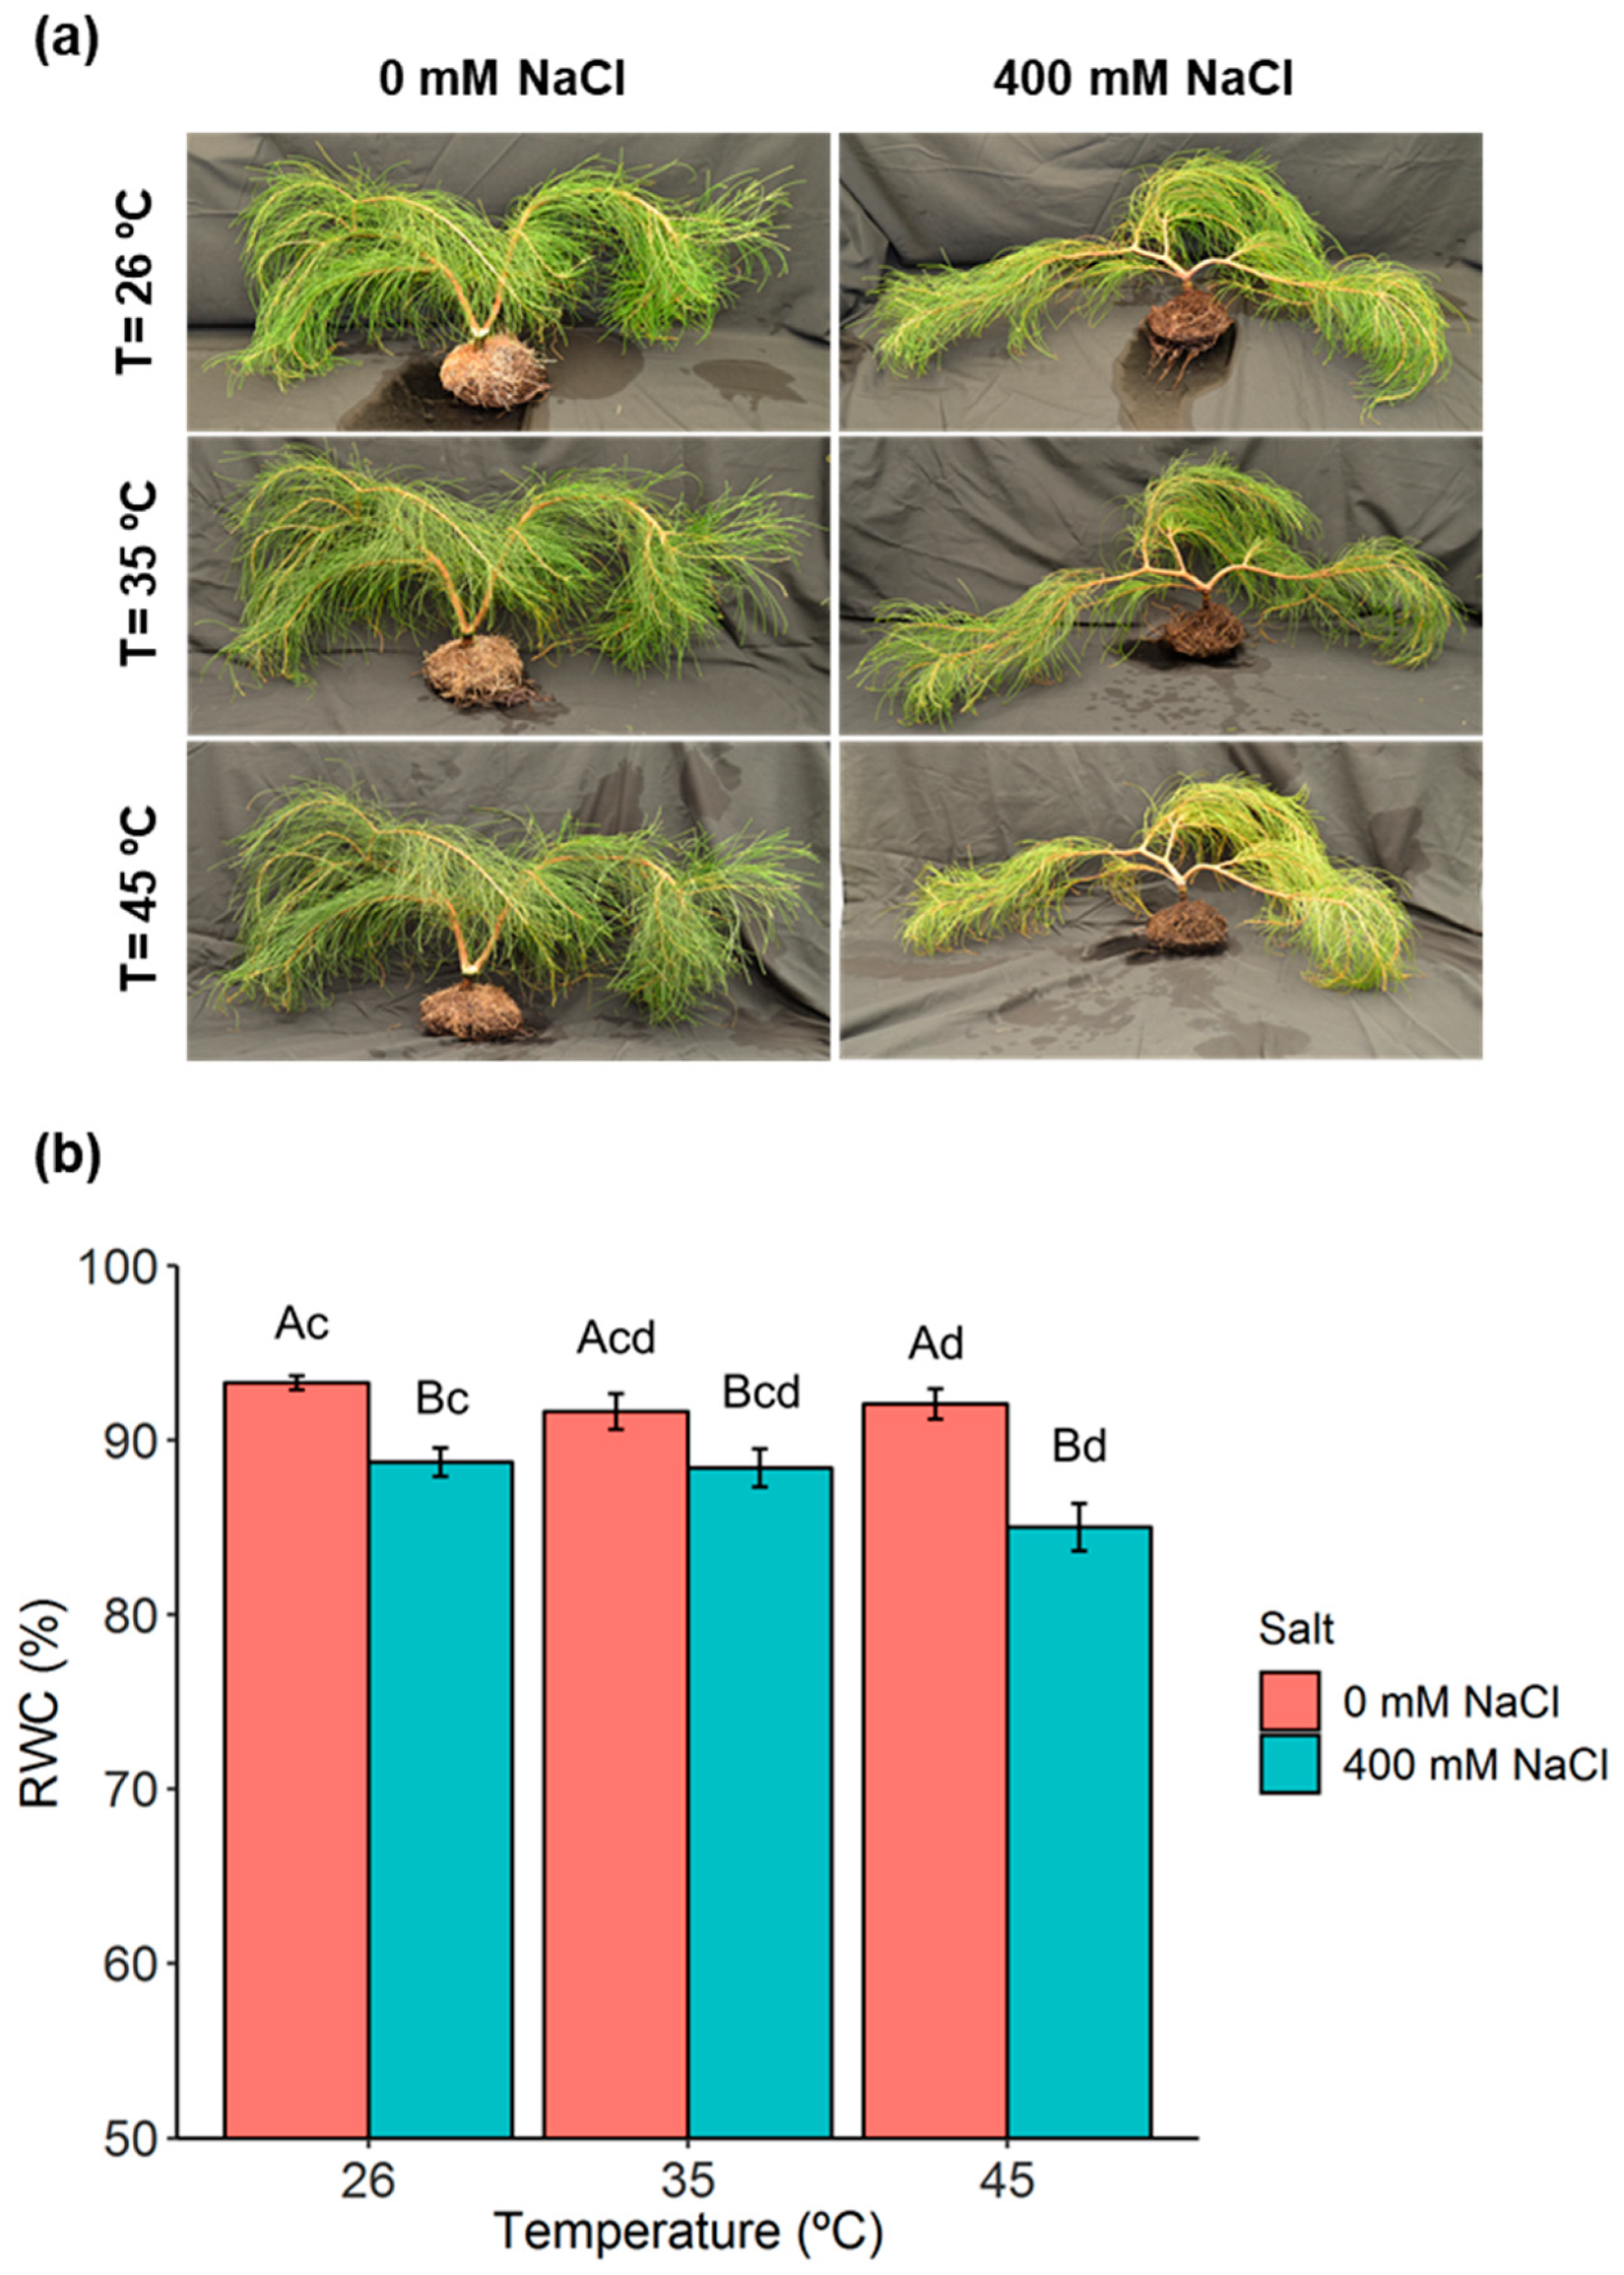
2.1. Phenotypic Analysis and Plant Water Relations

The effect of a single exposure to salt or heat stress conditions did not lead to major phenotypic changes in C. glauca plants. However, a pronounced visual phenotypic effect was observed at the harshest stress condition (400 mM NaCl, 45 °C) (Figure 1a). The impact of temperature on RWC was observed only at 45 °C, when compared to the control temperature (26 °C) and without salt exposure (Figure 1b). High salt concentration (400 mM NaCl) significantly decreased RWC values for all temperatures. This decrease was more pronounced at 400 mM NaCl, 45 °C; even when RWC values were reduced only to 85%.

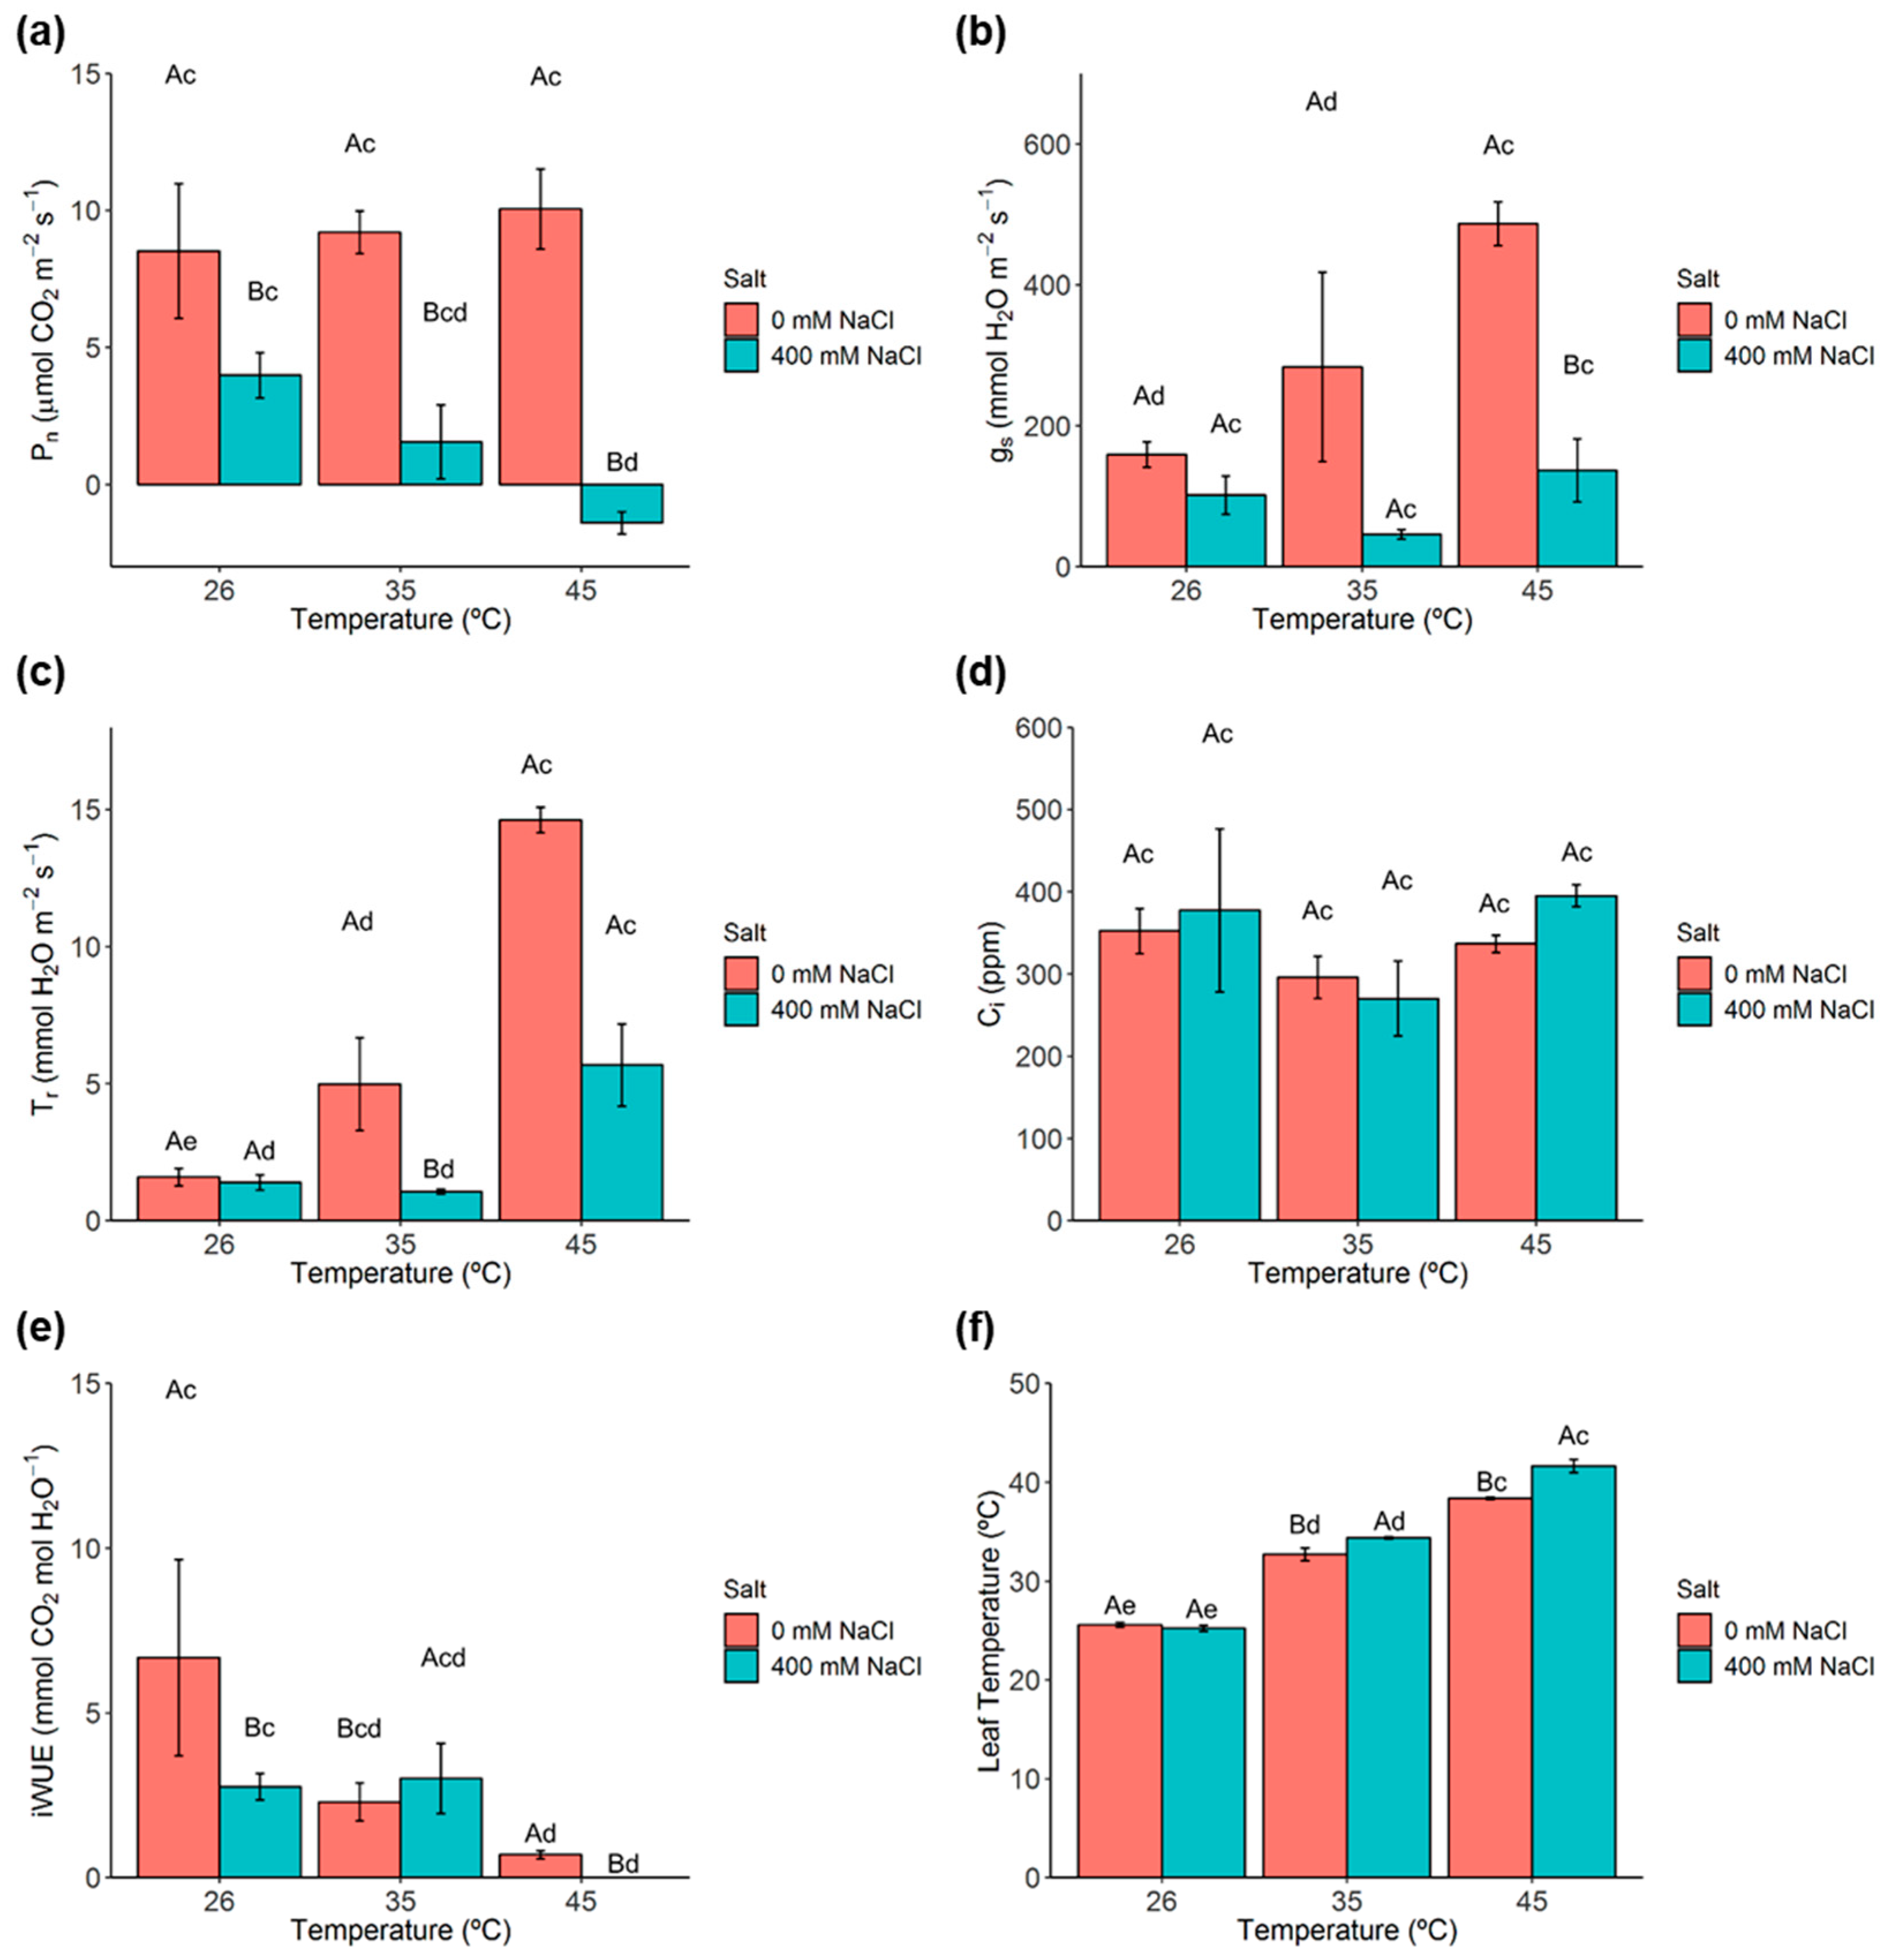
2.2. Photosynthetic Gas Exchanges

The net photosynthetic rate (Pn) was not reduced with increasing temperature imposition, even at 45 °C. In contrast, Pn was significantly reduced under single salt conditions (26 °C), and was even more affected with the superimposition of heat, which led to negative values in plants exposed to 400 mM NaCl and 45 °C (Figure 2a).
Single heat stress (0 mM NaCl, 45 °C) induced a significant increase of stomatal conductance to water vapour rate (gs) (Figure 2b). However, under both high temperatures and salt conditions (35 and 45 °C, 400 mM NaCl), significant differences emerged between salt treatments mostly due to the large gs increase in the 0 mM NaCl plants. Transpiration rate (Tr) followed a pattern close to that of gs, with significant increases under heat stress, while salt led to significant changes but only when combined with the highest temperatures (35 and 45 °C) (Figure 2c). Internal CO2 concentration (Ci) did not statistically change under all treatments (Figure 2d), suggesting that the observed reduction of gs in salt-exposed plants was not the main cause for the decline of Pn in these same plants. Regarding the instantaneous water use efficiency (iWUE), single exposure of salt, and heat led to significant reductions. However, a stronger iWUE reduction was observed under the simultaneous presence of both treatments (Figure 2e).
Significant increases in leaf temperature were promoted mainly by the rise in temperature (35 and 45 °C) as depicted from the similar patterns of 0 and 400 mM NaCl plants. The superimposition of salt led to significantly higher values of leaf temperature at 35 and 45 °C, likely related to the much lower Tr values in 400 mM NaCl plants as compared to 0 mM NaCl plants at those temperatures (Figure 2f).

2.3. Chlorophyll a Fluorescence

The impact of single and combined salt-heat stresses in the photosynthetic functioning was further evaluated through chlorophyll a fluorescence analysis (Table 1).
The maximal photochemical efficiency of PSII (Fv/Fm) was significantly affected only under the harshest stress condition (400 mM NaCl, 45 °C). The estimate of the quantum yield of non-cyclic electron transport (Y(II)) and the actual PSII photochemical efficiency (Fv’/Fm’) showed similar patterns of variation and decreased under both single stresses. This reduction was clearly stronger at 400 mM NaCl, 45 °C. The quantum yield of regulated energy dissipation of PSII (Y(NPQ)) significantly increased under salt conditions but only at 26 °C. Increasing temperatures also significantly increased Y(NPQ) in the 400 mM NaCl plants. Consequently, Y(NPQ) significantly increased at 400 mM NaCl, 45 °C. The quantum yield of non-regulated energy dissipation of PSII (Y(NO)) significantly increased under both single stresses, and consequently, strongly increased at 400 mM NaCl, 45 °C. The photochemical quenching based on the concept of separated (qP) antennae showed a similar pattern to that observed for Y(II), Fv’/Fm’ with a statistically significant reduction at 400 mM NaCl, 45 °C. The total photoinhibition (PITot) significantly increased under both single stresses, but showed the highest modifications at 400 mM NaCl, 45 °C. Keeping in mind that Total PI is the sum of the chronic (PIChr) and dynamic (PIDyn) photoinhibitions it is highly relevant that the strong rise in Total PI reported at this condition was due almost entirely to a large increase in PIChr.

2.4. Photosynthetic Pigments

Absolute levels for several photoprotective xanthophyll pigments, the de-epoxidation state (DEPS), and antioxidant carotenoids were next measured in C. glauca branchlets (Table 2 and Table S1). The levels of the xanthophyll cycle pigment violaxanthin (Viol) significantly decreased upon single salt stress with the concomitant synthesis of antheraxanthin (Ant) and zeaxanthin (Zea), which increased (also under heat conditions). As for the photoprotective (dissipative) Ant and Zea, the highest increases were observed under the harshest stress condition (400 mM NaCl, 45 °C). The de-epoxidation state (DEPS) was significantly increased by both single stresses, but particularly when they were combined. Lutein levels significantly decreased under salt conditions but significantly increased due to heat, without apparent interaction of these stress conditions. The levels of β-Carotene significantly decreased under salt stress conditions at 35 °C, whereas at higher temperatures (35 and 45 °C) and 0 mM NaCl, its levels significantly increased. The harshest stress condition led to a significant increase of β-Carotene in comparison with control conditions (0 mM NaCl, 26 °C).

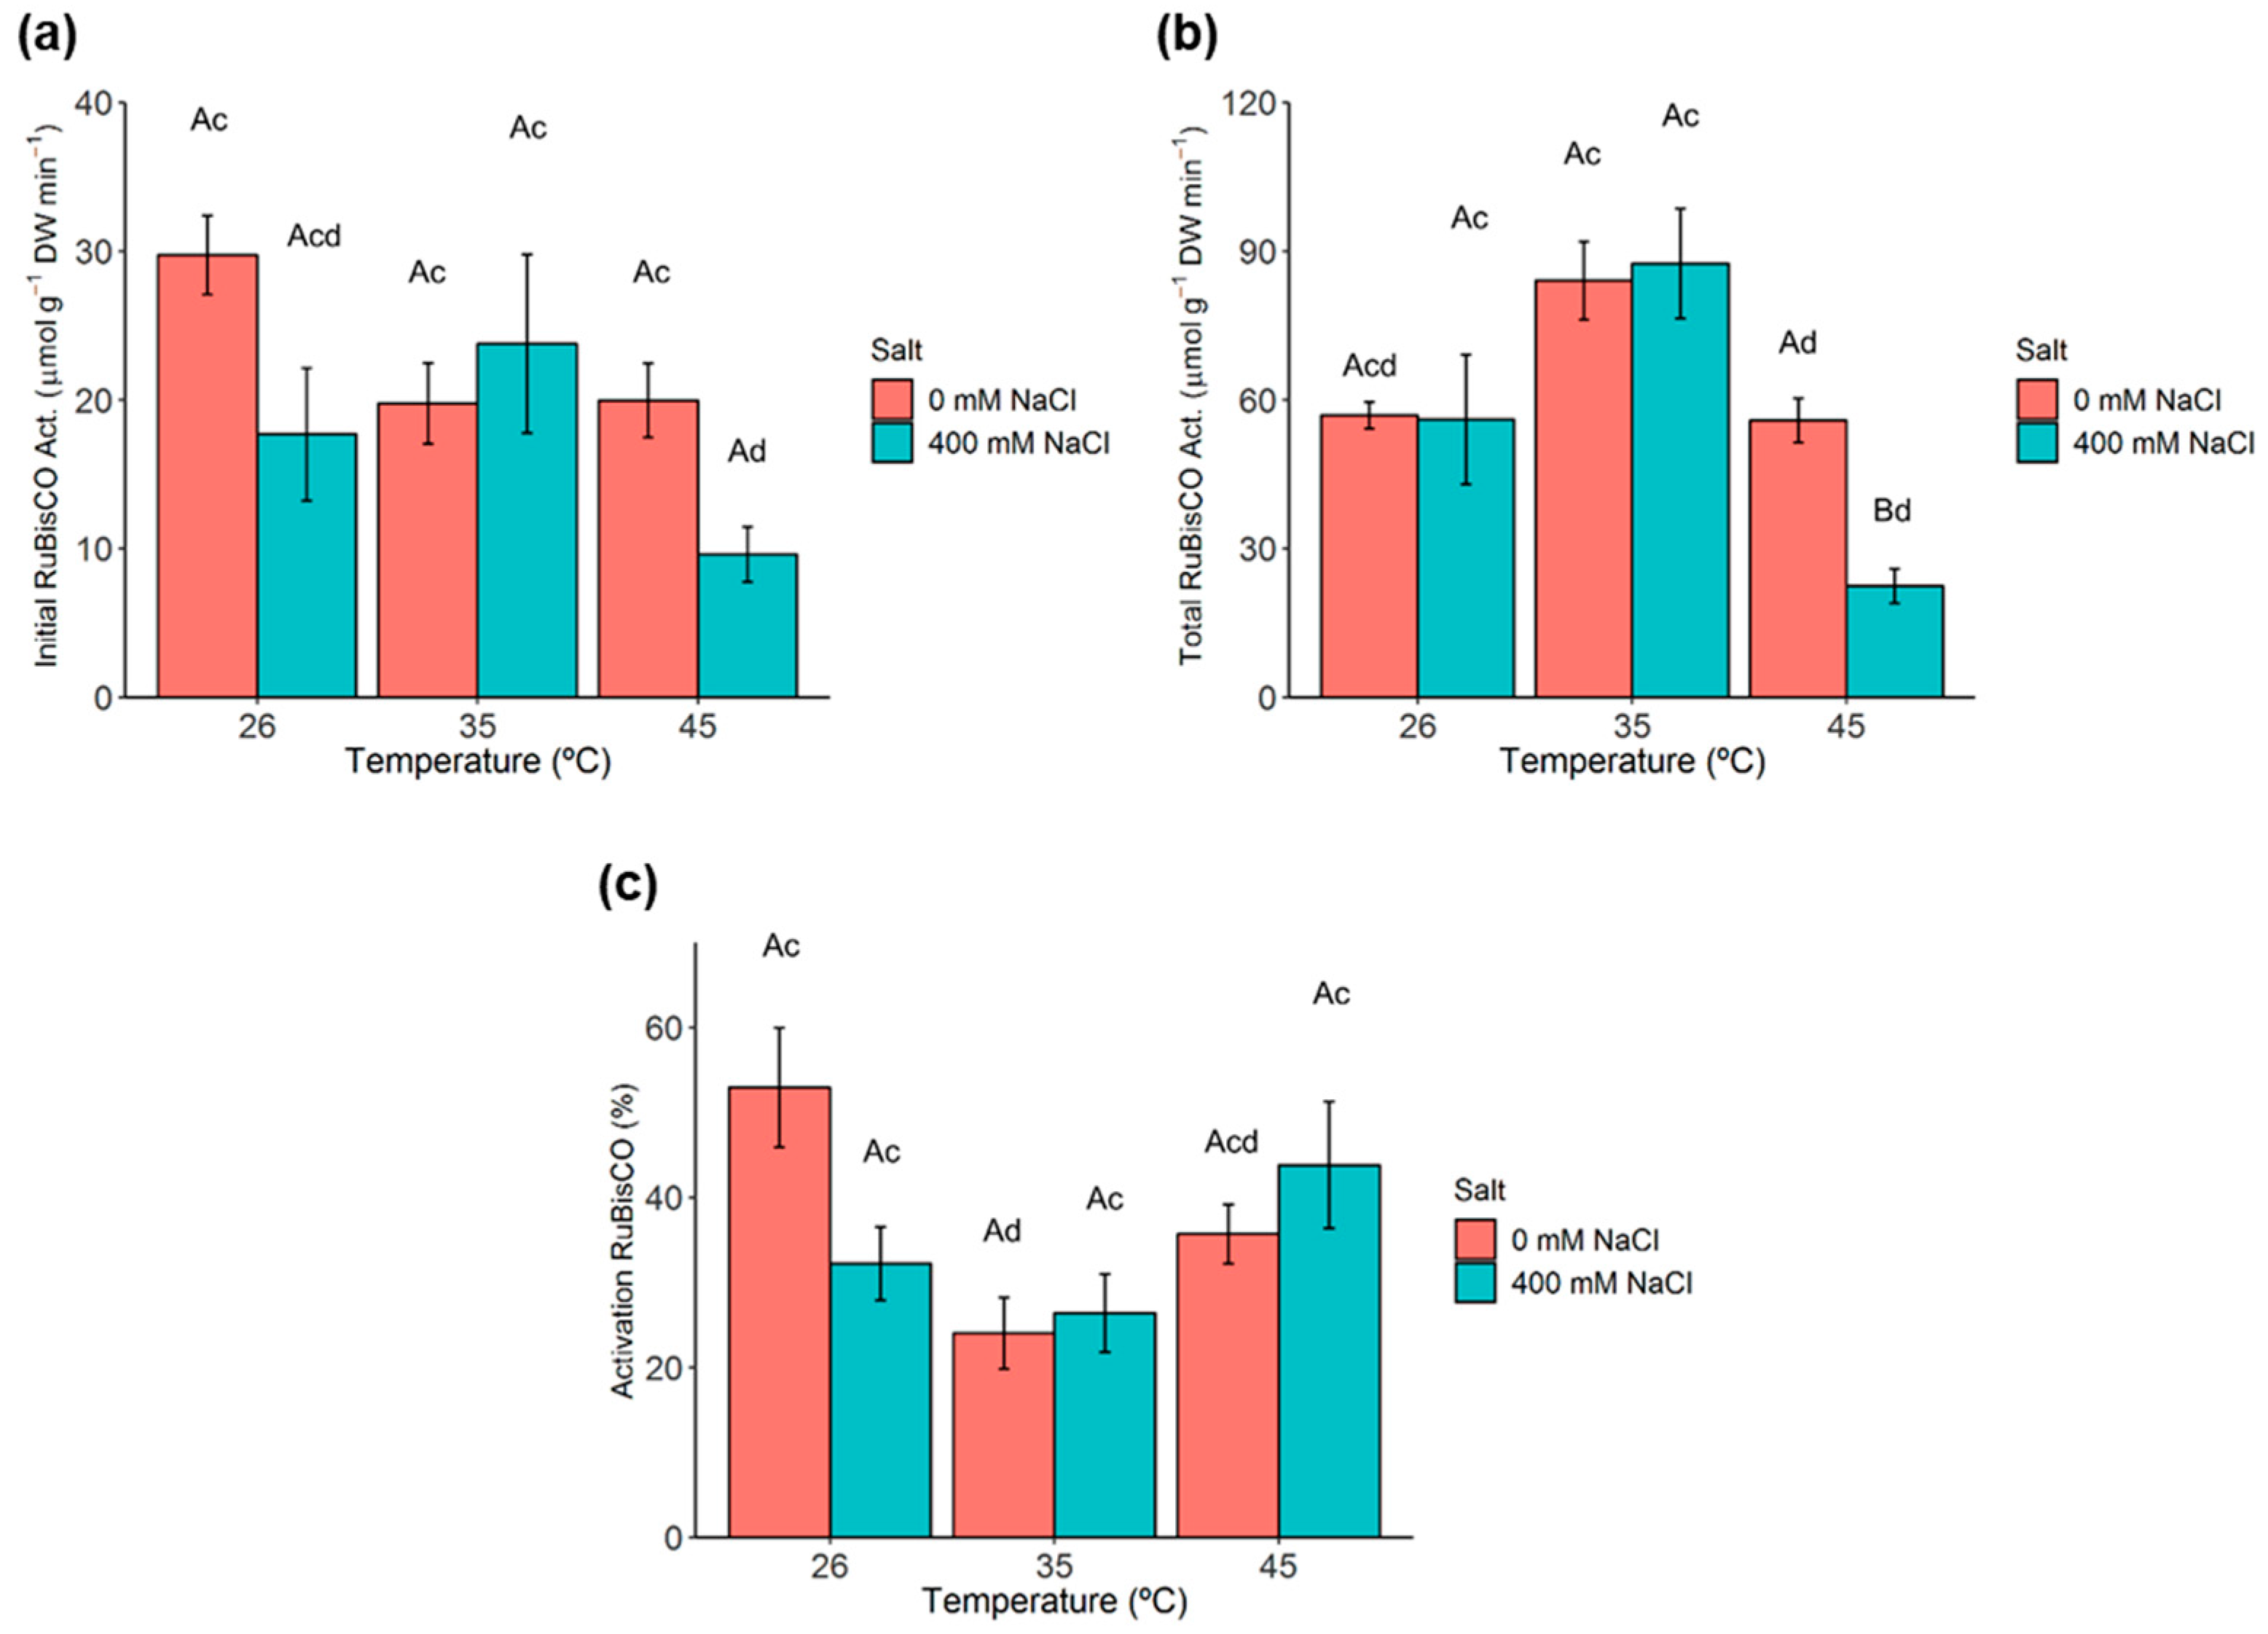
2.5. Ribulose-1,5-Biphosphate Carboxylase/Oxygenase (RuBisCO) Activity and Activation State

The initial activity of RuBisCO was not significantly impacted by both single stresses (Figure 3a). Notably, despite the total activity of RuBisCO did not significantly increase at 35 °C (Figure 3b), a significant reduction in the activation status in the 0 mM NaCl plants at this temperature was observed (Figure 3c). Indeed, only at the harshest stress condition (400 mM NaCl, 45 °C) were clear reductions in both activities observed. However, even under these conditions, the activation state remained unaltered.

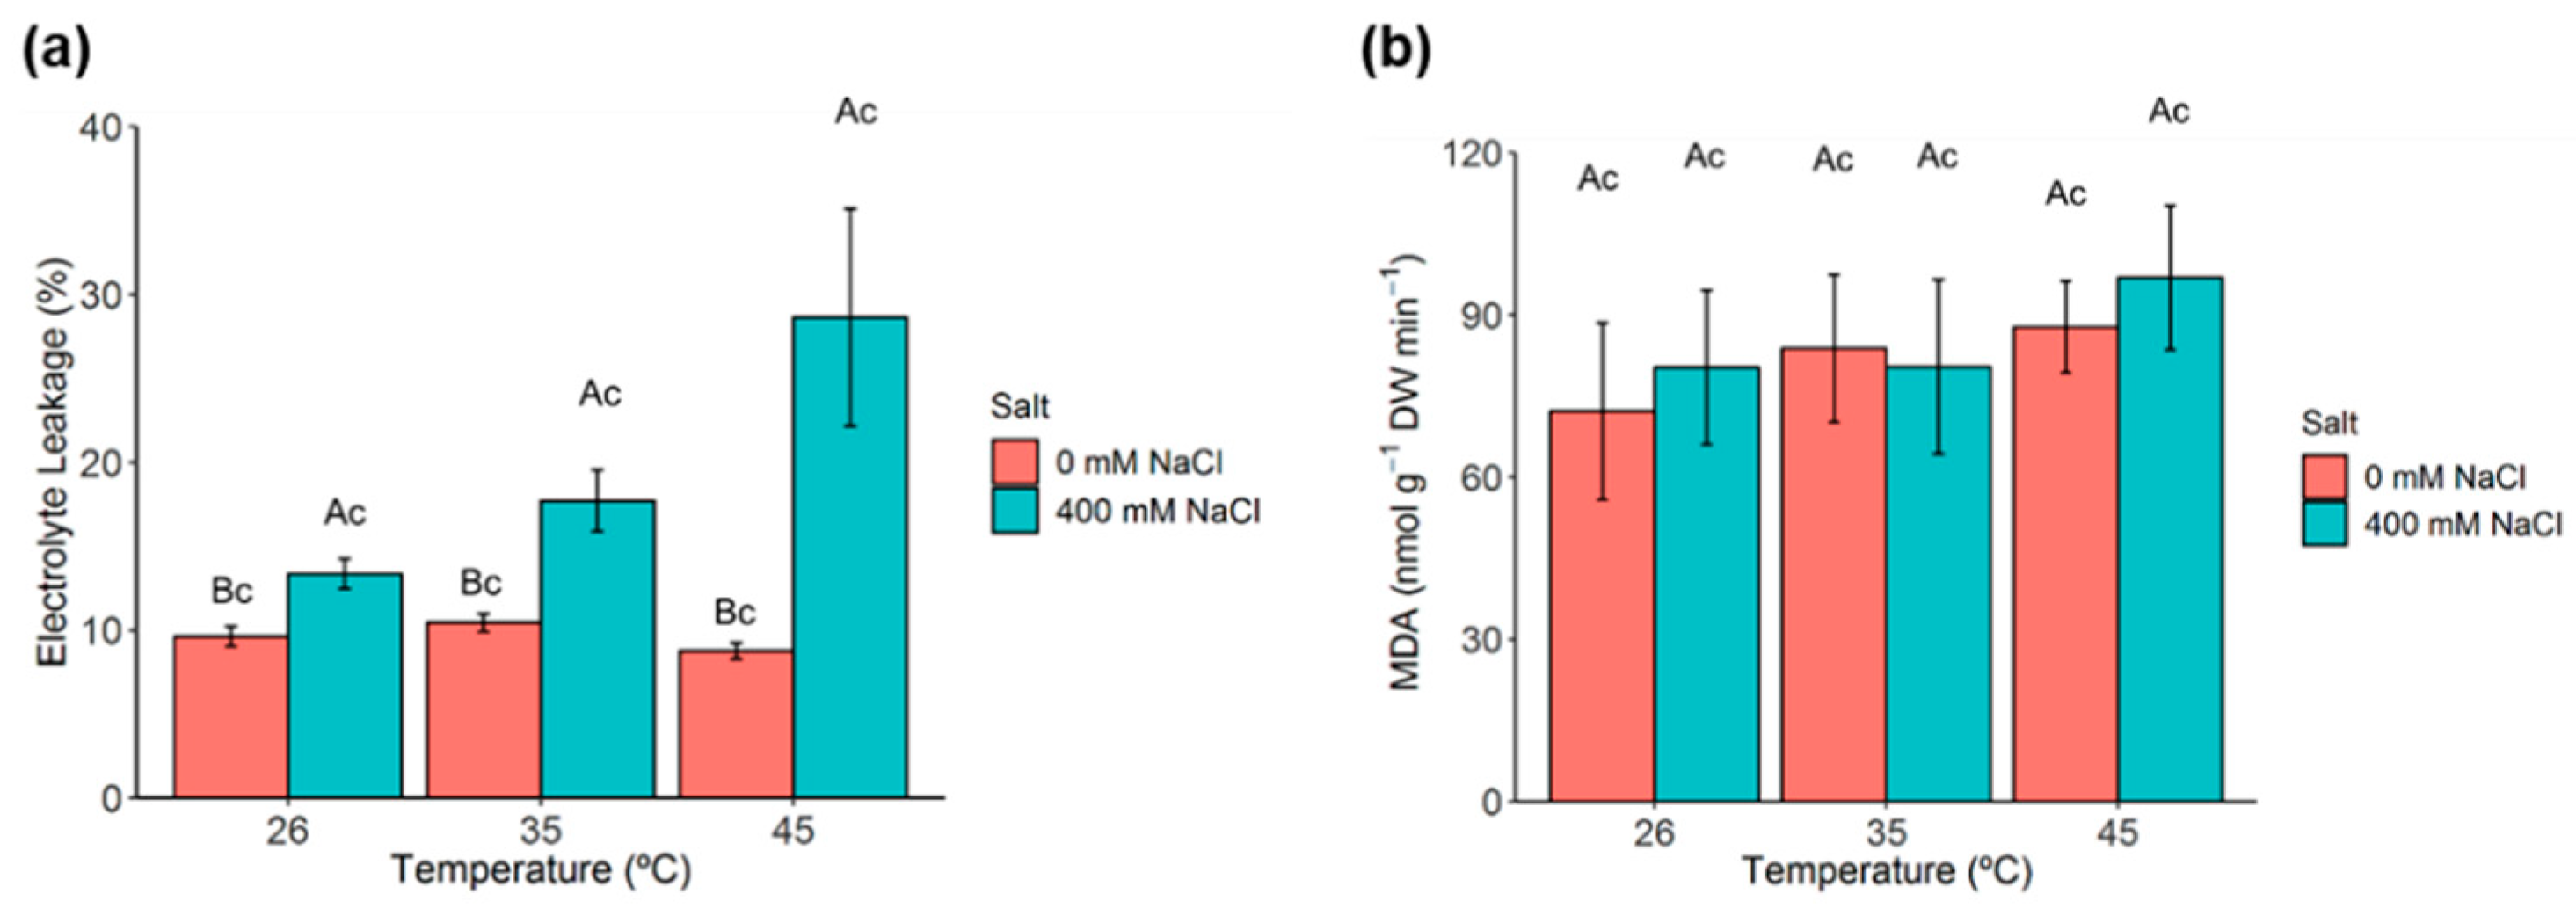
2.6. Membrane Permeability and Lipid Peroxidation

Membrane permeability and lipid peroxidation were assessed in C. glauca branchlets through electrolyte leakage and malonyldialdehyde (MDA) analyses, respectively. The percentage of electrolyte leakage significantly increased under salt conditions (Figure 4a). The MDA content did not change significantly under any salt or temperature treatment (Figure 4b).

2.7. Lipid Analyses

Total fatty acid (TFA) content, individual fatty acid (FA) composition, and the unsaturation (DBI) of total lipids were measured in C. glauca branchlets (Table 3). Only those demonstrated to significantly change in at least one condition are described.
Salt led to a significant decrease in the TFA content, while temperature did not change this parameter. Similarly, high salt concentration (400 mM NaCl) and high temperature (45 °C) significantly decreased the amount of linolenic acid (C18:3), with the latter one only at 400 mM NaCl. By contrast, both single stresses significantly increased linoleic acid (C18:2); however, this increase was more evident under salt conditions. Likewise, palmitic acid (C16:0) and oleic acid (C18:1) significantly increased under salt conditions (only at 45 °C). Additionally, increasing temperatures led to a significant increase of C16:0 and C18:1; however, for C16:0, this increase was only significant at 400 mM NaCl. Oppositely, both single stresses significantly decreased DBI at the harshest stress condition (400 mM NaCl, 45 °C).

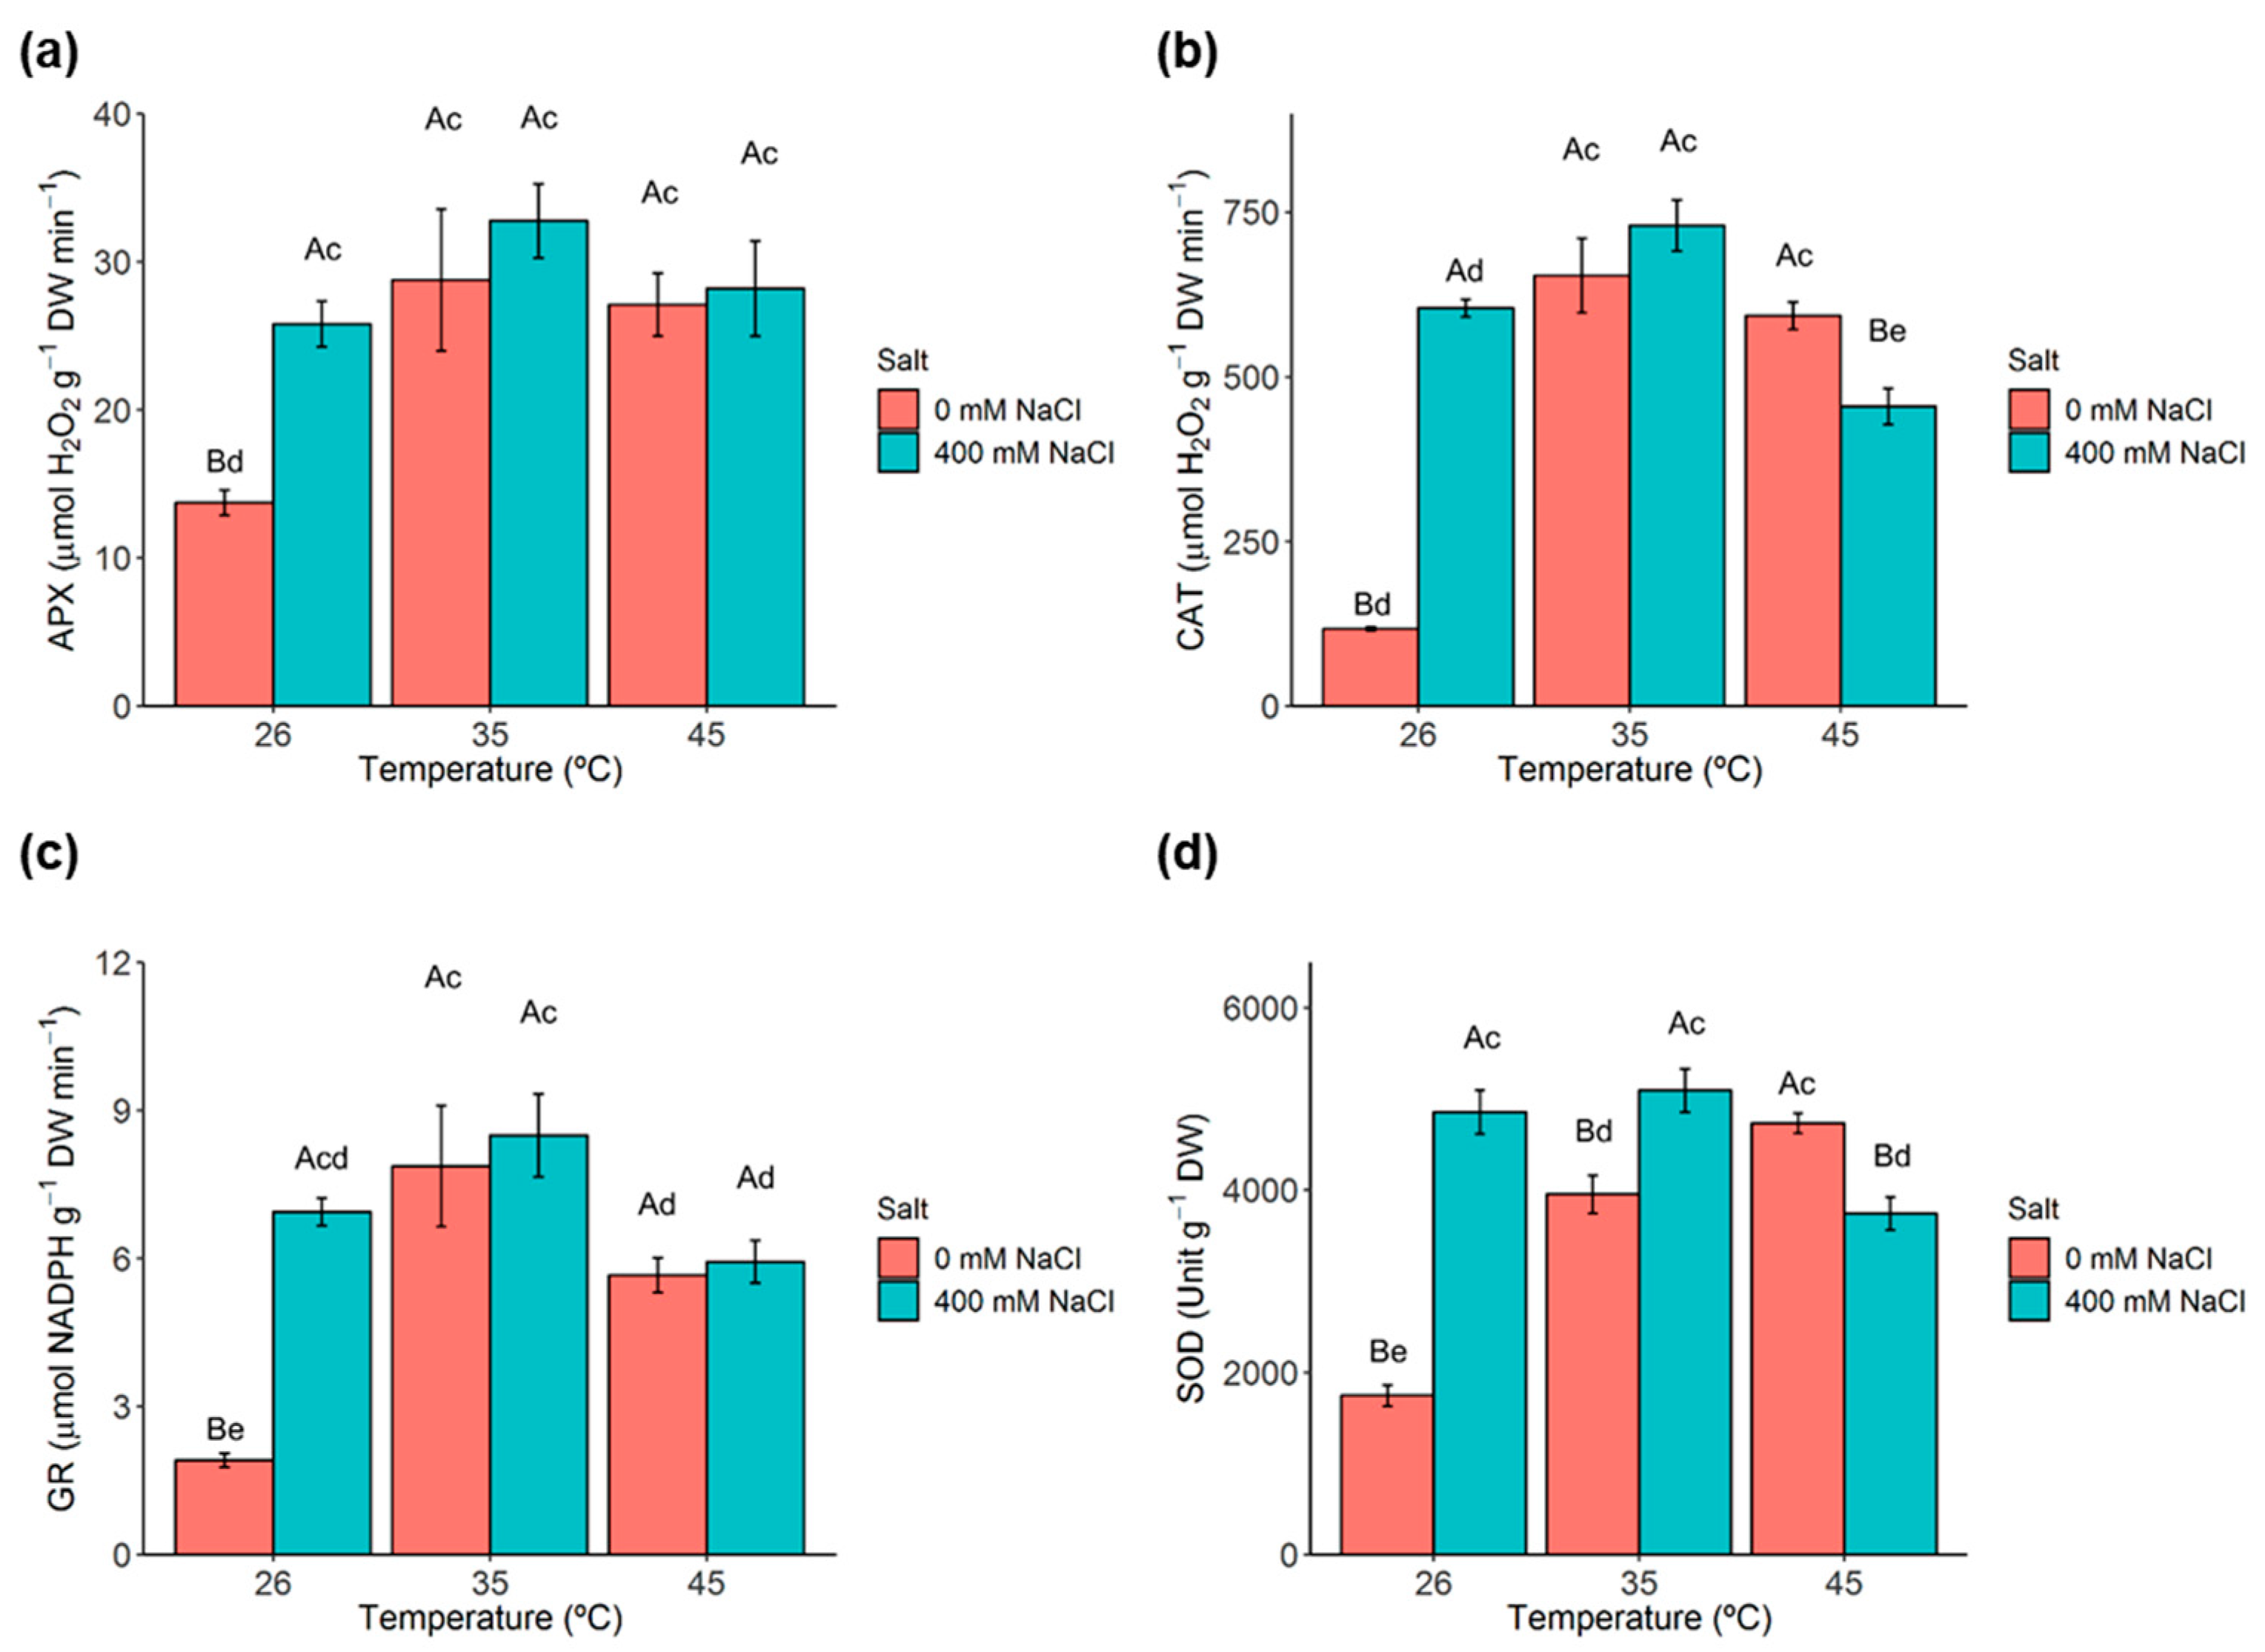
2.8. Antioxidant Enzymes

Both single and combined exposure to salt and heat stress significantly increased ascorbate peroxidase (APX) activity in C. glauca branchlets (Figure 5a). A similar pattern of variation was observed for catalase (CAT), in which single salt and heat conditions significantly increased CAT activity up to, and including, 35 °C. The harshest stress condition (400 mM NaCl, 45 °C) significantly decreased CAT activity with respect to the levels at 35 °C, although to levels higher than the control (0 mM NaCl, 26 °C) (Figure 5b). Glutathione reductase (GR) activity also significantly increased under single salt and heat conditions, with the most pronounced effect of salt observed at the lowest temperature (26 °C). The highest temperature (45 °C) resulted in significantly decreased GR activity at both control (0 mM NaCl) and 400 mM NaCl (Figure 5c). Similarly, superoxide dismutase (SOD) activity significantly increased under both salt (at 26 and 35 °C) and heat (only at 0 mM NaCl) conditions. By contrast, at 45 °C, salt conditions decreased SOD activity; however, such decrease did not reduce SOD activity at the harshest stress conditions (Figure 5d).

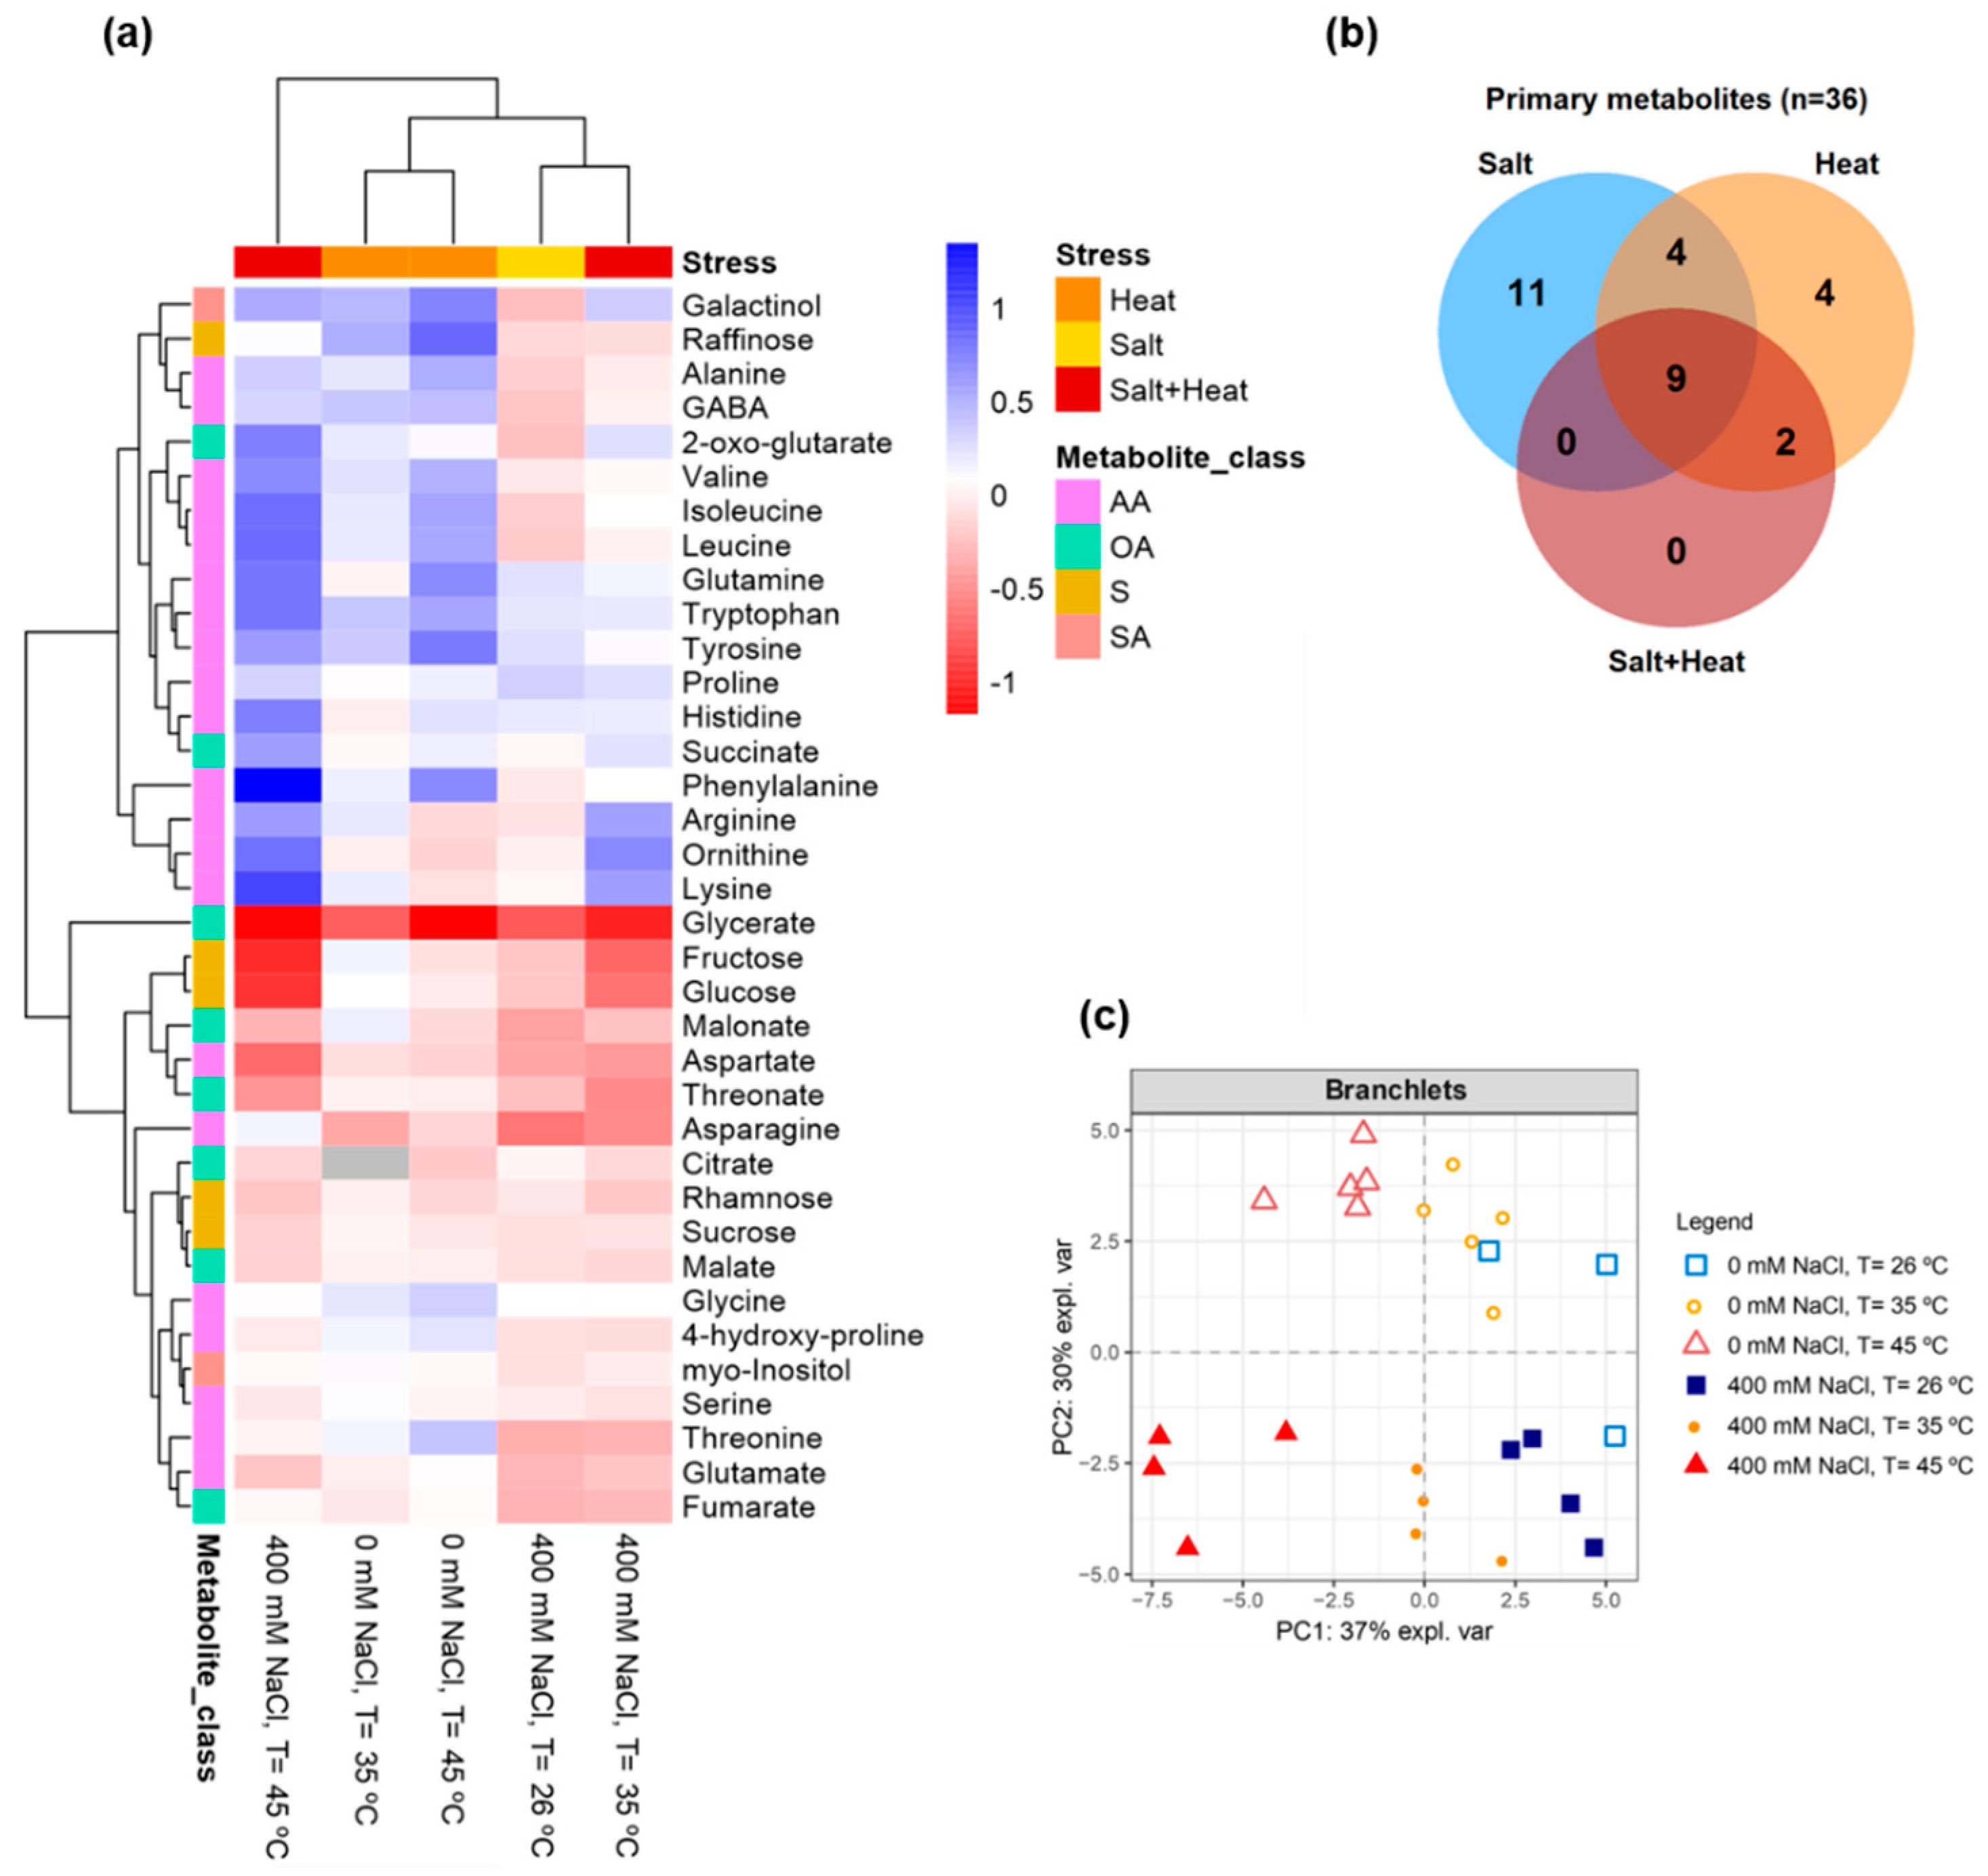
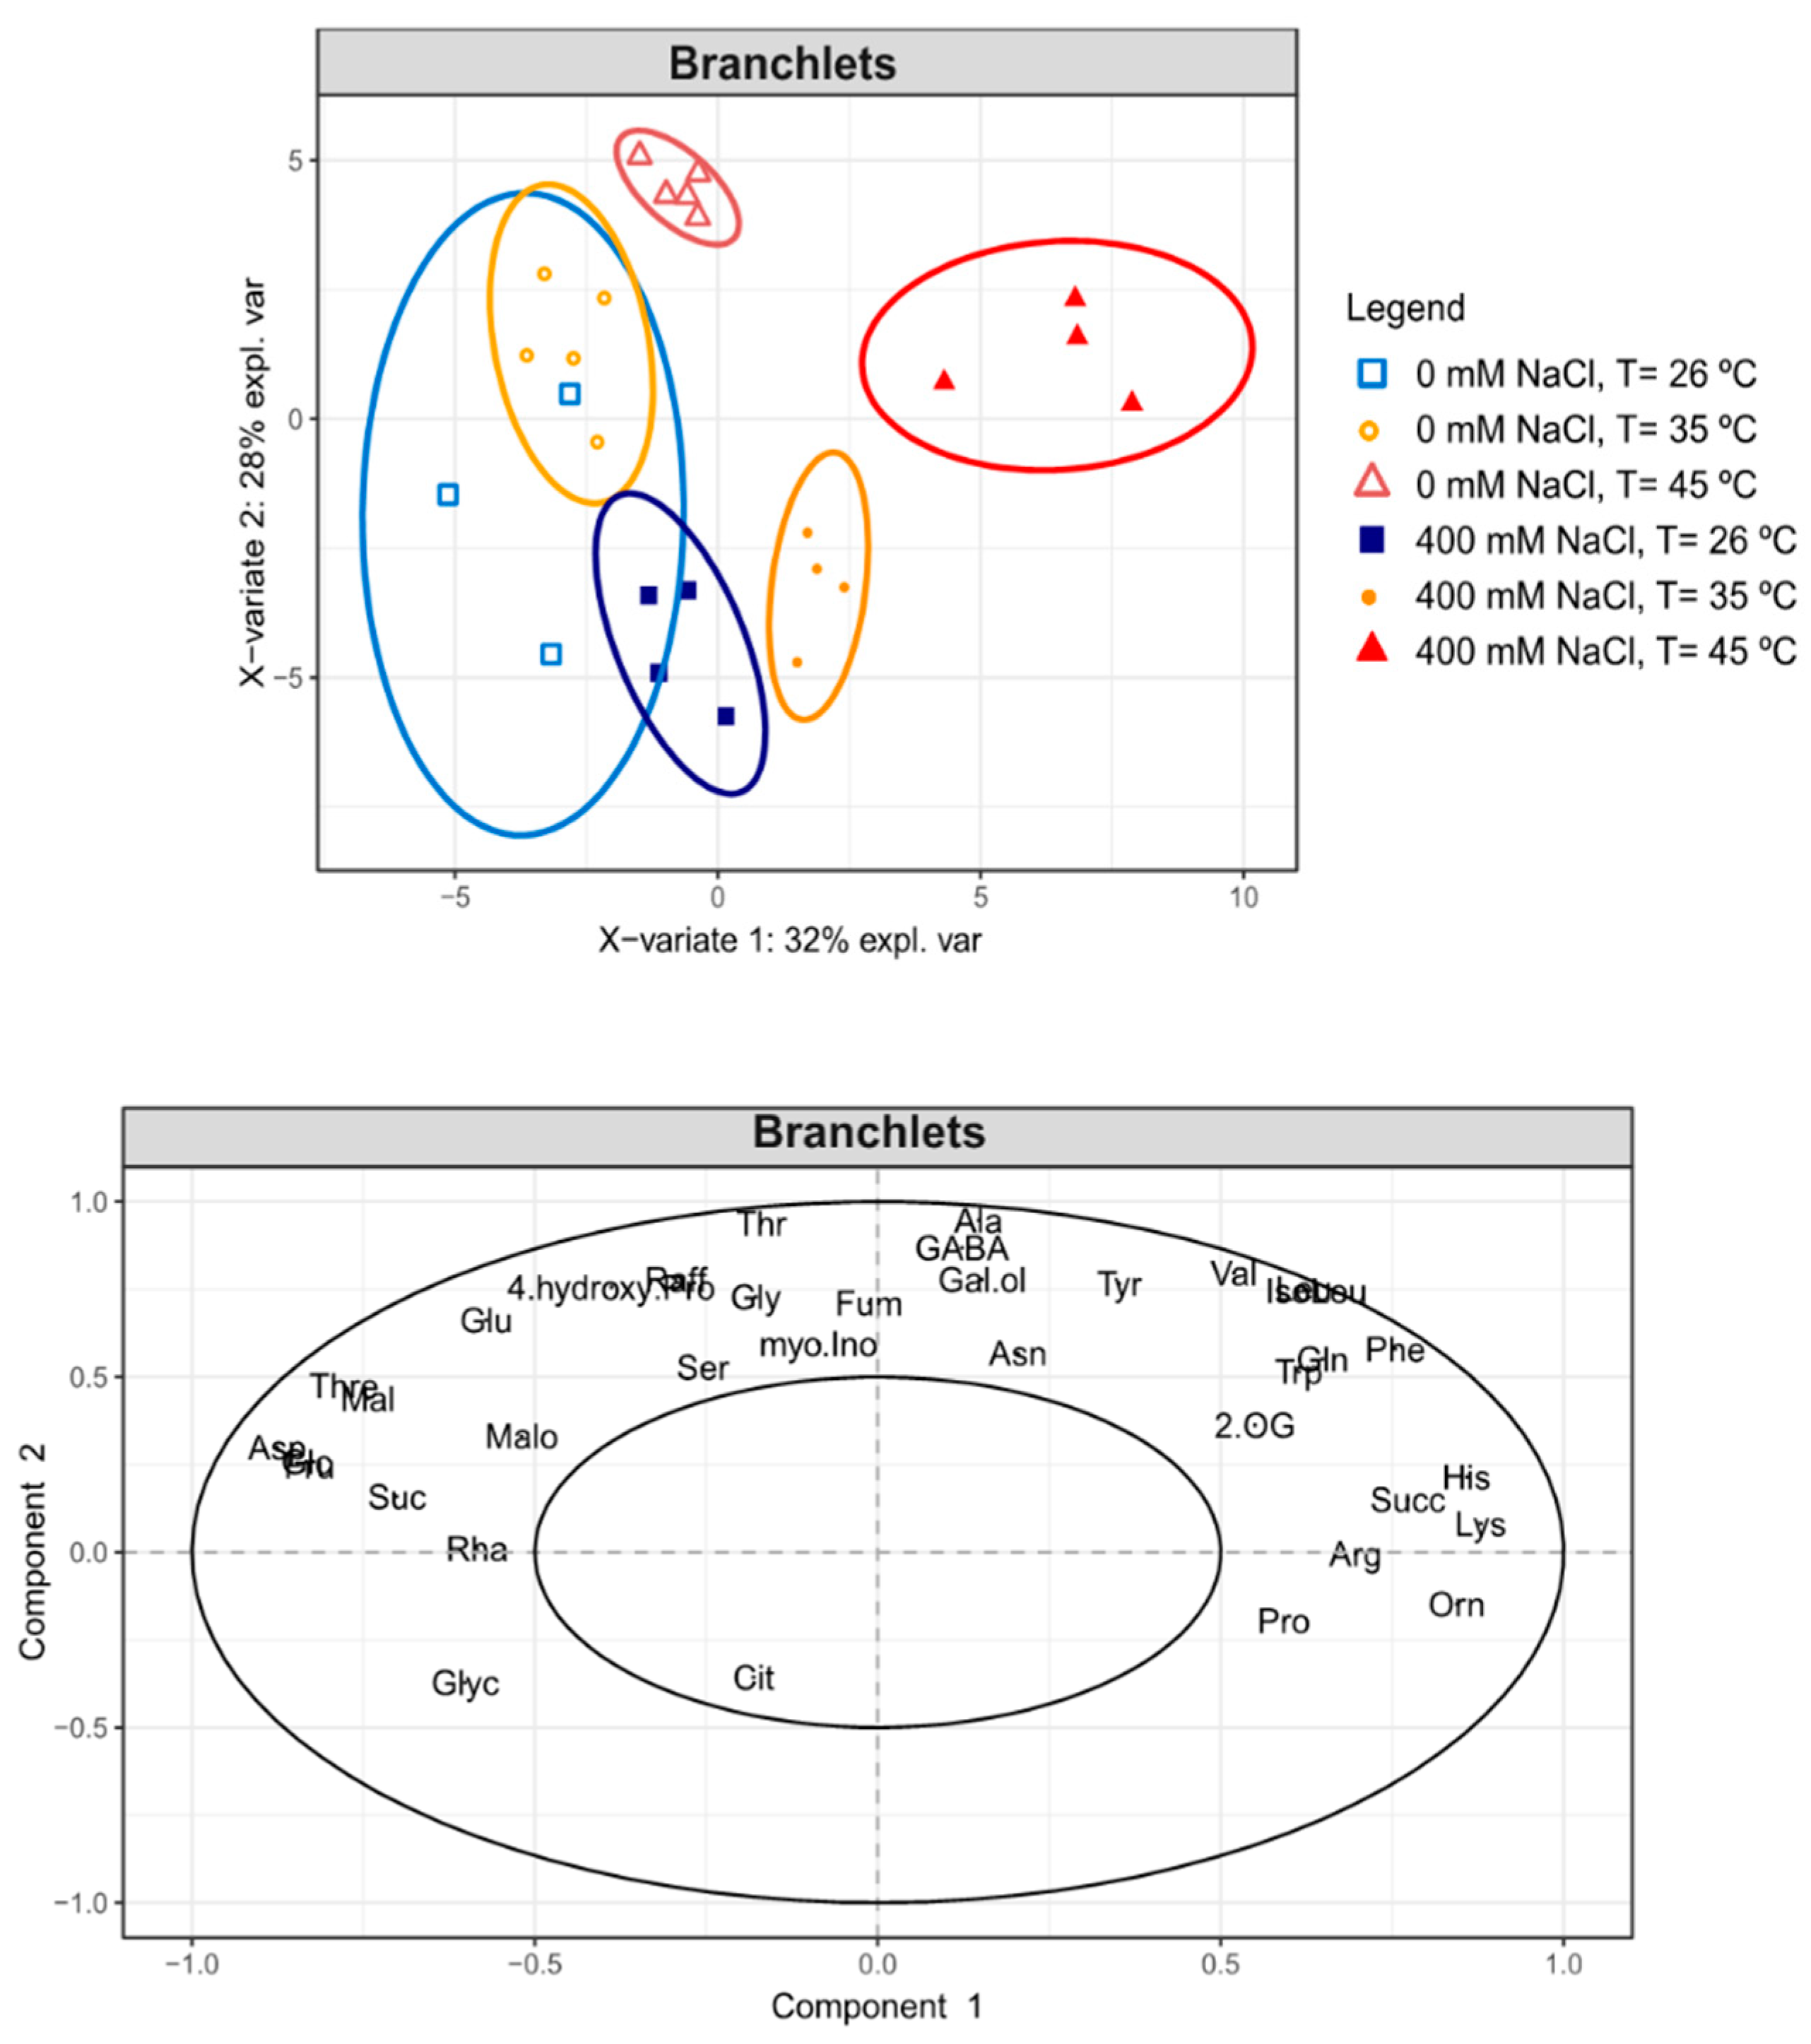
2.9. GC-TOF-MS Primary Metabolite Profiling Analysis

Primary metabolite profiling analysis allowed the detection of 36 metabolites in C. glauca branchlets (Figure 6a, Table S2). Under salt stress, two-way ANOVA analysis revealed that the relative levels of 11 primary metabolites significantly changed (fructose, glucose, rhamnose, sucrose, glutamate, proline, 4-hydroxy-proline, aspartate, malate, threonate and malonate) as shown in the Venn diagram (Figure 6b, Table S2). Of these, only proline significantly increased (2-fold), whereas fructose, glucose, rhamnose, sucrose, glutamate, 4-hydroxy-proline, aspartate, malate, threonate and malonate significantly decreased. By contrast, heat stress significantly changed the levels of the amino acids tryptophan, tyrosine, valine and glutamine (Figure 6a,b, Table S2). All these metabolites significantly increased at 35 °C (up to 2-fold) and 45 °C (up to 6-fold). On the other hand, galactinol, alanine, γ-aminobutyric acid (GABA) and fumarate were shown to significantly change by both single stresses, but not by combined salt-heat stress (Figure 6a,b, Table S2). These metabolites significantly decreased at 400 mM NaCl, and significantly increased under increasing temperatures of 35 and 45 °C (up to 5-fold). Lastly, single heat and combined salt-heat stresses significantly changed the levels of isoleucine and leucine, which increased up to 3-fold (heat stress) and up to 7-fold (salt-heat stress) (Figure 6a,b, Table S2).
Under both single and combined salt-heat stresses, nine primary metabolites were shown to significantly change; namely, raffinose, glycine, phenylalanine, histidine, ornithine, arginine, lysine, threonine and glycerate (Figure 6a,b, Table S2). Of these, the most representative significant increases were found for raffinose (up to 7-fold, heat stress), glycine (up to 2-fold, heat stress), phenylalanine (up to 5-fold, heat stress; up to 22-fold, salt-heat stress), histidine (up to 5-fold, salt-heat stress), ornithine (up to 6-fold, salt-heat stress), arginine (up to 4-fold, salt-heat stress), lysine (up to 10-fold, salt-heat stress) and threonine (up to 2-fold, heat stress), while significant decreases were observed for raffinose (salt stress), ornithine (heat stress), threonine (salt stress) and glycerate (for all stresses).
PCA revealed that salt treatments (0 and 400 mM NaCl) were separated along with the principal component 2 (PC2) (Figure 6c).
Regarding temperature conditions, it was observed that samples at 45 °C were clearly separated from control samples (26 °C) by the principal component 1 (PC1).
Similarly, partial least square discriminant analysis (PLS-DA) score plot revealed a clear separation of the different heat treatments, more evident for the salt-treated plants between samples at 26 and 45 °C (Figure 7). A different behaviour was observed between salt samples (0 versus 400 mM NaCl) at 26 °C, which did not separate. By contrast, the harshest stress condition (400 mM NaCl, 45 °C) was clearly separated from all the other conditions. The PLS-DA loading plot confirmed that the metabolites that statistically increased under both single and combined salt-heat stresses were also responsible for the discrimination of the different sample groups; phenylalanine, histidine, ornithine, arginine and lysine being clearly responsible for the separation of the harshest stress condition (400 mM NaCl, 45 °C) from the control condition (0 mM NaCl, 26 °C) (Figure 7, Table S2).

2.10. LC-HRMS/MS Target Secondary Metabolite Analysis

Target secondary metabolite analysis allowed the detection of 23 metabolite features in C. glauca branchlets, 16 of which were identified based on their product ion spectra and mass spectral databases (Figure S2, Tables S3 and S4). In particular, flavanols, mainly kaempferol and quercetin glycosides, were the major metabolites identified. Among them, kaempferol-O-glycosides [(kaempferol 7-O-alpha-rhamnoside-D-glucoside, m/z = 593 [M-H]; kaempferol 3-O-(6″-galloyl)-beta-D-glucopyranoside, m/z = 599 [M-H]; kaempferol-3-O-rhamnoside, m/z = 431 [M-H]; two kaempferol-3,7-O-bis-alpha-L-rhamnoside, m/z = 577 [M-H])] and quercetin-O-glycosides [(quercetin-3-O-arabinoside, m/z = 431 [M-H]; quercetin-3-O-(6″-O-galloyl)-beta-galactoside, m/z = 615 [M-H]; quercetin-3-O-glucuronide, m/z = 477 [M-H]; quercetin-7-O-rhamnoside, m/z = 447 [M-H])] were identified (Figure S2, Table S3). Anthocyanins [malvidin-3-O-galactoside; cyanidin-3-O-(6-O-p-coumaryl)-pentoside], gallic-acid derivatives [methyl 6-O-galloyl-beta-D-glucopyranoside (m/z = 345 [M-H]); methyl 4,6-di-O-galloyl-beta-D-glucopyranoside (m/z = 497 [M-H])] and complex ellagitannin polymeric structures [pedunculagin and two of its isomers (m/z = 783 [M-H]); casuarictin (m/z = 935 [M-H]) and two of its isomers] were also identified (Figure S2, Table S3).
The majority of the identified secondary metabolites showed to decrease under single heat conditions while their levels were differentially changed under salt conditions (Figure S2, Table S4). The harshest stress condition (400 mM NaCl, 45 °C) increased the levels of almost all detected secondary metabolites. Subsequent two-way ANOVA analysis revealed that only kaempferol-3-O-rhamnoside, unknown_1 and kaempferol-3,7-O-bis-alpha-L-rhamnoside significantly increased only by single salt stress (Table S4).
PCA did not reveal major trends among treatments (Figure S3). Subsequent PLS-DA revealed a pattern close to that of PCA (Figure S4). Indeed, the PLS-DA score plot revealed that almost all conditions clustered together. A minor discrimination between the control condition (0 mM NaCl, 26 °C) and the harshest stress condition (400 mM NaCl, 45 °C) was observed. The corresponding contribution plot revealed that most of the detected metabolites contributed to this discrimination. Indeed, the metabolites that showed to significantly change by two-way ANOVA (kaempferol-3-O-rhamnoside, unknown_1 and kaempferol-3,7-O-bis-alpha-L-rhamnoside) were the metabolites that mostly contributed to this separation.

3. Discussion

Single salt or heat stress promotes the development of a water deficit status within the cell [18,37,38]. In C. glauca branchlets, the observed significant decrease of RWC upon salt stress is consistent with previous reports in C. glauca NOD+ and KNO3+ plants submitted to salt concentrations up to 600 mM NaCl [28]. Gas exchanges (Pn, gs, Tr) were not negatively affected by heat stress in C. glauca, in line with the known environmental resilience of these plants [31]. However, these parameters were impacted under single salt stress. Interestingly, the harshest stress condition (400 mM NaCl, 45 °C) resulted in a strong impairment in Pn, which became negative. This reduction in Pn is likely to be independent of a stomata limitation since Ci did not change significantly, suggesting that a CO2 supply to the carboxylation sites was not limited [39]. With this observation being in keeping with previous results reported for C. glauca KNO3+ plants submitted to 400 mM NaCl [28]. The significant increase of both gs and Tr furthermore suggests that plants neither limit stomata opening nor their rates of transpiration.
Likewise, in tomato plants, combined salt-heat stress led to a higher increase of Tr in comparison to that observed for salt stress alone [14].
Indeed, single stress alone did not affect the photosynthetic functioning in C. glauca branchlets. However, under the harshest stress condition, mesophyll limitation of photosynthesis resulted from impairments in RuBisCO and PSII, presumably promoted by the increase in temperature. At the PSII level, the harshest stress condition evoked decreases in widely used photochemical indicators of overall photosynthetic function [40]. The quantum yield of non-regulated energy dissipation of PSII(Y(NO)) denoted the highest rise, in line with the higher photoinhibitory status suggested by the large increase in chronic (PIChr) and total (t Total PI) photoinhibitions. Y(NO) reflects the photoinactivation and non-regulated energy dissipation in PSII (heat and fluorescence) [41,42,43]. Y(NO) is mostly stable, even under stressful conditions [42], with a high value pointing to constraints in radiation-energy use due to a lack of both quantum yield of non-cyclic electron transport (Y(II)) and of regulated energy dissipation of PSII (Y(NPQ)) [43,44].
Despite the above-mentioned negative impacts, some mechanisms of controlled energy dissipation (qN, Y(NPQ), Zea, lutein, β-Carotene) that are well known to be crucial in the photoprotection of PSII were activated in C. glauca under stress conditions (Maxwell and Johnson, 2000 [40,45,46,47,48]. However, results show that under strict stress conditions, the triggered protective mechanisms did not prevent a significant impact at the photochemical efficiency of PSII and the biochemical (RuBisCO) performance levels.
Single salt and heat stresses are known to induce structural changes in the cellular membrane that alter its permeability, composition and fluidity [49,50]. Damages to cellular membranes are often associated with an overaccumulation of ROS that eventually induces the lipoperoxidation of membrane constituents, namely polyunsaturated fatty acids [51,52,53].
Single salt conditions (400 mM NaCl) significantly increased electrolyte leakage in C. glauca branchlets. Indeed, it was previously demonstrated that increasing salt concentrations (400 mM NaCl onwards) damaged membrane permeability in C. glauca NOD+ and KNO3+ plants [28]. On the other hand, any of the heat stress conditions changed membrane permeability, which indicates the ability of C. glauca to tolerate high temperatures. Nevertheless, at 400 mM NaCl, 45 °C, membrane permeability was severely impaired, whereas MDA levels remained quite stable under all stress conditions. The latter demonstrates that the oxidative degradation of membrane lipids was not triggered by any of these stress conditions. These results agree with the reported maintenance of MDA levels under increasing salt concentrations (up to 600 mM NaCl) in C. glauca plants [32].
The impact of single salt stress on TFA and individual FA composition (with the exception of C16:1 and of less representative FAs) showed similar results to those previously reported for C. glauca KNO3+ plants up to 400 mM NaCl [32]. In the case of C18:3, the most abundant FA in chloroplast membranes (ca. 70%) [54], its levels significantly decreased under all stress conditions (more pronounced at 400 m M NaCl, 45 °C). Indeed, decreased levels of C18:3 (with simultaneous increase of C18:1 levels) were associated to high-temperature tolerance in plants, whereas the same pattern is commonly associated to impairments of cellular membranes under salt stress conditions [51,55]. By contrast, C16:0 was found to significantly increase in C. glauca branchlets at 400 mM NaCl, 45 °C, while DBI levels were strongly reduced. Altogether, these data indicate the ability of C. glauca to adjust FA unsaturation levels under stress conditions while maintaining constant percentages of MDA. FA modifications, together with the impairment of the membrane permeability, likely indicate damages at the membrane levels, and agrees with the impacts on the photosynthetic functioning in PSII, at the harshest stress condition.
PCA revealed that both single and combined salt-heat stresses induced differential metabolite responses. Subsequent two-way ANOVA and PLS-DA analyses allowed identifying as stress-responsive metabolites (i.e., metabolites that significantly accumulated): (i) proline (for single salt stress), (ii) raffinose, galactinol, glycine, phenylalanine, tryptophan, tyrosine, alanine, valine, GABA, glutamine, threonine, isoleucine, leucine and fumarate (for single heat stress), (iii) phenylalanine, histidine, ornithine, arginine and lysine (single salt, heat and combined salt-heat stresses). Particular attention is given below to some of these metabolites.
Single heat stress significantly increased the levels of galactinol and raffinose; galactinol being one main precursor of the raffinose family oligosaccharides (RFOs) that include raffinose. These molecules are known to accumulate in plants under stress conditions where they act as osmoprotectants [56,57].
Amino acids constituted the major metabolite class identified in C. glauca branchlets. Amongst them, glycine levels were shown to significantly increase upon both single and combined salt-heat stresses (more pronounced under heat stress). Glycine is a photorespiratory amino acid, and this result might provide further support for an increased rate of the photorespiration pathway [58,59,60] under both single and combined salt-heat stresses.
Amino acids derived from the shikimate pathway; namely, phenylalanine, tryptophan and tyrosine accumulated under heat stress (phenylalanine also increased under combined salt-heat stress). Overall, the accumulation of these metabolites can be a useful source of C skeletons for the phenylpropanoid pathway and biosynthesis of secondary metabolites [61,62], but their accumulation is also tightly linked to the operation of the Calvin-Benson cycle, with shikimate derived amino acids being the most rapidly labelled following feeding of Arabidopsis or maize with 13CO2 [63,64].
Branched-chain amino acids; namely, valine, isoleucine and leucine have also been reported to accumulate under abiotic stress conditions [65,66]. Similarly, here we reported increased levels of valine (45 °C) and higher levels of leucine and isoleucine under single heat and combined salt-heat stresses in C. glauca branchlets.
GABA, proline and ornithine are some of the amino acids derived from 2-oxo-glutarate (2-OG); an intermediate of the mitochondrial tricarboxylic acid (TCA) cycle. An increase in the levels of metabolites involved in the GABA shunt (glutamate, GABA, alanine) was suggested to act as an intermediate supplier to feed the TCA cycle during heat stress and help maintain metabolic homeostasis [67]. Indeed, the GABA shunt is known to play a role in the regulation of C and N metabolism [68,69]. Proline significantly increased under salt stress, which agrees with its well-known osmoprotectant role in plants, including salt stress [70,71,72,73]). Ornithine is one of the most abundant amino acids in Casuarina plants and has been suggested to play a role as an intermediate metabolite in N transport [74]. This metabolite was previously reported as a salt-stress responsive metabolite in C. glauca plants [33]. Accordingly, ornithine levels significantly increased under single salt and combined salt-heat stresses.
Threonine and lysine comprise the aspartate-family amino acids derived from the TCA-cycle intermediate oxaloacetate (OAA). Lysine significantly increased under single salt, single heat and combined salt-heat stresses; increased levels of lysine, and subsequent decrease in the levels of TCA-cycle metabolites, have been reported in plants subjected to stresses that lead to energy deprivation [75]. Indeed, fumarate significantly decreased upon single salt stress, as previously observed in C. glauca tissues [33].
Single salt and heat stresses are also known to induce oxidative stress inside plant cells [71,76]. An overaccumulation of ROS causes oxidative damage to cell membranes leading to lipid peroxidation, photosynthetic damages and DNA degradation [77,78]. Increased activity of enzymatic ROS scavengers; namely, APX, CAT, GR and SOD reflects an oxidative environment inside the cells [53]. In C. glauca branchlets, APX, CAT, GR and SOD significantly increased under single salt stress. The activity of these enzymes was previously demonstrated to increase in C. glauca plants upon early salt stress conditions (i.e., 200 mM NaCl) [32]. Single heat and combined salt-heat stresses also significantly increased the activity of these enzymes; however, this increase was not so pronounced at the highest temperature (45 °C). These results likely contribute to the absence of lipoperoxidation under the studied stress conditions.
Important non-enzymatic ROS scavengers, including flavonoids (flavones and flavonols) have been regarded as being part of a secondary antioxidant system that complements the action of enzymatic ROS scavengers [53,79].
LC-HRMS/MS target secondary metabolite analysis in C. glauca branchlets under both single and combined salt-heat stresses allowed detecting kaempferol-O-glycosides and quercetin-O-glycosides. Two-way ANOVA analysis, together with the observed overlapping of the studied stress conditions in the PLS-DA, likely suggests that C. glauca branchlets did not induce the activation of a non-enzymatic ROS scavenger flavonoid-based secondary antioxidant system.

4. Materials and Methods

4.1. Plant Growth Conditions and Stress Treatments

Approximately 100 needle-like branchlets (8–10 cm long) of a 2-year old Casuarina glauca Sieb. Ex Spreng. plant was used for vegetative propagation in Broughton and Dillworth’s (BD) modified medium [80] after immersion in 50 ppm of indole butyric acid (IBA) for 24 h [81]. 1-year old C. glauca plants were transferred into a walk-in growth chamber (10000 EHHF, ARALAB, Portugal) under environmental controlled conditions of photoperiod (12 h), temperature (26/22 °C, day/night), relative humidity (70%), and irradiance (ca. 500 µmol m−2 s−1). Plants were divided in 2 groups and submitted to 0 mM (control) and 400 mM NaCl conditions. Salt enhancement in the hydroponic nutrient solution [(BD) modified medium] was gradually imposed (50 mM NaCl week−1) to avoid osmotic shock and to allow the plants to express their potential for acclimation. Plants were kept for 1 more week at 400 mM NaCl before the temperature treatment began. Two plant groups were gradually submitted to a diurnal temperature rise (1 °C day−1) to avoid heat shock, from 26 °C (control) to 45 °C (Figure S1). Measurements were performed at 26, 35 and 45 °C. Plants were kept for 5 days at 35 and 45 °C.

4.2. Harvest and Storage of Casuarina Glauca Branchlets

C. glauca branchlets were harvested at each temperature during the same daylight period after ca. 2 h (10–12 h) of irradiance (ca. 500 µmol m−2 s−1), immediately frozen in liquid nitrogen, and stored at −80 °C until further analyses. Three to five independent plants in the vegetative developmental stage were used per independent treatment.

4.3. Plant Water Relations

Relative water content (RWC) measurements were performed as previously described in [28]. RWC was determined at midday using 9 C. glauca branchlet pieces (1.5–2.0 cm long) per biological replicate.

4.4. Gas Exchange Measurements and Chlorophyll a Fluorescence

Gas exchanges were determined following [82]. The rates of branchlet net photosynthesis (Pn), stomatal conductance to water vapour rate (gs), transpiration rate (Tr), internal CO2 concentration (Ci) and leaf temperature were assessed at each temperature condition under photosynthetic steady-state conditions after ca. 2 h (10–12 h) of irradiance (ca. 500 µmol m−2 s−1) using a CO2/H2O portable open-system infrared gas analyser (CIRAS 1, PP Systems,Amesbury, MA, USA).
Chlorophyll (Chl) a fluorescence parameters were determined on the same C. glauca branchlets used for the gas exchange measurements using a PAM-2000 system (H. Walz, Effeltrich, Germany) as previously described [28,44], and applying the formulae discussed elsewhere [41,83,84]. Measurements of the minimal fluorescence from antennae (Fo), maximal fluorescence of the primary PSII (Fm), and maximal photochemical efficiency of PSII (Fv/Fm) were performed overnight dark-adapted C. glauca branchlets.
Another set of parameters was evaluated under photosynthetic steady-state conditions, using ca. 510 μmol m−2 s−1 of actinic light and superimposed saturating flashes: qP, qL, NPQ, Y(II), Y(NPQ), Y(NO), Fv′/Fm′ and PSII photoinhibition indexes (For more details, see Methods S1).

4.5. Photosynthetic Pigment Measurements

Carotenoids were assessed from 2-3 C. glauca branchlet pieces FW (ca. 50 mg). Sample processing and subsequent reverse-phase HPLC analysis were carried out as described in [85] using an end-capped (C18) 5 μm Spherisorb ODS-2 column (250 × 4.6 mm). Detection was performed at 440 nm in an HPLC system (Beckman, System Gold, Tulsa, OK, USA) coupled to a diode-array detector (Model 168; Beckman, Tulsa, OK, USA). Identification and quantification were performed using individual authentic standards (Merck Life Science S.L., PT).

4.6. Ribulose-1,5-Bisphosphate Carboxylase/Oxygenase Activity

Ribulose-1,5-bisphosphate carboxylase/oxygenase (RuBisCO: EC 4.1.1.39) enzymatic activities were determined in ca. 200 mg FW of frozen C. glauca branchlet tissues. Each sample was homogenised in a pre-cooled pestle and mortar using 100 mg of insoluble polyvinylpyrrolidone (PVPP) and 1 mL of extraction buffer 100 mM Tris-HCl (pH 8) containing 10 mM MgCl2, 15 mM NaHCO3, 10 mM β-mercaptoethanol, 2 mM ditiotreitol (DTT), 1% (v/v) Triton X-100, 10% (v/v) glycerol and 2% (v/v) of a cOmplete™ EDTA-free Protease Inhibitor. Extracts were centrifuged (16,000× g, 20 min, 4 °C) and the supernatant was used for enzyme assays. The initial and total activities of RuBisCO were determined following the 3-PGA-dependent NADH oxidation at 340 nm and 25 °C, in a final volume of 1 mL [86].

4.7. Electrolyte Leakage

Membrane permeability was determined using 9 branchlet pieces (ca. 1.5 cm), rinsed 3 times, and subsequently floated in flasks containing 15 mL of demineralized water. Water conductivity was measured using a conductimeter (Crison GLP31, Crison Instruments, S.A., Spain) following a 24 h period of floating at ca. 20 °C as described previously [87]. Total conductivity was obtained after keeping the flasks in an oven at 90 °C for 2 h, followed by cooling down to 20 °C. Electrolyte leakage was expressed as the percentage of total conductivity.

4.8. Lipid Analyses

Lipid components of cellular membranes were determined as previously described [88]. Briefly, ca. 1 g FW frozen C. glauca branchlet tissues were boiled for 2 min in distilled water to stop lipolytic activities. Total lipids were extracted in a mixture of chloroform/methanol/water (1/1/1; v/v/v). For fatty acid (FA) analysis, aliquots of total lipid extracts were saponified. Heptadecanoic acid (C17:0) was added as internal standard, followed by methyl esterification with trifluoroborane (BF3)-methanol. Two methylation replicates per sample were performed for each extract. Fatty acid methyl esters were analysed with GC-FID (CP-3380, Varian, CA, USA). For more details, see Methods S2.

4.9. Antioxidant Enzyme Activities

Antioxidant enzyme activities were determined from 1 g FW frozen C. glauca branchlet tissues. For superoxide dismutase (SOD; EC 1.15.1.1) and glutathione reductase (GR; EC1.6.4.2) activities, branchlet tissue was homogenised in 1.0 mL of 100 mM sodium phosphate buffer (pH 7.8) containing 1% of polyvinylpyrrolidone (PVPP) and centrifuged (10,000× g, 15 min, 4 °C). The supernatant was used for the estimation of SOD and GR. SOD activity was estimated following the enzyme activity that inhibited the photoreduction of NBT to blue formazan by 50% [89]. GR activity was measured following the absorbance decrease at 340 nm corresponding to the NADPH oxidation rate [90].
For catalase (CAT; EC 1.11.1.6), branchlet tissue was homogenised in 1.0 mL of 100 mM sodium phosphate buffer (pH 7.0) containing 1% PVPP followed by centrifugation (10,000× g, 20 min, 4 °C). The supernatant was used for the estimation of CAT. CAT activity was estimated based on the decrease in absorbance of H2O2 at 240 nm [91].
For ascorbate peroxidase (APX; EC 1.11.1.11), the homogenisation step also included 2.0 mM ascorbic acid followed by centrifugation (10,000× g, 20 min, 4 °C). APX activity was estimated through ascorbate consumption monitored at 290 nm, using an extinction coefficient of 2.8 mM−1cm−1 [92]. All activity assays were performed at 25 °C.

4.10. GC-TOF-MS Primary Metabolite Profiling Analysis

Primary metabolites were extracted from 100 mg FW fine powder of C. glauca branchlet tissue in 1400 μL methanol containing 60 μL of ribitol (0.2 mg mL−1 in water) as internal standard [93]. For more details, see Methods S3. Biological variations were controlled by analysing fatty acid methyl esters (FAMEs) internal standard markers and a quality control (QC) standard solution of 41 pure reference compounds (i.e., the most detected and abundant metabolites) throughout the analysis. Primary metabolite profiling analysis of the derivatised samples (1 µL aliquots) was performed on an Agilent 6890N gas chromatograph (Agilent Technologies, Böblingen, Germany) and a LECO Pegasus III TOF-MS running in electron ionisation (EI) mode (LECO Instrumente, Mönchengladbach, Germany) [93]. For more details, see Methods S3. GC-TOF-MS data were evaluated using the automated mass spectral deconvolution and identification system (AMDIS) software. Primary metabolites were annotated using the TagFinder software [94], matching mass spectral and retention time index to the reference collection of authenticated standard substances from the Golm Metabolome Database (GMD, http://gmd.mpimpgolm.mpg.de, last accessed on 12 December 2019) [95]. The relative abundance of primary metabolites was normalised considering the FW/dry weight (DW) ratio and the signal intensity of the internal standard (ribitol). Metadata information following the minimum reporting standard guidelines of the Metabolomics Standard Initiative (MSI) [96] can be found in Table S5.

4.11. LC-HRMS/MS Target Secondary Metabolite Analysis

Secondary metabolites were extracted from 100 mg FW fine powder of C. glauca branchlet tissue in 500 µL methanol 80% (v/v) containing isovitexin (4 µg mL−1) as internal standard. LC-HRMS/MS was performed as previously described [97]. For more details, see Methods S4. Metabolite annotation was performed following the approach described in [35]. MS/MS data interpretation was performed by matching the spectra against the METLIN MS/MS (https://metlin.scripps.edu/, last accessed on 12 December 2019) [98], NORMAN MassBank (http://massbank.eu/MassBank/, last accessed on 12 December 2019) and the MoNA (MassBank of North America) (http://mona.fiehnlab.ucdavis.edu/, last accessed on 12 December 2019) high-resolution mass spectral databases. Metadata information following the minimum reporting standard guidelines of the MSI [96] can be found in Table S5.

4.12. Statistical Data Analyses

Statistically significant differences between single and combined salt-heat stress treatments were determined with a two-way ANOVA, using the R software environment 3.4.3 [99]. The Benjamini–Hochberg false discovery rate (FDR) correction was used to adjust p-values (only for the metabolomics dataset) prior to the Tukey’s honestly significant difference (HSD) test. Fold-changes between conditions and the control for each metabolite were determined and Log10 transformed for heatmap plotting (R package pheatmap) [100]. Principle component analysis (PCA) and partial least squares discriminant analysis (PLS-DA) were performed on Log10 transformed primary metabolite relative response values using the R package “mixOmics” [101]. PCA was applied using unit variance scaling, and PLS-DA model reliability was assessed using the leave-one-out cross-validation embedded in the R package “mixOmics” [101]. Venn diagrams were obtained using the R package VennDiagram [102].

5. Conclusions

The present study represents a considerable advance in the field of actinorhizal plants, which was to date supported by few integrative physiological and metabolomics studies performed thus far in the model actinorhizal plant, C. glauca. We found that C. glauca could withstand naturally occurring high salt and heat stress conditions, but the harshest stress condition was demonstrated to severely compromise C. glauca survival. Indeed, the observed (i) stress-induced activation of plant photoprotection mechanisms (qN, Y(NPQ), Zea, lutein, β-Carotene), (ii) increased activity of enzymatic ROS scavengers, and (iii) stress-induced activation of C and N metabolic pathways did not prevent a mesophyll limitation of photosynthesis. Faced with this situation, C. glauca stress resilience could not be maintained, and thus, climate change is a most urgent threat not only to stress intolerant plants but also to highly resilient plants and, as such, may ultimately represent existential stress to life on earth.

Supplementary Materials

The following are available online at https://www.mdpi.com/article/10.3390/metabo11090593/s1, Figure S1 Diagram of the experi-mental design, Figure S2 LC-HRMS/MS secondary metabolite analysis, Figure S3 principal component analysis (PCA) score plot of the secondary metabolite profiles, Figure S4 partial least square discriminant analysis (PLS-DA) of the secondary metabolite profiles, Table S1 photosyn-thetic pigments—HPLC chromatograms, Table S2 GC-TOF-MS primary metabolite profiling of C. glauca branchlets under the single and combined exposure to salt (0 and 400 mM NaCl) and temperature (26, 35 and 45 °C) conditions, Table S3 annotation of the secondary metabolites de-tected by LC-HRMS/MS in C. glauca branchlets, Table S4 LC-HRMS/MS secondary metabolite analysis of C. glauca branchlets under the single and combined exposure to salt (0 and 400 mM NaCl) and temperature (26, 35 and 45 °C) conditions, Table S5 metabolomics metadata infor-mation, Methods S1 detailed description of the chlorophyll a parameters evaluated under pho-tosynthetic steady-state conditions, Methods S2 lipid analyses, Methods S3 primary metabolite extraction, derivatisation and GC-TOF-MS analysis, Methods S4 secondary metabolite extraction and LC-HRMS analysis [103,104,105,106].

Author Contributions

Conceptualization, C.A., J.C.R., and A.I.R.-B.; methodology, C.A., A.R.F., J.C.R., and A.I.R.-B.; software, T.F.J.; validation, C.A.; formal analysis, T.F.J.; investigation, T.F.J., J.C.R., I.P.P., P.S.-C., A.E.L., A.P.R., and S.A.; resources, C.A., J.C.R., P.S.-C., and A.R.F.; data curation, T.F.J.; writing—original draft preparation, T.F.J.; writing—review and editing, C.A., A.R.F., J.C.R., A.I.R.-B., P.S.-C., I.P.P., A.E.L., A.P.R., and S.A.; visualization, T.F.J.; supervision, C.A.; project administration, C.A. and A.I.R.-B.; funding acquisition, C.A., A.R.F., J.C.R., and A.I.R.-B. All authors have read and agreed to the published version of the manuscript.

Funding

This work received funding support from Fundação para a Ciência e a Tecnologia (FCT), Portugal through the project PTDC/AGR-FOR/4218/2012, and the research units UID/Multi/04551/2013 (GREEN-IT), UIDB/00239/2020 (CEF) and UIDP/04035/2020 (GeoBioTec). C.A. acknowledges the FCT Investigator Program (IF/00376/2012/CP0165/CT0003). T.F.J. acknowledges FCT (PD/BD/113475/2015) and ITQB NOVA International PhD Program Plants for Life (PD/00035/2013). A.R.F. and S.A. are supported by the European Union’s Horizon 2020 research and innovation programme, project PlantaSYST (SGA-CSA No. 739582 under FPA No. 664620).

Institutional Review Board Statement

Not applicable.

Informed Consent Statement

Not applicable.

Data Availability Statement

The data presented in this study are available in article and Supplementary Materials.

Acknowledgments

The authors also thank Pedro Gomes (ITQB NOVA, currently at Faculty of Pharmacy, ULisboa) and Paula Alves (ISA/UL) for their valuable support with the C. glauca biological experiment. Thiago Alexandre Moraes (MPI-MP, currently at Crop Science Centre, UK) is acknowledged for the fruitful discussions about ANOVA statistics and valuable help with R software.

Conflicts of Interest

The authors declare no conflict of interest. The funders had no role in the design of the study; in the collection, analyses, or interpretation of data; in the writing of the manuscript, or in the decision to publish the results.

References

  1. IPCC Core Writing Team. Climate Change 2014: Synthesis Report. Contribution of Working Groups I, II and III to the Fifth Assessment Report of the Intergovernmental Panel on Climate Change; Intergovernmental Panel on Climate Change: Geneva, Switzerland, 2014. [Google Scholar]
  2. Hirayama, T.; Shinozaki, K. Research on plant abiotic stress responses in the post-genome era: Past, present and future. Plant J. 2010, 61, 1041–1052. [Google Scholar] [CrossRef]
  3. Pereira, A. Plant abiotic stress challenges from the changing environment. Front. Plant Sci. 2011, 7, 1123. [Google Scholar] [CrossRef] [Green Version]
  4. Mittler, R. Abiotic stress, the field environment and stress combination. Trends Plant Sci. 2006, 11, 15–19. [Google Scholar] [CrossRef]
  5. Prasch, C.M.; Sonnewald, U. Simultaneous application of heat, drought, and virus to Arabidopsis plants reveals significant shifts in signalling networks. Plant Physiol. 2013, 162, 1849–1866. [Google Scholar] [CrossRef]
  6. Rasmussen, S.; Barah, P.; Suarez-Rodriguez, M.C.; Bressendorff, S.; Friis, P.; Costantino, P.; Bones, A.M.; Nielsen, H.B.; Mundy, J. Transcriptome responses to combinations of stresses in Arabidopsis. Plant Physiol. 2013, 161, 1783–1794. [Google Scholar] [CrossRef] [Green Version]
  7. Obata, T.; Witt, S.; Lisec, J.; Palacios-Rojas, N.; Florez-Sarasa, I.; Yousfi, S.; Araus, J.L.; Cairns, J.E.; Fernie, A.R. Metabolite profiles of maize leaves in drought, heat and combined stress field trials reveal the relationship between metabolism and grain yield. Plant Physiol. 2015, 69, 2665–2683. [Google Scholar] [CrossRef] [Green Version]
  8. Pandey, P.; Ramegowda, V.; Senthil-Kumar, M. Shared and unique responses of plants to multiple individual stresses and stress combinations: Physiological and molecular mechanisms. Front. Plant Sci. 2015, 6, 723. [Google Scholar] [CrossRef] [Green Version]
  9. Shaar-Moshe, L.; Blumwald, E.; Peleg, Z. Unique physiological and transcriptional shifts under combinations of salinity, drought, and heat. Plant Physiol. 2017, 174, 421–434. [Google Scholar] [CrossRef] [Green Version]
  10. Suzuki, N.; Rivero, R.M.; Shulaev, V.; Blumwald, E.; Mittler, R. Abiotic and biotic stress combinations. New Phytol. 2014, 203, 32–43. [Google Scholar] [CrossRef]
  11. Jorge, T.F.; António, C. Plant metabolomics in a changing world: Metabolite responses to abiotic stress combinations, plant, abiotic stress and responses to climate change. In Plant, Abiotic Stress and Responses to Climate Change; Andjelkovic, V., Ed.; InTechOpen Publishing: London, UK, 2017; pp. 111–132. [Google Scholar] [CrossRef] [Green Version]
  12. Zandalinas, S.I.; Mittler, R.; Balfagón, D.; Arbona, V.; Gómez-Cadenas, A. Plant adaptations to the combination of drought and high temperatures. Physiol. Plant 2018, 162, 2–12. [Google Scholar] [CrossRef] [Green Version]
  13. Keles, Y.; Oncel, I. Response of antioxidative defence system to temperature and water stress combinations in wheat seedlings. Plant Sci. 2002, 163, 783–790. [Google Scholar] [CrossRef]
  14. Rivero, R.M.; Mestre, T.C.; Mittler, R.; Rubio, F.; Garcia-Sanchez, F.; Martinez, V. The combined effect of salinity and heat reveals a specific physiological, biochemical and molecular responses in tomato plants. Plant Cell Environ. 2014, 37, 1059–1073. [Google Scholar] [CrossRef] [PubMed]
  15. Zhang, H.; Sonnewald, U. Differences and commonalities of plant responses to single and combined stresses. Plant J. 2017, 90, 839–855. [Google Scholar] [CrossRef] [PubMed] [Green Version]
  16. Munns, R.; Tester, M. Mechanisms of salinity tolerance. Annu. Rev. Plant Biol. 2008, 59, 651–681. [Google Scholar] [CrossRef] [PubMed] [Green Version]
  17. Yang, Y.; Guo, Y. Elucidating the molecular mechanisms mediating plant salt-stress responses. New Phytol. 2018, 217, 523–539. [Google Scholar] [CrossRef] [Green Version]
  18. Wahid, A.; Gelani, S.; Ashraf, M.; Foolad, M.R. Heat tolerance in plants: An overview. Environ. Exp. Bot. 2007, 61, 199–223. [Google Scholar] [CrossRef]
  19. Mittler, R.; Finka, A.; Goloubinoff, P. How do plants feel the heat? Trends Biochem. Sci. 2012, 37, 118–125. [Google Scholar] [CrossRef]
  20. Slama, I.; Abdelly, C.; Bouchereau, A.; Flowers, T.; Savouré, A. Diversity, distribution and roles of osmoprotective compounds accumulated in halophytes under abiotic stress. Ann. Bot. 2015, 115, 433–447. [Google Scholar] [CrossRef] [Green Version]
  21. Potgieter, L.J.; Richardson, D.M.; Wilson, J.R.U. Casuarina: Biogeography and ecology of an important tree genus in a changing world. Biol. Invasions 2014, 16, 609–633. [Google Scholar] [CrossRef]
  22. Li, H.L.; Wang, W.; Mortimer, P.E.; Li, R.Q.; Li, D.Z.; Hyde, K.D.; Xu, J.C.; Soltis, D.E.; Chen, Z.D. Large-scale phylogenetic analyses reveal multiple gains of actinorhizal nitrogen-fixing symbioses in angiosperms associated with climate change. Sci. Rep. 2015, 5, 14023. [Google Scholar] [CrossRef] [PubMed] [Green Version]
  23. Diagne, N.; Arumugam, K.; Ngom, M.; Nambiar-Veetil, M.; Franche, C.; Narayanan, K.K.; Laplaze, L. Use of Frankia and actinorhizal plants for degraded lands reclamation. Biomed. Res. Int. 2013, 2013, 948258. [Google Scholar] [CrossRef] [Green Version]
  24. Zhong, C.; Mansour, S.; Nambiar-Veetil, M.; Bogusz, D.; Franche, C. Casuarina glauca: A model tree for basic research in actinorhizal symbiosis. J. Biosci. 2013, 38, 815–823. [Google Scholar] [CrossRef] [PubMed]
  25. Sayed, W.F. Improving Casuarina growth and symbiosis with Frankia under different soil and environmental conditions—Review. Folia Microbiol. 2011, 56, 1–9. [Google Scholar] [CrossRef]
  26. Huang, J.; Ji, M.; Xie, Y.; Wang, S.; He, Y.; Ran, J. Global semi-arid climate change over last 60 years. Clim. Dyn. 2016, 46, 1131–1150. [Google Scholar] [CrossRef] [Green Version]
  27. Lionello, P.; Scarascia, L. The relation between climate change in the Mediterranean region and global warming. Reg. Environ. Chang. 2018, 18, 1481–1493. [Google Scholar] [CrossRef]
  28. Batista-Santos, P.; Duro, N.; Rodrigues, A.P.; Semedo, J.N.; Alves, P.; da Costa, M.; Graça, I.; Pais, I.P.; Scotti-Campos, P.; Lidon, F.C.; et al. Is salt stress tolerance in Casuarina glauca Sieb. ex Spreng. associated with its nitrogen-fixing root-nodule symbiosis? An analysis at the photosynthetic level. Plant Physiol. Biochem. 2015, 96, 97–109. [Google Scholar] [CrossRef] [PubMed]
  29. Da Costa, M.; Duro, N.; Batista-Santos, P.; Ramalho, J.C.; Ribeiro-Barros, A.I. Validation of candidate reference genes for qRT-CR studies in symbiotic and non-symbiotic Casuarina glauca Sieb. ex Spreng. under salinity conditions. Symbiosis 2015, 66, 21–35. [Google Scholar] [CrossRef]
  30. Duro, N.; Batista-Santos, P.; da Costa, M.; Maia, R.; Castro, I.V.; Ramos, M.; Ramalho, J.C.; Pawlowski, K.; Máguas, C.; Ribeiro-Barros, A. The impact of salinity on the symbiosis between Casuarina glauca Sieb. ex Spreng. and N2-fixing Frankia bacteria based on the analysis of Nitrogen and Carbon metabolism. Plant Soil 2016, 398, 327–337. [Google Scholar] [CrossRef]
  31. Ribeiro-Barros, A.I.; da Costa, M.; Duro, N.; Graça, I.; Batista-Santos, P.; Jorge, T.F.; Lidon, F.J.C.; Pawlowski, K.; António, C.; Ramalho, J.C. An integrated approach to understand the mechanisms underlying salt stress tolerance in Casuarina glauca and its relation with nitrogen-fixing Frankia Thr. Symbiosis 2016, 70, 111–116. [Google Scholar] [CrossRef]
  32. Scotti-Campos, P.; Duro, N.; da Costa, M.; Pais, I.P.; Rodrigues, A.P.; Batista-Santos, P.; Semedo, J.N.; Leitão, A.E.; Lidon, F.C.; Pawlowski, K.; et al. Antioxidative ability 9 integrity in salt-induced responses of Casuarina glauca Sieber ex Spreng. in symbiosis with N2-fixing Frankia Thr or supplemented with mineral nitrogen. J. Plant Physiol. 2016, 196, 60–69. [Google Scholar] [CrossRef]
  33. Jorge, T.F.; Duro, N.; da Costa, M.; Florian, A.; Ramalho, J.C.; Ribeiro-Barros, A.I.; Fernie, A.R.; António, C. GC-TOF-MS analysis reveals salt stress-responsive primary metabolites in Casuarina glauca tissues. Metabolomics 2017, 13, 95. [Google Scholar] [CrossRef]
  34. Jorge, T.F.; Florêncio, M.H.; Ribeiro-Barros, A.I.; António, C. Quantification and structural characterization of raffinose family oligosaccharides in Casuarina glauca plant tissues by porous graphitic carbon electrospray quadrupole ion trap mass spectrometry. Int. J. Mass Spectrom. 2017, 413, 127–134. [Google Scholar] [CrossRef]
  35. Jorge, T.F.; Tohge, T.; Wendenburg, R.; Ramalho, J.C.; Lidon, F.C.; Ribeiro-Barros, A.I.; Fernie, A.R.; António, C. Salt-stress secondary metabolite signatures involved in the ability of Casuarina glauca to mitigate oxidative stress. Environ. Exp. Bot. 2019, 166, 103808. [Google Scholar] [CrossRef]
  36. Graça, I.; Mendes, V.M.; Marques, I.; Duro, N.; da Costa, M.; Ramalho, J.C.; Pawlowski, K.; Manadas, B.; Ricardo, C.P.P.; Ribeiro-Barros, A.I. Comparative proteomic analysis of nodulated and non-nodulated Casuarina glauca Sieb. ex Spreng. Grown under salinity conditions using sequential window acquisition of all theoretical mass spectra (SWATH-MS). Int. J. Mol. Sci. 2020, 21, 78. [Google Scholar] [CrossRef] [Green Version]
  37. Chaves, M.M.; Flexas, J.; Pinheiro, C. Photosynthesis under drought and salt stress: Regulation mechanisms from whole plant to cell. Ann. Bot. 2009, 103, 551–560. [Google Scholar] [CrossRef] [PubMed] [Green Version]
  38. Negrão, S.; Schmöckel, S.M.; Tester, M. Evaluating physiological responses of plants to salinity stress. Ann. Bot. 2017, 119, 13–26. [Google Scholar] [CrossRef] [Green Version]
  39. Medeira, C.; Quartin, V.; Maia, I.; Diniz, I.; Matos, M.C.; Semedo, J.N.; Scotti-Campos, P.; Ramalho, J.C.; Pais, I.P.; Ramos, P.; et al. Cryptogein and capsicein promote defence responses in Quercus suber against Phytophthora cinnamomi Infection. Eur. J. Plant Pathol. 2012, 134, 145–159. [Google Scholar] [CrossRef]
  40. Baker, N.R. Chlorophyll fluorescence: A probe of photosynthesis in vivo. Annu. Rev. Plant Biol. 2008, 59, 89–113. [Google Scholar] [CrossRef] [Green Version]
  41. Kramer, D.M.; Johnson, G.; Kiirats, O.; Edwards, G.E. New fluorescence parameters for the determination of QA redox state and excitation energy fluxes. Photosynth. Res. 2004, 79, 209–218. [Google Scholar] [CrossRef]
  42. Busch, F.; Hunter, N.P.A.; Ensminger, I. Biochemical constrains limit the potential of the photochemical reflectance index as a predictor of effective quantum efficiency of photosynthesis during the winter spring transition in Jack pine seedlings. Funct. Plant Biol. 2009, 36, 1016–1026. [Google Scholar] [CrossRef]
  43. Huang, W.; Zhang, S.B.; Cao, K.F. Cyclic electron flow plays an important role in photoprotection of tropical trees illuminated at temporal chilling temperature. Plant Cell Physiol. 2011, 52, 297–305. [Google Scholar] [CrossRef]
  44. Rodrigues, W.P.; Martins, M.Q.; Fortunato, A.S.; Rodrigues, A.P.; Semedo, J.N.; Simões-Costa, M.C.; Pais, I.P.; Leitão, A.E.; Colwell, F.; Goulao, L.; et al. Long-term elevated air [CO2] strengthens photosynthetic functioning and mitigates the impact of supra-optimal temperatures in tropical Coffea arabica and Coffea canephora species. Glob. Chang. Biol. 2016, 22, 415–431. [Google Scholar] [CrossRef]
  45. Maxwell, K.; Johnson, G.N. Chlorophyll fluorescence—A practical guide. J. Exp. Bot. 2000, 345, 659–668. [Google Scholar] [CrossRef]
  46. Fortunato, A.; Lidon, F.C.; Batista-Santos, P.; Leitão, A.E.; Pais, I.P.; Ribeiro, A.I.; Ramalho, J.C. Biochemical and molecular characterization of the antioxidative system of Coffea sp. under cold conditions in genotypes with contrasting tolerance. J. Plant Physiol. 2010, 167, 333–342. [Google Scholar] [CrossRef] [PubMed]
  47. Ashraf, M.; Harris, P.J.C. Photosynthesis under stressful environments: An overview. Photosynthetica 2013, 51, 163–190. [Google Scholar] [CrossRef]
  48. Martins, M.Q.; Rodrigues, W.P.; Fortunato, A.S.; Leitão, A.E.; Rodrigues, A.P.; Pais, I.P.; Martins, L.D.; Silva, M.J.; Reboredo, F.H.; Partelli, F.L.; et al. Protective response mechanisms to heat stress in interaction with high [CO2] conditions in Coffea spp. Front. Plant Sci. 2016, 7, 947. [Google Scholar] [CrossRef] [Green Version]
  49. Mansour, M.M.F. Plasma membrane permeability as an indicator of salt tolerance in plants. Biol. Plant 2013, 57, 1–10. [Google Scholar] [CrossRef]
  50. Hasanuzzaman, M.; Nahar, K.; Alam, M.M.; Roychowdhury, R.; Fujita, M. Physiological, biochemical, and molecular mechanisms of heat stress tolerance in plants. Int. J. Mol. Sci. 2013, 14, 9643–9684. [Google Scholar] [CrossRef]
  51. Murakami, Y.; Tsuyama, M.; Kobayashi, Y.; Kodama, H.; Iba, K. Trienoic fatty acids and plant tolerance of high temperature. Science 2000, 287, 476–479. [Google Scholar] [CrossRef]
  52. Sakamoto, T.; Murata, N. Regulation of the desaturation of fatty acids and its role in tolerance to cold and salt stress. Curr. Opin. Microbiol. 2002, 5, 206–210. [Google Scholar] [CrossRef]
  53. Das, K.; Roychoudhury, A. Reactive oxygen species (ROS) and response of antioxidants as ROS-scavengers during environmental stress in plants. Front. Environ. Sci. 2014, 2, 53. [Google Scholar] [CrossRef] [Green Version]
  54. Yaeno, T.; Matsuda, O.; Iba, K. Role of chloroplast trienoic fatty acids in plant disease defense responses. Plant J. 2004, 40, 931–941. [Google Scholar] [CrossRef] [PubMed]
  55. Upchurch, R.G. Fatty acid unsaturation, mobilization, and regulation in the response of plants to stress. Biotechnol. Lett. 2008, 30, 967–977. [Google Scholar] [CrossRef]
  56. ElSayed, A.I.; Rafudeen, M.S.; Golldack, D. Physiological aspects of raffinose family oligosaccharides in plants: Protection against abiotic stress. Plant Biol. 2014, 6, 1–8. [Google Scholar] [CrossRef]
  57. Sengupta, S.; Mukherjee, S.; Basak, P.; Majumder, A.L. Significance of galactinol and raffinose family oligosaccharide synthesis in plants. Front. Plant Sci. 2015, 6, 656. [Google Scholar] [CrossRef] [Green Version]
  58. Bauwe, H.; Hagemann, M.; Fernie, A.R. Photorespiration: Players, partners and origin. Trends Plant Sci. 2010, 15, 330–336. [Google Scholar] [CrossRef]
  59. Timm, S.; Florian, A.; Wittmiß, M.; Jahnke, K.; Hagemann, M.; Fernie, A.R.; Bauwe, H. Serine acts as a metabolic signal for the transcriptional control of photorespiration-related genes in Arabidopsis. Plant Physiol. 2013, 162, 379–389. [Google Scholar] [CrossRef] [Green Version]
  60. Eisenhut, M.; Bräutigam, A.; Timm, S.; Florian, A.; Tohge, T.; Fernie, A.R.; Bauwe, H.; Weber, A.P.M. Photorespiration is crucial for dynamic response of photosynthetic metabolism and stomatal movement to altered CO2 availability. Mol. Plant 2017, 10, 47–61. [Google Scholar] [CrossRef] [Green Version]
  61. Tohge, T.; Watanabe, M.; Hoefgen, R.; Fernie, A.R. Shikimate and phenylalanine biosynthesis in the green lineage. Front. Plant Sci. 2013, 4, 62. [Google Scholar] [CrossRef] [Green Version]
  62. Hildebrandt, T.M. Synthesis versus degradation: Directions of amino acid metabolism during Arabidopsis abiotic stress response. Plant Mol. Biol. 2018, 98, 121–135. [Google Scholar] [CrossRef]
  63. Szecowka, M.; Heise, R.; Tohge, T.; Nunes-Nesi, A.; Vosloh, D.; Huege, J.; Feil, R.; Lunn, J.; Nikoloski, Z.; Stitt, M.; et al. Metabolic fluxes in an illuminated Arabidopsis rosette. Plant Cell 2013, 25, 694–714. [Google Scholar] [CrossRef] [Green Version]
  64. Arrivault, S.; Obata, T.; Szecówka, M.; Mengin, V.; Guenther, M.; Hoehne, M.; Fernie, A.R.; Stitt, M. Metabolite pools and carbon flow during C4 photosynthesis in maize: 13CO2 labeling kinetics and cell type fractionation. J. Exp. Bot. 2017, 68, 283–298. [Google Scholar] [CrossRef] [Green Version]
  65. Obata, T.; Fernie, A.R. The use of metabolomics to dissect plant responses to abiotic stresses. Cell. Mol. Life Sci. 2012, 69, 3225–3243. [Google Scholar] [CrossRef] [Green Version]
  66. Mata, A.T.; Jorge, T.F.; Pires, M.V.; António, C. Drought stress tolerance in plants: Insights from metabolomics. In Drought Stress Tolerance in Plants, Molecular and Genetic Perspectives; Hossain, M.A., Wani, S.H., Bhattachajee, S., Burritt, D.J., Phan, L.S., Eds.; Springer International Publishing: Cham, Switzerland, 2016; Volume 2, pp. 187–216. [Google Scholar] [CrossRef]
  67. Li, Z.; Yu, J.; Peng, Y.; Huang, B. Metabolic pathways regulated by γ-aminobutyric acid (GABA) contributing to heat tolerance in creeping bentgrass (Agrostis stolonifera). Sci. Rep. 2016, 6, 30338. [Google Scholar] [CrossRef] [Green Version]
  68. Fait, A.; Fromm, H.; Walter, D.; Galili, G.; Fernie, A.R. Highway or byway: The metabolic role of the GABA shunt in plants. Trends Plant Sci. 2008, 13, 14–19. [Google Scholar] [CrossRef]
  69. António, C.; Päpke, C.; Rocha, M.; Diab, H.; Limami, A.M.; Obata, T.; Fernie, A.R.; van Dongen, J.T. Regulation of primary metabolism in response to low oxygen availability as revealed by carbon and nitrogen isotope redistribution. Plant Physiol. 2016, 170, 43–56. [Google Scholar] [CrossRef] [PubMed]
  70. Szabados, L.; Savoure, A. Proline: A multifunctional amino acid. Trends Plant Sci. 2010, 15, 89–97. [Google Scholar] [CrossRef]
  71. Liang, X.; Zhang, L.; Natarajan, S.K.; Becker, D.F. Proline mechanisms of stress survival. Antioxid. Redox Signal. 2013, 19, 998–1011. [Google Scholar] [CrossRef] [Green Version]
  72. Kaur, G.; Asthir, B. Proline: A key player in plant abiotic stress tolerance. Biol. Plant 2015, 59, 609–619. [Google Scholar] [CrossRef]
  73. Per, T.S.; Khan, N.A.; Reddy, P.S.; Masood, A.; Hasanuzzaman, M.; Khan, M.I.R.; Anjum, N.A. Approaches in modulating proline metabolism in plants for salt and drought stress tolerance: Phytohormones, mineral nutrients and transgenics. Plant Physiol. Biochem. 2017, 115, 126–140. [Google Scholar] [CrossRef]
  74. Sellstedt, A.; Atkins, C.A. Composition of amino compounds transported in xylem of Casuarina sp. J. Exp. Bot. 1991, 42, 1493–1497. [Google Scholar] [CrossRef]
  75. Galili, G. The aspartate-family pathway of plants: Linking production of essential amino acids with energy and stress regulation. Plant Signal. Behav. 2011, 6, 192–195. [Google Scholar] [CrossRef] [Green Version]
  76. Bailey-Serres, J.; Mittler, R. The roles of reactive oxygen species in plant cells. Plant Physiol. 2006, 141, 311. [Google Scholar] [CrossRef] [Green Version]
  77. Blokhina, O.; Vironlainen, E.; Fagerstedt, K.V. Antioxidants, oxidative damage and oxygen deprivation stress: A review. Ann. Bot. 2003, 91, 179–194. [Google Scholar] [CrossRef] [Green Version]
  78. Foyer, C.H.; Shigeoka, S. Understanding oxidative stress and antioxidant functions to enhance photosynthesis. Plant Physiol. 2011, 155, 93–100. [Google Scholar] [CrossRef] [PubMed] [Green Version]
  79. Agati, G.; Azzarello, E.; Pollastri, S.; Tattini, M. Flavonoids as antioxidants in plants: Location and functional significance. Plant Sci. 2012, 196, 67–76. [Google Scholar] [CrossRef] [PubMed]
  80. Tromas, A.; Parizot, B.; Diagne, N.; Champion, A.; Hocher, V.; Cissoko, M.; Crabos, A.; Prodjinoto, H.; Lahouze, B.; Bogusz, D.; et al. Heart of endosymbioses: Transcriptomics reveals a conserved genetic program among arbuscular mycorrhizal, actinorhizal and legume-rhizobial symbioses. PLoS ONE 2012, 7, e44742. [Google Scholar] [CrossRef]
  81. Zhong, C.; Zhang, Y.; Chen, Y.; Jiang, Q.; Chen, Z.; Liang, J.; Pinyopusarerk, K.; Franche, C.; Bogusz, D. Casuarina research and applications in China. Symbiosis 2010, 50, 107–114. [Google Scholar] [CrossRef]
  82. Ramalho, J.C.; Rodrigues, A.P.; Lidon, F.; Marques, L.M.C.; Leitão, A.E.; Fortunato, A.S.; Pais, I.P.; Silva, M.J.; Scotti-Campos, P.; Lopes, A.; et al. Stress cross-response of the antioxidative system promoted by superimposed drought and cold conditions in Coffea spp. PLoS ONE 2018, 13, e0198694. [Google Scholar] [CrossRef]
  83. Schreiber, U. Pulse-amplitude-modulation (PAM) fluorometry and saturation pulse method: An overview. In Chlorophyll a Fluorescence: A Signature of Photosynthesis; Papageorgiou, G.C., Ed.; Springer: Dordrecht, The Netherlands, 2004; pp. 279–319. [Google Scholar] [CrossRef]
  84. Klughammer, C.; Schreiber, U. Complementary PS II quantum yields calculated from simple fluorescence parameters measured by PAM fluorometry and the saturation pulse method. PAM Appl. Notes 2008, 1, 27–35. [Google Scholar]
  85. Ramalho, J.C.; Pons, T.L.; Groeneveld, H.W.; Nunes, M.A. Photosynthetic responses of Coffea arabica leaves to a short-term high light exposure in relation to N availability. Physiol. Plant 1997, 101, 229–239. [Google Scholar] [CrossRef]
  86. Ramalho, J.C.; Rodrigues, A.P.; Semedo, J.N.; Pais, I.P.; Martins, L.D.; Simões-Costa, M.C.; Leitão, A.E.; Fortunato, A.S.; Batista-Santos, P.; Palos, I.M.; et al. Sustained photosynthetic performance of Coffea spp. under long-term enhanced [CO2]. PLoS ONE 2013, 8, e82712. [Google Scholar] [CrossRef] [PubMed] [Green Version]
  87. Matos, M.C.; Campos, P.S.; Passarinho, J.A.; Semedo, J.N.; Marques, N.M.; Ramalho, J.C.; Ricardo, C.P. Drought effect on photosynthetic activity, osmolyte accumulation and membrane integrity of two Cicer arietinum genotypes. Photosynthetica 2010, 48, 303–312. [Google Scholar] [CrossRef]
  88. Campos, P.S.; Quartin, V.L.; Ramalho, J.C.; Nunes, M.A. Electrolyte leakage and lipid degradation account for cold sensitivity in leaves of Coffea sp. plants. J. Plant Physiol. 2003, 160, 283–292. [Google Scholar] [CrossRef] [Green Version]
  89. Beauchamp, C.; Fridovich, I. Superoxide dismutase: Improved assay and an assay applicable to acrylamide gels. Anal. Biochem. 1971, 44, 276–287. [Google Scholar] [CrossRef]
  90. Esterbauer, H.; Grill, D. Seasonal variation of glutathione and glutathione reductase in needles of Picea abies. Plant Physiol. 1978, 61, 119–121. [Google Scholar] [CrossRef] [PubMed] [Green Version]
  91. Kato, M.; Shimizu, S. Chlorophyll metabolism in higher plants. VII. Chlorophyll degradation in senescing tobacco leaves; phenolic-dependent peroxidative degradation. Can. J. Bot. 1987, 65, 729–735. [Google Scholar] [CrossRef]
  92. Ramalho, J.C.; Campos, P.S.; Teixeira, M.; Nunes, M.A. Nitrogen dependent changes in antioxidant systems and in fatty acid composition of chloroplast membranes from Coffea arabica L. plants submitted to high irradiance. Plant Sci. 1998, 135, 115–124. [Google Scholar] [CrossRef]
  93. Lisec, J.; Schauer, N.; Kopka, J.; Willmitzer, L.; Fernie, A.R. Gas chromatography mass spectrometry-based metabolite profiling in plants. Nat. Protoc. 2006, 1, 387–396. [Google Scholar] [CrossRef]
  94. Luedemann, A.; Strassburg, K.; Erban, A.; Kopka, J. TagFinder for the quantitative analysis of gas chromatography-mass spectrometry (GC-MS)-based metabolite profiling experiments. Bioinformatics 2008, 24, 732–737. [Google Scholar] [CrossRef]
  95. Kopka, J.; Schauer, N.; Krueger, S.; Birkemeyer, C.; Usadel, B.; Bergmüller, E.; Dörmann, P.; Weckwerth, W.; Gibon, Y.; Stitt, M.; et al. [email protected]: The Golm Metabolome Database. Bioinformatics 2005, 21, 1635–1638. [Google Scholar] [CrossRef] [PubMed] [Green Version]
  96. Alseekh, A.; Aharoni, A.; Brotman, Y.; Contrepois, K.; D’Auria, J.; Ewald, J.; Ewald, J.C.; Fraser, P.D.; Giavalisco, P.; Hall, R.D.; et al. Mass spectrometry-based metabolomics: A guide for annotation, quantification and best reporting practices. Nat. Methods 2021, 18, 747–756. [Google Scholar] [CrossRef]
  97. Tohge, T.; Fernie, A.R. Combining genetic diversity, informatics and metabolomics to facilitate annotation of plant gene function. Nat. Protoc. 2010, 5, 1210–1227. [Google Scholar] [CrossRef]
  98. Guijas, C.; Montenegro-Burke, J.R.; Domingo-Almenara, X.; Palermo, A.; Warth, B.; Hermann, G.; Koellensperger, G.; Huan, T.; Uritboonthai, W.; Aisporna, A.E.; et al. METLIN: A technology platform for identifying knowns and unknowns. Anal. Chem. 2018, 90, 3156–3164. [Google Scholar] [CrossRef] [PubMed] [Green Version]
  99. R Core Team. R: A Language and Environment for Statistical Computing; R Package v.3.4.3; R Foundation for Statistical Computing: Vienna, Austria, 2018; Available online: https://www.R-project.org/ (accessed on 12 December 2019).
  100. Raivo, K. Pheatmap: Pretty Heatmaps. R Package v.1.0.8. 2015. Available online: https://CRAN.R-project.org/package=pheatmap (accessed on 12 December 2019).
  101. Rohart, F.; Gautier, B.; Singh, A.; Cao, K.A.L. mixOmics: An R package for ‘omics feature selection and multiple data integration. PLoS Comput. Biol. 2017, 13, e1005752. [Google Scholar] [CrossRef] [Green Version]
  102. Chen, H.; Boutros, P.C. VennDiagram: A package for the generation of highly-customizable Venn and Euler diagrams in R. BMC Bioinformat. 2011, 26, 12–35. [Google Scholar] [CrossRef] [Green Version]
  103. Werner, C.; Correia, O.; Beyschlag, W. Characteristic patterns of chronic and dynamic photoinhibition of different functional groups in a Mediterranean ecosystem. Funct. Plant Biol. 2002, 29, 999–1011. [Google Scholar] [CrossRef] [PubMed]
  104. Fiehn, O.; Sumner, L.W.; Rhee, S.Y.; Ward, J.; Dickerson, J.; Lange, B.M.; Lane, G.; Roessner, U.; Last, R.; Nikolau, B. Minimum reporting standards for plant biology context in metabolomics studies. Metabolomics 2007, 3, 195–201. [Google Scholar] [CrossRef] [Green Version]
  105. Sumner, L.W.; Amberg, A.; Barrett, D.; Beale, M.H.; Beger, R.; Daykin, C.A.; Fan, T.W.M.; Fiehn, O.; Goodacre, R.; Griffin, J.L.; et al. Proposed minimum reporting standards for chemical analysis. Metabolomics 2007, 3, 211–221. [Google Scholar] [CrossRef] [PubMed] [Green Version]
  106. Fernie, A.R.; Aharoni, A.; Willmitzer, L.; Stitt, M.; Tohge, T.; Kopka, J.; Carroll, A.J.; Saito, K.; Fraser, P.D.; De Luca, V. Recommendations for reporting metabolite data. Plant Cell 2011, 2, 2477–2482. [Google Scholar] [CrossRef] [Green Version]
Figure 1. Evaluation of single salt, heat, and combined salt-heat stresses in C. glauca plants. (a) Visual evaluation of phenotypic changes in C. glauca plants under the single and combined exposure to salt (0 and 400 mM NaCl) and temperature (26, 35 and 45 °C) conditions. (b) Variation of the relative water content (RWC, %) in C. glauca branchlets under the single and combined exposure to salt (0 and 400 mM NaCl) and temperature (26, 35 and 45 °C) conditions. Bars represent the mean values ± SE from three to five independent measurements. Two-way ANOVA (p < 0.05) followed by Tukey’s HSD test was performed for means comparison, and different letters express significant differences between [NaCl] for the same temperature (A, B) or between temperature for the same [NaCl] (c, d), with A and c representing the highest values.
Metabolites 11 00593 g001
Figure 2. Analysis of gas exchange measurements in C. glauca branchlets under the single and combined exposure to salt (0 and 400 mM NaCl) and temperature (26, 35 and 45 °C) conditions. (a) Net photosynthetic rate (Pn). (b) Stomatal conductance to water vapour rate (gs). (c) Transpiration rate (Tr). (d) Internal CO2 concentration (Ci). (e) Instantaneous water use efficiency (iWUE). (f) Leaf temperature. Bars represent the mean values ± SE from three to five independent measurements. Two-way ANOVA (p < 0.05) followed by Tukey’s HSD test was performed for means comparison and different letters express significant differences between [NaCl] for the same temperature (A, B) or between temperature for the same [NaCl] (c, d, e) with A and c representing the highest values.
Metabolites 11 00593 g002
Figure 3. Variation of the ribulose-1,5-biphosphate carboxylase/oxygenase (RuBisCO) activity and activation state in C. glauca branchlets under the single and combined exposure to salt (0 and 400 mM NaCl) and temperature (26, 35 and 45 °C) conditions. (a) Initial activity. (b) Total activity. (c) Activation state. Bars represent the mean values ± SE from three to five independent measurements. Two-way ANOVA (p < 0.05) followed by Tukey’s HSD test was performed for means comparison and different letters express significant differences between [NaCl] for the same temperature (A, B) or between temperature for the same [NaCl] (c, d) with A and c representing the highest values.
Metabolites 11 00593 g003
Figure 4. Membrane permeability and lipid peroxidation in C. glauca branchlets under the single and combined exposure to salt (0 and 400 mM NaCl) and temperature (26, 35 and 45 °C) conditions. (a) Electrolyte leakage. (b) Malonyldialdehyde (MDA) content. Bars represent the mean values ± SE from three to five independent measurements. Two-way ANOVA (p < 0.05) followed by Tukey’s HSD test was performed for means comparison, and different letters express significant differences between [NaCl] for the same temperature (A, B) or between temperature for the same [NaCl] (c) with A and c representing the highest values.
Metabolites 11 00593 g004
Figure 5. Evaluation of antioxidant enzyme activities in C. glauca branchlets under the single and combined exposure to salt (0 and 400 mM NaCl) and temperature (26, 35 and 45 °C) conditions. (a) ascorbate peroxidase (APX). (b) cellular catalase (CAT). (c) glutathione reductase (GR). (d) superoxide dismutase (SOD). Bars represent the mean values ± SE from three to five independent measurements. Two-way ANOVA (p < 0.05) followed by Tukey’s HSD test was for performed for means comparison and different letters express significant differences between [NaCl] for the same temperature (A, B) or between temperature for the same [NaCl] (c, d, e) with A and c representing the highest values.
Metabolites 11 00593 g005
Figure 6. GC-TOF-MS primary metabolite profiling analysis. (a) Heatmap showing metabolite responses in C. glauca branchlets under the single and combined exposure to salt (0 and 400 mM NaCl) and temperature (26, 35 and 45 °C) conditions. Relative values are normalised to the internal standard (ribitol) and dry weight (DW) of the samples. False-colour imaging was performed on Log10-transformed GC-TOF-MS data. Grey-colour squares represent not detected (n.d.) values. AA-amino acids, OA-organic acids, S-sugars, SA-sugar alcohols. (b) Venn diagram showing the number of metabolites which levels were shown to significantly change in C. glauca branchlets under the single and combined exposure to salt (0 and 400 mM NaCl) and temperature (26, 35 and 45 °C) conditions. Two-way ANOVA (p < 0.05) followed by Tukey’s HSD test was performed for means comparison. (c) Principal component analysis (PCA) score plots of the primary metabolite profiles in the branchlets of C. glauca plants under the single and combined exposure to salt (0 and 400 mM NaCl) and temperature (26, 35 and 45 °C) conditions.
Metabolites 11 00593 g006
Figure 7. Partial least square discriminant analysis (PLS-DA) score and loading plot in the branchlets of C. glauca plants under the single and combined exposure to salt (0 and 400 mM NaCl) and temperature (26, 35 and 45 °C) conditions.
Metabolites 11 00593 g007
Table 1. Chlorophyll a fluorescence measurements C. glauca branchlets under the single and combined exposure to salt (0 and 400 mM NaCl) and temperature (26, 35 and 45 °C) conditions. The parameters included: minimal fluorescence (Fo), maximal photochemical efficiency of PSII (Fv/Fm) (both measured under dark-adapted conditions), the estimate of the quantum yield of non-cyclic electron transport (Y(II) = Φe), the quantum yield of regulated energy dissipation of PSII (Y(NPQ)), the quantum yield of non-regulated energy dissipation (heat and fluorescence) dissipation of PSII (Y(NO)), the photoprotective sustained thermal dissipation (NPQ), the non-photochemical quenching (qN), the photochemical quenching based on the concept of separated (qP) or interconnected (qL) antennae, the electron transport rate (ETR), the PSII photochemical efficiency under photosynthetic steady-state conditions (Fv’/Fm’), the predictor of the rate constant of PSII inactivation (Fs/Fm’), the chronic photoinhibition (PIChr), the dynamic photoinhibition (PIDyn) and the total photoinhibition (Total PI). Each value represents the mean ± SE of three to five independent measurements. Two-way ANOVA (p < 0.05) followed by Tukey’s HSD test was performed for means comparison and different letters express significant differences between [NaCl] for the same temperature (A, B) or between temperature for the same [NaCl] (c, d, e) with A and c representing the highest values.
Parameter[NaCl]Temperature
26 °C35 °C45 °C
Fo0 mM0.216 ± 0.010 Ac0.164 ± 0.003 Ae0.176 ± 0.005 Ad
400 mM0.201 ± 0.005 Bc0.170 ± 0.004 Ad0.201 ± 0.010 Ad
Fv/Fm0 mM0.772 ± 0.008 Ac0.818 ± 0.004 Ac0.786 ± 0.007 Ac
400 mM0.750 ± 0.017 Ac0.783 ± 0.009 Ac0.489 ± 0.075 Bd
Y(II) = Øe0 mM0.533 ± 0.029 Ac0.456 ± 0.022 Ac0.365 ± 0.018 Ad
400 mM0.414 ± 0.034 Bc0.376 ± 0.033 Bc0.159 ± 0.043 Bd
Y(NPQ)0 mM0.108 ± 0.010 Bd0.190 ± 0.019 Ad0.254 ± 0.013 Ac
400 mM0.252 ± 0.016 Ac0.285 ± 0.040 Ac0.217 ± 0.067 Ac
Y(NO)0 mM0.359 ± 0.027 Ac0.370 ± 0.026 Ac0.381 ± 0.016 Bc
400 mM0.334 ± 0.022 Ad0.339 ± 0.012 Ad0.623 ± 0.106 Ac
NPQ0 mM0.322 ± 0.035 Bd0.543 ± 0.061 Acd0.670 ± 0.049 Ac
400 mM0.768 ± 0.047 Ac0.853 ± 0.137 Ac0.439 ± 0.181 Ad
qN0 mM0.329 ± 0.018 Bd0.490 ± 0.031 Ac0.529 ± 0.018 Ac
400 mM0.556 ± 0.018 Ac0.597 ± 0.044 Ac0.534 ± 0.069 Ac
qP0 mM0.778 ± 0.027 Ac0.714 ± 0.017 Ac0.590 ± 0.024 Ad
400 mM0.686 ± 0.047 Bc0.656 ± 0.035 Bc0.477 ± 0.045 Bd
qL0 mM0.549 ± 0.032 Ac0.475 ± 0.019 Acd0.356 ± 0.021 Ad
400 mM0.500 ± 0.045 Ac0.451 ± 0.030 Acd0.380 ± 0.029 Ad
ETR0 mM114.2 ± 6.3 Ac97.7 ± 4.7 Ac78.1 ± 3.9 Ac
400 mM88.7 ± 7.3 Bc80.6 ± 7.1 Ac34.1 ± 9.1 Ad
Fv’/Fm0 mM0.679 ± 0.016 Ac0.638 ± 0.021 Ac0.618 ± 0.008 Ac
400 mM0.591 ± 0.019 Bc0.571 ± 0.025 Ac0.319 ± 0.065 Bd
Fs/Fm0 mM0.467 ± 0.029 Bc0.544 ± 0.022 Ac0.635 ± 0.018 Ac
400 mM0.586 ± 0.034 Ad0.624 ± 0.033 Acd0.841 ± 0.043 Ac
PIChr0 mM6.92 ± 0.77 Ac1.55 ± 0.59 Ac5.38 ± 0.84 Bc
400 mM8.91 ± 1.34 Ad5.76 ± 1.44 Ad41.2 ± 13.8 Ac
PIDyn0 mM11.4 ± 1.3 Bd21.7 ± 2.6 Bc20.3 ± 1.4 Bcd
400 mM20.0 ± 1.4 Ad25.5 ± 1.8 Ac20.4 ± 7.4 Acd
Total PI0 mM18.3 ± 1.9 Bc23.3 ± 2.5 Ac25.7 ± 0.9 Bc
400 mM28.9 ± 2.3 Ad31.3 ± 3.0 Ad61.6 ± 7.8 Ac
Table 2. Photosynthetic pigments in C. glauca branchlets under the single and combined exposure to salt (0 and 400 mM NaCl) and temperature (26, 35 and 45 °C) conditions. The de-epoxidation state (DEPS) was determined as DEPS = [(Zeaxanthin (Zea) + 0.5 × Antheraxanthin (Ant))/(Violaxanthin (Viol) + Ant + Zea)]. Each value represents the mean ± SE of three to five independent measurements. Two-way ANOVA (p < 0.05) followed by Tukey’s HSD test was for performed for means comparison and different letters express significant differences between [NaCl] for the same temperature (A, B) or between temperature for the same [NaCl] (c, d) with A and c representing the highest values.
Pigments[NaCl]Temperature
(mg g−1 DW)26 °C35 °C45 °C
Neoxanthin (Neo)0 mM0.101 ± 0.006 Ac0.121 ± 0.014 Ac0.112 ± 0.003 Ac
400 mM0.058 ± 0.004 Bc0.061 ± 0.006 Bc0.069 ± 0.007 Bc
Violaxanthin (Viol)0 mM0.116 ± 0.008 Ac0.120 ± 0.014 Ac0.105 ± 0.005 Ac
400 mM0.067 ± 0.003 Bc0.051 ± 0.009 Bc0.042 ± 0.004 Bc
Anteraxanthin (Ant)0 mM0.004 ± 0.001 Ad0.005 ± 0.000 Ad0.013 ± 0.001 Bc
400 mM0.006 ± 0.000 Ad0.009 ± 0.001 Ad0.022 ± 0.002 Ac
Zeaxanthin (Zea)0 mM0.000 ± 0.000 Bd0.002 ± 0.001 Bd0.011 ± 0.003 Bc
400 mM0.003 ± 0.000 Ad0.015 ± 0.005 Ad0.035 ± 0.007 Ac
Viol+Ant+Zea0 mM0.120 ± 0.008 Ac0.126 ± 0.012 Ac0.129 ± 0.002 Ac
400 mM0.075 ± 0.003 Bc0.075 ± 0.004 Bc0.099 ± 0.011 Bc
DEPS0 mM0.018 ± 0.002 Ac0.046 ± 0.021 Bc0.139 ± 0.023 Bc
400 mM0.070 ± 0.005 Ad0.282 ± 0.077 Ad0.442 ± 0.034 Ac
Lutein0 mM0.257 ± 0.018 Ad0.338 ± 0.037 Acd0.367 ± 0.008 Ac
400 mM0.174 ± 0.011 Bd0.196 ± 0.015 Bcd0.245 ± 0.023 Bc
α-Carotene0 mM0.019 ± 0.002 Ad0.054 ± 0.001 Ac0.050 ± 0.004 Ac
400 mM0.032 ± 0.005 Ad0.050 ± 0.010 Ac0.055 ± 0.005 Ac
β-Carotene0 mM0.007 ± 0.001 Ad0.020 ± 0.002 Ac0.017 ± 0.001 Ac
400 mM0.007 ± 0.001 Ac0.011 ± 0.002 Bc0.013 ± 0.002 Ac
Table 3. Total fatty acids (TFA, mg g−1 DW), fatty acid composition (mol%) and unsaturation (DBI) of C. glauca branchlets under the single and combined exposure to salt (0 and 400 mM NaCl) and temperature (26, 35 and 45 °C) conditions. C18:3-linolenic acid. C18:2-linoleic acid. C16:0-palmitic acid. C18:1-oleic acid. C18:0-stearic acid. C16:1-hexadecenoic acid and less representative (Less Rep) fatty acids (i.e., the sum of less abundant FAs, namely C15:0–pentadecanoic acid, C14:0–myristic acid and C14:1–myristoleic acid). DBI = [(%monoenes + 2x%dienes + 3x%trienes)/%saturated FAs]. Each value represents the mean ± SE of three to five independent measurements. Two-way ANOVA (p < 0.05) followed by Tukey’s HSD test was performed for means comparison, and different letters express significant differences between [NaCl] for the same temperature (A, B) or between temperature for the same [NaCl] (c, d) with A and c representing the highest values.
Parameter[NaCl]Temperature (°C)
26 °C35 °C45 °C
TFA (mg g−1 DW)0 mM13.65 ± 1.50 Ac12.80 ± 1.17 Ac12.26 ± 0.34 Ac
400 mM8.10 ± 1.40 Bc7.94 ± 0.53 Bc6.80 ± 0.65 Bc
C18:3 (mol%)0 mM41.52 ± 0.27 Ac35.75 ± 1.90 Ac37.05 ± 0.41 Ac
400 mM33.82 ± 2.44 Bc34.72 ± 1.01 Ac24.53 ± 2.43 Bd
C18:2 (mol%)0 mM19.51 ± 0.33 Bd22.50 ± 1.03 Ac21.93 ± 0.60 Bcd
400 mM22.94 ± 0.55 Ac24.15 ± 0.44 Ac23.87 ± 1.35 Ac
C18:1 (mol%)0 mM5.73 ± 0.08 Ad7.35 ± 0.26 Acd7.66 ± 0.24 Bc
400 mM6.06 ± 0.76 Ad6.28 ± 0.83 Acd8.16 ± 0.56 Ac
C18:0 (mol%)0 mM2.65 ± 0.21 Ac2.64 ± 0.24 Ac2.00 ± 0.19 Ac
400 mM2.92 ± 0.27 Ac2.89 ± 0.30 Ac3.25 ± 0.42 Ac
C16:1 (mol%)0 mM3.68 ± 0.23 Ac3.39 ± 0.40 Ac3.92 ± 0.12 Ac
400 mM3.76 ± 0.23 Ac3.17 ± 0.03 Ac3.27 ± 0.28 Ac
C16:0 (mol%)0 mM25.67 ± 0.68 Ac27.12 ± 2.35 Ac26.30 ± 0.80 Bc
400 mM28.36 ± 1.60 Acd26.88 ± 1.18 Ad34.67 ± 2.90 Ac
Less Rep (mol%)0 mM1.13 ± 0.07 Ac1.06 ± 0.14 Ac0.95 ± 0.04 Ac
400 mM1.13 ± 0.18 Ac1.02 ± 0.07 Ac1.01 ± 0.14 Ac
DBI0 mM6.47 ± 0.22 Ac5.94 ± 0.76 Ac6.10 ± 0.25 Ac
400 mM5.25 ± 0.48 Ac5.67 ± 0.31 Ac3.77 ± 0.65 Bd
Publisher’s Note: MDPI stays neutral with regard to jurisdictional claims in published maps and institutional affiliations.

