Article

Nontargeted Metabolomics as a Screening Tool for Estimating Bioactive Metabolites in the Extracts of 50 Indigenous Korean Plants

1
Department of Bioscience and Biotechonology, Konkuk University, Seoul 05029, Korea
2
Department of Integrative Biotechnology, Sungkyunkwan University, Suwon 16419, Korea
3
National Institute of Biological Resources, Environmental Research Complex, Incheon 22689, Korea
4
Research Institute for Bioactive-Metabolome Network, Konkuk University, Seoul 05029, Korea
*
Author to whom correspondence should be addressed.
Metabolites 2021, 11(9), 585; https://doi.org/10.3390/metabo11090585
Submission received: 30 July 2021 / Revised: 25 August 2021 / Accepted: 26 August 2021 / Published: 30 August 2021
(This article belongs to the Special Issue Plant Metabolomics II)

Abstract

:
Many indigenous Korean plants have been used in medicinal preparations and health-promoting foods. These plant species contain beneficial metabolites with various bioactivities, such as antioxidant and anti-inflammatory activities. Herein, we suggest a new screening strategy using metabolomics to explore the bioactive compounds in 50 Korean plants. Secondary metabolites were analyzed using UHPLC-LTQ-Orbitrap-MS/MS. The plant extracts were subjected to antioxidant and anti-inflammatory assays. We identified metabolites that contributed to bioactivities according to the results of bioassays and multivariate analyses. Using Pearson’s correlation, phenolics (e.g., casuarictin, 3-O-methylellagic acid) showed positive correlation with antioxidant activity, while biflavonoids (e.g., amentoflavone, rosbustaflavone) were correlated with nitric oxide (NO) inhibition activity. To compensate for the limitation of this new strategy, we further validated these by investigating three parts (branches, fruits, leaves) of Platycladus orientalis which showed high activities on both bioassays. Unlike the above observation, we identified significantly different metabolites from different parts, which was not the results of bioassays. In these validation steps, interestingly, biflavonoids (e.g., robustaflavone, sciadopitysin) contributed to both activities in P. orientalis. The findings of this work suggest that new strategy could be more beneficial in the identification of bioactive plant species as well as that of their corresponding bioactive compounds that impart the bioactivity.

Graphical Abstract

1. Introduction

Korea has a wide diversity of plant species due to its various geo-climatic conditions. Many indigenous Korean plants have been used as health-promoting foods [1], antioxidant agents [2], and raw materials of cosmetics [3]. The use of plant species has been related to secondary metabolites, such as flavonoids, saponins, terpenoids, and alkaloids in plants. They have various bioactivities, such as antioxidant, anti-inflammatory, antimicrobial, and anticancer activities [4,5,6,7]. For this reason, secondary metabolites have been used as important ingredients of traditional medicine and as food additives for centuries [8,9]. To date, they have been widely used as valuable compounds, in pharmaceuticals, cosmetics, and more recently, nutraceuticals [10,11]. Thus, to utilize indigenous Korean plant species more effectively, profiling their bioactive compounds is necessary. The screening of the relevant bioactive plants can be accomplished by comparing the differences in the bioactivities such as antioxidant activity of various plant species and exploring the secondary metabolites of the indigenous species.
Considering the promising benefits of the indigenous plants on human health and of their bioactive compounds that are correlated with health benefits, we compared the bioactivities of 50 indigenous Korean plants. The underlying mechanisms of many metabolites, such as flavonoids, that impart their bioactivity are thought to be mediated by their free radical scavenging activities [12]. Many biological processes are mediated by nitric oxide (NO), a short-lived free radical. NO can enhance the bactericidal and tumoricidal activities of activated macrophages [13,14], but when produced in excess, can potentially lead to tissue damage and the activation of pro-inflammatory mediators [15]. Reactive oxygen species (ROS) are produced by cellular metabolism, and since they can cause oxidative damage to lipids, nucleic acids, and proteins, they are highly toxic and are involved in the diagnosis of many chronic diseases. Additionally, Seifried et al. [16] have shown that overproduction of free radical molecules as ROS and reactive nitrogen species (RNS) are linked with a number of inflammatory disorders. Furthermore, ROS is potent activator of NF-κB signaling pathway; indirectly promoting the iNOS expression and NO synthesis [17]. Thus, it is necessary to consider the inhibition of free radical scavenging as an important therapeutic consideration the in development of anti-inflammatory agents. Although humans have an internal system of antioxidants in the body, exogenous antioxidants are recommended [18]. Antioxidants can be natural or synthetic, but due to their toxic and carcinogenic effects, synthetic antioxidants are being replaced with natural antioxidants [19]. The increase in dietary antioxidant intakes may help to support the limiting antioxidant concentrate and also promote the normal functioning of physiological systems [20]. The potential of the extracts from indigenous Korean plants to scavenge these free radicals and modulate inflammatory reactions has been demonstrated [21,22,23]. Additionally, many researchers have used the antioxidant activity assay to reveal the beneficial effect of different plant extracts [24]. Therefore, to utilize these extracts in a proper and effective way, it is important to find bioactive compounds that contribute to NO inhibitory and antioxidant activities. We assayed the NO production inhibitory and antioxidant activities of the extracts of 50 indigenous Korean plants. Additionally, we correlated the results of these assays with their metabolites to identify the bioactive compounds in 50 indigenous Korean plant samples using a high-throughput screening method.
From this perspective, metabolomics enables an unbiased, high-throughput screening through chromatographic separation, high-resolution mass spectrometry (MS), and enhances detection sensitivity [25]. This metabolite characterization is a powerful tool for the comprehensive identification and quantification of metabolites in plants. Many studies have identified beneficial secondary compounds in plants and reported their bioactivities, such as antioxidant and anti-inflammatory activities [26,27,28]. In addition, metabolomics has been used as a chemotaxonomic tool for the classification of plant species [29]. Chemotaxonomic plant classification has been used to classify plant species according to their phylogenetic genus [30]. Some studies have used this classification to reveal the relationship between the differences in the active metabolites and bioactivities of diverse plant species [31,32,33]. However, only a few studies have attempted to identify bioactive compounds in diverse plant species based on bioactivity assays.
Herein, we aimed (1) to suggest a new screening strategy using a multi-parallel metabolomic-cum-bioassay-guided approach to identify bioactive compounds in 50 indigenous plant extracts, and (2) to validate these bioactive compounds by profiling the metabolites found in the different parts (fruit, branch, and leaf) of Platycladus orientalis which contributed to anti-inflammatory and antioxidant activities. This validation technique solves the correlation bias caused by the screening strategy that uses the multi-parallel metabolomic-cum-bioassay-guided approach.

2. Results and Discussion

2.1. Bioactivities of Indigenous Korean Plant Species

To select superior plant extracts based on their bioactivity, NO inhibitory and antioxidant activity was measured using 2,2-azinobis (3-ethylbenzothiazoline-6-sulfonic acid (ABTS) and 2,2-diphenyl-1-picrylhydrazyl (DPPH) assays. The bioactivity of plant extracts is mainly due to the diverse composition of secondary metabolites that fulfill multiple ecological roles among plant species [34]. The inhibitory activity of the extracts on NO production by activated RAW 264.7 cell lines is presented in Figure S1. Seven plant species showed high inhibitory activity on NO production, namely Commelina communis, Elaeagnus umbellata, Eleutherococcus sessiliflorus, P. orientalis, Pinus densiflora, Zanthoxylum schinifolium, and Sophora flavescens, as determined by the 3- (4,5-dimethylthiazol-2-yl)-2,5-diphenyltetrazolium bromide (MTT) assay. The results are in line with those of previous studies wherein plant species were revealed to have anti-inflammatory effects [35,36,37,38,39,40]. The antioxidant activity of 50 samples (Figure S2) is presented as the standard of Trolox equivalent antioxidant activity. There were variations in the antioxidant activity among the samples. Platycladus orientalis, E. umbellata, Castanea crenata, and Machilus thumbergii had the highest antioxidant activities among the 50 samples. Similarly, these four species also showed antioxidant activity in other studies [41,42,43,44].

2.2. Metabolite Profiling of the Bioactivities of 50 Indigenous Korean Plants

The samples were also analyzed by UHPLC-LTQ-Orbitrap-MS/MS combined with multivariate statistical analysis. In principal component analysis (PCA), the 50 samples were clustered according to the results of their bioactivities (Figure 1a). Plant species with high NO inhibitory activity were found to be distinct from those with high antioxidant activities by PC1 (3.70%). Considering the clear variance defined by the PCA (Figure 1a) and the bioactivity analysis (Figures S1 and S2), a supervised multivariate data analysis (partial least squares (PLS)) was employed to organize and distinguish the samples according to their MS dataset. The correlation analysis of the bioactivities and metabolites of 50 samples was conducted by the setting the results of the bioactivity assays as Y variables and the MS dataset as the X variable (Figure 1b). Similar to the results of the PCA analysis, plant extracts with NO inhibitory and antioxidant activities are clustered in PLS model, respectively. The findings demonstrated that the metabolites of the plant extracts which showed superior NO inhibitory activity were strongly correlated with this activity. Likewise, the metabolites of the superior antioxidative extracts were related to their antioxidant activities. These results were also confirmed with the results of the bioassays. Interestingly, fruit of P. orientalis that showed high bioactivities in both assays were located in the middle of superior NO inhibitory and antioxidant extracts in PCA and PLS biplot (Figure 1).
Variable importance to projections (VIP) values were acquired to measure the contribution of a variable to the model. A region of VIP > 1 indicates that the metabolites that can be distinguished as important for optimal PLS model performance [45]. Whereas, compounds with VIP values less than 1.0 might indicate that they have lower contribution to the bioactivities. Each VIP values of tentatively identified metabolites were shown in Tables S2 and S3. Additionally, a permutation test with 200 random permutations was performed to confirm the validity of the PLS biplot with the goodness of fit of several models and the predictive ability (R2/Q2) of the model (Figure 2). The PLS model has five components and showed a perfect goodness of fit where (R2Y (cum) > 0.9) and predictive quality (Q2 (cum) > 0.9). The permutation results of the NO inhibitory activity showed that Y-intercepts R2 and Q2 were 0.387 and −0.422; while those of the ABTS activity were 0.858 and −0.520, respectively, and the Y-intercept of R2 and Q2 of the DPPH activity were 0.857 and −0.542. These results indicated PLS was valid and not over fitting, exhibiting good predictive abilities [46].
In most plant metabolomics studies, researchers sorted variables from family, part or harvest time of their plant samples, not the bioactivity assay results, for profiling their metabolites [25,47,48]. Unlike this, we sorted many variables of 50 plant extracts based on their results of bioassays and multivariate statistical analysis which showed correlation with metabolites and bioactivities. After that, for finding the bioactive compound contributed to anti-inflammatory, we used the MS dataset of quality control (QC) sample which pooled all 50 sample extracts and the MS datasets of each of the five plants species that showed high NO inhibitory activities. Additionally, to identify metabolites that contributed to antioxidant activities, the MS datasets of QC and each of the five high antioxidative plant extracts were used. These secondary metabolites were tentatively characterized based on their retention time, mass spectra, mass fragment pattern, and elemental composition which were obtained from UHPLC-LTQ-Orbitrap-MS/MS datasets, as well as from published studies, and web databases such as NIST and MassBank. The obtained base peak chromatogram is illustrated in Figures S4 and S5. As a result of metabolite profiling according to bioactivity, 28 metabolites were identified as contributing to the superior NO inhibitory activity of the plant extracts, while 24 were identified as contributing to the high antioxidant activities (Tables S2 and S3).
The relative levels of the secondary metabolites among the 50 samples were visualized using a heat map representation (Figures S7 and S8). The relative metabolites contents of the 5 plant extracts which showed high NO inhibitory were shown in Figure 3. Among the superior NO inhibitory plant extracts, most of the secondary metabolites had a higher relative abundance in the fruit of P. orientalis. The flavonoids in this plant have been reported to have a significant anti-inflammatory effect in lipopolysaccharide-induced macrophage cells [49]. Additionally, the diterpenes of P. orientalis have anti-inflammatory activities [50]. Meanwhile, the relative levels of secondary metabolites in the five superior antioxidant plant extracts was shown in Figure 4. The branches of E. umbellata and the fruit of C. crenata had relatively higher contents of metabolites. E. umbellata is a rich source of bioactive compounds, such as phenolic acids and flavonoids [51]. Tuyen et al. [43] revealed that C. crenata contains several phenolic compounds and provides promising antioxidant capacities.

2.3. Bioactivity Correlations for the Secondary Metabolites of Indigenous Korean Plants

To visualize the correlation of the metabolites with NO inhibition and antioxidant activities, Pearson’s correlation test was used to construct a correlation map (Figure 5). P values were adjusted using Benjamini Hochberg false discovery rate (FDR), and only metabolites with an adjusted P value < 0.05 were considered statistically significant. As shown in Figure 5A, nepetaside, amentoflavone, sequoiaflavone, robustaflavone, ginkgetin, and sciadopitysin contributed to NO inhibitory activity. Interestingly, biflavonoids, such as amentoflavone and sequoiaflavone, showed significantly negative correlations with NO inhibitory activity. Biflavonoids are dimers of flavonoids linked to each other by C-C or C-O-C bond link-age [52]. Some studies have shown that biflavonoids inhibit NO production [53,54]. In addition to NO inhibition, they exhibit various anti-inflammatory activities [55]. As shown in Figure 5B, casuarictin, epicatechin, ellagic acid pentoside, 3-O-methylellagic acid, kaempferol 3- (p-coumaroyl-glucoside), and matairesinol were positively correlated with antioxidant activity.
Since multivariate analysis and identifying bioactive compounds through this new screening strategy is based on the results of bioassays, we were concerned about causing the correlation bias which indicated that the identified metabolites might have bioactivities based on the results of the PCA and PLS model, and this correlation bias with the activity result may occur during the metabolite profiling process. In order to overcome this limitation, we tried to resolve the bias. With this purpose, we selected a common metabolite profiling strategy that sorts significantly different compounds by various parts of plants. For this reason, we chose P. orientalis and analyzed different parts (fruit, branch, leaf) of this to validate the correlation between identified metabolites and bioactivities. Among 50 plant extracts, the fruit of P. orientalis showed high bioactivities in both NO inhibition and antioxidant assays. Additionally, as shown in Figure 1, it was located in the middle of superior NO inhibition and antioxidant extracts. These results indicated that their metabolites could correlate to not only NO inhibition but also antioxidant activities. Hence, we expected that we could validate bioactive compounds obtained from the above correlation analysis by profiling the metabolites from different parts of P. orientalis.

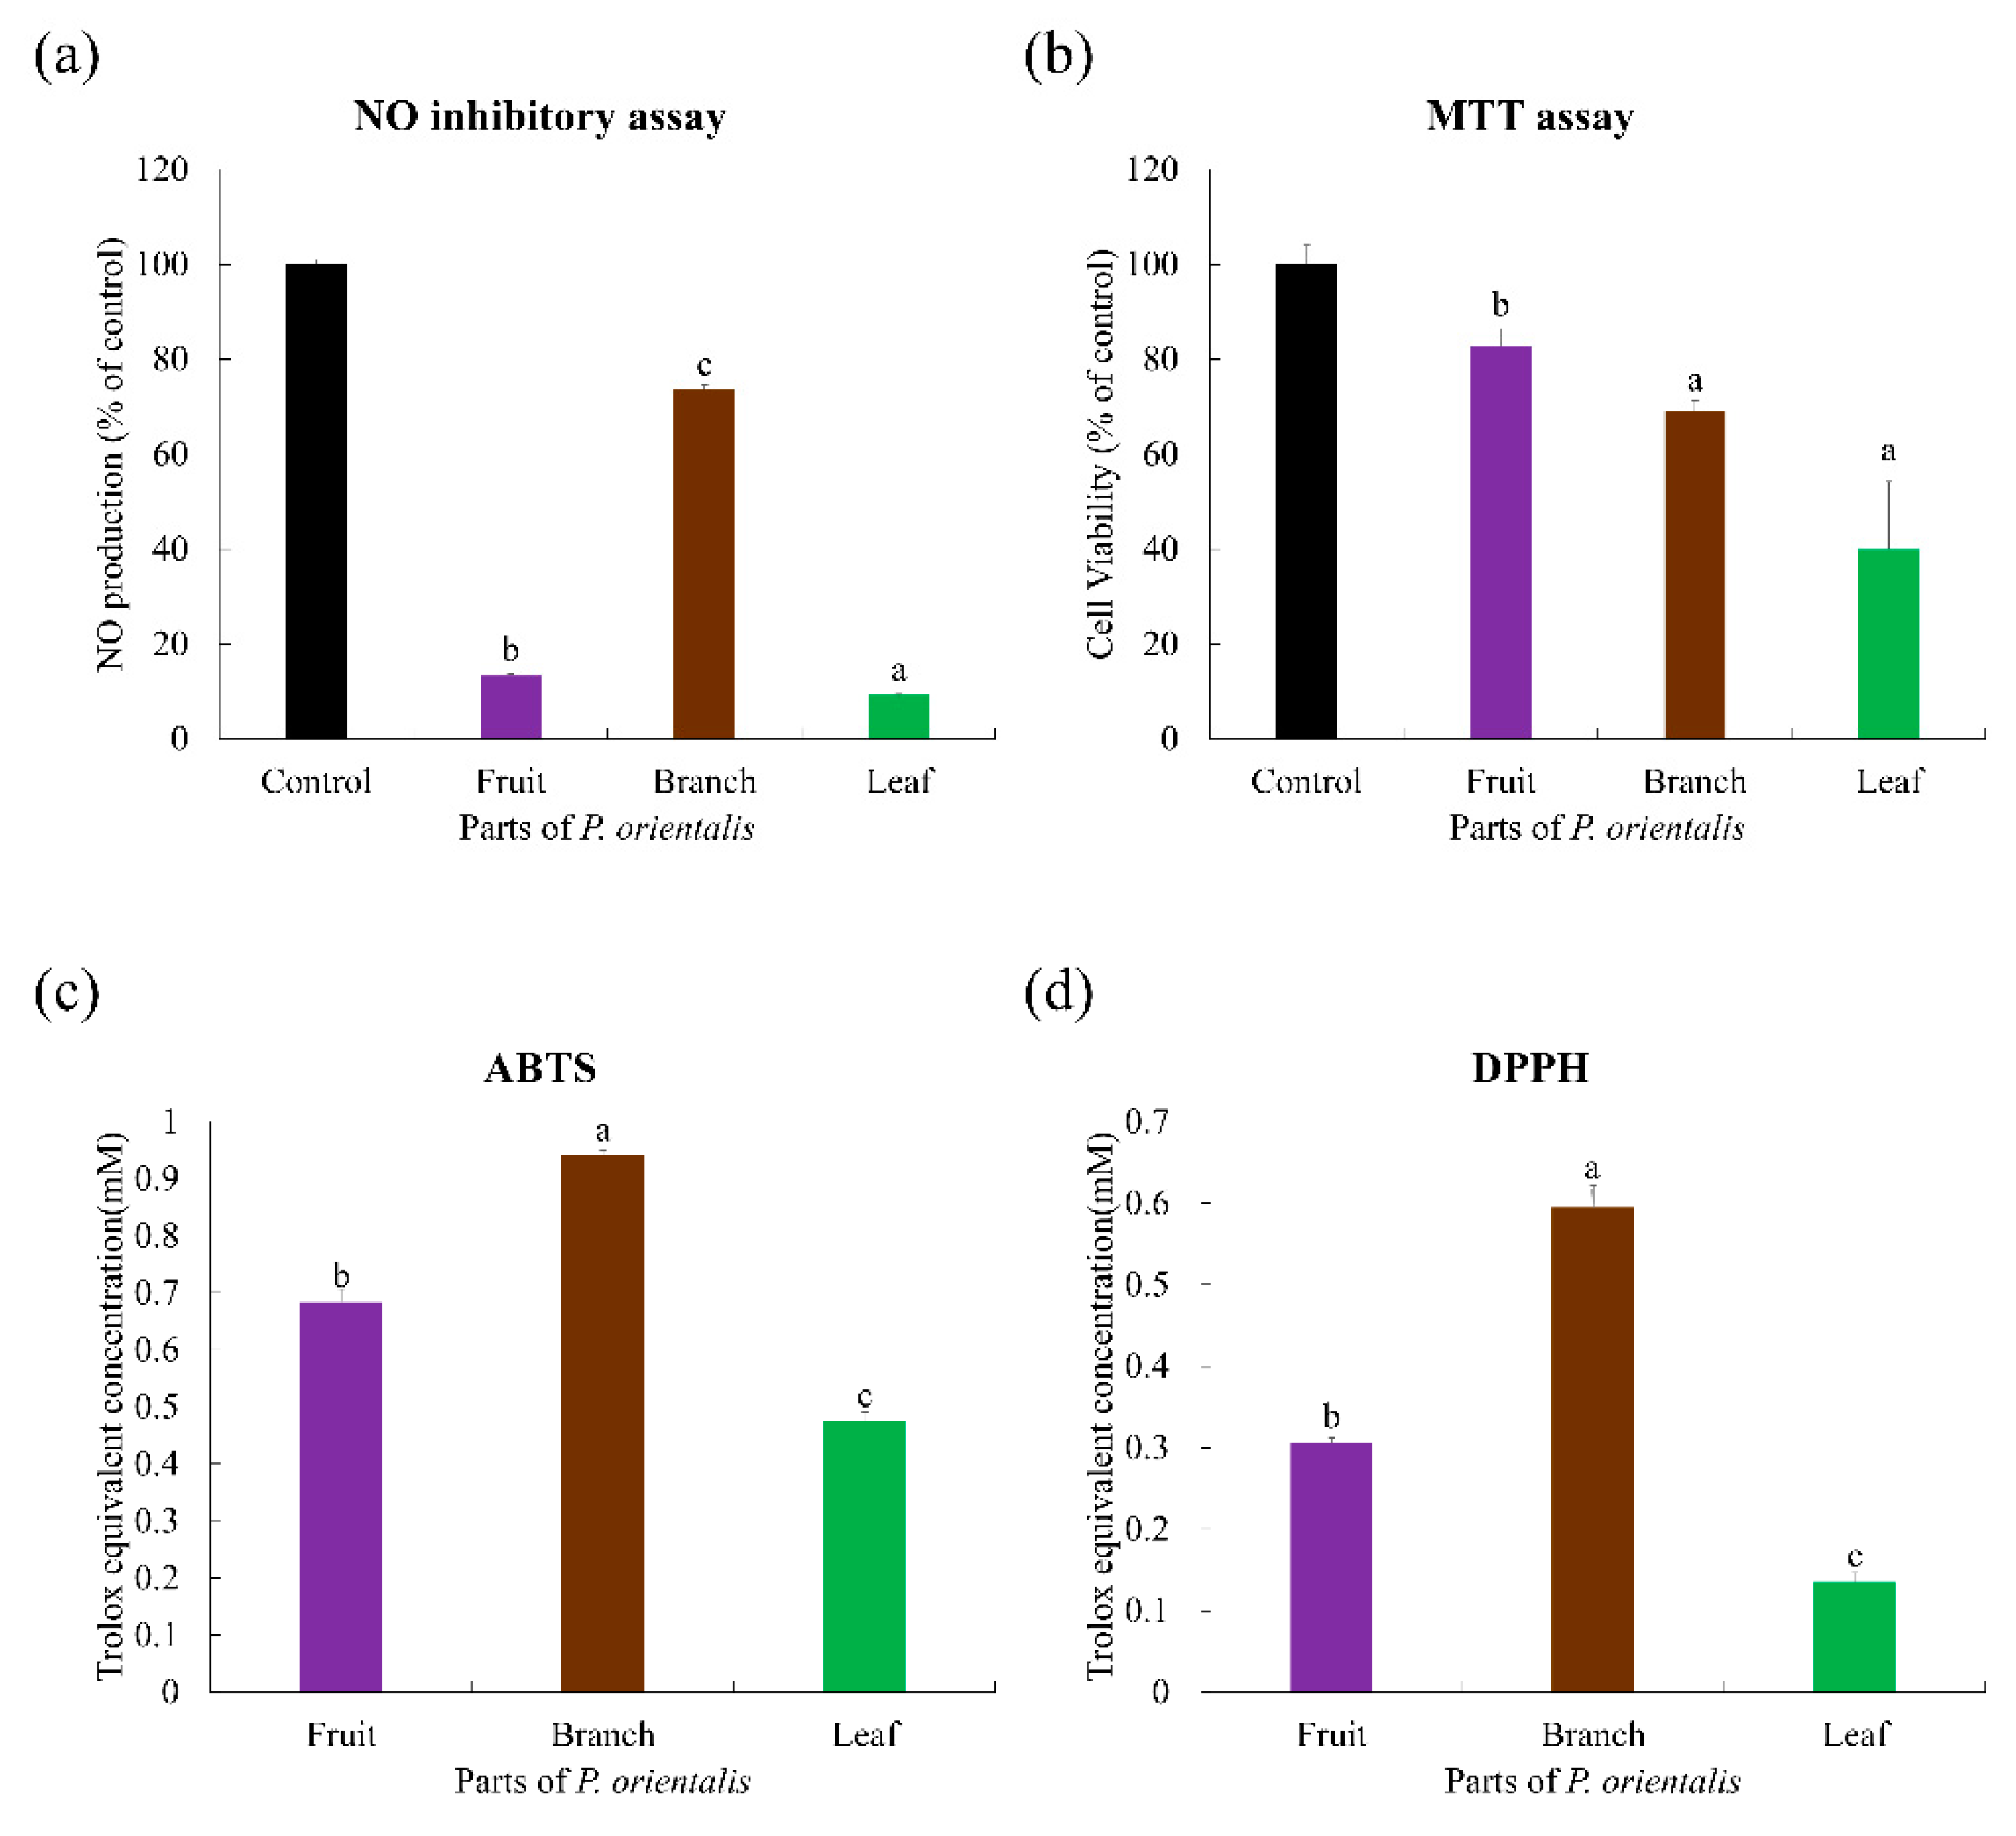
2.4. Bioactivity Correlations with the Secondary Metabolties of P. orientalis for the Validation of Bioactive Compounds in Indigenous Korean Plants

Multivariate statistical analyses of the datasets showed distinct metabolomic patterns in the PCA (Figure 6a) and partial least squares-discriminant analysis (PLS-DA; Figure 6b) models. The PCA plot derived from the UHPLC-LTQ-Orbitrap-MS/MS dataset showed that the metabolite profiles based on different parts were separated by PC1 (41.84%) and PC2 (36.45%) (Figure 6a). Similar to the PCA results, the PLS-DA score plot (Figure 6b) could also be readily divided into three groups corresponding to the parts of the samples, along PLS1 (41.84%) and PLS2 (36.45%). Twenty-two metabolites were selected as discriminant metabolites from different parts with VIP > 1.0 and p-value < 0.05 obtained from the PLS-DA model (Table S5). The results of the MTT assay showed that the fruits of the plant had high NO inhibitory activity (Figure 7a,b). However, in the antioxidant assay, the plant’s branches showed the highest antioxidant activity among the three tested parts (Figure 7c,d).
Pearson’s correlation analysis tentatively identified compounds that contributed to the observed biological activities of the plant extracts (Figure 8). Four metabolites significantly contributed to NO inhibitory activity, while 11 metabolites were positively correlated with antioxidant activity. Intriguingly, unlike the bioactive compounds in the 50 samples, biflavonoids such as robustaflavone and sciadopitysin contributed to both NO inhibitory and antioxidant activities. Similar to our results, biflavonoids showed antioxidant activity in various studies [56]. Furthermore, Carrillo-Hormaza et al. [57] revealed that biflavonoid content is responsible for the high antioxidant activity of plants and that the biflavonoids were more active than the flavonoid monomers. Thus, through the metabolite profiling of the different parts of P. orientalis, we validated the bioactive compounds in the extracts of 50 indigenous plants. In this profiling method, unlike with the above-mentioned process that was based on the results of the bioactivity analysis of different plants, we used differences in the bioactivities of the different parts of P. oreintalis to sort out significantly different metabolites without correlation bias. With this method, we revealed that biflavonoids have not only NO inhibitory but also antioxidant activities.
In summary, in screening 50 plant extracts, biflavonoids showed correlation with NO inhibitory activities and phenolic compounds correlated with antioxidant activities, whereas in a validation process using three different parts of P. orientalis, biflavonoids showed correlation with these two bioactivities. In this work, we show that the bioactive compound that correlated with bioactivity could be different depending on the method of sorting variable and metabolite profiling, for example based on bioassay results and different parts of plant. Additionally, we reveal that the metabolite obtained using this screening strategy could be used as chemical markers that are responsible for its strong NO inhibitory activity and antioxidant activities. These results pave the way to isolate specific compounds with commercially valuable bioactive properties using appropriate plants on the basis of their respective therapeutic values.

3. Materials and Methods

3.1. Chemicals and Reagents

High-performance liquid chromatography (HPLC)-grade ethanol, methanol, acetonitrile, and water were purchased from Fisher Scientific (Pittsburgh, PA, USA). All analytical-grade reagents used in this study were obtained from Sigma Chemical Co. (St. Louis, MO, USA).

3.2. Plant Materials

Fifty samples of plant extracts obtained from the Wildlife Natural Products Bank (NIBR, Incheon, Korea) were used in this study (Table 1), and all voucher specimens were deposited at the herbarium of the National Institute of Biological Resources (NIBR, Incheon, Korea). The plant samples were dried under shade, and coarsely ground. Each sample (100 g) was extracted for 72 h with 70% ethanol (1 L). The extract was filtered, and the solvent was concentrated using a rotary evaporator (HS-3005W; Hahnshin, Korea). The concentrated extract was further lyophilized, yielding 12% and stored below −20 °C before distribution.

3.3. UHPLC-LTQ-Orbitrap-MS/MS Analysis

For UHPLC-LTQ-Orbitrap-MS/MS analysis, each sample (10 mg/mL) was dissolved in 80% ethanol and used. The analysis was performed using a UHPLC system equipped with a Vanquish binary pump H system (Thermo Fisher Scientific, Waltham, MA, USA) coupled with an auto-sampler and column compartment. Chromatographic separation was performed on a Phenomenex KINETEX® C18 Column (100 mm × 2.1 mm, 1.7 μm; Torrance, CA, USA), and the operational parameters were adapted from a study by Lee et al. [25]. The samples were analyzed using three analytical replicates for each sample. To circumvent systematic errors during analysis, the samples were analyzed in random blocks of 10 runs, followed by an intermittent QC sample prepared from pooled blends of each sample extracts. The analytical replicates of the QC samples were clustered at the PCA score plot (Figure S3), ensuring the normal performance of the instrument. The base peak chromatogram of negative and positive mode of QC were shown in Figure S6.

3.4. Data Processing and Statistical Analysis

The raw data files from UHPLC-LTQ-Orbitrap-MS/MS were converted into a computable document form (.cdf) format using Thermo Xcalibur v.2.2 (Thermo Fisher Scientific, San Jose, CA, USA). After conversion, MetAlign software (http://www.metalign.nl, accessed on 25 August 2021) was used to preprocess the netCDF data to obtain the baseline correction, peak alignment, peak detection, accurate masses, and normalized peak intensities [48]. The parameters of MetAlign were set according to the specific scaling requirements and chromatographic and mass spectrometric conditions used in the experiments (Tables S1 and S4). Subsequent data, which contained the sample name and peak area information as variables, were transferred to an Excel spreadsheet, and multivariate statistical analyses were performed using the SIMCA-P+ 12.0 software (Umetrics, Umea, Sweden). Both unsupervised PCA and supervised PLS-DA were performed to compare the different metabolites of the samples. PLS-DA was used to improve data interpretability by selecting the influential variables. Based on this, the significant discriminant metabolites were selected uniformly at VIP > 1.0 and p-value < 0.05. Cross-validation analysis of the PLS-DA results is summarized in Figure 2. This analysis indicates the prediction accuracy, fitness, and quality of the model. The selected metabolites were identified by comparing their retention times and mass fragment patterns with in-house library data, references, and several databases, such as the National Institutes of Standards and Technology Library (v.2.0, 2011; FairCom, Gaithersburg, MD, USA), the Dictionary of Natural Products (v.16:2, 2007; Chapman and Hall, USA), Wiley 8, and the Human Metabolome Database (HMDB; http://www.hmdb.ca/, accessed on 25 August 2021). Differences in the results of the bioactivity assays were tested by the analysis of variance and Duncan’s multiple range test using PASW Statistics 18 (SPSS Inc., Chicago, IL, USA). Correlations between the metabolites and the bioactivity assay results were calculated via Pearson’s correlation coefficient test using PASW Statistics 18.

3.5. Antioxidant Assays

ABTS and DPPH radical scavenging assays were performed to measure the in vitro antioxidant activities of 50 samples of indigenous plants (10 mg/mL of 80% ethanol), following the procedure reported by Lee et al. [58]. All experiments were carried out in triplicate.

3.6. Nitric Oxide (NO) Inhibition Assays

RAW 264.7 cells (Code No.: TIB-71, the American Type Culture Collection (Rockville, MD, USA)) were seeded in 96-well plates at a density of 1 × 10⁶ cells/mL in Roswell Park Memorial Institute (RPMI) 1640 supplemented with 100 U/mL penicillin, 100 μg/mL streptomycin, and 10% fetal bovine serum. The cells were grown at 37 °C and 5% CO2 in humidified air. After preincubation for 18 h, an LPS stock solution (2 mg/mL) was diluted to 1 µg/mL and administered to the control and sample groups. The plant extracts and control (DMSO in media) with lipopolysaccharide (1 µg/mL) were incubated for 24 h under the same conditions. The nitrite in the culture supernatants was measured by adding 100 μL Griess reagent (1% sulfanilamide and 0.1% N- (1-naphthyl)-ethylenediamine dihydrochloride in 5% phosphoric acid) to 100 μL of the supernatant of each sample for 10 min at room temperature. The optical density at 540 nm (OD540) was measured using a Spectramax 250 microplate reader (Molecular Devices, Sunnyvale, CA, USA). The assay results were expressed as the mean value of four biological replicates.

3.7. MTT Assays for Measuring Cell Viability

Cell viability was measured using the conventional 3- (4,5-dimethylthiazol,2-yl)-2,5-diphenyltetrazolium bromide (MTT) assay with RAW264.7 cells. At 4 h prior to culture termination, 10 μL of MTT solution (10 mg/mL in phosphate-buffered saline) was continuously cultured until termination. Culture was stopped by the addition of 15% sodium dodecyl sulfate to each well to solubilize the formazan produced, and the OD at 570 nm (OD570-630) was measured using a microplate Spectramax 250 microplate reader.
The cytotoxicity of the 50 samples was evaluated by the MTT assay. The cell suspension (0.5 × 10⁶ cells/mL) was plated in a 96-well plate. After 2 h of culture, varying concentrations of plant samples were added to each well and cultured for another 6, 24, and 48 h. Cell viability was measured using the MTT assay in four biological replicates.

4. Conclusions

In the present study, we used a new multi-parallel metabolomic-cum-bioassay-guided approach to explore the bioactive compounds in 50 indigenous Korean plant extracts. Additionally, we validated these bioactive compounds in different parts of P. orientalis to solve the correlation bias of the new screening strategy. From these results, we propose a potential bioactive compound with NO inhibitory and antioxidant activities. Biflavonoids were found to be the major metabolites that contributed to the NO inhibitory activity. Phenolic acids were also positively correlated with antioxidant activity. In the validation step, biflavonoids were found to contribute to both NO inhibitory and antioxidant activities. These results indicate that this validation solved the correlation bias that may occur with the new screening strategy. To the best of our knowledge, this is the first report using a multi-parallel metabolomic-cum-bioassay-guided approach to identify bioactive compounds in 50 indigenous Korean plant extracts. This study showed that metabolite profiling can be performed in line with the purpose of the study or the viewpoints, and as a result, significantly different metabolites can be selected accordingly. Additionally, this study suggested that use of novel screening strategies could be useful for choosing specific plant species and bioactive compounds that contribute to the plant’s bioactivity when profiling various species. Our work and its future applications can help to develop novel as well as culturally relevant plant-based therapeutic approaches. However, a limitation of the present study is that the bioactivities of functional metabolites which showed correlation in this screening has not been performed. Therefore, it is necessary to evaluate their bioactivities and compare each other for further applications.

Supplementary Materials

The following are available online at https://www.mdpi.com/article/10.3390/metabo11090585/s1, Figure S1: (a) NO inhibitory activity and (b) MTT assay. Values are expressed as the average of four biological replicates. Each value is expressed as mean ± SD. The sample information is shown in Table 1, Figure S2: Results of the antioxidant activity assay (a) ABTS, (b) DPPH of the extracts of 50 indigenous plants. Values are expressed as the average of three biological replicates. Each value is expressed as mean ± SD. The sample information are shown in Table 1, Figure S3: PCA score plot derived from positive mode data set of UHPLC-LTQ-Orbitrap-MS/MS of 50 indigenous Korean plant extracts. The quality control (QC) samples were analyzed using five analytical replicates. ▲: 50 indigenous Korean plant extracts, : Quality control, Figure S4: UHPLC-LTQ-Orbitrap-MS/MS chromatogram of (a) quality control, (b) C. communis (Com1), (c) E. umbellate (Ela1), (d) E. sessiliflorus (Ara5), (e) P. orientalis (Cup1) and (f) S. flavescens (Fab2). These chromatograms were used to identify metabolites that contributed to NO inhibitory activity, Figure S5: UHPLC-LTQ-Orbitrap-MS/MS chromatogram of (a) quality control, (b) C. crenata (Fag1), (c) E. umbellate (Ela2), (d) M. thunbergia (Lau3), (e) P. orientalis (Cup1) and (f) P. orientalis (Cup2). These chromatograms were used to identify metabolites that contributed to antioxidant activity, Figure S6: Heatmap analysis in 50 Korean indigenous plant extracts derived from UHPLC-LTQ-Orbitrap-MS/MS data. The heatmap indicates the relative contents in secondary metabolites which contribute to NO inhibitory activities. a Metabolites that have a high contribution to the bioactivities were determined by PLS-biplot (VIP > 1.0, p < 0.05). The sample information is shown in Table 1, Figure S7: Heatmap analysis in 50 Korean indigenous plant extracts derived from UHPLC-LTQ-Orbitrap-MS/MS data. The heatmap indicates the relative contents in secondary metabolites which contribute to antioxidant activities. a Metabolites that have a high contribution to the bioactivities were determined by PLS-biplot (VIP > 1.0, p < 0.05). The sample information is shown in Table 1, Table S1: MetAlign settings used to automatically process the experimental dataset of 50 indigenous Korean plant extracts after UHPLC-LTQ-Orbitrap-MS/MS analyses, Table S2: Tentatively identified metabolites from QC samples and 5 plant extracts that contribute to NO inhibitory activityafter UHPLC-LTQ-Orbitrap-MS/MS analyses, Table S3: Tentatively identified metabolites from QC samples and 5 plant extracts that contribute to antioxidant activity after UHPLC-LTQ-Orbitrap-MS/MS analyses, Table S4: MetAlign settings used to automatically process the experimental dataset of Platycladus orientalis after UHPLC-LTQ-Orbitrap-MS/MS analyses, Table S5: Discriminant metabolites from three different parts of Platycladus orientalis after UHPLC-LTQ-Orbitrap-MS/MS analyses.

Author Contributions

Conceptualization, S.R.C., M.Y.L., S.L., J.Y.C. and C.H.L.; methodology, S.R.C. and M.Y.L.; investigation, S.R.C., S.A.K., J.O.; resources, D.W.H., S.L. and B.-H.L.; writing—original draft preparation, S.R.C.; writing—review and editing, S.R.C., M.Y.L., S.A.K., J.O., S.L.; visualization, S.R.C.; supervision, M.Y.L., S.L., J.Y.C. and C.H.L.; project administration, S.L. All authors have read and agreed to the published version of the manuscript.

Funding

This study was supported by the Basic Research Lab program (No. 2020R1A4A1018648) through the National Research Foundation grant funded by the Ministry of Science and ICT, Republic of Korea. This work was supported by a grant from the National Institute of Biological Resources (NIBR), funded by the Ministry of Environment (MOE) of the Republic of Korea (NIBR202121102).

Institutional Review Board Statement

Not applicable.

Informed Consent Statement

Not applicable.

Data Availability Statement

The data presented in this study are available in supplementary material.

Conflicts of Interest

The authors declare no conflict of interest.

References

  1. Park, K.-Y.; Jeong, J.-K.; Lee, Y.-E.; Daily, J.W., III. Health benefits of kimchi (Korean fermented vegetables) as a probiotic food. J. Med. Food 2014, 17, 6–20. [Google Scholar] [CrossRef]
  2. Choi, C.W.; Kim, S.C.; Hwang, S.S.; Choi, B.K.; Ahn, H.J.; Lee, M.Y.; Park, S.H.; Kim, S.K. Antioxidant activity and free radical scavenging capacity between Korean medicinal plants and flavonoids by assay-guided comparison. Plant Sci. 2002, 163, 1161–1168. [Google Scholar] [CrossRef]
  3. Lee, K.; Kim, B.; Kim, J.; Heo, M.; Kim, H. Biological screening of 100 plant extracts for cosmetic use (I): Inhibitory activities of tyrosinase and DOPA auto-oxidation. Int. J. Cosmet. Sci. 1997, 19, 291–298. [Google Scholar] [CrossRef]
  4. Cowan, M.M. Plant products as antimicrobial agents. Clin. Microbiol. Rev. 1999, 12, 564–582. [Google Scholar] [CrossRef] [Green Version]
  5. Dai, J.; Mumper, R.J. Plant phenolics: Extraction, analysis and their antioxidant and anticancer properties. Molecules 2010, 15, 7313–7352. [Google Scholar] [CrossRef]
  6. Korkina, L.; Kostyuk, V.; De Luca, C.; Pastore, S. Plant phenylpropanoids as emerging anti-inflammatory agents. Mini Rev. Med. Chem. 2011, 11, 823–835. [Google Scholar] [CrossRef] [PubMed]
  7. Seca, A.M.; Pinto, D.C. Plant secondary metabolites as anticancer agents: Successes in clinical trials and therapeutic application. Int. J. Mol. Sci. 2018, 19, 263. [Google Scholar] [CrossRef] [PubMed] [Green Version]
  8. Tungmunnithum, D.; Pinthong, D.; Hano, C. Flavonoids from Nelumbo nucifera Gaertn., a medicinal plant: Uses in traditional medicine, phytochemistry and pharmacological activities. Medicines 2018, 5, 127. [Google Scholar] [CrossRef] [PubMed] [Green Version]
  9. Kallscheuer, N.; Classen, T.; Drepper, T.; Marienhagen, J. Production of plant metabolites with applications in the food industry using engineered microorganisms. Curr. Opin. Biotechnol. 2019, 56, 7–17. [Google Scholar] [CrossRef]
  10. Zhou, Y.X.; Zhang, H.; Peng, C. Puerarin: A review of pharmacological effects. Phytother. Res. 2014, 28, 961–975. [Google Scholar] [CrossRef]
  11. Takshak, S.; Agrawal, S. Defense potential of secondary metabolites in medicinal plants under UV-B stress. J. Photochem. Photobiol. B Biol. 2019, 193, 51–88. [Google Scholar] [CrossRef]
  12. Nijveldt, R.J.; Van Nood, E.; Van Hoorn, D.E.; Boelens, P.G.; Van Norren, K.; Van Leeuwen, P.A. Flavonoids: A review of probable mechanisms of action and potential applications. Am. J. Clin. Nutr. 2001, 74, 418–425. [Google Scholar] [CrossRef]
  13. Stuehr, D.; Nathan, C. Nitric oxide. A macrophage product responsible for cytostasis and respiratory inhibition in tumor target cells. J. Exp. Med. 1989, 169, 1543–1555. [Google Scholar] [CrossRef]
  14. Nathan, C.F.; Hibbs, J.B., Jr. Role of nitric oxide synthesis in macrophage antimicrobial activity. Curr. Opin. Immunol. 1991, 3, 65–70. [Google Scholar] [CrossRef]
  15. MacMicking, J.; Xie, Q.-W.; Nathan, C. Nitric oxide and macrophage function. Annu. Rev. Immunol. 1997, 15, 323–350. [Google Scholar] [CrossRef]
  16. Seifried, H.E.; Anderson, D.E.; Fisher, E.I.; Milner, J.A. A review of the interaction among dietary antioxidants and reactive oxygen species. J. Nutr. Biochem. 2007, 18, 567–579. [Google Scholar] [CrossRef] [PubMed]
  17. Lee, K.; Padzil, A.; Syahida, A.; Abdullah, N.; Zuhainis, S.; Maziah, M.; Sulaiman, M.; Israf, D.; Shaari, K.; Lajis, N. Evaluation of anti-inflammatory, antioxidant and anti-nociceptive activities of six Malaysian medicinal plants. J. Med. Plants Res. 2011, 5, 5555–5563. [Google Scholar]
  18. Yanishlieva, N.V.; Marinova, E.; Pokorný, J. Natural antioxidants from herbs and spices. Eur. J. Lipid Sci. Technol. 2006, 108, 776–793. [Google Scholar] [CrossRef]
  19. Akhtar, N.; Mirza, B. Phytochemical analysis and comprehensive evaluation of antimicrobial and antioxidant properties of 61 medicinal plant species. Arab. J. Chem. 2018, 11, 1223–1235. [Google Scholar] [CrossRef] [Green Version]
  20. Sulaiman, M.; Tijani, H.I.; Abubakar, B.M.; Haruna, S.; Hindatu, Y.; Mohammed, J.N.; Idris, A. An overview of natural plant antioxidants: Analysis and evaluation. Adv. Biochem. 2013, 1, 64–72. [Google Scholar] [CrossRef] [Green Version]
  21. Hong, C.H.; Hur, S.K.; Oh, O.-J.; Kim, S.S.; Nam, K.A.; Lee, S.K. Evaluation of natural products on inhibition of inducible cyclooxygenase (COX-2) and nitric oxide synthase (iNOS) in cultured mouse macrophage cells. J. Ethnopharmacol. 2002, 83, 153–159. [Google Scholar] [CrossRef]
  22. Kim, H.-J.; Lee, D.-J.; Ku, J.-J.; Choi, K.; Park, K.-W.; Kang, S.-H.; Moon, C.; Lee, P.-J. Anti-inflammatory effect of extracts from folk plants in Ulleung island. Korean J. Plant Resour. 2013, 26, 169–177. [Google Scholar] [CrossRef] [Green Version]
  23. Yang, E.-J.; Yim, E.-Y.; Song, G.; Kim, G.-O.; Hyun, C.-G. Inhibition of nitric oxide production in lipopolysaccharide-activated RAW 264.7 macrophages by Jeju plant extracts. Interdiscip. Toxicol. 2009, 2, 245. [Google Scholar] [CrossRef] [PubMed] [Green Version]
  24. Krishnaiah, D.; Sarbatly, R.; Nithyanandam, R. A review of the antioxidant potential of medicinal plant species. Food Bioprod. Process. 2011, 89, 217–233. [Google Scholar] [CrossRef]
  25. Lee, S.; Oh, D.-G.; Singh, D.; Lee, J.S.; Lee, S.; Lee, C.H. Exploring the metabolomic diversity of plant species across spatial (leaf and stem) components and phylogenic groups. BMC Plant Biol. 2020, 20, 39. [Google Scholar] [CrossRef] [PubMed]
  26. Abd Ghafar, S.Z.; Mediani, A.; Ramli, N.S.; Abas, F. Antioxidant, α-glucosidase, and nitric oxide inhibitory activities of Phyllanthus acidus and LC–MS/MS profile of the active extract. Food Biosci. 2018, 25, 134–140. [Google Scholar] [CrossRef]
  27. Yoo, T.-K.; Jeong, W.T.; Kim, J.G.; Ji, H.S.; Ahn, M.-A.; Chung, J.-W.; Lim, H.B.; Hyun, T.K. UPLC-ESI-Q-TOF-MS-Based Metabolite Profiling, Antioxidant and Anti-Inflammatory Properties of Different Organ Extracts of Abeliophyllum distichum. Antioxidants 2021, 10, 70. [Google Scholar] [CrossRef]
  28. Yuk, H.J.; Oh, K.Y.; Kim, D.-Y.; Song, H.-H.; Kim, J.Y.; Oh, S.-R.; Ryu, H.W. Metabolomic profiling, antioxidant and anti-inflammatory activities of Hypericum species growing in South Korea. Nat. Prod. Commun. 2017, 12, 1934578X1701200710. [Google Scholar] [CrossRef] [Green Version]
  29. Lee, S.; Oh, D.-G.; Lee, S.; Kim, G.R.; Lee, J.S.; Son, Y.K.; Bae, C.-H.; Yeo, J.; Lee, C.H. Chemotaxonomic metabolite profiling of 62 indigenous plant species and its correlation with bioactivities. Molecules 2015, 20, 19719–19734. [Google Scholar] [CrossRef] [Green Version]
  30. Kim, Y.M.; Lee, J.; Park, S.-H.; Lee, C.; Lee, J.W.; Lee, D.; Kim, N.; Lee, D.; Kim, H.Y.; Lee, C.H. LC–MS-based chemotaxonomic classification of wild-type Lespedeza sp. and its correlation with genotype. Plant Cell Rep. 2012, 31, 2085–2097. [Google Scholar] [CrossRef]
  31. Lee, S.; Oh, D.-G.; Singh, D.; Lee, H.J.; Kim, G.R.; Lee, S.; Lee, J.S.; Lee, C.H. Untargeted Metabolomics Toward Systematic Characterization of Antioxidant Compounds in Betulaceae Family Plant Extracts. Metabolites 2019, 9, 186. [Google Scholar] [CrossRef] [Green Version]
  32. Son, S.Y.; Kim, N.K.; Lee, S.; Singh, D.; Kim, G.R.; Lee, J.S.; Yang, H.-S.; Yeo, J.; Lee, S.; Lee, C.H. Metabolite fingerprinting, pathway analyses, and bioactivity correlations for plant species belonging to the Cornaceae, Fabaceae, and Rosaceae families. Plant Cell Rep. 2016, 35, 1917–1931. [Google Scholar] [CrossRef] [PubMed]
  33. Won, J.Y.; Son, S.Y.; Lee, S.; Singh, D.; Lee, S.; Lee, J.S.; Lee, C.H. Strategy for screening of antioxidant compounds from two Ulmaceae species based on liquid chromatography-mass spectrometry. Molecules 2018, 23, 1830. [Google Scholar] [CrossRef] [PubMed] [Green Version]
  34. Jain, C.; Khatana, S.; Vijayvergia, R. Bioactivity of secondary metabolites of various plants: A review. Int. J. Pharm. Sci. Res. 2019, 10, 494–498. [Google Scholar]
  35. Bing, F.-H.; Liu, J.; Li, Z.; Zhang, G.-B.; Liao, Y.-F.; Li, J.; Dong, C.-Y. Anti-influenza-virus activity of total alkaloids from Commelina communis L. Arch. Virol. 2009, 154, 1837–1840. [Google Scholar] [CrossRef] [PubMed]
  36. Fan, S.-Y.; Zeng, H.-W.; Pei, Y.-H.; Li, L.; Ye, J.; Pan, Y.-X.; Zhang, J.-G.; Yuan, X.; Zhang, W.-D. The anti-inflammatory activities of an extract and compounds isolated from Platycladus orientalis (Linnaeus) Franco in vitro and ex vivo. J. Ethnopharmacol. 2012, 141, 647–652. [Google Scholar] [CrossRef]
  37. He, X.; Fang, J.; Huang, L.; Wang, J.; Huang, X. Sophora flavescens Ait.: Traditional usage, phytochemistry and pharmacology of an important traditional Chinese medicine. J. Ethnopharmacol. 2015, 172, 10–29. [Google Scholar] [CrossRef]
  38. Jin, K.-S.; Oh, Y.N.; Park, J.; Lee, J.Y.; Jin, S.; Hyun, S.K.; Hwang, H.J.; Kwon, H.J.; Kim, B.W. Anti-oxidant, anti-melanogenic, and anti-inflammatory activities of Zanthoxylum schinifolium extract and its solvent fractions. Microbiol. Biotechnol. Lett. 2012, 40, 371–379. [Google Scholar] [CrossRef]
  39. Kim, M.J.; Wang, H.S.; Lee, M.W. Anti-inflammatory effects of fermented bark of Acanthopanax sessiliflorus and its isolated compounds on lipopolysaccharide-treated RAW 264.7 macrophage cells. Evid.-Based Complementary Altern. Med. 2020, 2020, 674925. [Google Scholar] [CrossRef]
  40. Venkatesan, T.; Choi, Y.-W.; Lee, J.; Kim, Y.-K. Pinus densiflora needle supercritical fluid extract suppresses the expression of pro-inflammatory mediators iNOS, IL-6 and IL-1β, and activation of inflammatory STAT1 and STAT3 signaling proteins in bacterial lipopolysaccharide-challenged murine macrophages. Daru J. Pharm. Sci. 2017, 25, 1–10. [Google Scholar]
  41. Ozen, T.; Yenigun, S.; Altun, M.; Demirtas, I. Phytochemical Constituents, ChEs and Urease Inhibitions, Antiproliferative and Antioxidant Properties of Elaeagnus umbellata Thunb. Comb. Chem. High Throughput Screen. 2017, 20, 559–578. [Google Scholar] [CrossRef] [PubMed]
  42. Ren, J.; Liao, L.; Shang, S.; Zheng, Y.; Sha, W.; Yuan, E. Purification, characterization, and bioactivities of polyphenols from Platycladus orientalis (L.) Franco. J. Food Sci. 2019, 84, 667–677. [Google Scholar] [CrossRef] [PubMed]
  43. Tuyen, P.T.; Xuan, T.D.; Khang, D.T.; Ahmad, A.; Quan, N.V.; Tu Anh, T.T.; Anh, L.H.; Minh, T.N. Phenolic compositions and antioxidant properties in bark, flower, inner skin, kernel and leaf extracts of Castanea crenata Sieb. et Zucc. Antioxidants 2017, 6, 31. [Google Scholar] [CrossRef] [Green Version]
  44. Xu, M.L.; Hu, J.H.; Wang, L.; Kim, H.-S.; Jin, C.-W.; Cho, D.-H. Antioxidant and Anti-diabetes Activity of Extracts from Machilus thunbergii S. et Z. Korean J. Med. Crop Sci. 2010, 18, 34–39. [Google Scholar]
  45. Galindo-Prieto, B.; Eriksson, L.; Trygg, J. Variable influence on projection (VIP) for orthogonal projections to latent structures (OPLS). J. Chemom. 2014, 28, 623–632. [Google Scholar] [CrossRef]
  46. Azizan, A.; Lee, A.X.; Abdul Hamid, N.A.; Maulidiani, M.; Mediani, A.; Abdul Ghafar, S.Z.; Zolkeflee, N.K.Z.; Abas, F. Potentially bioactive metabolites from pineapple waste extracts and their antioxidant and α-glucosidase inhibitory activities by 1H NMR. Foods 2020, 9, 173. [Google Scholar] [CrossRef] [Green Version]
  47. Lee, M.Y.; Seo, H.S.; Singh, D.; Lee, S.J.; Lee, C.H. Unraveling dynamic metabolomes underlying different maturation stages of berries harvested from Panax ginseng. J. Ginseng Res. 2020, 44, 413–423. [Google Scholar] [CrossRef]
  48. Lee, H.J.; Suh, D.H.; Jung, E.S.; Park, H.M.; Jung, G.-Y.; Do, S.-G.; Lee, C.H. Metabolomics of Lonicera caerulea fruit during ripening and its relationship with color and antioxidant activity. Food Res. Int. 2015, 78, 343–351. [Google Scholar] [CrossRef]
  49. Ren, J.; Zheng, Y.; Lin, Z.; Han, X.; Liao, W. Macroporous resin purification and characterization of flavonoids from Platycladus orientalis (L.) Franco and their effects on macrophage inflammatory response. Food Funct. 2017, 8, 86–95. [Google Scholar] [CrossRef] [PubMed]
  50. Lee, M.K.; Yang, H.; Yoon, J.S.; Jeong, E.J.; Ha, N.R.; Sung, S.H.; Kim, Y.C. Antifibrotic activity of diterpenes from Biota orientalis leaves on hepatic stellate cells. Arch. Pharmacal Res. 2008, 31, 866–871. [Google Scholar] [CrossRef] [PubMed]
  51. Nazir, N.; Zahoor, M.; Nisar, M.; Khan, I.; Karim, N.; Abdel-Halim, H.; Ali, A. Phytochemical analysis and antidiabetic potential of Elaeagnus umbellata (Thunb.) in streptozotocin-induced diabetic rats: Pharmacological and computational approach. BMC Complementary Altern. Med. 2018, 18, 1–16. [Google Scholar] [CrossRef] [PubMed]
  52. Andrade, A.W.L.; da Conceição Machado, K.; da Conceição Machado, K.; Figueiredo, D.D.R.; David, J.M.; Islam, M.T.; Uddin, S.J.; Shilpi, J.A.; Costa, J.P. In vitro antioxidant properties of the biflavonoid agathisflavone. Chem. Cent. J. 2018, 12, 1–9. [Google Scholar] [CrossRef] [PubMed]
  53. Jo, A.; Yoo, H.J.; Lee, M. Robustaflavone isolated from Nandina domestica using bioactivity-guided fractionation downregulates inflammatory mediators. Molecules 2019, 24, 1789. [Google Scholar] [CrossRef] [PubMed] [Green Version]
  54. Li, M.; Li, B.; Hou, Y.; Tian, Y.; Chen, L.; Liu, S.; Zhang, N.; Dong, J. Anti-inflammatory effects of chemical components from Ginkgo biloba L. male flowers on lipopolysaccharide-stimulated RAW264. 7 macrophages. Phytother. Res. 2019, 33, 989–997. [Google Scholar] [CrossRef]
  55. Kim, H.P.; Park, H.; Son, K.H.; Chang, H.W.; Kang, S.S. Biochemical pharmacology of biflavonoids: Implications for anti-inflammatory action. Arch. Pharmacal Res. 2008, 31, 265–273. [Google Scholar] [CrossRef] [PubMed]
  56. Gontijo, V.S.; Dos Santos, M.H.; Viegas, C., Jr. Biological and chemical aspects of natural biflavonoids from plants: A brief review. Mini Rev. Med. Chem. 2017, 17, 834–862. [Google Scholar] [CrossRef] [PubMed]
  57. Carrillo-Hormaza, L.; Ramírez, A.M.; Quintero-Ortiz, C.; Cossio, M.; Medina, S.; Ferreres, F.; Gil-Izquierdo, A.; Osorio, E. Comprehensive characterization and antioxidant activities of the main biflavonoids of Garcinia madruno: A novel tropical species for developing functional products. J. Funct. Foods 2016, 27, 503–516. [Google Scholar] [CrossRef]
  58. Lee, M.Y.; Singh, D.; Kim, S.H.; Lee, S.J.; Lee, C.H. Ultrahigh pressure processing produces alterations in the metabolite profiles of Panax ginseng. Molecules 2016, 21, 816. [Google Scholar] [CrossRef] [Green Version]
Figure 1. (a) PCA score plot; (b) PLS biplot derived from the UHPLC-LTQ-Orbitrap-MS dataset for Table 1. indigenous plants. PLS biplot shows the correlation between the metabolite variations and the selected test bioactivities in the extracts of the 50 indigenous plants. The samples were analyzed using three analytical replicates for each sample. : Plant species which have high antioxidant activities; : Plant species which have high NO inhibition activity; ▲: Plant species which include in 50 indigenous plants.
Metabolites 11 00585 g001
Figure 2. Permutation plots of the PLS model describing the R2 and Q2 Y-intercepts for NO inhibitory (a), ABTS (b), and DPPH (c) activities of 50 indigenous plant extracts. The PLS model was validated using 200 permutation tests to evaluate its goodness of fit and predictive power.
Metabolites 11 00585 g002
Figure 3. Heatmap analysis in plant species which have high NO inhibitory activities derived from UHPLC-LTQ-Orbitrap-MS/MS data. The heatmap indicates the relative contents in the secondary metabolites among the different fractions. a Metabolites that have a high contribution to the bioactivities were determined by PLS-biplot (VIP > 1.0, p < 0.05). N.I.: Non-identified metabolite.
Metabolites 11 00585 g003
Figure 4. Heatmap analysis in plant species which have high antioxidant activities derived from UHPLC-LTQ-Orbitrap-MS/MS data. The heatmap indicates the relative contents in the secondary metabolites among the different fractions. a Metabolites that have high contribution to the bioactivities were determined by PLS-biplot (VIP > 1.0, p < 0.05). N.I.: Non-identified metabolite.
Metabolites 11 00585 g004
Figure 5. Correlation map between the relative abundance of the secondary metabolites and (a) NO production inhibitory activity and (b) antioxidant (ABTS, DPPH) activity of the extracts of 50 indigenous plants. Each square indicates Pearson’s correlation coefficient values (r). Red and blue represent positive (0 < r < 0.5) and negative (−0.5 < r < 0) correlations, respectively. * FDR-adjusted p-value < 0.05; a Metabolites that have a high contribution to the bioactivities were determined by PLS-biplot (VIP > 1.0). N.I.: Non-identified metabolites.
Metabolites 11 00585 g005
Figure 6. (a) PCA and (b) PLS-DA score plots of the results obtained for the different parts from P. orientalis analyzed by UHPLC-LTQ-Orbitrap-MS/MS. The samples were analyzed using three analytical replicates for each sample. : Fruits of P. orientalis, : Leaves of P. orientalis, : Branches of P. orientalis.
Metabolites 11 00585 g006
Figure 7. Results of the (a) NO inhibitory assay, (b) MTT assay, and the antioxidant activity assays, namely (c) ABTS and (d) DPPH of the extracts of the different parts from P. orientalis. Values of (a,b) are expressed as the mean ± standard deviation (SD) of four biological replicates. Values of (c,d) are expressed with three biological replicates. Bar graph denoted by the same letter were not significantly different according to Duncan’s multiple range test (p < 0.05). Control of (a,b) indicates LPS alone without treating plant extracts.
Metabolites 11 00585 g007
Figure 8. Correlation map between the relative abundance of the significantly different metabolites and the results of the antioxidant assay (ABTS and DPPH), and NO inhibition assay of the extracts of the different parts of P. orientalis. Each square indicates Pearson’s coefficient values (r). Red and blue represent positive (0 < r < 1.0) and negative (−1.0 < r < 0) correlations, respectively. *: p-value < 0.05.
Metabolites 11 00585 g008
Table 1. Information about the plant samples used in this study.
No.LabelingFamilySpeciesPartsNIBR Number
1Lar1LardizabalaceaeAkebia quinatastemNIBRGR0000433376
2Lar2LardizabalaceaeAkebia quinatafruitNIBRGR0000594502
3Ama1AmaryllidaceaeAllium tuberosumetc.NIBRGR0000612270
4Ama2AmaryllidaceaeAllium tuberosumleaf, stemNIBRGR0000612271
5Ama3AmaryllidaceaeAllium tuberosumundergroundNIBRGR0000612272
6Api1ApiaceaeAngelica dahuricainflorescenceNIBRGR0000612861
7Ara1AraliaceaeAralia cordatastemNIBRGR0000433525
8Ara2AraliaceaeAralia cordataleafNIBRGR0000594470
9Fag1FagaceaeCastanea crenatafruitNIBRGR0000612236
10Ran1RanunculaceaeCimicifuga heracleifoliaabovegroundNIBRGR0000433787
11Ran2RanunculaceaeCimicifuga heracleifoliaundergroundNIBRGR0000611752
12Com1CommelinaceaeCommelina communisstem, leaf, flower, fruitNIBRGR0000594517
13Ast1AsteraceaeDendranthema borealestem, leafNIBRGR0000612853
14Ast2AsteraceaeDendranthema indicumstem, leaf, inflorescenceNIBRGR0000423023
15Ela1ElaeagnaceaeElaeagnus umbellateleafNIBRGR0000433417
16Ela2ElaeagnaceaeElaeagnus umbellatebranchNIBRGR0000595364
17Ara3AraliaceaeEleutherococcus sessiliflorusbranchNIBRGR0000433533
18Ara4AraliaceaeEleutherococcus sessiliflorusinflorescenceNIBRGR0000594494
19Ara5AraliaceaeEleutherococcus sessiliflorusleafNIBRGR0000597039
20Cel1CelastraceaeEuonymus alatusbranchNIBRGR0000595199
21Lil1LiliaceaeLilium lancifoliumrootNIBRGR0000597653
22Lil2LiliaceaeLilium lancifoliumleaf, stemNIBRGR0000597655
23Lil3LiliaceaeLilium lancifoliumflowerNIBRGR0000610691
24Lil4LiliaceaeLilium lancifoliumleaf, stemNIBRGR0000616820
25Lau1LauraceaeLindera obtusilobabranchNIBRGR0000594799
26Lau2LauraceaeLindera obtusilobaleafNIBRGR0000595318
27Lau3LauraceaeMachilus thunbergiabranchNIBRGR0000433461
28Lau4LauraceaeMachilus thunbergialeafNIBRGR0000595768
29Lam1LamiaceaeMentha arvensisabovegroundNIBRGR0000612757
30Lam2LamiaceaeMentha arvensisundergroundNIBRGR0000612758
31Gra1GramineaeMiscanthus sinensisleaf, stemNIBRGR0000595747
32Pin1PinaceaePinus densiflorabranchNIBRGR0000433437
33Pin2PinaceaePinus densifloraleafNIBRGR0000597148
34Pla1PlantaginaceaePlantago asiaticaleaf, peduncleNIBRGR0000611706
35Cup1CupressaceaePlatycladus orientalisfruitNIBRGR0000433401
36Cup2CupressaceaePlatycladus orientalisbranchNIBRGR0000433615
37Cup3CupressaceaePlatycladus orientalisleafNIBRGR0000597151
38Sol1SolanaceaeSolanum nigrumleaf, stemNIBRGR0000433559
39Sol2SolanaceaeSolanum nigrumleaf, stem, inflorescenceNIBRGR0000433569
40Fab1FabaceaeSophora flavescensleafNIBRGR0000594794
41Fab2FabaceaeSophora flavescensleaf, stemNIBRGR0000594812
42Cuc1CucurbitaceaeTrichosanthes kirilowiileaf, stemNIBRGR0000594804
43Cuc2CucurbitaceaeTrichosanthes kirilowiifruitNIBRGR0000433378
44Cuc3CucurbitaceaeTrichosanthes kirilowiileafNIBRGR0000433567
45Cuc4CucurbitaceaeTrichosanthes kirilowiibranchNIBRGR0000433580
46Typ1TyphaceaeTypha orientalisleaf, stemNIBRGR0000595290
47Typ2TyphaceaeTypha orientalisinflorescenceNIBRGR0000597721
48Rut1RutaceaeZanthoxylum schinifoliumleafNIBRGR0000408953
49Rut2RutaceaeZanthoxylum schinifoliumbranchNIBRGR0000594990
50Rut3RutaceaeZanthoxylum schinifoliumfruitNIBRGR0000595216
Publisher’s Note: MDPI stays neutral with regard to jurisdictional claims in published maps and institutional affiliations.

