Article

Maternal Plasma Metabolic Profile Demarcates a Role for Neuroinflammation in Non-Typical Development of Children

1
Department of Public Health Sciences, School of Medicine, University of California Davis, Davis, CA 95616, USA
2
Medical Investigation of Neurodevelopmental Disorders (MIND) Institute, School of Medicine, University of California Davis, Sacramento, CA 95817, USA
3
Gangarosa Department of Environmental Health, Rollins School of Public Health, Emory University, Atlanta, GA 30322, USA
4
Department of Environmental Medicine and Public Health, Icahn School of Medicine at Mount Sinai, New York, NY 10029, USA
5
Department of Molecular Biosciences, School of Veterinary Medicine, University of California Davis, Davis, CA 95616, USA
*
Author to whom correspondence should be addressed.
Metabolites 2021, 11(8), 545; https://doi.org/10.3390/metabo11080545
Submission received: 3 July 2021 / Revised: 11 August 2021 / Accepted: 12 August 2021 / Published: 18 August 2021
(This article belongs to the Special Issue Metabolomics of Autism Spectrum Disorder)

Abstract

:
Maternal and cord plasma metabolomics were used to elucidate biological pathways associated with increased diagnosis risk for autism spectrum disorders (ASD). Metabolome-wide associations were assessed in both maternal and umbilical cord plasma in relation to diagnoses of ASD and other non-typical development (Non-TD) compared to typical development (TD) in the Markers of Autism risk in Babies: Learning Early Signs (MARBLES) cohort study of children born to mothers who already have at least one child with ASD. Analyses were stratified by sample matrix type, machine mode, and annotation confidence level. Dimensionality reduction techniques were used [i.e, principal component analysis (PCA) and random subset weighted quantile sum regression (WQSRS)] to minimize the high multiple comparison burden. With WQSRS, a metabolite mixture obtained from the negative mode of maternal plasma decreased the odds of Non-TD compared to TD. These metabolites, all related to the prostaglandin pathway, underscored the relevance of neuroinflammation status. No other significant findings were observed. Dimensionality reduction strategies provided confirming evidence that a set of maternal plasma metabolites are important in distinguishing Non-TD compared to TD diagnosis. A lower risk for Non-TD was linked to anti-inflammatory elements, thereby linking neuroinflammation to detrimental brain function consistent with studies ranging from neurodevelopment to neurodegeneration.

1. Introduction

Currently, approximately 1 in 54 children has been identified with Autism Spectrum Disorders (ASD) in the United States according to estimates from the CDC’s Autism and Developmental Monitoring (ADDM) Network [1]. Prevalence of ASD has been increasing in recent decades and estimates worldwide are highly variable [2]. ASD occurrence is higher in males [1], and in younger siblings of individuals diagnosed with ASD, at nearly 1 in 5 [3]. Often clinical diagnosis is not made in children before significant neurological symptoms are evident, thus there is an immediate need for early detection of processes that are altered and could be used as markers for risk and to potentially inform effective interventions to allow them to develop life to their fullest.
To fulfill this immediate need, metabolic profiling performed on readily-accessible body fluids, such as serum, plasma, blood, urine or saliva, is one of the most important techniques that provides a complete view of the metabolic status and uncovering metabolic perturbations in pathways [4,5,6] for diagnosis of many diseases [7], including metabolic disorders [8], motor neuron disease [9], Parkinson’s disease [10] and Alzheimer’s disease [11], as well as chemical toxicity and aging [12,13,14,15]. There are few studies to date that have examined pre- and peri-natal metabolic pathways in relation to later development of ASD [16,17,18], with limited insights isnto the link between key metabolites, their role in intermediary metabolism and recurrent risk in families affected by autism. To this end, in this study, we assessed the metabolome from 3rd-trimester maternal plasma and from umbilical cord plasma samples in association with clinical classification of ASD or non-typical development (Non-TD) compared to typical development (TD) in high-familial-risk younger siblings of children with ASD. We used a metabolome-wide association approach to assess single metabolites as well as dimensionality reduction techniques including principal component analysis (PCA) and the random subset implementation of weight quantile sum regression (WQSRS; [19,20]) to account for the large number of predictors in relation to the number of subjects. The aim was to provide a complete view of the status of intermediary metabolism with the potential of uncovering perturbations in metabolic pathways [5,6] associated with the diagnosis of ASD or classification of Non-TD.

2. Results

2.1. Participant Characteristics and Covariate Selection

Two-hundred and sixteen mother–child pairs provided a sample for at least one of the following timepoints: 1st trimester, 2nd trimester, 3rd trimester, and/or delivery. The current analysis included only those participants who contributed with either a 3rd-trimester plasma sample and/or a cord plasma sample at delivery (n = 209). A covariate-only model was used to identify covariates that differed across clinical classification (all 3 groups) based on a p-value less than 0.20. The covariates identified for inclusion in final models were child’s sex, gestational age at delivery (in weeks), and maternal body mass index (BMI) before pregnancy. Child’s race was also included in the final models. Participants missing any of these covariates or a final outcome (n = 10) were removed from further analyses. Table 1 shows the demographic characteristics of the final cohort with no missing covariates, and stratified by outcome group (n = 199). The final cohort included 115 children clinically classified as TD, 27 children classified as Non-TD, and 57 diagnosed as having ASD. Children with ASD were more likely to be male and had longer mean gestational age at delivery compared with children classified as TD. Mothers of children with Non-TD and ASD had higher mean pre-pregnancy BMI compared to mothers of TD children. Of the 199 participants, 184 contributed a 3rd-trimester plasma sample and 142 contributed a cord blood plasma sample.

2.2. Metabolomic Analyses

2.2.1. Full Feature Metabolome Set

After removing metabolites with less than 80% detection, the full feature set included annotated and unannotated metabolites, which ranged from 4553 to 6278 metabolites depending on the sample matrix and mode of the LC/HRMS (Supplementary Materials Figures and Tables summarize the outcomes and statistical analysis derived from each matrix and mode).
In initial analyses, we constructed discrete logistic models following a metabolome-wide association study (MWAS)-type analysis to evaluate associations between individual metabolites and diagnostic status, while controlling for covariates described previously. For each mode (positive and negative), measured from both maternal and cord plasma samples, there were many unannotated features identified in single-metabolite models that either significantly increase or decrease the association with risk of ASD and Non-TD compared to TD while controlling for child’s sex and race, gestational age in weeks, and mother’s pre-pregnancy BMI (Figures S1–S4). For all associations, none remained significant after correcting for multiple comparisons.
Next, we used PCA to identify PCs that explain the variance within the metabolite data. Using metabolites identified from the positive mode of maternal plasma, the mean PC13 score was significantly lower in ASD children compared to TD while controlling for covariates (Figure S5a). The top ten contributing components are displayed in Figure S5b; however, as not one of them is annotated, their present biological significance remains unknown. From PCA of metabolites from the negative mode of maternal plasma, we found that PC1, PC6, and PC12 were significantly different between ASD and TD and/or Non-TD and TD (Figure S6a) with the top contributing components displayed in Figure S6b. Two of the top 10 components from PC1 were also identified as significantly related to a decrease in odds of Non-TD in single-metabolite analyses (palmitic acid and linoleic acid). Glutamine was the only annotated metabolite that was a top component of PC12. All other top 10 components for PC1, PC6 and PC12 were unannotated and thus their biological significance is unknown. No PCs were identified as being significantly different using the PCA of metabolites identified from positive mode cord plasma (results not shown). Lastly, from the PCA of metabolites identified from negative mode cord plasma, we identified PC12 as having a mean score significantly higher in children with ASD compared to TD (Figure S7a) with the top contributing components displayed in Figure S7b. Similar to the other significant PCs indicated above, none of the top 10 components were annotated.
As an alternative dimensionality reduction strategy to the PCA, we employed a supervised technique to identify the effect of a single index composed of all metabolites on diagnosis while controlling for covariates. By using this index, we can identify which metabolites most heavily weigh the effect if the index is significantly related to the outcome. For the metabolites identified in the positive mode of maternal plasma, there were no associations between the index and either outcome (p-values range between 0.10 and 0.37). For metabolites identified in the negative mode of maternal plasma, the mixture was significantly reduced in Non-TD compared to TD [Odds Ratio (OR) = 0.31, 95% Confidence Interval (CI) = 0.10–0.93] such that for every one unit increase in the mixture index, the odds of being Non-TD were 0.31 times the odds of being TD. The top 10 weight components of this mixture effect are displayed in Table S2. Other negative mode plasma indices were not significantly related to diagnosis (p-values range between 0.19 and 0.87; Table S3). The indices of metabolites identified from both the positive and negative modes of cord plasma were not significantly associated with either outcome (p-values range between 0.30 and 0.98; Table S3).

2.2.2. Annotated Metabolome Set

The confidence level 1 annotated subset included between 37 and 43 metabolites with at least 80% detection, reducing the number of comparisons compared to the full feature set (Table S1 summarizes the measures derived from each matrix and mode).
Like the full feature set, discrete logistic single-metabolite models, controlling for child’s sex and race, gestational age in weeks, and mother’s pre-pregnancy BMI, were analyzed for the annotated-only subsets. Four annotated metabolites detected in the positive mode of maternal plasma increased risk of ASD (O-phosphoethanolamine, indole, betaine, and serine) and four metabolites (N-acetylglutamic acid, citrulline, acetylcarnitine, and cystathionine) decreased the risk of Non-TD while controlling for covariates; however, none of these associations remained significant after adjusting for multiple comparisons (Table S4; Figure S8). In single-metabolite models from the negative mode of maternal plasma, two metabolites, norvaline and mevalonic acid, significantly increased the risk of ASD compared to TD (OR [95% CI]: 1.53 [1.07–2.26] and 1.68 [1.09–2.76], respectively). Eleven metabolites significantly decreased the risk of being diagnosed as Non-TD compared to TD (ORs ranging from 0.28 to 0.64), and one metabolite, gulonolactone, increased the risk of Non-TD (OR [95% CI]: 2.70 [1.18–7.57]). Eight of these metabolites continued to be significantly negatively associated with Non-TD after FDR correction (Table 2; Figure S9).
One annotated metabolite in the positive mode of cord plasma significantly decreased the risk of ASD, two metabolites significantly decreased the risk of Non-TD, and one metabolite significantly increased the risk of ASD and Non-TD each compared to TD (Table S5; Figure S10). One metabolite identified in the negative mode of cord plasma significantly decreased the risk of Non-TD compared to TD. However, none of these associations from cord plasma, regardless of mode, remained significant after FDR correction (Table S6; Figure S11).
PCA was run on the annotated-only set and mean PC scores were compared between diagnostic groups while controlling for covariates. Mean scores of PC2, PC8, and PC13, identified from the PCA of metabolites in the positive mode of plasma were considered significantly different for ASD, Non-TD or both compared to TD (Figure S12a). Specifically, PC2 and PC13 were significantly associated with Non-TD (NT) compared to TD (β = 0.88, p = 0.017 and β = 0.55, p = 0.019, respectively), while PC8 was significantly associated with ASD compared to TD (β = 0.41, p = 0.052). Components with high contributions tended to overlap with metabolites identified in single-metabolite models (Figure S12b; see Table S3 for comparison). The mean score of PC1 and PC8, identified from the PCA of metabolites in the negative mode of plasma, were significantly different between Non-TD and TD (β = −2.16, p = <0.001 and β = 0.60, p = 0.017, respectively; Figure S13a). Top contributing components are displayed for each PC (Figure S13b). The mean scores of PC4, PC5, and PC11, identified from the PCA of metabolites in the positive mode of cord plasma, were significantly different between Non-TD and TD (β = −0.98, p = 0.010; β = 0.76, p = 0.046; and β = −0.61, p = 0.050, respectively; Figure S14a). Top contributing components are displayed for each PC (Figure S14b). Lastly, the mean score of PC6, derived from PCA of metabolites in the negative mode of cord plasma, was significantly reduced in Non-TD compared to TD (β = −1.16, p = 0.001; Figure S15a) with the top contributing components of PC6 being displayed in Figure S15b.
WQSRS was used to estimate weights with only the subset of annotated features and the association between the weighted index and each diagnostic group, controlling for covariates, was tested. The WQSRS indices, using metabolites from the positive mode of plasma, were not significantly associated with either diagnostic group (p-values range from 0.28–0.94; Table S7). Although no WQSRS indices of metabolites from the negative mode of maternal plasma were significantly related to either outcome, there was a negative trend between the mixture and Non-TD (OR = 0.56, 95% CI = 0.30–1.04) and the top ten weight components are displayed in Table S6. For other indices, p-values ranged from 0.62–0.92. Lastly, no WQSRS indices of metabolites from cord plasma, regardless of mode, were significantly associated with either diagnostic group (p-values range from 0.26–0.78; Table S7). Models assessing metabolites from positive cord plasma on risk of NT did not converge (not shown).

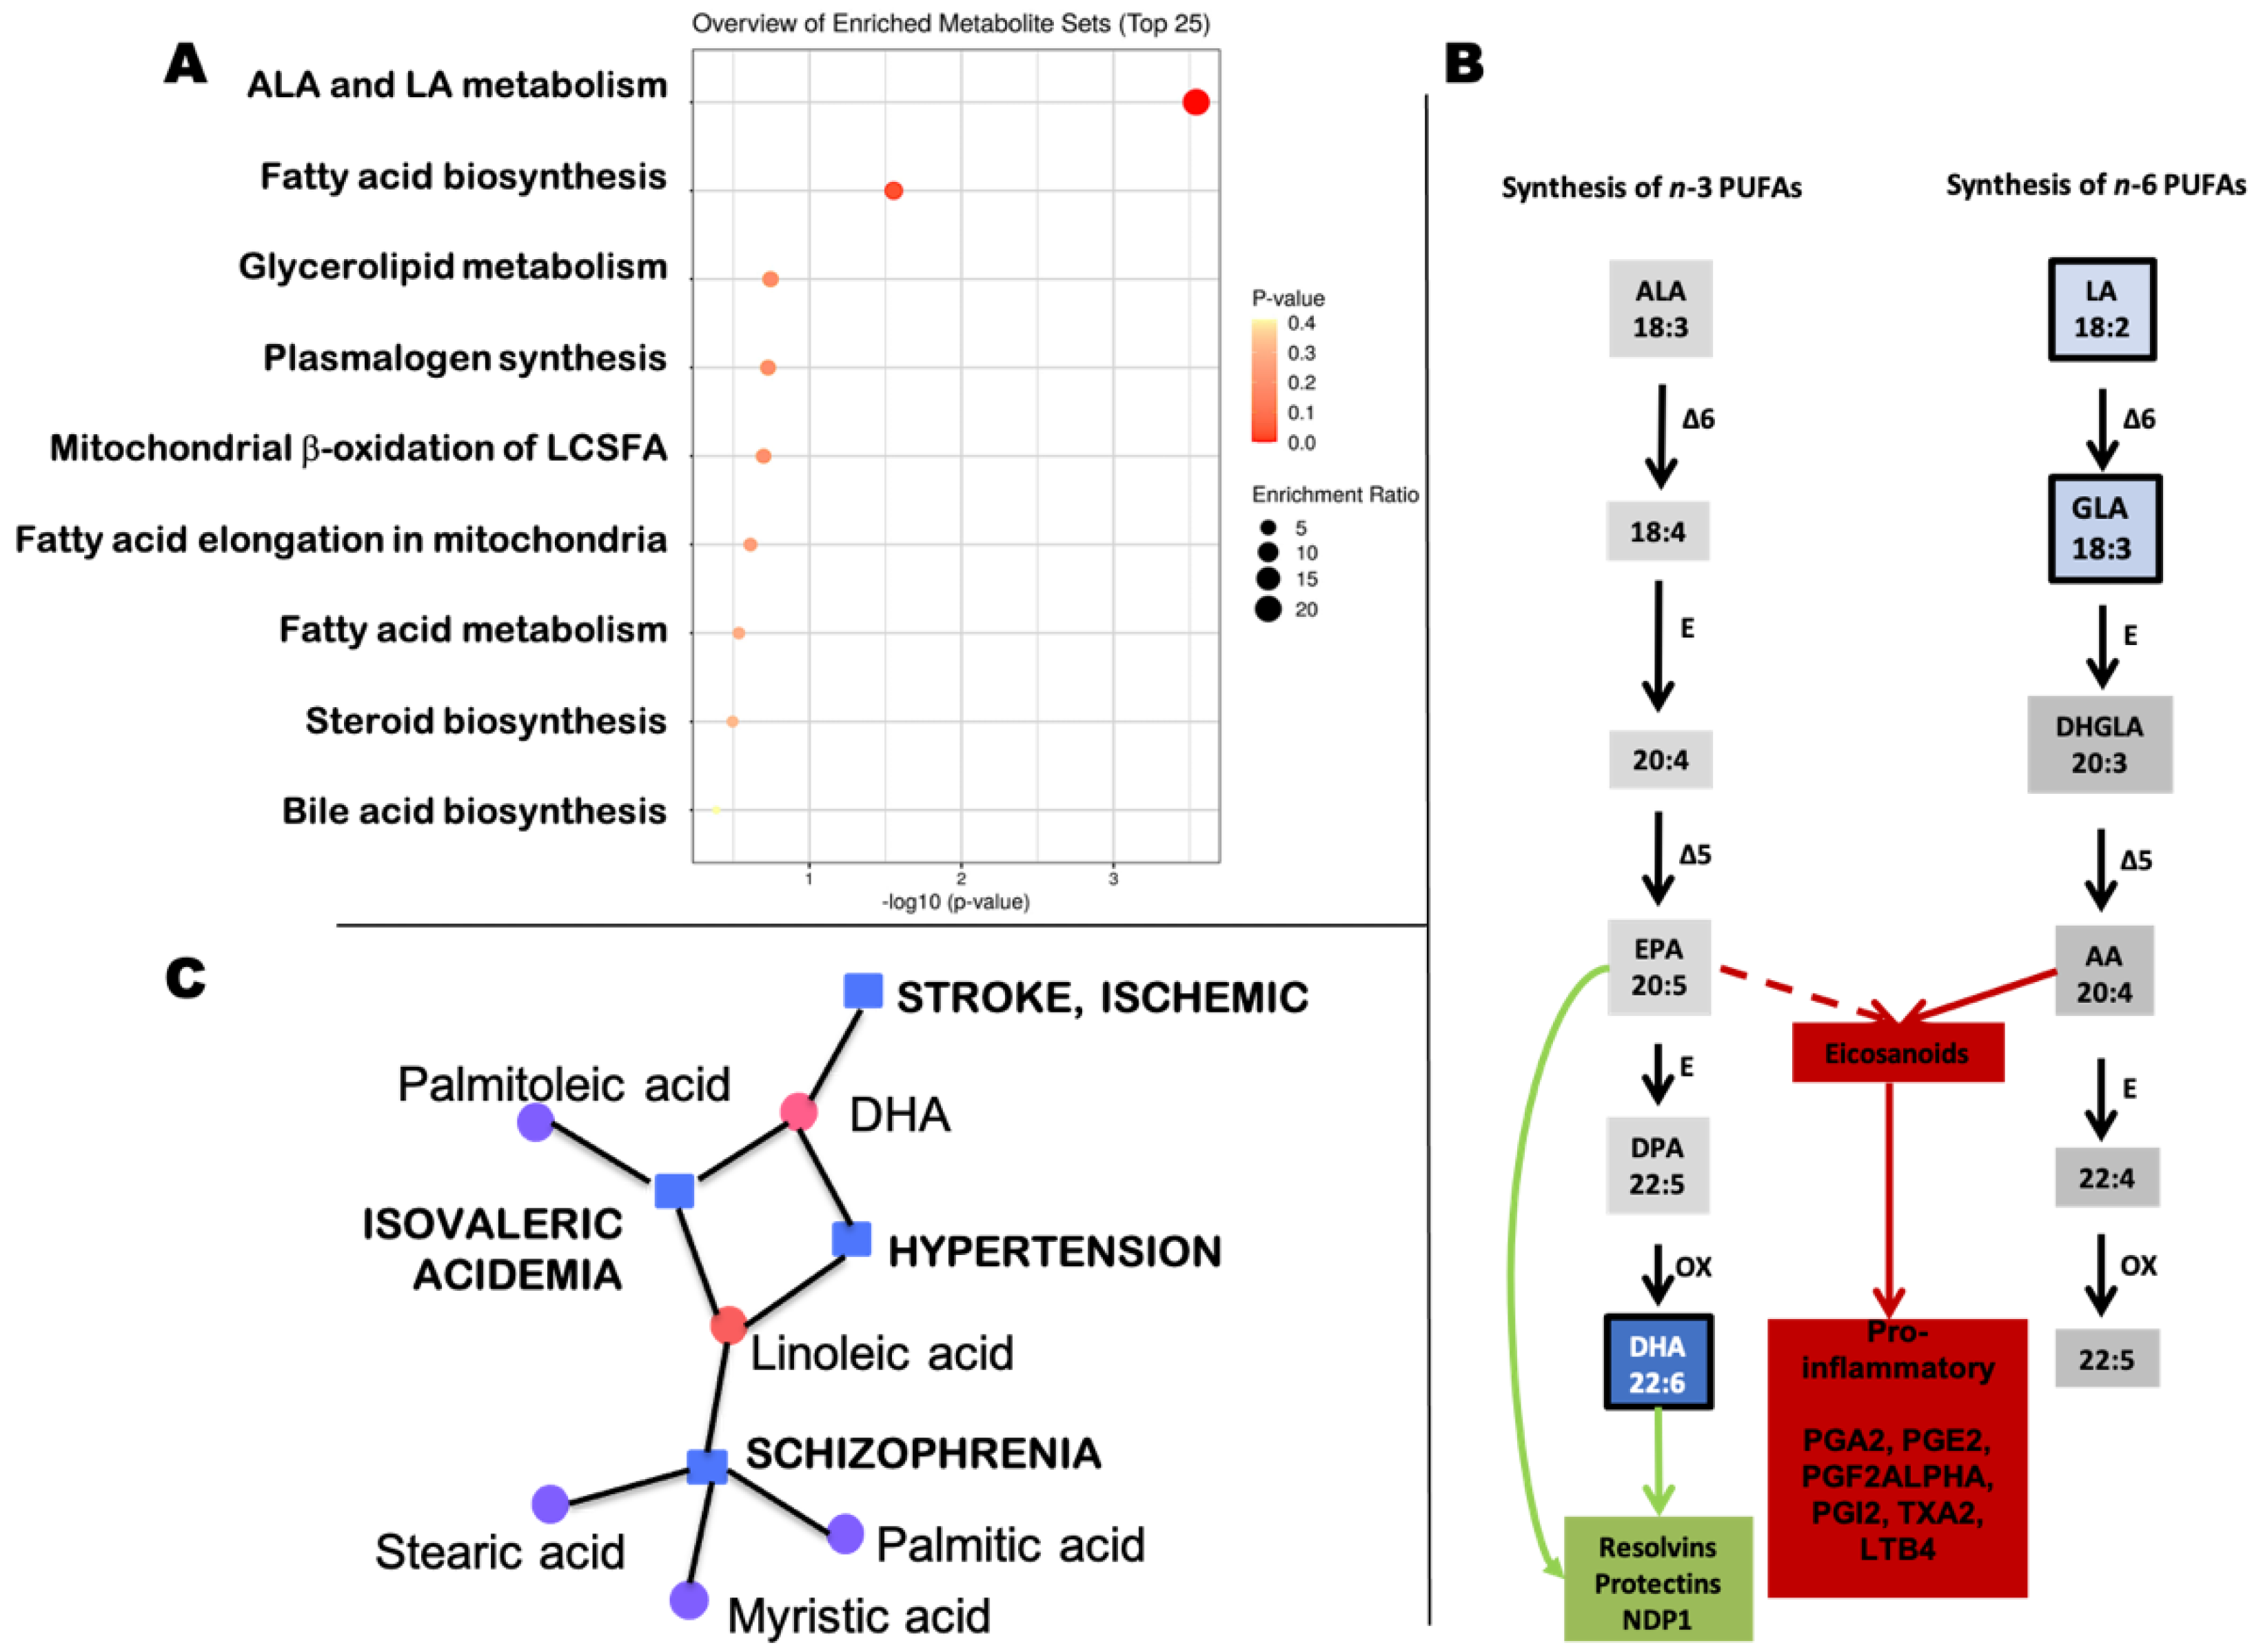
2.3. Fatty Acids in Prostaglandin Pathways

Seven metabolites identified in the negative mode of maternal plasma—after adjusting for baby’s sex, maternal pre-pregnancy BMI, gestational age and race (Table 2)—significantly decreased the risk of Non-TD compared to TD. Five of these metabolites are part of the biosynthesis of unsaturated fatty acids, and more specifically the pathway that includes ALA and linoleic acids (Figure 1A; FDR = 0.0281). While both pathways, the one that starts with ALA (prostaglandins series-3) and the one that starts with linoleic acid (prostaglandins series-2), may generate eicosanoids leading to proinflammatory prostaglandins, the former also gives rise to less proinflammatory mediators such as resolvins, protectins and NDP1 (i.e., oxylipins [21]; Figure 1B). It has been demonstrated that an imbalance in the ratio of n-6/n-3 PUFAs during early developmental stages may result in metabolic reprogramming, thereby influencing the susceptibility of adults to diverse diseases [22]. To this end and to visualize the impact of the differential metabolites in these two pathways, we plotted their predictive value on their activation (Figure 1B). The comparison of the average OR of the n-3 series (LA and GLA) vs. that of the n-6 series (DHA) showed a more important role in the Non-TD risk for DHA than that of those in the n-3 series, suggesting that a balance between pro- and less inflammatory compounds are relevant for the risk of Non-TD. Moreover, when a metabolite–disease network analysis was performed with the 7 metabolites from Table 2, two conditions related to developmental delay, speech delay, and disruptive behavior showed significance, i.e., schizophrenia (degree of 4 and betweenness of 21) and isovaleric acidemia (degree of 3 and betweenness of 13; Figure 1C).

3. Discussion

We face many challenges if we are to more fully understand the biological factors that affect ASD and/or Non-TD risk within natural populations. First, despite major advances in our understanding of the molecular basis of ASD, we are still far from a comprehensive understanding of the causal mechanisms, both molecular and environmental, which influence ASD risk and morbidity. ASD, as a spectrum disorder, may present as an isolated set of symptoms or with multiple comorbidities (e.g., intellectual disability, developmental delay, epilepsy, gastrointestinal complications, cardiac problems, and immune disorders [23]) with a broad heterogeneity that is still apparent even in the settings of identical genetic backgrounds (e.g., monozygotic twins discordant for co-morbidities), underscoring the complexity of understanding ASD on the molecular level. Despite this, it is clear that ASD has heritable component intertwined with non-heritable ones (shared environment) with siblings of ASD subjects usually having a ten-fold higher than population average risk of developing ASD themselves [3]. Further, concordance between monozygotic twins ranges from 30% to 99%, and the overall heritability is estimated between 0.5 and 0.8 [24,25,26,27,28]. The overarching challenge has been that despite measures of heritability pointing to a strong genetic component for ASD as it is for most complex traits in human populations, the failure to find causative alleles for traits that often have a high heritability is part of the larger ‘missing heritability’ problem in humans, where the sum of all the genetic effects associated with highly heritable traits is typically far less than the heritability measured (reviewed in [29]). This is further illustrated by GWAS which usually can explain only a small fraction of that heritability [30,31], leading to the aforementioned ‘missing heritability’ problem. One common hypothesis is that this shortfall is due to traits being shaped by many common alleles with effect size too small to detect and by large-effect alleles that are too rare to detect [32]. Second, and connected with the previous point, the environment can have a significant effect on ASD risk, but determining the specific impact of slight changes in the environment, as well as gene-by-environment interactions, on ASD risk has proven difficult [33,34,35]. This has shifted the focus to find significant ASD-associated transcriptome differences across genes in tissues not necessarily related to CNS that may capture some of the variance of the ASD phenotype [36,37,38,39,40,41,42,43,44,45]. However, growing evidence suggests mRNA levels do not capture all variance in phenotypes because they do not necessarily correlate with protein expression levels [46,47], reinforcing the need to highlight that proteins make up the enzymes that catalyze different biological reactions, and metabolites that are the building blocks of structural elements and biochemical pathways and act as modulators of metabolic fluxes at key rate-limiting steps. These challenges suggest that examining genes and genetic variation alone may not provide a complete picture of the molecular mechanisms that influence ASD risk. Genes shape phenotypes by working through a complex network of various molecular (‘omic’) domains that exist between genotype and phenotype. Then, investigating these functional molecular domains will help elucidate the causal mechanisms of ASD as well as the endophenotypes because (specifically metabolites) capture variation seen not only in genes but also in the environment, thereby allowing us to understand the biological impact of the environment on ASD. In addition, the interaction between metabolites per se is critical for regulating the functions that maintain cellular homeostasis. By looking not only at changes in mean levels of metabolites but also in the way that abundances of these molecules correlate with one another in larger networks, we can generate new and potentially powerful hypotheses about ASD risk. Networks—such as the one shown in Figure 1C—consist of a set of ‘nodes’ (here, metabolites) connected to one another through “edges”. The edges in biological networks can be defined either by directional biochemical interactions (precursor-product link), nondirectional biochemical interactions (protein-protein interaction) or more commonly, by expression correlations (e.g., correlation of concentrations of two or more metabolites). From a network perspective, the critical changes that occur with ASD risk may not be changes in concentrations per se (i.e., removing or adding a node in the network), but rather changes in edges connecting different nodes. For example, one could imagine two metabolites that have the same concentrations in TD and ASD, but whose correlation changes with age or other conditions (e.g, diet; example [48]). Much of the literature on biomarkers of ASD and/or IDD has focused on the search for individual molecules, or statistical combinations of molecules, which are predictive of ASD-related morbidity or diagnosis [16,49,50,51,52,53,54,55,56,57,58,59,60,61,62,63,64,65,66,67,68,69,70,71,72,73,74,75,76,77,78,79,80,81,82,83,84,85,86,87]. However, few metabolomic studies have moved beyond individual, isolated biomarkers, focusing instead on metabolic pathway analysis, in which whole metabolic pathways are analyzed for significant changes. To cite a few examples, at the prenatal level, Ritz et al. [16] showed differences in several metabolic pathways, including glycosphingolipid biosynthesis and metabolism, N-glycan and pyrimidine metabolism, bile acid pathways and, importantly, C21-steroid hormone biosynthesis and metabolism in maternal mid-pregnancy serum samples from women residing in California and whose children later developed ASD. Nolin et al. [88] reported deficits in the serine biosynthetic pathway as a main source of anaplerosis for the Krebs’ cycle in amniotic fluids from women carrying a fetus with a FMR1 premutation vs. noncarriers. In ASD children, Xu et al. [50] reported altered taurine and hypotaurine, Phe, Arg, and Pro metabolism in both plasma and urine samples. Liang et al. [63] reported deficits in urinary amino acid or lipid metabolism as well as the Trp-kynurenine pathway in children with ASD. Metabolomic profiles of 30 healthy children, 15 with and without regression each, showed differences between typically developing and children with ASD involving mainly amino acid, lipid and nicotinamide metabolism with subtle differences between the two regression groups (Arg and Glu pathways) [70]. Through a targeted urine metabolomics of Lebanese children affected by autistic disorder, changes in Tyr, 2-hydroxybutyrate, creatine and Glu pathway were reported with implications for amino acids, carbohydrates and oxidative stress pathways [77]. Italian children with ASD showed urinary metabolites belonging to the Trp and purine metabolic pathways along with vitamin B6, riboflavin, aromatic amino acid biosyntheses, pantothenate and CoA, and pyrimidine metabolism [80]. Previous metabolomics analysis of plasma in children with ASD, Down syndrome, and idiopathic developmental delays compared to typically developing children found perturbation in one-carbon metabolism pathways for children with ASD and Down syndrome [72].
Deciphering entire pathways that are differentially regulated in ASD leads to new hypotheses about the underlying biological processes that may be influencing its development. In this light, our study focused on the evaluation of the biological products of proteins (metabolites) via global metabolomic profiling and connect them through a thorough networked biological pathway analysis. We suggest here that this approach can provide a more robust method to discover causal mechanisms underlying ASD risk. Here, using a non-targeted maternal and cord plasma metabolomics screening approach in a clinically well-characterized cohort of subjects, provided results indicating important insights. For the full feature set, dimensionality reduction strategies were useful in identifying metabolites related to diagnostic group compared to single-metabolite analyses which suffer from multiple comparisons. Single-metabolite analyses of annotated features subsets also suffered from the burden of multiple testing, although some metabolites remained significantly associated with diagnosis after applying the FDR correction. Although none of the annotated metabolites were significantly associated with ASD after FDR corrections, the four maternal metabolites most associated with increased ASD (O-phosphoethanolamine [89], indole [80,90], betaine [79,91], and serine [53,72,87,88,92,93,94]) were in pathways previously implicated in ASD etiology. Further, acetylcarnitine, one of the most associated maternal single metabolites for Non-TD (positive node), has also been previously identified as a metabolic marker of ASD [95].
Between the full feature and annotated-only sets, the findings consistently indicate that metabolites identified in the negative mode of maternal plasma were more often associated with a decreased risk of Non-TD compared to TD. Several metabolites were identified across all analysis strategies, providing further evidence of their importance. For example, the unsaturated fatty acids DHA, LA, GLA and palmitoleic and the saturated myristic, palmitic and stearic acids appear to be important for distinguishing diagnosis of Non-TD from TD in all analyses of metabolites identified in the negative mode from 3rd-trimester maternal plasma.
When these metabolites in maternal plasma were analyzed in terms of their biological relevance, several pathways were identified. Although it could be argued that plasma levels of metabolites do not represent those in brain, it is important to highlight that unesterified fatty acids readily cross the blood–brain barrier into the brain [96], representing the major peripheral form that mirrors PUFA metabolism in the brain. Additionally, several examples from the literature link changes in these fatty acids with diseases. It has been reported that decreases in red blood cells’ membrane PUFAs from subjects with schizophrenia correlates with the degree of demyelination in brain white matter [97]. Lower levels of free fatty acids were reported in post-mortem brain samples from subjects affected with unipolar and bipolar depression [98]; lower levels of oleic and arachidonic acids were observed in frontal cortex from subjects with Alzheimer’s disease [99] and with Parkinson’s disease [100], respectively.
Notably, the OR for Non-TD risk is lower in the n-3 series (DHA) vs. that of the n-6 series (LA, GLA). This finding is consistent with those reported in another study in which children with ADHD and ASD presented lower levels of EPA, DHA and arachidonic acid and high ratio of n-6/n-3 PUFAs and both of these ratios correlated significantly with behavioral scores (ATBRS, TOVA, CARS; [101]). This is highly relevant as n-3 PUFAs foster neuronal activity [102] counteracting memory deficits in aged mice [103], enhance mitochondrial function [104], increase the expression of glucose transporters GluT1/2 influencing neurotransmissions [105], ameliorate spatial memory in rats by increasing the expression of subtypes of endocannabinoid receptors [106], increase the expression of transcription factors involved in learning and memory [107], improves childhood neurodevelopment [108], and increase brain function and decreased tau phosphorylation in a mouse model of Alzheimer’s disease with enhanced endogenous production of n-3 PUFA [109].
Neuroinflammation is recognized as the inflammatory reaction occurring in the central and peripheral nervous systems, primarily caused by environmental pollutants and toxicants, trauma, and autoimmune responses, among others [110] and the occurrence of various neurological diseases is closely related to neuroinflammation [111]. Consistent with this view, an increased pro-inflammatory status seemed to increase the Non-TD risk as more pro-inflammatory prostaglandins are generated by the n-6 series than those from the n-3 series [112] (Figure 1B). In this regard, PGE2 in neural injury in Alzheimer’s disease is well documented, and includes modulation of protein-lipid interactions, trans-membrane and trans-synaptic signaling [113]. Moreover, PGE2 levels in CSF have been identified as one of the key pathways linked to Alzheimer’s disease severity [114]: PGE2 is higher in patients with mild memory impairment, but lower in those with more advanced Alzheimer’s disease [115]. Two recent reviews [116,117] highlight the role of inflammatory mediators (including prostaglandins), and as an extension that of neuroinflammation, on the development of an altered mother–child immune crosstalk during pregnancy which is critical for atypical neurodevelopment. Inflammatory mediators can alter not only critical functions of neurons and glia directly, but also affect the selective permeability of the blood–brain barrier providing a mechanistic link to altered brain development as well as the occurrence of epilepsy in ASD [118]. Therefore, appropriate interventions that control immune responses during pregnancy may have a positive impact on decreasing autism diagnosis risk.
The significantly lower Non-TD risk with myristic, palmitic, stearic and palmitoleic acids deserves further discussion considering the role of these factors in axonogenesis, neuron differentiation, and carbohydrate utilization. Axonogenesis requires the de novo synthesis of monounsaturated fatty acids (such as palmitoleic acid) based on the evidence that brain-derived neurotrophic factor (BDNF) promotes both axonogenesis during brain development [119] while selectively increasing intracellular levels of palmitoleic acid and SCD1 [120], and that SCD-1 is highly expressed in axotomized neurons of the regenerating facial and hypoglossal nucleus [121]. More recently, a role for palmitoleic acid as an insulin-sensitizing lipokine has been proposed (although still controversial), suggesting that lower levels of this fatty acid may limit carbohydrate utilization. Although blood metabolite levels can change in response to diurnal/circadian hormonal levels, diet, stress, underlying (not diagnosed) conditions, among others [122,123,124,125,126,127], none of those identified as having a significant time-of-day variation were among those found to increase the OR of a Non-TD diagnosis (acylcarnitines, lysophospholipids, bilirubin, corticosteroids, and amino acids [127]. Further, in analysis for a subset of 175 with maternal samples, time since last meal or snack at the time of the blood draw, illnesses in the previous 48 h, and storage time did not differ across child outcomes, making these unlikely confounders. Future analyses should collect and control for these variables to rule out potential for residual confounding.
Metabolomics analysis may expedite additional diagnosis while allowing for the possibility to identify sources of phenotypic heterogeneity within the broad umbrella of Non-TD diagnosis. A strength of this study is in utilizing metabolomics to detect changes in a broad variety of metabolites that reflect the complexity of metabolic networks altered in Non-TD vs. TD. Future studies will need to assess the progression of changes in the identified pathways to shed light on the mechanisms contributing to the Non-TD morbidity. Future research should investigate maternal and neonatal metabolic changes in relation to upstream prenatal exposures, with a focus on those that are modifiable.

4. Materials and Methods

4.1. Study Design and Population

Mothers who have previously given birth to a child with autism spectrum disorder (ASD) were recruited into Markers of Autism risk in Babies: Learning Early Signs (MARBLES) [128] during pregnancy. Recruitment is primarily from lists of children receiving services for ASD through the California Department of Developmental Services in Northern California. The ASD of the older sibling is clinically confirmed. The younger-born siblings of children with ASD are at high familial risk for ASD and other Non-TD [3]. These analyses include additional participants at high familial risk due to the mother having multiple siblings diagnosed with ASD, but without an older ASD-diagnosed sibling. Blood samples were collected by certified phlebotomists during the 3rd trimester of pregnancy, and umbilical cord blood was collected at delivery. Samples were put on ice immediately, processed as soon as possible (within 4 h), and the plasma was stored at −80 °C until they were processed at Emory (only specimens without previous thaws were selected). The analytic sample for this study was derived from MARBLES-enrolled younger siblings who had a cord blood sample available and/or whose mothers had a 3rd-trimester EDTA plasma sample available, and who had received a final clinical assessment and outcome classification at 3 years old. The University of California, Davis Institutional Review Board and the California Committee for the Protection of Human Subjects approved this study and the MARBLES study protocols (IRB Protocol: 225645-70), which were conducted in accordance with the Helsinki’s guidelines. Neither data nor specimens were collected from children until written informed consent was obtained from their parents.

4.2. ASD and Non-TD Outcome Classification

Children were followed and assessed for ASD and other neurobehavioral and cognitive outcomes at 3 years of age at the MIND Institute. Development was assessed by trained, reliable examiners using the gold standard Autism Diagnostic Observation Schedule (ADOS) [129,130]. Cognitive function was measured with the Mullen Scales of Early Learning (MSEL) [131], which generates five subscale scores (gross motor, fine motor, expressive language, receptive language, and visual reception) and an overall early learning composite (ELC) score. Participants were classified into one of three outcome groups, ASD, typically developing (TD), and non-typically developing (Non-TD), based on a previously published algorithm that uses ADOS and MSEL scores [132,133] and that has shown good reliability, validity, and stability [134,135] for the ASD diagnosis at age 3 years in high-risk siblings of children with autism [133]. Children with ASD outcomes have scores over the ADOS cutoff and meet DSM-5 criteria for ASD. The Non-TD group was defined as children with low MSEL scores (i.e., two or more MSEL subscales that are more than 1.5 SD below average or at least one MSEL subscale that is more than 2 SD below average), elevated ADOS scores (i.e., within 3 points of the ASD cutoff), or both. Children classified as TD have all MSEL scores within 2.0 SD and no more than one MSEL subscale that is 1.5 SD below the normative mean and scores on the ADOS at least three or more points below the ASD cutoff [136]. Children classified as Non-TD or TD could develop other behavioral or neurodevelopmental abnormalities as they age [134].

4.3. Metabolomics Analysis

Metabolomic assays were run on plasma obtained from EDTA-supplemented blood samples from mothers during the 3rd trimester of pregnancy (maternal) and from cord blood (cord plasma) at delivery using liquid chromatography coupled with high-resolution mass spectrometry (LC/HRMS). Samples were analyzed in triplicate and metabolites were measured in hydrophobic interaction liquid chromatography (HILIC) Positive mode and C18 hydrophobic reverse-phase negative mode using established protocols [137,138]. For quality control purposes, at the beginning and end of each batch, we included two standards, NIST 19,501 and pooled human plasma (Equitech Bio). Raw data files were converted with ProteoWizard to mzML files using apLCMS and xMSanalyzer [139,140,141]. Metabolite annotations were scored according to criteria specified by the Metabolomics Standard Initiative (MSI) to denote the level of confidence in feature annotation [142]. Analyses were performed on the level 1 confidence subset in addition to the full feature set, stratified by HILIC positive and C18 reverse phase negative modes, herein referred to as positive and negative modes. Separate analyses were conducted for maternal and cord plasma samples. Metabolites with less than 80% detect were removed from further analyses. Missing values were replaced with the minimum of a specified metabolite divided by the square root of 2. To normalize across metabolites, values were log2 transformed and centered and scaled. Single-metabolite logistic regression models, with TD as the reference, were used to measure the effect of each metabolite on the diagnosis of ASD or Non-TD, respectively. Covariates were selected by testing a full covariate model with the multinomial outcome, keeping variables with a p-value less than 0.20. Final models were adjusted for child’s sex, child’s race (white or other), gestational age in weeks, and maternal body mass index (BMI) before pregnancy. To account for multiple comparisons, a false discovery rate (FDR) correction was applied to the raw p-values per stratum of sample matrix, mode, and feature set [143]. Metabolomic assays can result in hundreds to thousands of metabolites and as a result, adjusting for multiple comparisons in single-metabolite analyses can increase type I error. To reduce this burden, we employed unsupervised and supervised dimensionality reducing techniques. We employed an unsupervised approach, principal component analysis (PCA), to identify principal components (PCs) that explain the variability within the metabolite data. To evaluate the relevance of derived features to diagnostic status, PCs with an eigenvector >1 or >1% were isolated and examined in generalized linear models, controlling for the same covariates as previously described. For PCs with a mean score that significantly differed between ASD or Non-TD with respect to TD, the top contributing components are labeled either by their annotation; or, as their mass over charge ratio and retention time if the metabolite could not be annotated with confidence level 1. To test for the mixture effect of metabolites using a supervised dimensionality reduction technique, the random subset implementation of weighted quantile sum regression (WQSRS) was used [19]. This is a specialized application of WQS [20] which tests for a mixture effect among many components with complex correlations. Specifically, WQSRS is useful when the number of predictors is greater than the number of subjects, which is the case with metabolomic data that can include hundreds to thousands of metabolites. Similar to the single-metabolite analyses, mixture effects were tested on separate binomial models for ASD and Non-TD relative to TD and were stratified by mode, sample matrix, and annotation level. Annotated-only models were run with 1000 subsets with 6 metabolites per subset and full feature models were run with 30,000 subsets with 10 metabolites per subset. Additionally, mixture models were run with both a positive and negative constraint to see if there were both harmful and protective mixtures related to the disease outcomes. A positive constraint more highly weighs components in the mixture that increase risk, whereas the negative constraint more highly weighs components that decrease risk.

4.4. Statistical Analyses

An alpha of 0.05 was the criterion for statistical significance. Statistical analyses were conducted with SAS 9.4 and R version 3.5.2 using the, factoextra package for PCA analyses. All analyses relevant to biological processes were performed with MetaboAnalyst by utilizing the KEGG database and those related to diseases by utilizing OMIM.

Supplementary Materials

The following are available online at https://www.mdpi.com/article/10.3390/metabo11080545/s1, Figure S1: Volcano plot of maternal plasma full feature positive mode raw p-values in associations with risk of ASD (A) and Non-TD (B) compared to TD (6252 metabolites). Volcano plots with FDR-corrected p-values in associations with ASD (C) and Non-TD (D) are also provided, Figure S2: Volcano plot of maternal plasma full feature negative mode raw p-values in associations with risk of ASD (A) and Non-TD (B) compared to TD (4510 metabolites). Volcano plots with FDR-corrected p-values in associations with ASD (C) and Non-TD (D) are also provided, Figure S3: Volcano plot of cord plasma full feature positive mode raw p-values in associations with risk of ASD (A) and Non-TD (B) compared to TD (6276 metabolites). Volcano plots with FDR-corrected p-values in associations with ASD (C) and Non-TD (D) are also provided, Figure S4: Volcano plot of cord plasma full feature negative mode raw p-values in associations with risk of ASD (A) and Non-TD (B) compared to TD (4507 metabolites). Volcano plots with FDR-corrected p-values in associations with ASD (C) and Non-TD (D) are also provided, Figure S5: Results from principal component (PC) regression of diagnostic group on PCs identified using a PCA of full feature metabolites from the positive mode in maternal plasma, controlling for child’s sex, race, and gestational age in weeks, and maternal pre-pregnancy BMI (n = 184). (A) PC13 was significantly associated with ASD compared to TD (β = −4.16, p = 0.005). (B) Top contributing components of PC13 are shown below, Figure S6: Results from principal component (PC) regression of diagnostic group on PCs identified using a PCA of full feature metabolites from the negative mode of maternal plasma, controlling for child’s sex, race, and gestational age in weeks, and maternal pre-pregnancy BMI (n = 184). (A) PC1 was significantly associated with Non-TD compared to TD (β = −12.6, p = 0.001) and PC6 and PC12 were significantly associated with ASD compared to TD (β = 4.51, p = 0.020 and β = −2.89, p = 0.037). (B) Top contributing components of PC1 and PC6 are shown below, Figure S7: Results from principal component (PC) regression of diagnostic group on PCs identified using a PCA of full feature metabolites from the negative mode in cord plasma, controlling for child’s sex, race, and gestational age in weeks, and maternal pre-pregnancy BMI (n = 142). (A) PC12 was significantly associated with ASD compared to TD (β = 2.77, p = 0.045). (B) Top contributing components of PC12 are shown below. The dotted red line indicated the threshold 1/p where p is the number of predictors, Figure S8: Volcano plots of annotated metabolites identified from the positive mode of maternal plasma with raw p-values in associations with ASD (A) and Non-TD (B) compared to TD and FDR-corrected p-values in associations with ASD (C) and Non-TD (D) diagnoses, Figure S9: Volcano plots of annotated metabolites identified from the negative mode of maternal plasma with raw p-values in associations with ASD (A) and Non-TD (B) compared to TD and FDR-corrected p-values in associations with ASD (C) and Non-TD (D) diagnoses, Figure S10: Volcano plots of annotated metabolites identified from the positive mode of cord plasma with raw p-values in associations with ASD (A) and Non-TD (B) compared to TD and FDR-corrected p-values in associations with ASD (C) and Non-TD (D) diagnoses, Figure S11: Volcano plots of annotated metabolites identified from the negative mode of cord plasma with raw p-values in associations with ASD (A) and Non-TD (B) compared to TD and FDR-corrected p-values in associations with ASD (C) and Non-TD (D) diagnoses, Figure S12: Results from principal component (PC) regression of diagnostic group on PCs identified from a PCA of annotated metabolites from the positive mode in maternal plasma, controlling for child’s sex, race, and gestational age in weeks, and maternal pre-pregnancy BMI (n = 142). PC2 and PC13 were significantly associated with Non-TD compared to TD (β = 0.88, p = 0.017 and β = 0.55, p = 0.019, respectively). (A) PC8 was significantly associated with ASD compared to TD (β = 0.41, p = 0.052). (B) Top contributing components of PC2, PC8, and PC13 are shown below, Figure S13: Results from principal component (PC) regression of diagnostic group on PCs identified from a PCA of annotated metabolites from the negative mode of maternal plasma, controlling for child’s sex, race, and gestational age in weeks, and maternal pre-pregnancy BMI. (A) PC1 and PC8 were significantly associated with Non-TD compared to TD (β = −2.16, p ≤ 0.001 and β = 0.60, p = 0.017, respectively). (B) Top contributing components of PC1 and PC8 are shown below, Figure S14: Results from principal component (PC) regression of diagnostic group on PCs from a PCA of annotated metabolites from the positive mode of cord plasma, controlling for child’s sex, race, and gestational age in weeks, and maternal pre-pregnancy BMI. (A) PC4, PC5, and PC11 were significantly associated with Non-TD compared to TD (β = −0.98, p = 0.010; β = 0.76, p = 0.046; and β = −0.61, p = 0.050, respectively). (B) Top contributing components of PC4 and PC5 are shown below, Figure S15: Results from principal component (PC) regression of diagnostic group on PCs from a PCA of annotated metabolites from the negative mode of cord plasma, controlling for child’s sex, race, and gestational age in weeks, and maternal pre-pregnancy BMI. (A) PC6 was significantly associated with Non-TD compared to TD (β = −1.16, p = 0.001). (B) Top contributing components of PC6 are shown below, Table S1: Number of metabolites identified within each matrix and mode after removing metabolites with <80% detection, Table S2: Odds Ratios (OR) and 95% Confidence Intervals (CI) from WQSRS regression of Non-TD and the full feature negative maternal plasma metabolite mixture, controlling for child’s sex, race, and gestational age in weeks, and maternal pre-pregnancy BMI (n = 184). 30,000 subsets with 10 metabolites per subset were used to estimate weights of each metabolite, Table S3: Selected results from significant (p < 0.05) single-metabolite analyses of log2-transformed, centered, and scaled single metabolite using annotated metabolites identified from the positive mode in maternal plasma (40 metabolites), in discrete logistic models comparing odds of ASD or odds of Non-TD, with TD used as the reference category in each case associated with a 2-fold change in the standardized abundance of a given metabolomic feature, controlling for child’s sex, race, and gestational age in weeks, and maternal pre-pregnancy BMI (n = 184), Table S4: Selected results from significant (p < 0.05) single-metabolite analyses of log2-transformed, centered, and scaled single metabolite using annotated metabolites identified from the positive mode in maternal plasma (40 metabolites), in discrete logistic models comparing odds of ASD or odds of Non-TD, with TD used as the reference category in each case associated with a 2-fold change in the standardized abundance of a given metabolomic feature, controlling for child’s sex, race, and gestational age in weeks, and maternal pre-pregnancy BMI (n = 184), Table S5: Selected results from significant (p < 0.05) single-metabolite analyses of log2-transformed, centered, and scaled single-metabolite analyses of annotated metabolites from the positive mode in cord plasma (37 metabolites), in discrete logistic models comparing odds of ASD or odds of Non-TD with TD used as the reference category in each case associated with a 2-fold change in the standardized abundance of a given metabolomic feature, controlling for child’s sex, race, and gestational age in weeks, and maternal pre-pregnancy BMI (n = 142), Table S6: Selected results from significant (p < 0.05) single-metabolite analyses of log2-transformed, centered, and scaled single-metabolite analyses using annotated metabolites identified from the negative mode in cord plasma (42 metabolites), in discrete logistic models comparing odds of ASD or odds of Non-TD with TD used as the reference category in each case associated with a 2-fold change in the standardized abundance of a given metabolomic feature, controlling for child’s sex, race, and gestational age in weeks, and maternal pre-pregnancy BMI (n = 142), Table S7: Results from rsWQS for each mode/matrix, outcome, and constraint using the annotated set of metabolites. Results are not reported for NT vs. TD for both constraints using metabolites identified in positive cord blood due to poor model fit, Table S8: Results from WQSRS regression of Non-TD and the annotated negative maternal plasma metabolite mixture controlling for child’s sex, race, and gestational age in weeks, and maternal pre-pregnancy BMI (n = 184). 5000 subsets with 6 metabolites per subset were used to estimate weights of each metabolite. The top 10 metabolites with the highest weight contributions, representing 69.7% of the overall index, are displayed.

Author Contributions

Conceptualization, R.J.S. and C.G.; methodology, D.L.; formal analysis, C.G., P.C. and S.A.B.; data resources, R.J.S. and D.L.; data curation, D.L.; writing—original draft preparation, C.G.; writing—review and editing, C.G., R.J.S., D.L., P.C. and S.A.B.; funding acquisition, C.G. and R.J.S. All authors have read and agreed to the published version of the manuscript.

Funding

Research reported in this publication was supported by the National Institute of Environmental Health Sciences of the National Institutes of Health under Award Numbers U2CES026560 and U2CES026555 through the Children’s Health Exposure Analysis Resource (CHEAR). This work has also been supported by NIH grants R01ES025574 and R21HD086769. The MARBLES Study has been supported by EPA STAR grant #RD-833292, and NIH grants: R24ES028533, R01ES028089, R01ES020392, R01ES025574, P01ES011269. The content is solely the responsibility of the authors and does not necessarily represent the official views of the National Institutes of Health.

Institutional Review Board Statement

The study was conducted according to the guidelines of the Declaration of Helsinki, and the University of California (UC) Davis Institutional Review Board (Protocol No. 225645) and the State of California Committee for the Protection of Human Subjects approved this study and the MARBLES Study protocols.

Informed Consent Statement

Neither data nor specimens were collected until written informed consent was obtained from the parents. Written informed consent has been obtained from the participant(s) to publish this paper.

Data Availability Statement

De-identified metabolomics data generated through this work are available through NDAR and CHEAR/HHEAR.

Acknowledgments

We wish to thank all subjects who participated in this study.

Conflicts of Interest

The funders (NIH, EPA) had no role in the design of the study; in the collection, analyses, or interpretation of data; in the writing of the manuscript, or in the decision to publish the results. The authors declare no conflict of interest declare no real or perceived conflict of interest.

References

  1. Maenner, M.J.; Shaw, K.A.; Baio, J. Prevalence of Autism Spectrum Disorder Among Children Aged 8 Years—Autism and Developmental Disabilities Monitoring Network, 11 Sites, United States, 2016. MMWR Surveill. Summ. 2020, 69, 1–12. [Google Scholar] [CrossRef] [PubMed]
  2. Chiarotti, F.; Venerosi, A. Epidemiology of Autism Spectrum Disorders: A Review of Worldwide Prevalence Estimates Since 2014. Brain Sci. 2020, 10, 274. [Google Scholar] [CrossRef]
  3. Ozonoff, S.; Young, G.S.; Carter, A.; Messinger, D.; Yirmiya, N.; Zwaigenbaum, L.; Bryson, S.; Carver, L.J.; Constantino, J.N.; Dobkins, K.; et al. Recurrence risk for autism spectrum disorders: A Baby Siblings Research Consortium study. Pediatrics 2011, 128, e488–e495. [Google Scholar] [CrossRef] [PubMed] [Green Version]
  4. Werner, E.; Heilier, J.F.; Ducruix, C.; Ezan, E.; Junot, C.; Tabet, J.C. Mass spectrometry for the identification of the discriminating signals from metabolomics: Current status and future trends. J. Chromatogr. B Anal. Technol. Biomed. Life Sci. 2008, 871, 143–163. [Google Scholar] [CrossRef] [PubMed]
  5. Werner, E.; Croixmarie, V.; Umbdenstock, T.; Ezan, E.; Chaminade, P.; Tabet, J.C.; Junot, C. Mass spectrometry-based metabolomics: Accelerating the characterization of discriminating signals by combining statistical correlations and ultrahigh resolution. Anal. Chem. 2008, 80, 4918–4932. [Google Scholar] [CrossRef]
  6. Goodacre, R.; Vaidyanathan, S.; Dunn, W.B.; Harrigan, G.G.; Kell, D.B. Metabolomics by numbers: Acquiring and understanding global metabolite data. Trends Biotechnol. 2004, 22, 245–252. [Google Scholar] [CrossRef]
  7. German, J.B.; Hammock, B.D.; Watkins, S.M. Metabolomics: Building on a century of biochemistry to guide human health. Metabolomics 2005, 1, 3–9. [Google Scholar] [CrossRef]
  8. Wang, C.; Kong, H.; Guan, Y.; Yang, J.; Gu, J.; Yang, S.; Xu, G. Plasma phospholipid metabolic profiling and biomarkers of type 2 diabetes mellitus based on high-performance liquid chromatography/electrospray mass spectrometry and multivariate statistical analysis. Anal. Chem. 2005, 77, 4108–4116. [Google Scholar] [CrossRef]
  9. Rozen, S.; Cudkowicz, M.E.; Bogdanov, M.; Matson, W.R.; Kristal, B.S.; Beecher, C.; Harrison, S.; Vouros, P.; Flarakos, J.; Vigneau-Callahan, K.; et al. Metabolomic analysis and signatures in motor neuron disease. Metabolomics 2005, 1, 101–108. [Google Scholar] [CrossRef] [Green Version]
  10. Scherzer, C.R.; Eklund, A.C.; Morse, L.J.; Liao, Z.; Locascio, J.J.; Fefer, D.; Schwarzschild, M.A.; Schlossmacher, M.G.; Hauser, M.A.; Vance, J.M.; et al. Molecular markers of early Parkinson’s disease based on gene expression in blood. Proc. Natl. Acad. Sci. USA 2007, 104, 955–960. [Google Scholar] [CrossRef] [Green Version]
  11. Barba, I.; Fernandez-Montesinos, R.; Garcia-Dorado, D.; Pozo, D. Alzheimer’s disease beyond the genomic era: Nuclear magnetic resonance (NMR) spectroscopy-based metabolomics. J. Cell Mol. Med. 2008, 12, 1477–1485. [Google Scholar] [CrossRef] [Green Version]
  12. Boudonck, K.J.; Mitchell, M.W.; Nemet, L.; Keresztes, L.; Nyska, A.; Shinar, D.; Rosenstock, M. Discovery of metabolomics biomarkers for early detection of nephrotoxicity. Toxicol. Pathol. 2009, 37, 280–292. [Google Scholar] [CrossRef] [PubMed] [Green Version]
  13. Boudonck, K.J.; Rose, D.J.; Karoly, E.D.; Lee, D.P.; Lawton, K.A.; Lapinskas, P.J. Metabolomics for early detection of drug-induced kidney injury: Review of the current status. Bioanalysis 2009, 1, 1645–1663. [Google Scholar] [CrossRef]
  14. Lawton, K.A.; Berger, A.; Mitchell, M.; Milgram, K.E.; Evans, A.M.; Guo, L.; Hanson, R.W.; Kalhan, S.C.; Ryals, J.A.; Milburn, M.V. Analysis of the adult human plasma metabolome. Pharmacogenomics 2008, 9, 383–397. [Google Scholar] [CrossRef]
  15. Sreekumar, A.; Poisson, L.M.; Rajendiran, T.M.; Khan, A.P.; Cao, Q.; Yu, J.; Laxman, B.; Mehra, R.; Lonigro, R.J.; Li, Y.; et al. Metabolomic profiles delineate potential role for sarcosine in prostate cancer progression. Nature 2009, 457, 910–914. [Google Scholar] [CrossRef] [PubMed] [Green Version]
  16. Ritz, B.; Yan, Q.; Uppal, K.; Liew, Z.; Cui, X.; Ling, C.; Inoue, K.; von Ehrenstein, O.; Walker, D.I.; Jones, D.P. Untargeted Metabolomics Screen of Mid-pregnancy Maternal Serum and Autism in Offspring. Autism Res. 2020, 13, 1258–1269. [Google Scholar] [CrossRef]
  17. Frye, R.E.; Slattery, J.C.; Quadros, E.V. Folate metabolism abnormalities in autism: Potential biomarkers. Biomark. Med. 2017, 11, 687–699. [Google Scholar] [CrossRef] [Green Version]
  18. Jones, K.L.; Croen, L.A.; Yoshida, C.K.; Heuer, L.; Hansen, R.; Zerbo, O.; DeLorenze, G.N.; Kharrazi, M.; Yolken, R.; Ashwood, P.; et al. Autism with intellectual disability is associated with increased levels of maternal cytokines and chemokines during gestation. Mol. Psychiatry 2017, 22, 273–279. [Google Scholar] [CrossRef] [PubMed] [Green Version]
  19. Curtin, P.; Kellogg, J.; Cech, N.; Gennings, C. A random subset implementation of weighted quantile sum (WQSRS) regression for analysis of high-dimensional mixtures. Commun. Stat. Simul. Comput. 2019, 50, 1119–1134. [Google Scholar] [CrossRef]
  20. Carrico, C.; Gennings, C.; Wheeler, D.C.; Factor-Litvak, P. Characterization of Weighted Quantile Sum Regression for Highly Correlated Data in a Risk Analysis Setting. J Agric Biol Environ. Stat 2015, 20, 100–120. [Google Scholar] [CrossRef]
  21. Akerele, O.A.; Cheema, S.K. Maternal diet high in Omega-3 fatty acids upregulate genes involved in neurotrophin signalling in fetal brain during pregnancy in C57BL/6 mice. Neurochem. Int. 2020, 138, 104778. [Google Scholar] [CrossRef] [PubMed]
  22. Wadhwani, N.; Patil, V.; Joshi, S. Maternal long chain polyunsaturated fatty acid status and pregnancy complications. Prostaglandins Leukot Essent Fat. Acids 2018, 136, 143–152. [Google Scholar] [CrossRef] [PubMed]
  23. Aldinger, K.A.; Lane, C.J.; Veenstra-VanderWeele, J.; Levitt, P. Patterns of Risk for Multiple Co-Occurring Medical Conditions Replicate Across Distinct Cohorts of Children with Autism Spectrum Disorder. Autism Res. 2015, 8, 771–781. [Google Scholar] [CrossRef] [PubMed]
  24. Bailey, A.; Le Couteur, A.; Gottesman, I.; Bolton, P.; Simonoff, E.; Yuzda, E.; Rutter, M. Autism as a strongly genetic disorder: Evidence from a British twin study. Psychol. Med. 1995, 25, 63–77. [Google Scholar] [CrossRef]
  25. Rosenberg, R.E.; Law, J.K.; Yenokyan, G.; McGready, J.; Kaufmann, W.E.; Law, P.A. Characteristics and concordance of autism spectrum disorders among 277 twin pairs. Arch. Pediatrics Adolesc. Med. 2009, 163, 907–914. [Google Scholar] [CrossRef] [PubMed] [Green Version]
  26. Hallmayer, J.; Cleveland, S.; Torres, A.; Phillips, J.; Cohen, B.; Torigoe, T.; Miller, J.; Fedele, A.; Collins, J.; Smith, K.; et al. Genetic heritability and shared environmental factors among twin pairs with autism. Arch. Gen. Psychiatry 2011, 68, 1095–1102. [Google Scholar] [CrossRef]
  27. Sandin, S.; Lichtenstein, P.; Kuja-Halkola, R.; Larsson, H.; Hultman, C.M.; Reichenberg, A. The familial risk of autism. JAMA 2014, 311, 1770–1777. [Google Scholar] [CrossRef] [PubMed]
  28. Colvert, E.; Tick, B.; McEwen, F.; Stewart, C.; Curran, S.R.; Woodhouse, E.; Gillan, N.; Hallett, V.; Lietz, S.; Garnett, T.; et al. Heritability of Autism Spectrum Disorder in a UK Population-Based Twin Sample. JAMA Psychiatry 2015, 72, 415–423. [Google Scholar] [CrossRef]
  29. Eichler, E.E.; Flint, J.; Gibson, G.; Kong, A.; Leal, S.M.; Moore, J.H.; Nadeau, J.H. Missing heritability and strategies for finding the underlying causes of complex disease. Nat. Rev. Genet. 2010, 11, 446–450. [Google Scholar] [CrossRef] [Green Version]
  30. Ward, L.D.; Kellis, M. Interpreting noncoding genetic variation in complex traits and human disease. Nat. Biotechnol. 2012, 30, 1095–1106. [Google Scholar] [CrossRef] [Green Version]
  31. Nebert, D.W.; Zhang, G.; Vesell, E.S. From human genetics and genomics to pharmacogenetics and pharmacogenomics: Past lessons, future directions. Drug Metab. Rev. 2008, 40, 187–224. [Google Scholar] [CrossRef] [Green Version]
  32. Park, J.H.; Wacholder, S.; Gail, M.H.; Peters, U.; Jacobs, K.B.; Chanock, S.J.; Chatterjee, N. Estimation of effect size distribution from genome-wide association studies and implications for future discoveries. Nat. Genet. 2010, 42, 570–575. [Google Scholar] [CrossRef] [Green Version]
  33. Chaste, P.; Leboyer, M. Autism risk factors: Genes, environment, and gene-environment interactions. Dialogues Clin. Neurosci. 2012, 14, 281–292. [Google Scholar]
  34. Meek, S.E.; Lemery-Chalfant, K.; Jahromi, L.B.; Valiente, C. A review of gene-environment correlations and their implications for autism: A conceptual model. Psychol. Rev. 2013, 120, 497–521. [Google Scholar] [CrossRef]
  35. Tordjman, S.; Somogyi, E.; Coulon, N.; Kermarrec, S.; Cohen, D.; Bronsard, G.; Bonnot, O.; Weismann-Arcache, C.; Botbol, M.; Lauth, B.; et al. Gene x Environment interactions in autism spectrum disorders: Role of epigenetic mechanisms. Front. Psychiatry 2014, 5, 53. [Google Scholar] [CrossRef] [Green Version]
  36. Zhu, Y.; Mordaunt, C.E.; Durbin-Johnson, B.P.; Caudill, M.A.; Malysheva, O.V.; Miller, J.W.; Green, R.; James, S.J.; Melnyk, S.B.; Fallin, M.D.; et al. Expression Changes in Epigenetic Gene Pathways Associated with One-Carbon Nutritional Metabolites in Maternal Blood From Pregnancies Resulting in Autism and Non-Typical Neurodevelopment. Autism Res. 2021, 14, 11–28. [Google Scholar] [CrossRef]
  37. Lombardo, M.V.; Pramparo, T.; Gazestani, V.; Warrier, V.; Bethlehem, R.A.I.; Carter Barnes, C.; Lopez, L.; Lewis, N.E.; Eyler, L.; Pierce, K.; et al. Large-scale associations between the leukocyte transcriptome and BOLD responses to speech differ in autism early language outcome subtypes. Nat. Neurosci. 2018, 21, 1680–1688. [Google Scholar] [CrossRef] [PubMed]
  38. Wright, C.; Shin, J.H.; Rajpurohit, A.; Deep-Soboslay, A.; Collado-Torres, L.; Brandon, N.J.; Hyde, T.M.; Kleinman, J.E.; Jaffe, A.E.; Cross, A.J.; et al. Altered expression of histamine signaling genes in autism spectrum disorder. Transl. Psychiatry 2017, 7, e1126. [Google Scholar] [CrossRef] [PubMed] [Green Version]
  39. Schmunk, G.; Nguyen, R.L.; Ferguson, D.L.; Kumar, K.; Parker, I.; Gargus, J.J. High-throughput screen detects calcium signaling dysfunction in typical sporadic autism spectrum disorder. Sci. Rep. 2017, 7, 40740. [Google Scholar] [CrossRef] [PubMed]
  40. Pramparo, T.; Pierce, K.; Lombardo, M.V.; Carter Barnes, C.; Marinero, S.; Ahrens-Barbeau, C.; Murray, S.S.; Lopez, L.; Xu, R.; Courchesne, E. Prediction of autism by translation and immune/inflammation coexpressed genes in toddlers from pediatric community practices. JAMA Psychiatry 2015, 72, 386–394. [Google Scholar] [CrossRef] [Green Version]
  41. Kusenda, M.; Vacic, V.; Malhotra, D.; Rodgers, L.; Pavon, K.; Meth, J.; Kumar, R.A.; Christian, S.L.; Peeters, H.; Cho, S.S.; et al. The Influence of Microdeletions and Microduplications of 16p11.2 on Global Transcription Profiles. J. Child Neurol. 2015, 30, 1947–1953. [Google Scholar] [CrossRef] [Green Version]
  42. Kong, S.W.; Shimizu-Motohashi, Y.; Campbell, M.G.; Lee, I.H.; Collins, C.D.; Brewster, S.J.; Holm, I.A.; Rappaport, L.; Kohane, I.S.; Kunkel, L.M. Peripheral blood gene expression signature differentiates children with autism from unaffected siblings. Neurogenetics 2013, 14, 143–152. [Google Scholar] [CrossRef] [Green Version]
  43. Campbell, M.G.; Kohane, I.S.; Kong, S.W. Pathway-based outlier method reveals heterogeneous genomic structure of autism in blood transcriptome. BMC Med. Genom. 2013, 6, 34. [Google Scholar] [CrossRef] [Green Version]
  44. Kong, S.W.; Collins, C.D.; Shimizu-Motohashi, Y.; Holm, I.A.; Campbell, M.G.; Lee, I.H.; Brewster, S.J.; Hanson, E.; Harris, H.K.; Lowe, K.R.; et al. Characteristics and predictive value of blood transcriptome signature in males with autism spectrum disorders. PLoS ONE 2012, 7, e49475. [Google Scholar] [CrossRef]
  45. Glatt, S.J.; Tsuang, M.T.; Winn, M.; Chandler, S.D.; Collins, M.; Lopez, L.; Weinfeld, M.; Carter, C.; Schork, N.; Pierce, K.; et al. Blood-based gene expression signatures of infants and toddlers with autism. J. Am. Acad. Child Adolesc. Psychiatry 2012, 51, 934–944.e932. [Google Scholar] [CrossRef] [PubMed] [Green Version]
  46. Maier, T.; Guell, M.; Serrano, L. Correlation of mRNA and protein in complex biological samples. FEBS Lett. 2009, 583, 3966–3973. [Google Scholar] [CrossRef] [PubMed] [Green Version]
  47. Pascal, L.E.; True, L.D.; Campbell, D.S.; Deutsch, E.W.; Risk, M.; Coleman, I.M.; Eichner, L.J.; Nelson, P.S.; Liu, A.Y. Correlation of mRNA and protein levels: Cell type-specific gene expression of cluster designation antigens in the prostate. BMC Genom. 2008, 9, 246. [Google Scholar] [CrossRef] [PubMed]
  48. Laye, M.J.; Tran, V.; Jones, D.P.; Kapahi, P.; Promislow, D.E. The effects of age and dietary restriction on the tissue-specific metabolome of Drosophila. Aging Cell 2015, 14, 797–808. [Google Scholar] [CrossRef] [PubMed]
  49. Zolkipli-Cunningham, Z.; Naviaux, J.C.; Nakayama, T.; Hirsch, C.M.; Monk, J.M.; Li, K.; Wang, L.; Le, T.P.; Meinardi, S.; Blake, D.R.; et al. Metabolic and behavioral features of acute hyperpurinergia and the maternal immune activation mouse model of autism spectrum disorder. PLoS ONE 2021, 16, e0248771. [Google Scholar] [CrossRef]
  50. Xu, X.J.; Cai, X.E.; Meng, F.C.; Song, T.J.; Wang, X.X.; Wei, Y.Z.; Zhai, F.J.; Long, B.; Wang, J.; You, X.; et al. Comparison of the Metabolic Profiles in the Plasma and Urine Samples Between Autistic and Typically Developing Boys: A Preliminary Study. Front. Psychiatry 2021, 12, 657105. [Google Scholar] [CrossRef]
  51. Xiao, L.; Yan, J.; Yang, T.; Zhu, J.; Li, T.; Wei, H.; Chen, J. Fecal Microbiome Transplantation from Children with Autism Spectrum Disorder Modulates Tryptophan and Serotonergic Synapse Metabolism and Induces Altered Behaviors in Germ-Free Mice. mSystems 2021, 6, e01343-20. [Google Scholar] [CrossRef]
  52. Needham, B.D.; Adame, M.D.; Serena, G.; Rose, D.R.; Preston, G.M.; Conrad, M.C.; Campbell, A.S.; Donabedian, D.H.; Fasano, A.; Ashwood, P.; et al. Plasma and Fecal Metabolite Profiles in Autism Spectrum Disorder. Biol. Psychiatry 2021, 89, 451–462. [Google Scholar] [CrossRef]
  53. Ma, Y.; Zhou, H.; Li, C.; Zou, X.; Luo, X.; Wu, L.; Li, T.; Chen, X.; Mao, M.; Huang, Y.; et al. Differential Metabolites in Chinese Autistic Children: A Multi-Center Study Based on Urinary (1)H-NMR Metabolomics Analysis. Front. Psychiatry 2021, 12, 624767. [Google Scholar] [CrossRef] [PubMed]
  54. Yu, Q.; He, Z.; Zubkov, D.; Huang, S.; Kurochkin, I.; Yang, X.; Halene, T.; Willmitzer, L.; Giavalisco, P.; Akbarian, S.; et al. Lipidome alterations in human prefrontal cortex during development, aging, and cognitive disorders. Mol. Psychiatry 2020, 25, 2952–2969. [Google Scholar] [CrossRef] [PubMed] [Green Version]
  55. Yadama, A.P.; Kelly, R.S.; Lee-Sarwar, K.; Mirzakhani, H.; Chu, S.H.; Kachroo, P.; Litonjua, A.A.; Lasky-Su, J.; Weiss, S.T. Allergic disease and low ASQ communication score in children. Brain Behav. Immun. 2020, 83, 293–297. [Google Scholar] [CrossRef] [PubMed]
  56. Ventura, G.; Calvano, C.D.; Porcelli, V.; Palmieri, L.; De Giacomo, A.; Xu, Y.; Goodacre, R.; Palmisano, F.; Cataldi, T.R.I. Phospholipidomics of peripheral blood mononuclear cells (PBMCs): The tricky case of children with autism spectrum disorder (ASD) and their healthy siblings. Anal. Bioanal. Chem. 2020, 412, 6859–6874. [Google Scholar] [CrossRef] [PubMed]
  57. Usui, N.; Iwata, K.; Miyachi, T.; Takagai, S.; Wakusawa, K.; Nara, T.; Tsuchiya, K.J.; Matsumoto, K.; Kurita, D.; Kameno, Y.; et al. VLDL-specific increases of fatty acids in autism spectrum disorder correlate with social interaction. EBioMedicine 2020, 58, 102917. [Google Scholar] [CrossRef]
  58. Troisi, J.; Autio, R.; Beopoulos, T.; Bravaccio, C.; Carraturo, F.; Corrivetti, G.; Cunningham, S.; Devane, S.; Fallin, D.; Fetissov, S.; et al. Genome, Environment, Microbiome and Metabolome in Autism (GEMMA) Study Design: Biomarkers Identification for Precision Treatment and Primary Prevention of Autism Spectrum Disorders by an Integrated Multi-Omics Systems Biology Approach. Brain Sci. 2020, 10, 743. [Google Scholar] [CrossRef]
  59. Sotelo-Orozco, J.; Abbeduto, L.; Hertz-Picciotto, I.; Slupsky, C.M. Association Between Plasma Metabolites and Psychometric Scores Among Children With Developmental Disabilities: Investigating Sex-Differences. Front. Psychiatry 2020, 11, 579538. [Google Scholar] [CrossRef]
  60. Smith, A.M.; Natowicz, M.R.; Braas, D.; Ludwig, M.A.; Ney, D.M.; Donley, E.L.R.; Burrier, R.E.; Amaral, D.G. A Metabolomics Approach to Screening for Autism Risk in the Children’s Autism Metabolome Project. Autism Res. 2020, 13, 1270–1285. [Google Scholar] [CrossRef]
  61. Panjwani, A.A.; Ji, Y.; Fahey, J.W.; Palmer, A.; Wang, G.; Hong, X.; Zuckerman, B.; Wang, X. Maternal Dyslipidemia, Plasma Branched-Chain Amino Acids, and the Risk of Child Autism Spectrum Disorder: Evidence of Sex Difference. J. Autism Dev. Disord. 2020, 50, 540–550. [Google Scholar] [CrossRef] [PubMed]
  62. Liang, Y.; Xiao, Z.; Ke, X.; Yao, P.; Chen, Y.; Lin, L.; Lu, J. Urinary Metabonomic Profiling Discriminates Between Children with Autism and Their Healthy Siblings. Med. Sci. Monit. 2020, 26, e926634. [Google Scholar] [CrossRef]
  63. Liang, Y.; Ke, X.; Xiao, Z.; Zhang, Y.; Chen, Y.; Li, Y.; Wang, Z.; Lin, L.; Yao, P.; Lu, J. Untargeted Metabolomic Profiling Using UHPLC-QTOF/MS Reveals Metabolic Alterations Associated with Autism. Biomed. Res. Int. 2020, 2020, 6105608. [Google Scholar] [CrossRef] [PubMed]
  64. Hua, X.; Zhu, J.; Yang, T.; Guo, M.; Li, Q.; Chen, J.; Li, T. The Gut Microbiota and Associated Metabolites Are Altered in Sleep Disorder of Children With Autism Spectrum Disorders. Front. Psychiatry 2020, 11, 855. [Google Scholar] [CrossRef]
  65. Hollowood-Jones, K.; Adams, J.B.; Coleman, D.M.; Ramamoorthy, S.; Melnyk, S.; James, S.J.; Woodruff, B.K.; Pollard, E.L.; Snozek, C.L.; Kruger, U.; et al. Altered metabolism of mothers of young children with Autism Spectrum Disorder: A case control study. BMC Pediatrics 2020, 20, 557. [Google Scholar] [CrossRef]
  66. Gevi, F.; Belardo, A.; Zolla, L. A metabolomics approach to investigate urine levels of neurotransmitters and related metabolites in autistic children. Biochim. Biophys. Acta Mol. Basis Dis. 2020, 1866, 165859. [Google Scholar] [CrossRef] [PubMed]
  67. Yehia, L.; Ni, Y.; Feng, F.; Seyfi, M.; Sadler, T.; Frazier, T.W.; Eng, C. Distinct Alterations in Tricarboxylic Acid Cycle Metabolites Associate with Cancer and Autism Phenotypes in Cowden Syndrome and Bannayan-Riley-Ruvalcaba Syndrome. Am. J. Hum. Genet. 2019, 105, 813–821. [Google Scholar] [CrossRef] [Green Version]
  68. Xiong, X.; Liu, D.; He, W.; Sheng, X.; Zhou, W.; Xie, D.; Liang, H.; Zeng, T.; Li, T.; Wang, Y. Identification of gender-related metabolic disturbances in autism spectrum disorders using urinary metabolomics. Int. J. Biochem. Cell Biol. 2019, 115, 105594. [Google Scholar] [CrossRef]
  69. Smith, A.M.; King, J.J.; West, P.R.; Ludwig, M.A.; Donley, E.L.R.; Burrier, R.E.; Amaral, D.G. Amino Acid Dysregulation Metabotypes: Potential Biomarkers for Diagnosis and Individualized Treatment for Subtypes of Autism Spectrum Disorder. Biol. Psychiatry 2019, 85, 345–354. [Google Scholar] [CrossRef] [Green Version]
  70. Rangel-Huerta, O.D.; Gomez-Fernandez, A.; de la Torre-Aguilar, M.J.; Gil, A.; Perez-Navero, J.L.; Flores-Rojas, K.; Martin-Borreguero, P.; Gil-Campos, M. Metabolic profiling in children with autism spectrum disorder with and without mental regression: Preliminary results from a cross-sectional case-control study. Metabolomics 2019, 15, 99. [Google Scholar] [CrossRef]
  71. Panjwani, A.A.; Ji, Y.; Fahey, J.W.; Palmer, A.; Wang, G.; Hong, X.; Zuckerman, B.; Wang, X. Maternal Obesity/Diabetes, Plasma Branched-Chain Amino Acids, and Autism Spectrum Disorder Risk in Urban Low-Income Children: Evidence of Sex Difference. Autism Res. 2019, 12, 1562–1573. [Google Scholar] [CrossRef]
  72. Orozco, J.S.; Hertz-Picciotto, I.; Abbeduto, L.; Slupsky, C.M. Metabolomics analysis of children with autism, idiopathic-developmental delays, and Down syndrome. Transl. Psychiatry 2019, 9, 243. [Google Scholar] [CrossRef] [PubMed] [Green Version]
  73. Kelly, R.S.; Boulin, A.; Laranjo, N.; Lee-Sarwar, K.; Chu, S.H.; Yadama, A.P.; Carey, V.; Litonjua, A.A.; Lasky-Su, J.; Weiss, S.T. Metabolomics and Communication Skills Development in Children; Evidence from the Ages and Stages Questionnaire. Metabolites 2019, 9, 42. [Google Scholar] [CrossRef] [PubMed] [Green Version]
  74. Chen, Q.; Qiao, Y.; Xu, X.J.; You, X.; Tao, Y. Urine Organic Acids as Potential Biomarkers for Autism-Spectrum Disorder in Chinese Children. Front. Cell. Neurosci. 2019, 13, 150. [Google Scholar] [CrossRef] [PubMed]
  75. Belardo, A.; Gevi, F.; Zolla, L. The concomitant lower concentrations of vitamins B6, B9 and B12 may cause methylation deficiency in autistic children. J. Nutr. Biochem. 2019, 70, 38–46. [Google Scholar] [CrossRef]
  76. Kang, D.W.; Ilhan, Z.E.; Isern, N.G.; Hoyt, D.W.; Howsmon, D.P.; Shaffer, M.; Lozupone, C.A.; Hahn, J.; Adams, J.B.; Krajmalnik-Brown, R. Differences in fecal microbial metabolites and microbiota of children with autism spectrum disorders. Anaerobe 2018, 49, 121–131. [Google Scholar] [CrossRef]
  77. Bitar, T.; Mavel, S.; Emond, P.; Nadal-Desbarats, L.; Lefevre, A.; Mattar, H.; Soufia, M.; Blasco, H.; Vourc’h, P.; Hleihel, W.; et al. Identification of metabolic pathway disturbances using multimodal metabolomics in autistic disorders in a Middle Eastern population. J. Pharm. Biomed. Anal. 2018, 152, 57–65. [Google Scholar] [CrossRef]
  78. Bent, S.; Lawton, B.; Warren, T.; Widjaja, F.; Dang, K.; Fahey, J.W.; Cornblatt, B.; Kinchen, J.M.; Delucchi, K.; Hendren, R.L. Identification of urinary metabolites that correlate with clinical improvements in children with autism treated with sulforaphane from broccoli. Mol. Autism 2018, 9, 35. [Google Scholar] [CrossRef] [Green Version]
  79. Lussu, M.; Noto, A.; Masili, A.; Rinaldi, A.C.; Dessi, A.; De Angelis, M.; De Giacomo, A.; Fanos, V.; Atzori, L.; Francavilla, R. The urinary (1) H-NMR metabolomics profile of an italian autistic children population and their unaffected siblings. Autism Res. 2017, 10, 1058–1066. [Google Scholar] [CrossRef]
  80. Gevi, F.; Zolla, L.; Gabriele, S.; Persico, A.M. Urinary metabolomics of young Italian autistic children supports abnormal tryptophan and purine metabolism. Mol. Autism 2016, 7, 47. [Google Scholar] [CrossRef] [Green Version]
  81. Dieme, B.; Mavel, S.; Blasco, H.; Tripi, G.; Bonnet-Brilhault, F.; Malvy, J.; Bocca, C.; Andres, C.R.; Nadal-Desbarats, L.; Emond, P. Metabolomics Study of Urine in Autism Spectrum Disorders Using a Multiplatform Analytical Methodology. J. Proteome Res. 2015, 14, 5273–5282. [Google Scholar] [CrossRef] [Green Version]
  82. West, P.R.; Amaral, D.G.; Bais, P.; Smith, A.M.; Egnash, L.A.; Ross, M.E.; Palmer, J.A.; Fontaine, B.R.; Conard, K.R.; Corbett, B.A.; et al. Metabolomics as a tool for discovery of biomarkers of autism spectrum disorder in the blood plasma of children. PLoS ONE 2014, 9, e112445. [Google Scholar] [CrossRef] [PubMed]
  83. Noto, A.; Fanos, V.; Barberini, L.; Grapov, D.; Fattuoni, C.; Zaffanello, M.; Casanova, A.; Fenu, G.; De Giacomo, A.; De Angelis, M.; et al. The urinary metabolomics profile of an Italian autistic children population and their unaffected siblings. J Matern Fetal Neonatal Med. 2014, 27 (Suppl 2), 46–52. [Google Scholar] [CrossRef] [PubMed]
  84. Nadal-Desbarats, L.; Aidoud, N.; Emond, P.; Blasco, H.; Filipiak, I.; Sarda, P.; Bonnet-Brilhault, F.; Mavel, S.; Andres, C.R. Combined 1H-NMR and 1H-13C HSQC-NMR to improve urinary screening in autism spectrum disorders. Analyst 2014, 139, 3460–3468. [Google Scholar] [CrossRef]
  85. Mavel, S.; Nadal-Desbarats, L.; Blasco, H.; Bonnet-Brilhault, F.; Barthelemy, C.; Montigny, F.; Sarda, P.; Laumonnier, F.; Vourc’h, P.; Andres, C.R.; et al. 1H-13C NMR-based urine metabolic profiling in autism spectrum disorders. Talanta 2013, 114, 95–102. [Google Scholar] [CrossRef] [PubMed] [Green Version]
  86. Emond, P.; Mavel, S.; Aidoud, N.; Nadal-Desbarats, L.; Montigny, F.; Bonnet-Brilhault, F.; Barthelemy, C.; Merten, M.; Sarda, P.; Laumonnier, F.; et al. GC-MS-based urine metabolic profiling of autism spectrum disorders. Anal. Bioanal. Chem. 2013, 405, 5291–5300. [Google Scholar] [CrossRef] [Green Version]
  87. Ming, X.; Stein, T.P.; Barnes, V.; Rhodes, N.; Guo, L. Metabolic perturbance in autism spectrum disorders: A metabolomics study. J. Proteome Res. 2012, 11, 5856–5862. [Google Scholar] [CrossRef]
  88. Nolin, S.L.; Napoli, E.; Flores, A.; Hagerman, R.J.; Giulivi, C. Deficits in Prenatal Serine Biosynthesis Underlie the Mitochondrial Dysfunction Associated with the Autism-Linked FMR1 Gene. Int. J. Mol. Sci. 2021, 22, 5886. [Google Scholar] [CrossRef]
  89. Bala, K.A.; Dogan, M.; Mutluer, T.; Kaba, S.; Aslan, O.; Balahoroglu, R.; Cokluk, E.; Ustyol, L.; Kocaman, S. Plasma amino acid profile in autism spectrum disorder (ASD). Eur. Rev. Med. Pharm. Sci. 2016, 20, 923–929. [Google Scholar]
  90. De Angelis, M.; Piccolo, M.; Vannini, L.; Siragusa, S.; De Giacomo, A.; Serrazzanetti, D.I.; Cristofori, F.; Guerzoni, M.E.; Gobbetti, M.; Francavilla, R. Fecal microbiota and metabolome of children with autism and pervasive developmental disorder not otherwise specified. PLoS ONE 2013, 8, e76993. [Google Scholar] [CrossRef] [Green Version]
  91. Hamlin, J.; Crook, T.; James, J.; Gonzales, D.; Hakkak, R. Correlation between dietary intake and plasma levels of choline and betaine in children with autism. In Proceedings of the Experimental Biology Meeting, San Diego, CA, USA, 26–30 April 2014; p. 827.821. [Google Scholar]
  92. Yu, X.; Qian-Qian, L.; Cong, Y.; Xiao-Bing, Z.; Hong-Zhu, D. Reduction of essential amino acid levels and sex-specific alterations in serum amino acid concentration profiles in children with autism spectrum disorder. Psychiatry Res. 2021, 297, 113675. [Google Scholar] [CrossRef]
  93. Vargason, T.; Kruger, U.; McGuinness, D.L.; Adams, J.B.; Geis, E.; Gehn, E.; Coleman, D.; Hahn, J. Investigating Plasma Amino Acids for Differentiating Individuals with Autism Spectrum Disorder and Typically Developing Peers. Res. Autism Spectr. Disord. 2018, 50, 60–72. [Google Scholar] [CrossRef] [PubMed]
  94. Zheng, H.F.; Wang, W.Q.; Li, X.M.; Rauw, G.; Baker, G.B. Body fluid levels of neuroactive amino acids in autism spectrum disorders: A review of the literature. Amino Acids 2017, 49, 57–65. [Google Scholar] [CrossRef] [PubMed] [Green Version]
  95. Wang, H.; Liang, S.; Wang, M.; Gao, J.; Sun, C.; Wang, J.; Xia, W.; Wu, S.; Sumner, S.J.; Zhang, F.; et al. Potential serum biomarkers from a metabolomics study of autism. J. Psychiatry Neurosci. 2016, 41, 27–37. [Google Scholar] [CrossRef] [PubMed] [Green Version]
  96. Ouellet, M.; Emond, V.; Chen, C.T.; Julien, C.; Bourasset, F.; Oddo, S.; LaFerla, F.; Bazinet, R.P.; Calon, F. Diffusion of docosahexaenoic and eicosapentaenoic acids through the blood-brain barrier: An in situ cerebral perfusion study. Neurochem. Int. 2009, 55, 476–482. [Google Scholar] [CrossRef] [PubMed]
  97. Peters, B.D.; Duran, M.; Vlieger, E.J.; Majoie, C.B.; den Heeten, G.J.; Linszen, D.H.; de Haan, L. Polyunsaturated fatty acids and brain white matter anisotropy in recent-onset schizophrenia: A preliminary study. Prostaglandins Leukot Essent Fat. Acids 2009, 81, 61–63. [Google Scholar] [CrossRef] [PubMed]
  98. Conklin, S.M.; Runyan, C.A.; Leonard, S.; Reddy, R.D.; Muldoon, M.F.; Yao, J.K. Age-related changes of n-3 and n-6 polyunsaturated fatty acids in the anterior cingulate cortex of individuals with major depressive disorder. Prostaglandins Leukot Essent Fat. Acids 2010, 82, 111–119. [Google Scholar] [CrossRef] [PubMed] [Green Version]
  99. Martin, V.; Fabelo, N.; Santpere, G.; Puig, B.; Marin, R.; Ferrer, I.; Diaz, M. Lipid alterations in lipid rafts from Alzheimer’s disease human brain cortex. J. Alzheimers Dis. 2010, 19, 489–502. [Google Scholar] [CrossRef] [Green Version]
  100. Fabelo, N.; Martin, V.; Santpere, G.; Marin, R.; Torrent, L.; Ferrer, I.; Diaz, M. Severe alterations in lipid composition of frontal cortex lipid rafts from Parkinson’s disease and incidental Parkinson’s disease. Mol. Med. 2011, 17, 1107–1118. [Google Scholar] [CrossRef]
  101. Parletta, N.; Niyonsenga, T.; Duff, J. Omega-3 and Omega-6 Polyunsaturated Fatty Acid Levels and Correlations with Symptoms in Children with Attention Deficit Hyperactivity Disorder, Autistic Spectrum Disorder and Typically Developing Controls. PLoS ONE 2016, 11, e0156432. [Google Scholar] [CrossRef]
  102. Robson, L.G.; Dyall, S.; Sidloff, D.; Michael-Titus, A.T. Omega-3 polyunsaturated fatty acids increase the neurite outgrowth of rat sensory neurones throughout development and in aged animals. Neurobiol. Aging 2010, 31, 678–687. [Google Scholar] [CrossRef] [PubMed]
  103. Labrousse, V.F.; Nadjar, A.; Joffre, C.; Costes, L.; Aubert, A.; Gregoire, S.; Bretillon, L.; Laye, S. Short-term long chain omega3 diet protects from neuroinflammatory processes and memory impairment in aged mice. PLoS ONE 2012, 7, e36861. [Google Scholar] [CrossRef]
  104. Harbeby, E.; Jouin, M.; Alessandri, J.M.; Lallemand, M.S.; Linard, A.; Lavialle, M.; Huertas, A.; Cunnane, S.C.; Guesnet, P. n-3 PUFA status affects expression of genes involved in neuroenergetics differently in the fronto-parietal cortex compared to the CA1 area of the hippocampus: Effect of rest and neuronal activation in the rat. Prostaglandins Leukot Essent Fat. Acids 2012, 86, 211–220. [Google Scholar] [CrossRef]
  105. Blondeau, N.; Nguemeni, C.; Debruyne, D.N.; Piens, M.; Wu, X.; Pan, H.; Hu, X.; Gandin, C.; Lipsky, R.H.; Plumier, J.C.; et al. Subchronic alpha-linolenic acid treatment enhances brain plasticity and exerts an antidepressant effect: A versatile potential therapy for stroke. Neuropsychopharmacology 2009, 34, 2548–2559. [Google Scholar] [CrossRef] [PubMed] [Green Version]
  106. Pan, J.P.; Zhang, H.Q.; Wei, W.; Guo, Y.F.; Na, X.; Cao, X.H.; Liu, L.J. Some subtypes of endocannabinoid/endovanilloid receptors mediate docosahexaenoic acid-induced enhanced spatial memory in rats. Brain Res. 2011, 1412, 18–27. [Google Scholar] [CrossRef] [PubMed]
  107. Dyall, S.C.; Michael, G.J.; Michael-Titus, A.T. Omega-3 fatty acids reverse age-related decreases in nuclear receptors and increase neurogenesis in old rats. J. Neurosci. Res. 2010, 88, 2091–2102. [Google Scholar] [CrossRef] [PubMed]
  108. Martins, B.P.; Bandarra, N.M.; Figueiredo-Braga, M. The role of marine omega-3 in human neurodevelopment, including Autism Spectrum Disorders and Attention-Deficit/Hyperactivity Disorder—A review. Crit. Rev. Food. Sci. Nutr. 2020, 60, 1431–1446. [Google Scholar] [CrossRef]
  109. Lebbadi, M.; Julien, C.; Phivilay, A.; Tremblay, C.; Emond, V.; Kang, J.X.; Calon, F. Endogenous conversion of omega-6 into omega-3 fatty acids improves neuropathology in an animal model of Alzheimer’s disease. J. Alzheimers Dis. 2011, 27, 853–869. [Google Scholar] [CrossRef] [Green Version]
  110. Refolo, V.; Stefanova, N. Neuroinflammation and Glial Phenotypic Changes in Alpha-Synucleinopathies. Front. Cell. Neurosci. 2019, 13, 263. [Google Scholar] [CrossRef] [Green Version]
  111. Yuan, J.; Amin, P.; Ofengeim, D. Necroptosis and RIPK1-mediated neuroinflammation in CNS diseases. Nat. Rev. Neurosci. 2019, 20, 19–33. [Google Scholar] [CrossRef]
  112. Das, U.N. A defect in the activity of Delta6 and Delta5 desaturases may be a factor predisposing to the development of insulin resistance syndrome. Prostaglandins Leukot Essent Fat. Acids 2005, 72, 343–350. [Google Scholar] [CrossRef]
  113. Bazan, N.G.; Colangelo, V.; Lukiw, W.J. Prostaglandins and other lipid mediators in Alzheimer’s disease. Prostaglandins Other Lipid Mediat 2002, 68-69, 197–210. [Google Scholar] [CrossRef]
  114. Trushina, E.; Dutta, T.; Persson, X.M.; Mielke, M.M.; Petersen, R.C. Identification of altered metabolic pathways in plasma and CSF in mild cognitive impairment and Alzheimer’s disease using metabolomics. PLoS ONE 2013, 8, e63644. [Google Scholar] [CrossRef] [Green Version]
  115. Combrinck, M.; Williams, J.; De Berardinis, M.A.; Warden, D.; Puopolo, M.; Smith, A.D.; Minghetti, L. Levels of CSF prostaglandin E2, cognitive decline, and survival in Alzheimer’s disease. J. Neurol. Neurosurg Psychiatry 2006, 77, 85–88. [Google Scholar] [CrossRef]
  116. Panisi, C.; Guerini, F.R.; Abruzzo, P.M.; Balzola, F.; Biava, P.M.; Bolotta, A.; Brunero, M.; Burgio, E.; Chiara, A.; Clerici, M.; et al. Autism Spectrum Disorder from the Womb to Adulthood: Suggestions for a Paradigm Shift. J. Pers. Med. 2021, 11, 70. [Google Scholar] [CrossRef]
  117. Sotgiu, S.; Manca, S.; Gagliano, A.; Minutolo, A.; Melis, M.C.; Pisuttu, G.; Scoppola, C.; Bolognesi, E.; Clerici, M.; Guerini, F.R.; et al. Immune regulation of neurodevelopment at the mother-foetus interface: The case of autism. Clin. Transl. Immunol. 2020, 9, e1211. [Google Scholar] [CrossRef]
  118. Theoharides, T.C.; Zhang, B. Neuro-inflammation, blood-brain barrier, seizures and autism. J. Neuroinflammation 2011, 8, 168. [Google Scholar] [CrossRef] [Green Version]
  119. Cohen-Cory, S.; Fraser, S.E. Effects of brain-derived neurotrophic factor on optic axon branching and remodelling in vivo. Nature 1995, 378, 192–196. [Google Scholar] [CrossRef]
  120. Suzuki, S.; Hongli, Q.; Okada, A.; Kasama, T.; Ohta, K.; Warita, K.; Tanaka, K.; Miki, T.; Takeuchi, Y. BDNF-dependent accumulation of palmitoleic acid in CNS neurons. Cell. Mol. Neurobiol. 2012, 32, 1367–1373. [Google Scholar] [CrossRef]
  121. Breuer, S.; Pech, K.; Buss, A.; Spitzer, C.; Ozols, J.; Hol, E.M.; Heussen, N.; Noth, J.; Schwaiger, F.W.; Schmitt, A.B. Regulation of stearoyl-CoA desaturase-1 after central and peripheral nerve lesions. BMC Neurosci. 2004, 5, 15. [Google Scholar] [CrossRef] [Green Version]
  122. LaBarre, J.L.; Miller, A.L.; Bauer, K.W.; Burant, C.F.; Lumeng, J.C. Early life stress exposure associated with reduced polyunsaturated-containing lipids in low-income children. Pediatr. Res. 2021, 89, 1310–1315. [Google Scholar] [CrossRef] [PubMed]
  123. Kessler, K.; Gerl, M.J.; Hornemann, S.; Damm, M.; Klose, C.; Petzke, K.J.; Kemper, M.; Weber, D.; Rudovich, N.; Grune, T.; et al. Shotgun Lipidomics Discovered Diurnal Regulation of Lipid Metabolism Linked to Insulin Sensitivity in Nondiabetic Men. J. Clin. Endocrinol. Metab. 2020, 105, 1501–1514. [Google Scholar] [CrossRef]
  124. Skene, D.J.; Skornyakov, E.; Chowdhury, N.R.; Gajula, R.P.; Middleton, B.; Satterfield, B.C.; Porter, K.I.; Van Dongen, H.P.A.; Gaddameedhi, S. Separation of circadian- and behavior-driven metabolite rhythms in humans provides a window on peripheral oscillators and metabolism. Proc. Natl. Acad. Sci. USA 2018, 115, 7825–7830. [Google Scholar] [CrossRef] [Green Version]
  125. Chua, E.C.; Shui, G.; Lee, I.T.; Lau, P.; Tan, L.C.; Yeo, S.C.; Lam, B.D.; Bulchand, S.; Summers, S.A.; Puvanendran, K.; et al. Extensive diversity in circadian regulation of plasma lipids and evidence for different circadian metabolic phenotypes in humans. Proc. Natl. Acad. Sci. USA 2013, 110, 14468–14473. [Google Scholar] [CrossRef] [Green Version]
  126. Honma, A.; Revell, V.L.; Gunn, P.J.; Davies, S.K.; Middleton, B.; Raynaud, F.I.; Skene, D.J. Effect of acute total sleep deprivation on plasma melatonin, cortisol and metabolite rhythms in females. Eur. J. Neurosci. 2020, 51, 366–378. [Google Scholar] [CrossRef] [Green Version]
  127. Ang, J.E.; Revell, V.; Mann, A.; Mantele, S.; Otway, D.T.; Johnston, J.D.; Thumser, A.E.; Skene, D.J.; Raynaud, F. Identification of human plasma metabolites exhibiting time-of-day variation using an untargeted liquid chromatography-mass spectrometry metabolomic approach. Chronobiol. Int. 2012, 29, 868–881. [Google Scholar] [CrossRef] [PubMed] [Green Version]
  128. Hertz-Picciotto, I.; Schmidt, R.J.; Walker, C.K.; Bennett, D.H.; Oliver, M.; Shedd-Wise, K.M.; LaSalle, J.M.; Giulivi, C.; Puschner, B.; Thomas, J.; et al. A Prospective Study of Environmental Exposures and Early Biomarkers in Autism Spectrum Disorder: Design, Protocols, and Preliminary Data from the MARBLES Study. Environ. Health Perspect. 2018, 126, 117004. [Google Scholar] [CrossRef] [PubMed] [Green Version]
  129. Lord, C.; Risi, S.; Lambrecht, L.; Cook, E.H., Jr.; Leventhal, B.L.; DiLavore, P.C.; Pickles, A.; Rutter, M. The autism diagnostic observation schedule-generic: A standard measure of social and communication deficits associated with the spectrum of autism. J. Autism Dev. Disord. 2000, 30, 205–223. [Google Scholar] [CrossRef]
  130. Lord, C.; Rutter, M.; DiLavore, P.C.; Risi, S. The Autism Diagnostic Observation Schedule (ADOS); Western Psychological Services: Los Angeles, CA, USA, 2000. [Google Scholar]
  131. Mullen, E.M. Scales of Early Learning; American Guidance Services Inc.: Circle Pines, MN, USA, 1995. [Google Scholar]
  132. Chawarska, K.; Shic, F.; Macari, S.; Campbell, D.J.; Brian, J.; Landa, R.; Hutman, T.; Nelson, C.A.; Ozonoff, S.; Tager-Flusberg, H.; et al. 18-month predictors of later outcomes in younger siblings of children with autism spectrum disorder: A baby siblings research consortium study. J. Am. Acad. Child Adolesc. Psychiatry 2014, 53, 1317–1327.e1311. [Google Scholar] [CrossRef] [Green Version]
  133. Ozonoff, S.; Young, G.S.; Belding, A.; Hill, M.; Hill, A.; Hutman, T.; Johnson, S.; Miller, M.; Rogers, S.J.; Schwichtenberg, A.J.; et al. The broader autism phenotype in infancy: When does it emerge? J. Am. Acad. Child Adolesc. Psychiatry 2014, 53, 398–407.e392. [Google Scholar] [CrossRef] [Green Version]
  134. Charman, T.; Young, G.S.; Brian, J.; Carter, A.; Carver, L.J.; Chawarska, K.; Curtin, S.; Dobkins, K.; Elsabbagh, M.; Georgiades, S.; et al. Non-ASD outcomes at 36 months in siblings at familial risk for autism spectrum disorder (ASD): A baby siblings research consortium (BSRC) study. Autism Res. 2017, 10, 169–178. [Google Scholar] [CrossRef] [PubMed] [Green Version]
  135. Ozonoff, S.; Young, G.S.; Landa, R.J.; Brian, J.; Bryson, S.; Charman, T.; Chawarska, K.; Macari, S.L.; Messinger, D.; Stone, W.L.; et al. Diagnostic stability in young children at risk for autism spectrum disorder: A baby siblings research consortium study. J. Child Psychol. Psychiatry Allied Discip. 2015, 56, 988–998. [Google Scholar] [CrossRef] [Green Version]
  136. Gotham, K.; Pickles, A.; Lord, C. Standardizing ADOS scores for a measure of severity in autism spectrum disorders. J. Autism Dev. Disord. 2009, 39, 693–705. [Google Scholar] [CrossRef] [PubMed] [Green Version]
  137. Liang, D.; Moutinho, J.L.; Golan, R.; Yu, T.; Ladva, C.N.; Niedzwiecki, M.; Walker, D.I.; Sarnat, S.E.; Chang, H.H.; Greenwald, R.; et al. Use of high-resolution metabolomics for the identification of metabolic signals associated with traffic-related air pollution. Environ. Int. 2018, 120, 145–154. [Google Scholar] [CrossRef] [PubMed]
  138. Go, Y.M.; Walker, D.I.; Liang, Y.; Uppal, K.; Soltow, Q.A.; Tran, V.; Strobel, F.; Quyyumi, A.A.; Ziegler, T.R.; Pennell, K.D.; et al. Reference Standardization for Mass Spectrometry and High-resolution Metabolomics Applications to Exposome Research. Toxicol. Sci. 2015, 148, 531–543. [Google Scholar] [CrossRef] [PubMed] [Green Version]
  139. Uppal, K.; Soltow, Q.A.; Strobel, F.H.; Pittard, W.S.; Gernert, K.M.; Yu, T.; Jones, D.P. xMSanalyzer: Automated pipeline for improved feature detection and downstream analysis of large-scale, non-targeted metabolomics data. BMC Bioinform. 2013, 14, 15. [Google Scholar] [CrossRef] [PubMed] [Green Version]
  140. Simon-Manso, Y.; Lowenthal, M.S.; Kilpatrick, L.E.; Sampson, M.L.; Telu, K.H.; Rudnick, P.A.; Mallard, W.G.; Bearden, D.W.; Schock, T.B.; Tchekhovskoi, D.V.; et al. Metabolite profiling of a NIST Standard Reference Material for human plasma (SRM 1950): GC-MS, LC-MS, NMR, and clinical laboratory analyses, libraries, and web-based resources. Anal. Chem. 2013, 85, 11725–11731. [Google Scholar] [CrossRef] [PubMed]
  141. Yu, T.; Park, Y.; Johnson, J.M.; Jones, D.P. apLCMS--adaptive processing of high-resolution LC/MS data. Bioinformatics 2009, 25, 1930–1936. [Google Scholar] [CrossRef] [PubMed] [Green Version]
  142. Sumner, L.W.; Amberg, A.; Barrett, D.; Beale, M.H.; Beger, R.; Daykin, C.A.; Fan, T.W.; Fiehn, O.; Goodacre, R.; Griffin, J.L.; et al. Proposed minimum reporting standards for chemical analysis Chemical Analysis Working Group (CAWG) Metabolomics Standards Initiative (MSI). Metabolomics 2007, 3, 211–221. [Google Scholar] [CrossRef] [PubMed] [Green Version]
  143. Benjamini, Y.; Hochberg, Y. Controlling the False Discovery Rate—A Practical and Powerful Approach to Multiple Testing. J. R. Stat. Soc. B 1995, 57, 289–300. [Google Scholar] [CrossRef]
Figure 1. Overview of metabolites identified as relevant to decrease the Non-TD risk in the context of the biosynthesis of fatty acids and eicosanoids. (A). Pathway enrichment analysis performed with significant metabolites from Table 2. Analysis was performed by utilizing the KEGG database. (B). Metabolites in grey were not identified in this study; those in blue boxes were identified and the blue shade represents the value of the OR from Table 2. Abbreviations: ALA, alpha-linolenic acid; LA, linoleic acid; EPA, eicosapentaenoic acid; DPA, docosapentaenoic acid; DHA, docosahexaenoic acid; AA, arachidonic acid; DHGLA, dihomo-gamma-linolenic acid; MUFAs, monounsaturated fatty acids; PUFAS, polyunsaturated fatty acids; SFAs, saturated fatty acids; E, elongase; desaturases are indicated as delta followed by the bond affected; OX, peroxisomal beta-oxidation. Eicosanoids with anti-inflammatory properties (resolvins, protectins) are indicated with thin green arrows, whereas pro-inflammatory (prostanglandins of the series 2 and LTB4) are indicated with thick red arrows. (C). Metabolite–disease analysis was performed in MetaboAnalyst.
Metabolites 11 00545 g001
Table 1. Demographics of participants with at least one sample (n = 199).
TD **
(n = 115)
Non-TD
(n = 27)
ASD
(n = 57)
p-Value from Covariate-Only Model #
Child sex: n (%) 0.04 *
Female56 (48.7)12 (44.4)17 (29.8)
Male59 (51.3)15 (55.6)40 (70.2)
Gestational age at delivery (weeks) Mean (SD)38.84 (1.39)39.29 (1.09)39.33 (1.18)0.06 *
Parity: n (%) 0.80
1 or less53 (46.1)12 (44.4)22 (38.6)
2 or more62 (53.9)15 (55.6)35 (61.4)
Child race: n (%) 0.50
White71 (61.7)15 (55.6)37 (64.9)
Black/African American0 (0.0)2 (7.4)5 (8.8)
Asian18 (15.7)3 (11.1)4 (7.0)
Pacific Islander1 (0.9)0 (0.0)0 (0.0)
Multi-racial25 (21.7)7 (25.9)11 (19.3)
Child ethnicity: n (%) 0.93
Hispanic/Latinx38 (33.0)10 (37.0)21 (36.8)
Not Hispanic/Latinx77 (67.0)17 (63.0)36 (63.2)
Child’s year of birth: mean (SD)2011.83 (2.20)2012.44 (2.06)2012.02 (1.99)0.41
Mother’s age at time of birth: mean (SD)34.41 (4.91)33.44 (4.91)34.18 (5.16)0.66
Maternal BMI before pregnancy: mean (SD)26.12 (5.63)29.31 (9.71)28.67 (7.83)0.01 *
Maximum parental education: n (%) 0.69
High school or less7 (6.1)1 (3.7)4 (7.1)
Some college/2 y vocational degree29 (25.2)12 (44.4)20 (35.7)
Bachelor’s degree43 (37.4)7 (25.9)20 (35.7)
MS’s/Doctorate/Prof. degree36 (31.3)7 (25.9)12 (21.4)
Missing001
Homeowner status: n (%) 0.32
No47 (41.2)12 (46.2)30 (54.5)
Yes67 (58.8)14 (53.8)25 (45.5)
Missing112
Maternal vitamin use at 1 m of pregnancy: n (%) 0.33
No53 (46.5)12 (46.2)34 (60.7)
Yes61 (53.5)14 (53.8)22 (39.3)
Missing111
* The covariate has a p-value < 0.20 in the covariate-only models.  p-value is based on race being included in the model as white vs. others. ** Children were clinically classified as typically developing (TD) based on clinical assessments and scores within the normal range on standardized instruments (ADOS and MSEL). This is not considered a definitive diagnosis, especially at age 3 years, given the possibility that later they might develop conditions that present at older ages (ADHD, OCD, schizophrenia, among others). # p-values for test of differences across all outcomes in one covariate baseline logit model.
Table 2. Selected results from significant (p < 0.05) single-metabolite analyses of log2-transformed, centered, and scaled single-metabolite analyses using annotated metabolites identified from the negative mode in maternal plasma (38 metabolites), in discrete logistic models comparing odds of ASD or odds of Non-TD with TD used as the reference category in each case associated with a 2-fold change in the standardized abundance of a given metabolomic feature, controlling for child’s sex, race, and gestational age in weeks, and maternal pre-pregnancy BMI (n = 184).
MetaboliteOutcome **OR (95% CI)Raw
p-Value
FDR
NorvalineASD1.53 (1.07, 2.26)0.0250.512
Mevalonic acidASD1.68 (1.09, 2.76)0.0270.512
Docosahexaenoic acidNon-TD0.28 (0.14, 0.50)<0.0010.003 *
Palmitic acidNon-TD0.38 (0.20, 0.65)0.0010.020 *
Palmitoleic acidNon-TD0.46 (0.27, 0.73)0.0020.023 *
Gamma-linolenic acidNon-TD0.46 (0.27, 0.74)0.0030.023 *
Myristic acidNon-TD0.49 (0.29, 0.78)0.0040.023 *
Stearic acidNon-TD0.42 (0.22, 0.73)0.0040.023 *
Heptadecanoic acidNon-TD0.47 (0.26,0.77)0.0050.023 *
Linoleic acidNon-TD0.48 (0.27, 0.78)0.0050.023 *
GulonolactoneNon-TD2.70 (1.18, 7.57)0.0380.143
CitrullineNon-TD0.64 (0.41, 0.97)0.040.143
HypoxanthineNon-TD0.64 (0.40, 0.99)0.0460.143
Glyceric acidNon-TD0.63 (0.40, 0.99)0.0460.143
* indicate FDR p-value < 0.05. ** Numbers of subjects in each group: ASD (n = 57), Non-TD (n = 27), and TD (n = 115).
Publisher’s Note: MDPI stays neutral with regard to jurisdictional claims in published maps and institutional affiliations.

