Article

Effects of Dufulin on Oxidative Stress and Metabolomic Profile of Tubifex

Innovation Center of Pesticide Research, Department of Applied Chemistry, College of Science, China Agricultural University, Beijing 100193, China
*
Author to whom correspondence should be addressed.
Metabolites 2021, 11(6), 381; https://doi.org/10.3390/metabo11060381
Submission received: 5 May 2021 / Revised: 3 June 2021 / Accepted: 3 June 2021 / Published: 11 June 2021
(This article belongs to the Special Issue Application of Metabolomic in Ecotoxicology)

Abstract

:
Dufulin is a highly effective antiviral pesticide used in plants. In this study, a seven-day experiment was conducted to evaluate the effects of Dufulin at five different concentrations (1 × 10⁻⁴, 1 × 10⁻³, 1 × 10⁻², 0.1, and 1 mg/L) on Tubifex. LC-MS-based metabolome analysis detected a total of 5356 features in positive and 9110 features in negative, of which 41 showed significant changes and were identified as differential metabolites. Four metabolic pathways were selected for further study. Detailed analysis revealed that Dufulin exposure affected the urea cycle of Tubifex, probably via argininosuccinate lyase (ASL) inhibition. It also affected the fatty acid metabolism, leading to changes in the concentration of free fatty acids in Tubifex. Furthermore, the changes in metabolites after exposure to Dufulin at 1 × 10⁻² mg/L were different from those at the other concentrations.

1. Introduction

Pesticides play an important role in human health protection and agricultural production [1]. Scientists have developed a variety of pesticides with higher effectiveness and lower toxicity in the past few decades [2]. Among the different pesticides, Dufulin ([(2-fluorophenyl)-(4-methylbenzothiazol-2-ylamino)-methyl]-phosphonic acid diethyl ester), an α-amino phosphonic acid ester [3], is a highly effective antiviral agent widely used against plant viruses. It was first developed in 2001 by Guizhou University [4,5]. Dufulin functions by activating the plants’ systemic acquired resistance (SAR) [3], aiming at Harpin binding protein-1 (HrBP1) [6]. Researchers have also found that Dufulin inhibits the RNA-silencing suppressor (P6) of the virus, especially the Southern rice black-streaked dwarf virus (SRBSDV) [7], protecting plants against the viral disease [8]. The Ministry of Agriculture of China has registered Dufulin as an antiviral pesticide for use in rice, tobacco, and vegetables [3]. Dufulin is an eco-friendly bioisostere of natural amino acids [3]. Pesticides sprayed on the field may stay on plants in small amounts, which eventually reach the soil [9,10]. Soil microorganisms degrade the residues of pesticides, including Dufulin [3]. However, the non-degraded residues pass from the soil into the water through runoff [11] or from crops to the air by volatilization and wind erosion and subsequently enter the rivers via rainfall [12]. These residues eventually reach the rivers [13] and deposit on the sediments [14,15]. Studies have identified approximately 65 different kinds of pesticides’ residues in the surface sediments of the China East Sea [16]. Therefore, the pesticide pollution of an aquatic environment should be urgently evaluated.
Sludge worm (Tubifex tubifex) is an aquatic oligochaete, which is ubiquitous in nature [17]. Due to the double-phase life mode, it plays an essential role in the aquatic ecosystem. They live in water and sediment [18]. The Tubifex ingests sediment particles and feeds on fine organic matter [19]. It can live in a wide variety of aquatic environments, ranging from pure undernourished water to hypereutrophic water [20], and can survive in a heavily polluted environment [21]. Higher organisms, such as fish, feed on Tubifex, and therefore, the sediment-related pollutants get transferred easily to higher trophic levels through the food chain [22,23]. Thus, Tubifex, an excellent bioindicator, is widely used in toxicologic research [24]. Several studies have used Tubifex to evaluate the toxicity of pesticides. Di. et al. [25] reported a positive effect of Tubifex on the degradation and diffusion of Metalaxyl in sediments. Li. et al. [26] found that Tubifex reduced the concentration of Dufulin in soil and accelerated the process of environmental remediation and detoxification. However, these studies have focused on the selective metabolism of pesticides in Tubifex. A more comprehensive assessment of the pesticide impact on non-target organisms, such as Tubifex, is necessary, and hence, the impact of pesticides on non-target organisms’ metabolism needs to be studied.
Metabolomics, an established omics [27], enables a comprehensive assessment. This method monitors the metabolic networks in vivo and detects small changes in the corresponding biomarkers [28,29]. It helps identify biomarkers and discover the driving forces of metabolic processes [30,31,32,33,34]. Metabolomics methodologies fall into two distinct groups: targeted metabolomics and untargeted metabolomics [35]. In targeted metabolomics, the relative concentration and richness of metabolites can be predefined quantitatively by monitoring the signals corresponding to preselected responses through various detection methods like tandem mass spectrometry (MS/MS) [35,36]. Targeted metabolomics provides an excellent quantitative analysis; however, the strategies adopted have limited coverage of metabolites [37,38]. Meanwhile, untargeted metabolomics focuses on the comprehensive detection of metabolites without bias [35,39]. Metabolomics, both targeted and untargeted, generally adopts techniques like nuclear magnetic resonance (NMR) [40] or mass spectrometry (MS) [41]. The original spectrogram is processed and analyzed to obtain the data, compared with a standard database (HMDB, KEGG) to obtain the results [41,42]. Currently, a combination of multiple platforms has been used for comprehensive analysis, such as the liquid chromatography-mass spectrometry (LC-MS)-based metabolomics [43,44]. The untargeted metabolomics uses LC-MS due to high-speed scanning and ideal analytic stability [38].
Oxidative stress, an important indicator of metabolic response and widely associated with metabolic changes, generates peroxides and free radicals and leads to cellular damage [45]. Recent studies have shown that harmful substances from outside, such as pesticides, stimulate the production of reactive oxygen species (ROS) in organisms [46]. These ROS interact with cell surface biomolecules [47], such as proteins and lipids [48], leading to loss or change in normal metabolic functioning [49]. Enzymes like SOD can eliminate these ROS and reduce oxidative damage [50]. However, oxidative damage disrupts the metabolic balance [51] and leads to changes in cell signaling. Therefore, the content of superoxide dismutase (SOD) and catalase (CAT) should be analyzed to determine the degree of oxidative stress damage [52] induced by xenobiotics, such as pesticides.
In this study, the toxicity of Dufulin on Tubifex was evaluated using the LC-MS-based metabolomics approach combined with oxidation damage detection. The study’s findings may help understand the mode of action of Dufulin and the mechanism of impact on Tubifex.

2. Results and Discussion

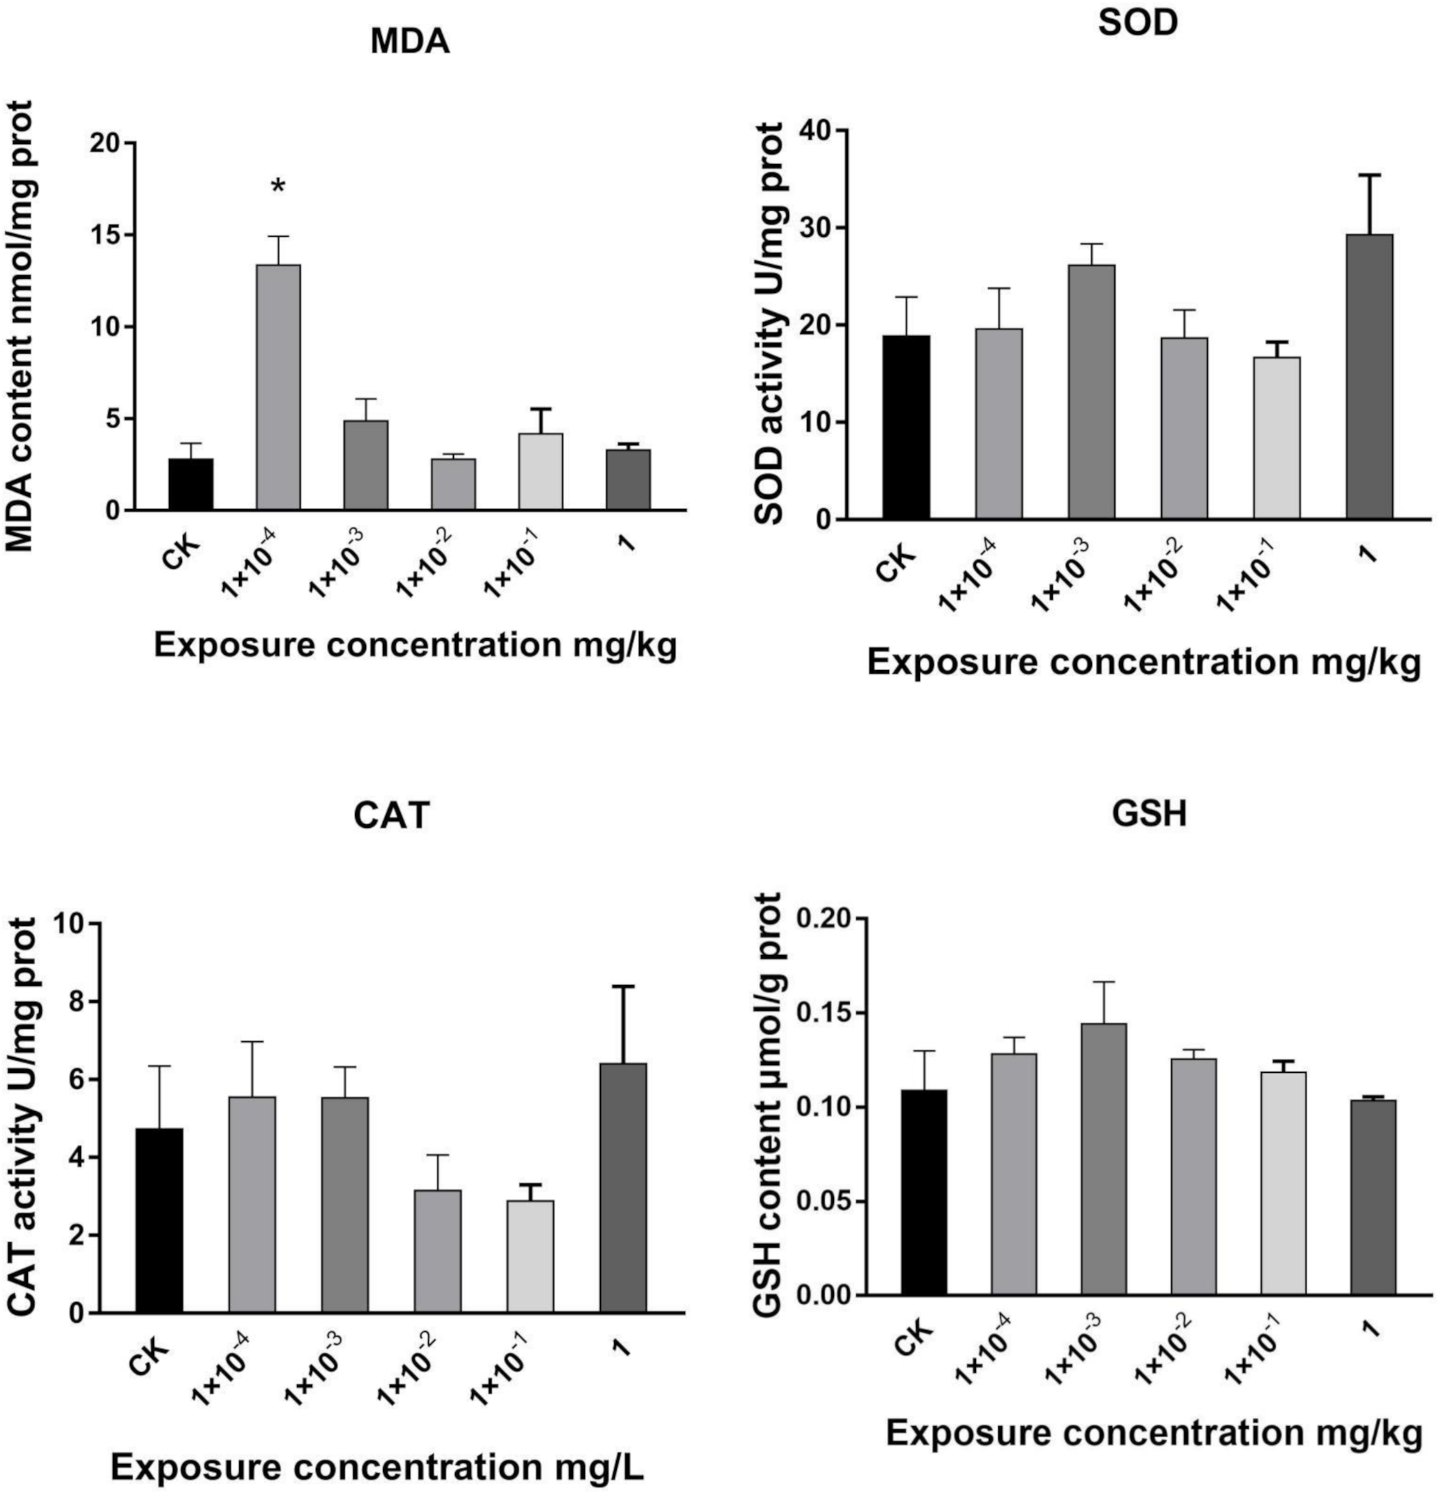
2.1. Effects of Dufulin on Oxidative Stress in Tubifex

Pesticides induce oxidative stress by generating ROS [53]. Oxidative stress indicators, such as malondialdehyde (MDA), SOD, glutathione (GSH), and CAT, were used to evaluate the toxicological effect of Dufulin on Tubifex after seven days of exposure. Figure 1 shows that the MDA content increased significantly after Dufulin treatment at a concentration of 1 × 10⁻⁴ mg/L. No significant changes were observed in the other groups. Lipid peroxidation is an important indicator of oxidative damage in an organism [54]. The primary and secondary products of lipid peroxidation decompose and form MDA. Thus, MDA acts as an index of lipid peroxidation [55]. CAT is an antioxidant enzyme that eliminates excess hydrogen peroxide (H2O2) produced by oxidative damage [56]. Superoxide dismutase (SOD) protects the organism against oxidant damage, and therefore, SOD induction is associated with increased tolerance to oxidant stress [57]. Meanwhile, GSH, synthesized from glutamic acid, glycine, and cysteine [58], an abundant physiological nucleophile in cells [59], captures active heterometabolites through its cysteine sulfhydryl group and forms adducts under the action of glutathione transferases (GSTs) to protect cells [60]. However, in this study, no significant changes were observed in the GSH content and SOD and CAT activities. To conclude, the exposure of Dufulin at 1 × 10⁻⁴ mg/L increased MDA, with no significant change at other concentrations. This change may be related to lipid peroxidation. Whether Dufulin leads to the change of lipid peroxidation level still needs more data support. Meanwhile, SOD, CAT, and GSH showed no significant changes after exposure to Dufulin at any concentration. Under the exposure of Dufulin, the MDA content of Tubifex present a non-linear effect. The possibility of non-linear effect responses is in endpoints that are reflective of changes of metabolites rather than general toxicity [61].

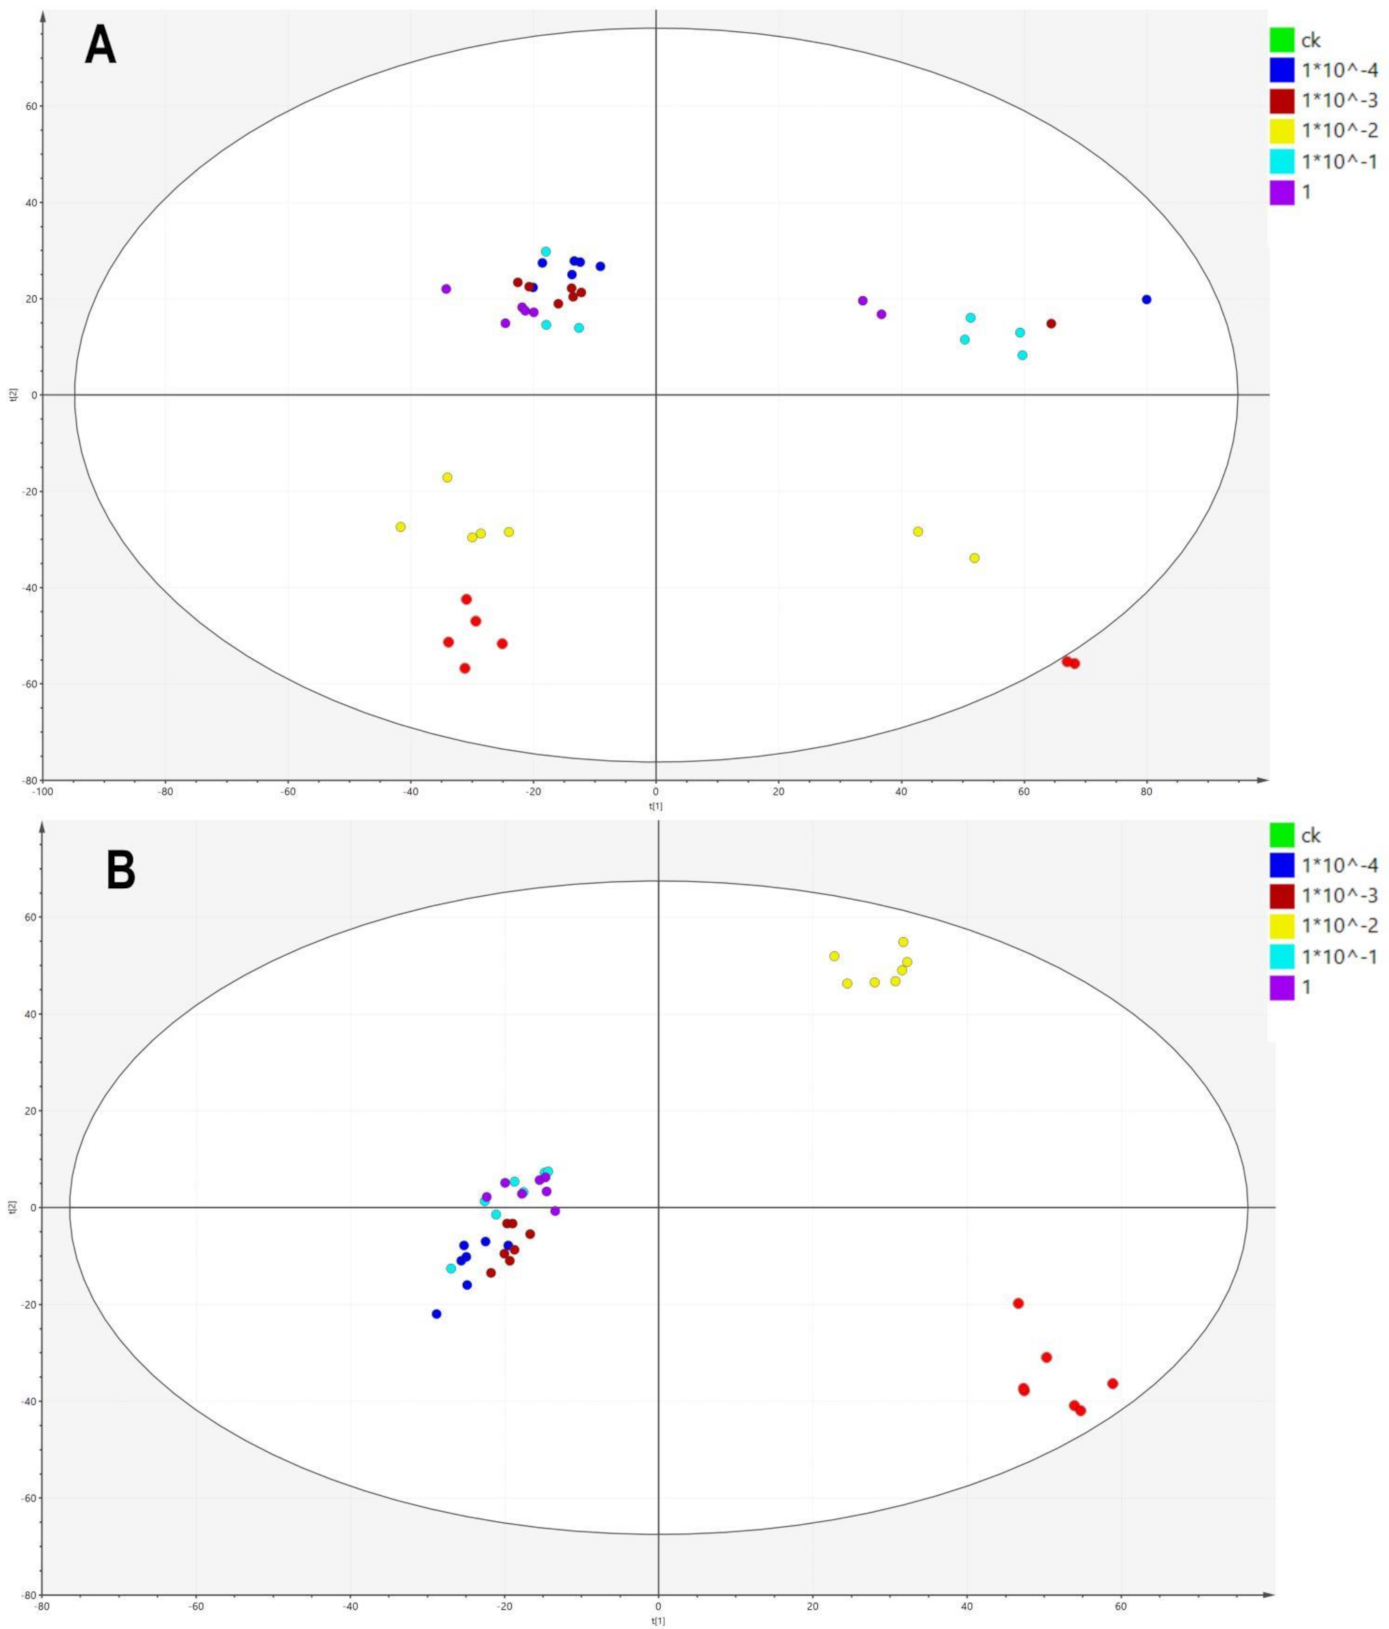
2.2. LC-MS-Based Metabolomic Data

PCA was performed for an initial review of the data set and to detect outliers affecting the analysis. The analysis showed a clear separation of the control group (CK) and the different treatment groups (Figure 2A). Among them, the group exposed to 1 × 10⁻² mg/L Dufulin was more obviously separated from the other groups. To further study the influence of Dufulin on Tubifex, a PLS-DA (Figure 2B) model was built to supervise the data analysis. The PLS-DA model was used to process the data, and the differences between treatment groups and control groups with various concentrations were analyzed. A heatmap (Figure 3) showed that the CK group and treatment groups were separated clearly.

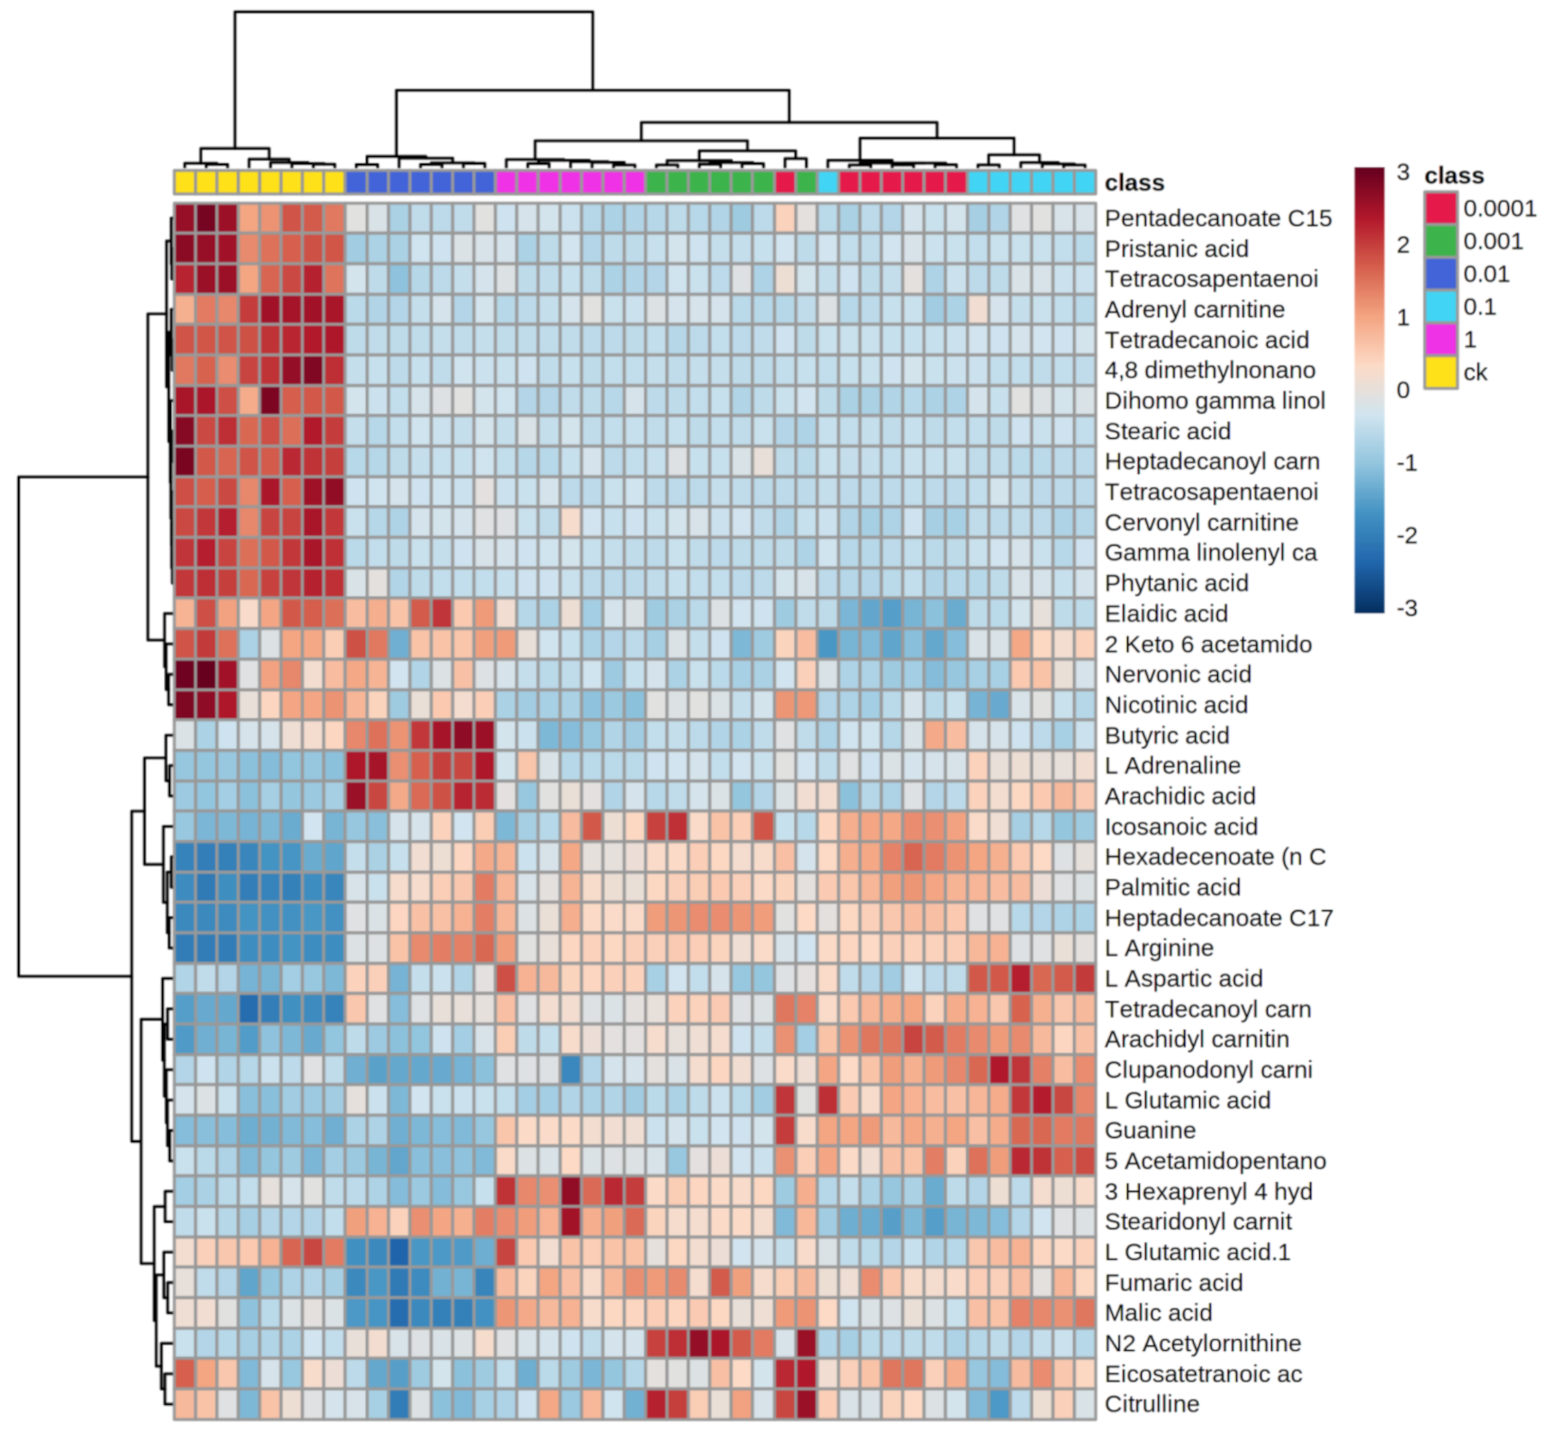
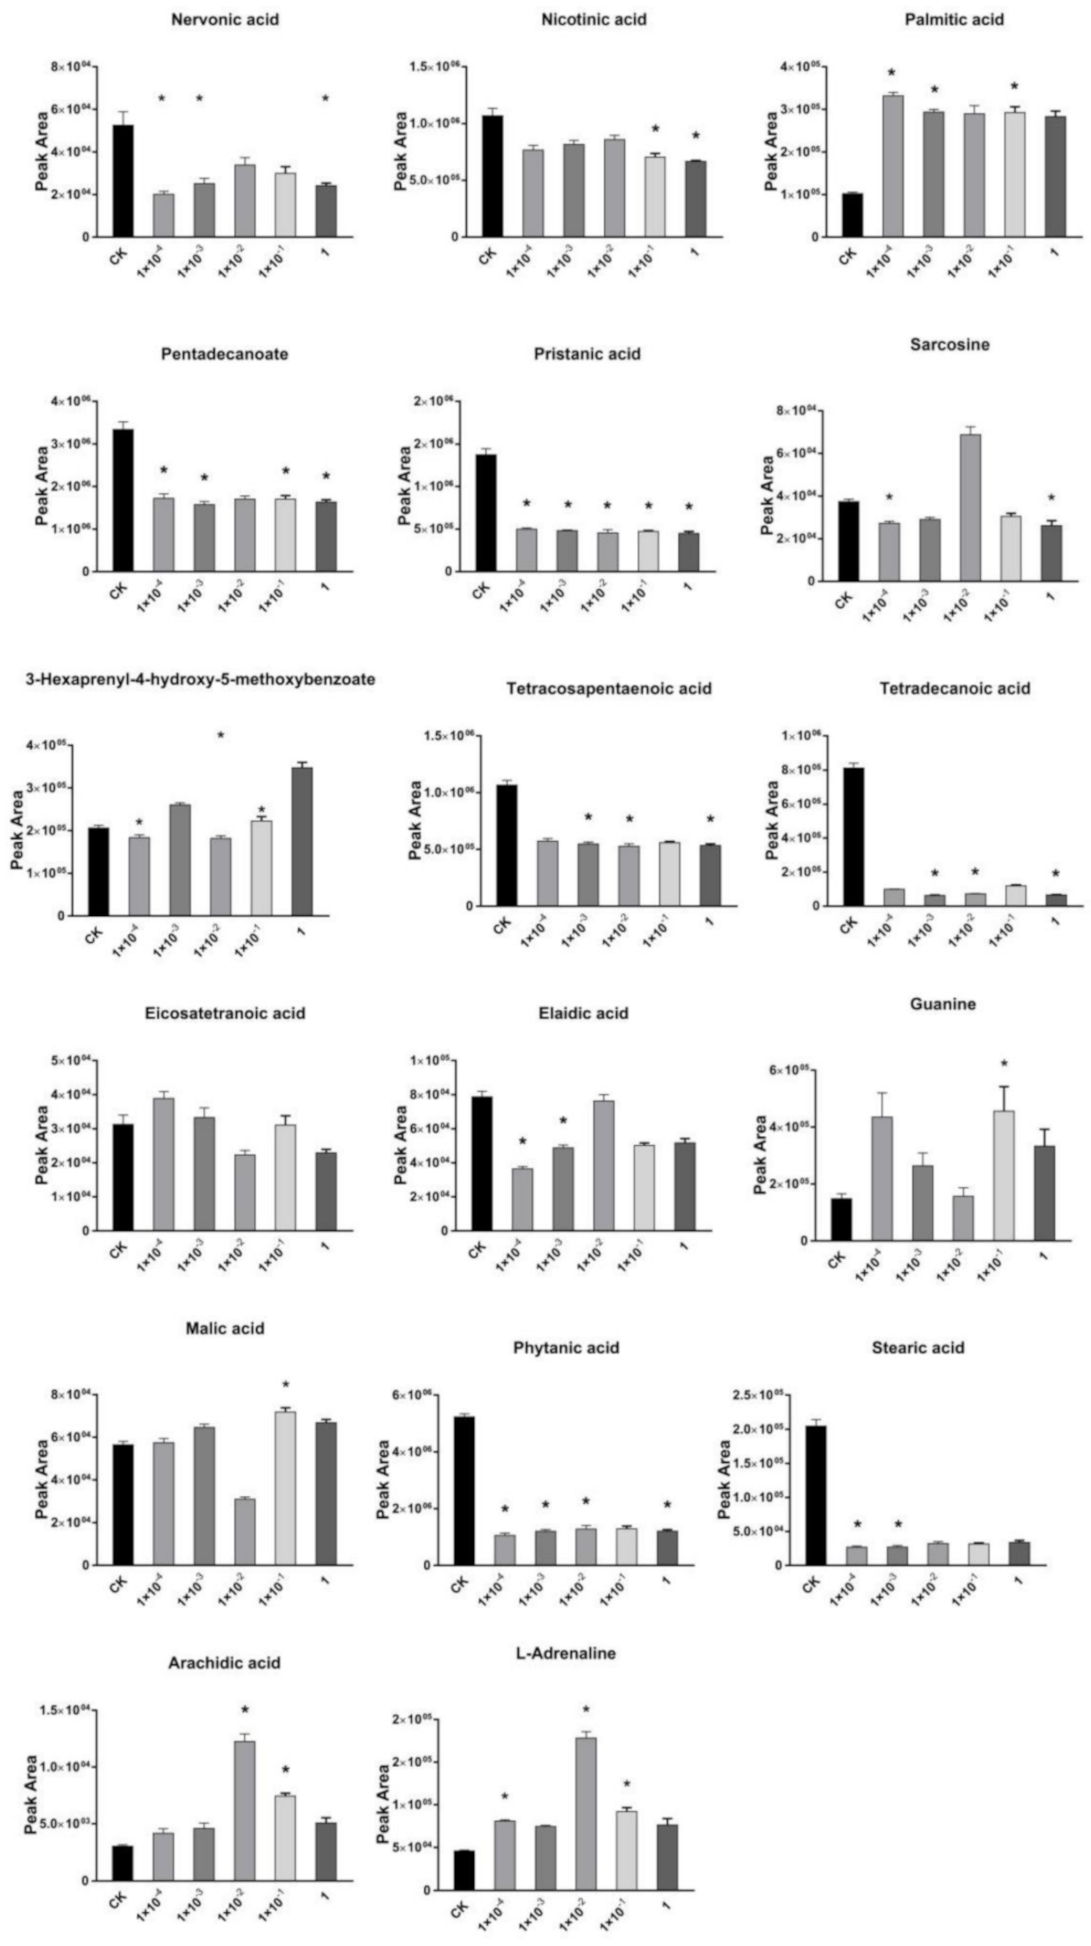
2.3. Effects of Dufulin on Tubifex Metabolism

A total of 5356 features in positive and 9110 features in negative were obtained after processing the MS data using XCMS software (The Scripps Research Institute, La Jolla, CA, USA). Based on VIP (>1), p-value (<0.05), and fold change (>1.5), 41 differential metabolites were identified in each treatment group after exposure to Dufulin.
MetaboAnalyst was used to perform the metabolic pathway analysis (Figure 4) using the 41 differential metabolites identified to understand the influence of Dufulin at different concentrations on Tubifex. Significant changes were observed in many compounds following Dufulin exposure.
Nervonic acid, pristanic acid, tetracosapentaenoic acid, tetradecanoic acid, palmitic acid, stearic acid, tetracosahexaenoic acid, phytanic acid, petadecanoate, and nicotinic acid levels decreased significantly after exposure to Dufulin, while heptadecanoate, hexadecenoate, and arachidic acid increased. The eicosatetraenoic content increased in groups exposed to Dufulin at 1 × 10⁻⁴ and 1 × 10⁻¹ mg/L, while it decreased at other concentrations. At 1 × 10⁻⁴ and 1 × 10⁻² mg/L of Dufulin, the butyric acid content increased (Figure S1), while it decreased at other concentrations. Nervonic acid is an essential functional long-chain fatty acid related to the neural system [62,63]. These changes of fatty acids in treatment groups reveal that the fatty acid activation pathway was affected after exposure to Dufulin at five concentrations used in this study.
Activation of fatty acids is closely related to oxidative phosphorylation and plays an important role in fatty acid metabolism (Figure 5) [64]. The concentrations of arachidyl carnitine and tetradecanoyl carnitine were upregulated at the five concentrations (Figure S2). On the contrary, cervonyl carnitine, adrenyl carnitine, gamma-linolenyl carnitine, dihomo-gamma-linolenyl carnitine, and heptadecanoyl carnitine decreased. The content of tetracosatetraenoyl carnitine and tetracosapentaenoyl carnitine increased at 1 × 10⁻² mg/L, while that at other concentrations decreased. However, the content of cupanodonyl carnitine and heptadecanoyl carnitine decreased at 1 × 10⁻² mg/L Dufulin, while that at other concentrations increased. The content of stearidonyl carnitine decreased at 1 × 10⁻⁴ and 1 × 10⁻¹ mg/L, while it increased at the other concentrations. The change of carnitine in the treatment groups reveals that the carnitine shuttle was affected upon Dufulin exposure. Carnitine transfers long-chain fatty acids into the mitochondria for β-oxidation [65]. Carnitine performs its scavenging function by binding to acyl residues derived from the intermediate metabolism of amino acids [66,67]. Carnitine is an important factor in regulating the cellular energy metabolism balance of fatty acids and glucose. In humans and other mammals, carnitine deficiency can lead to hyperlipidemia and systemic metabolic syndrome [68]. In this study, the exposure of Dufulin affected the transport of fatty acids, in which carnitine was involved, and affected the concentration of free fatty acids in Tubifex. This effect subsequently influenced Tubifex’s reaction to oxidative damage.

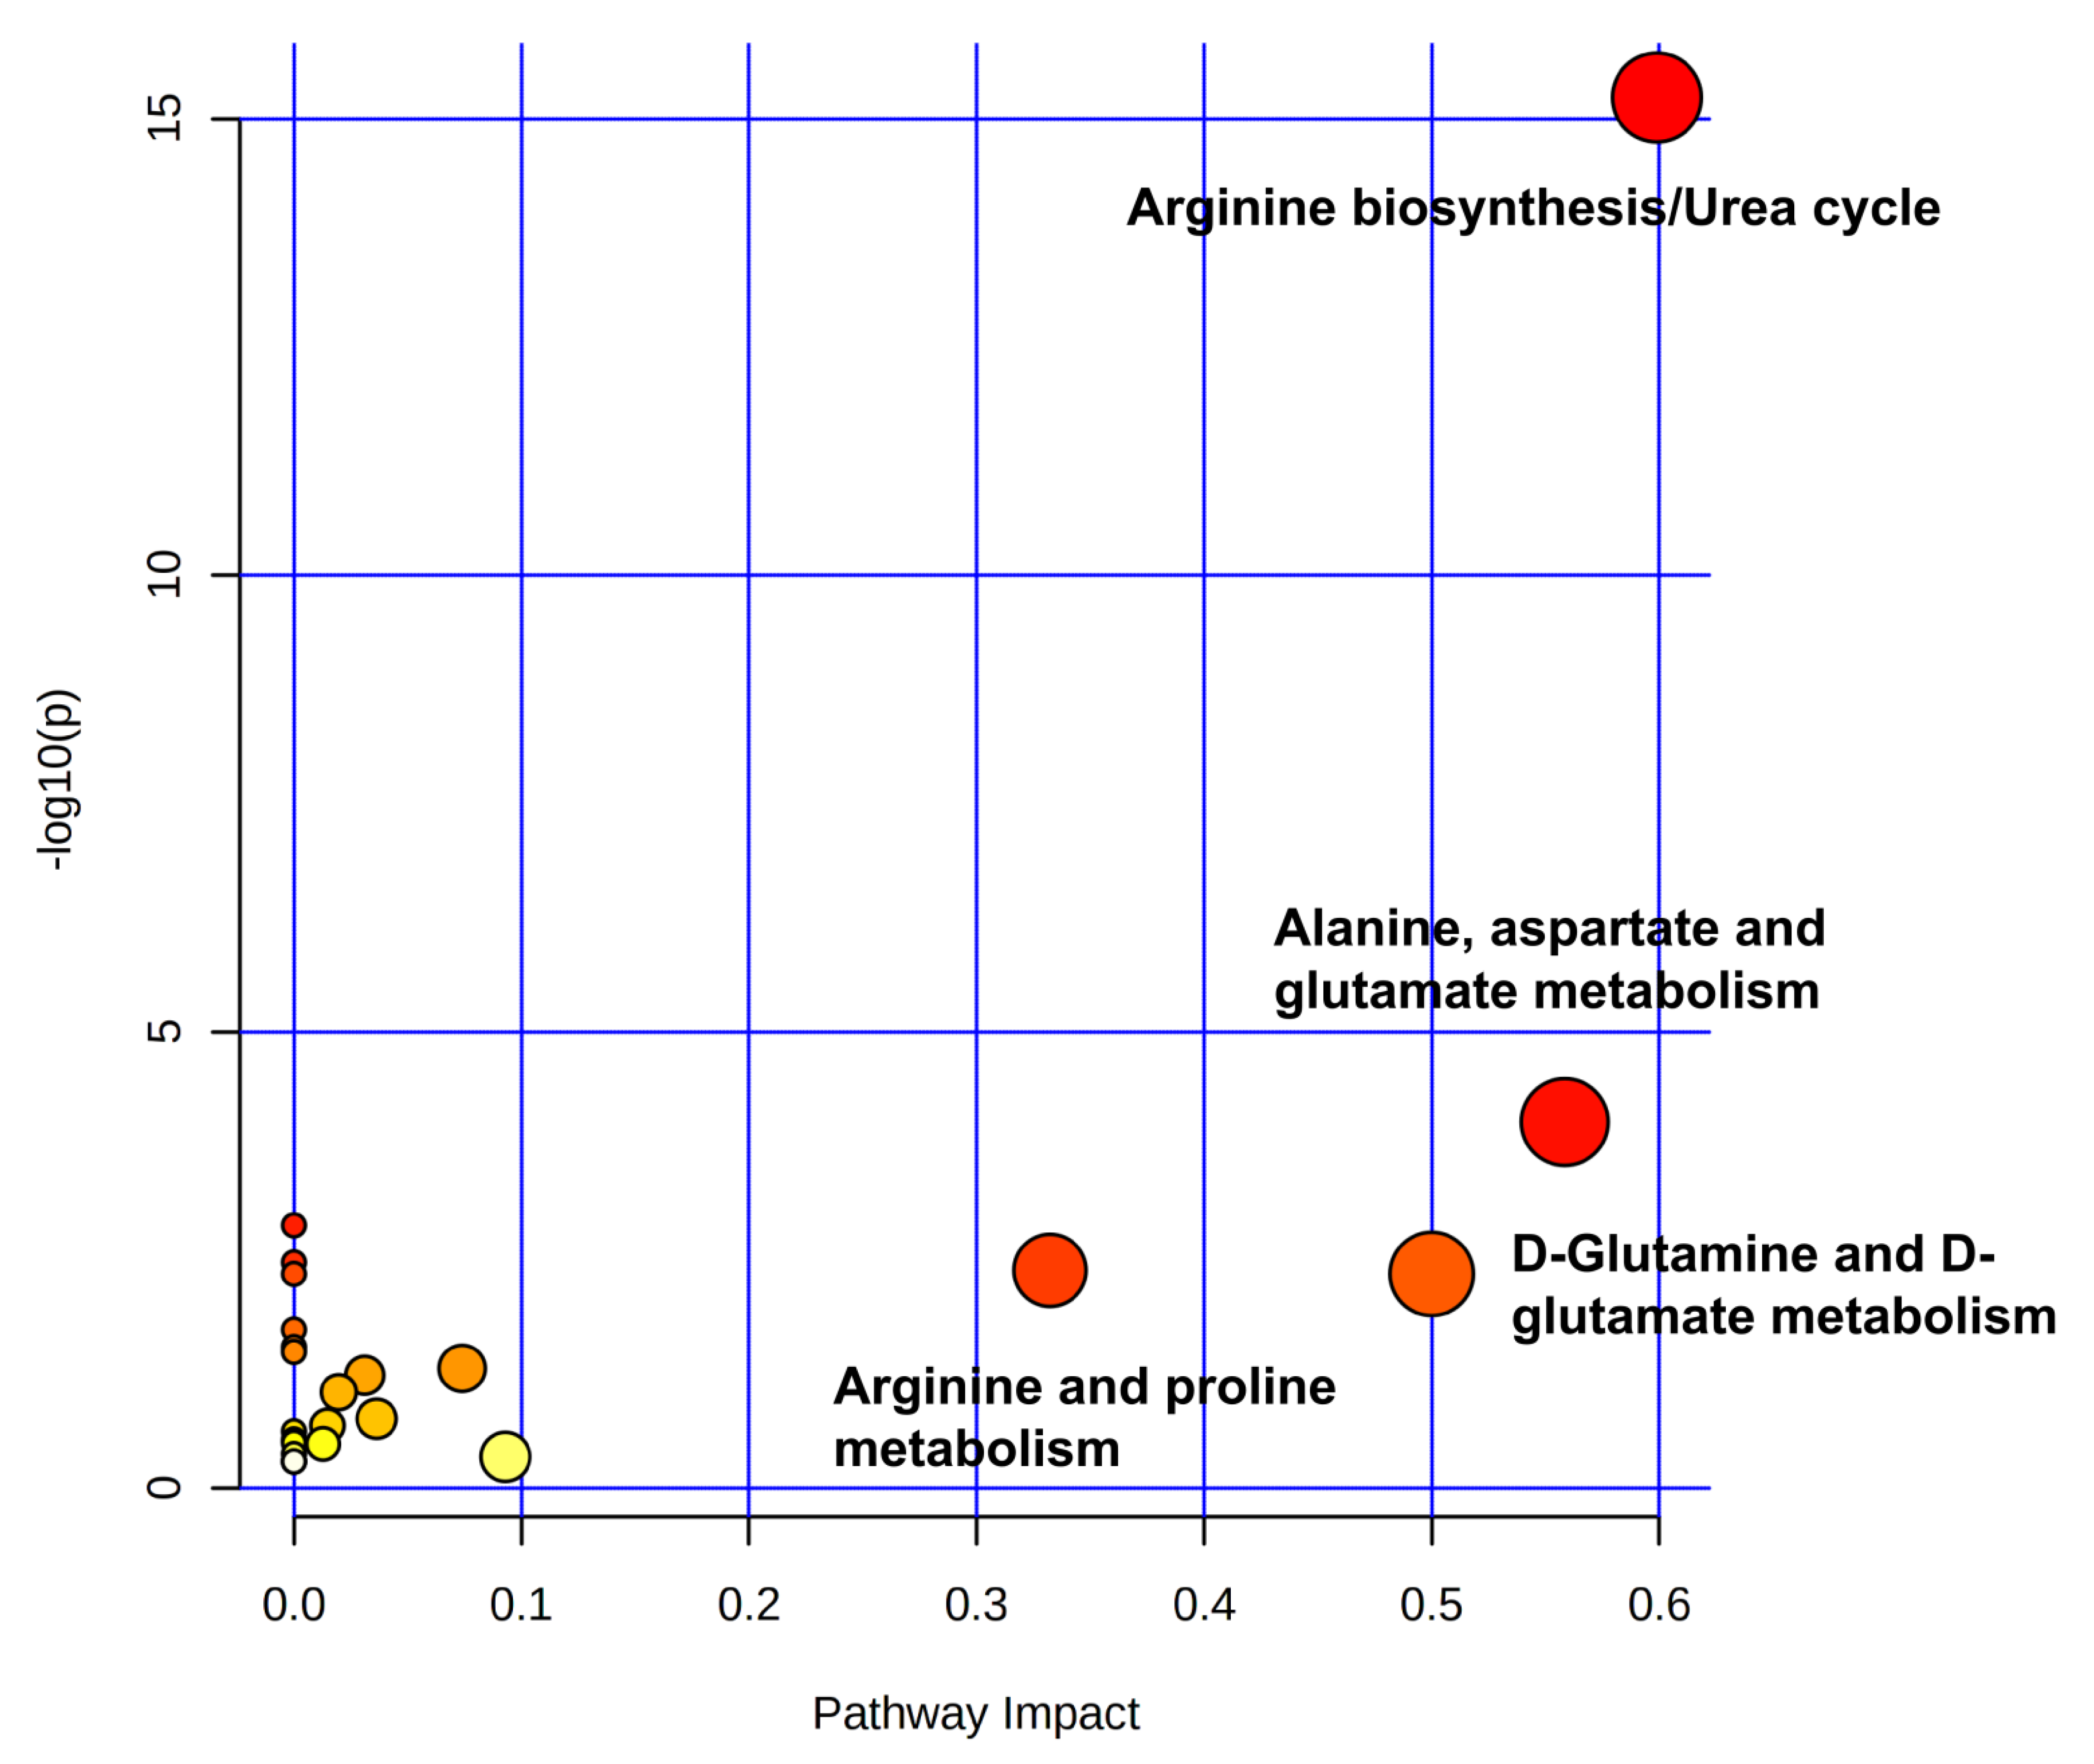
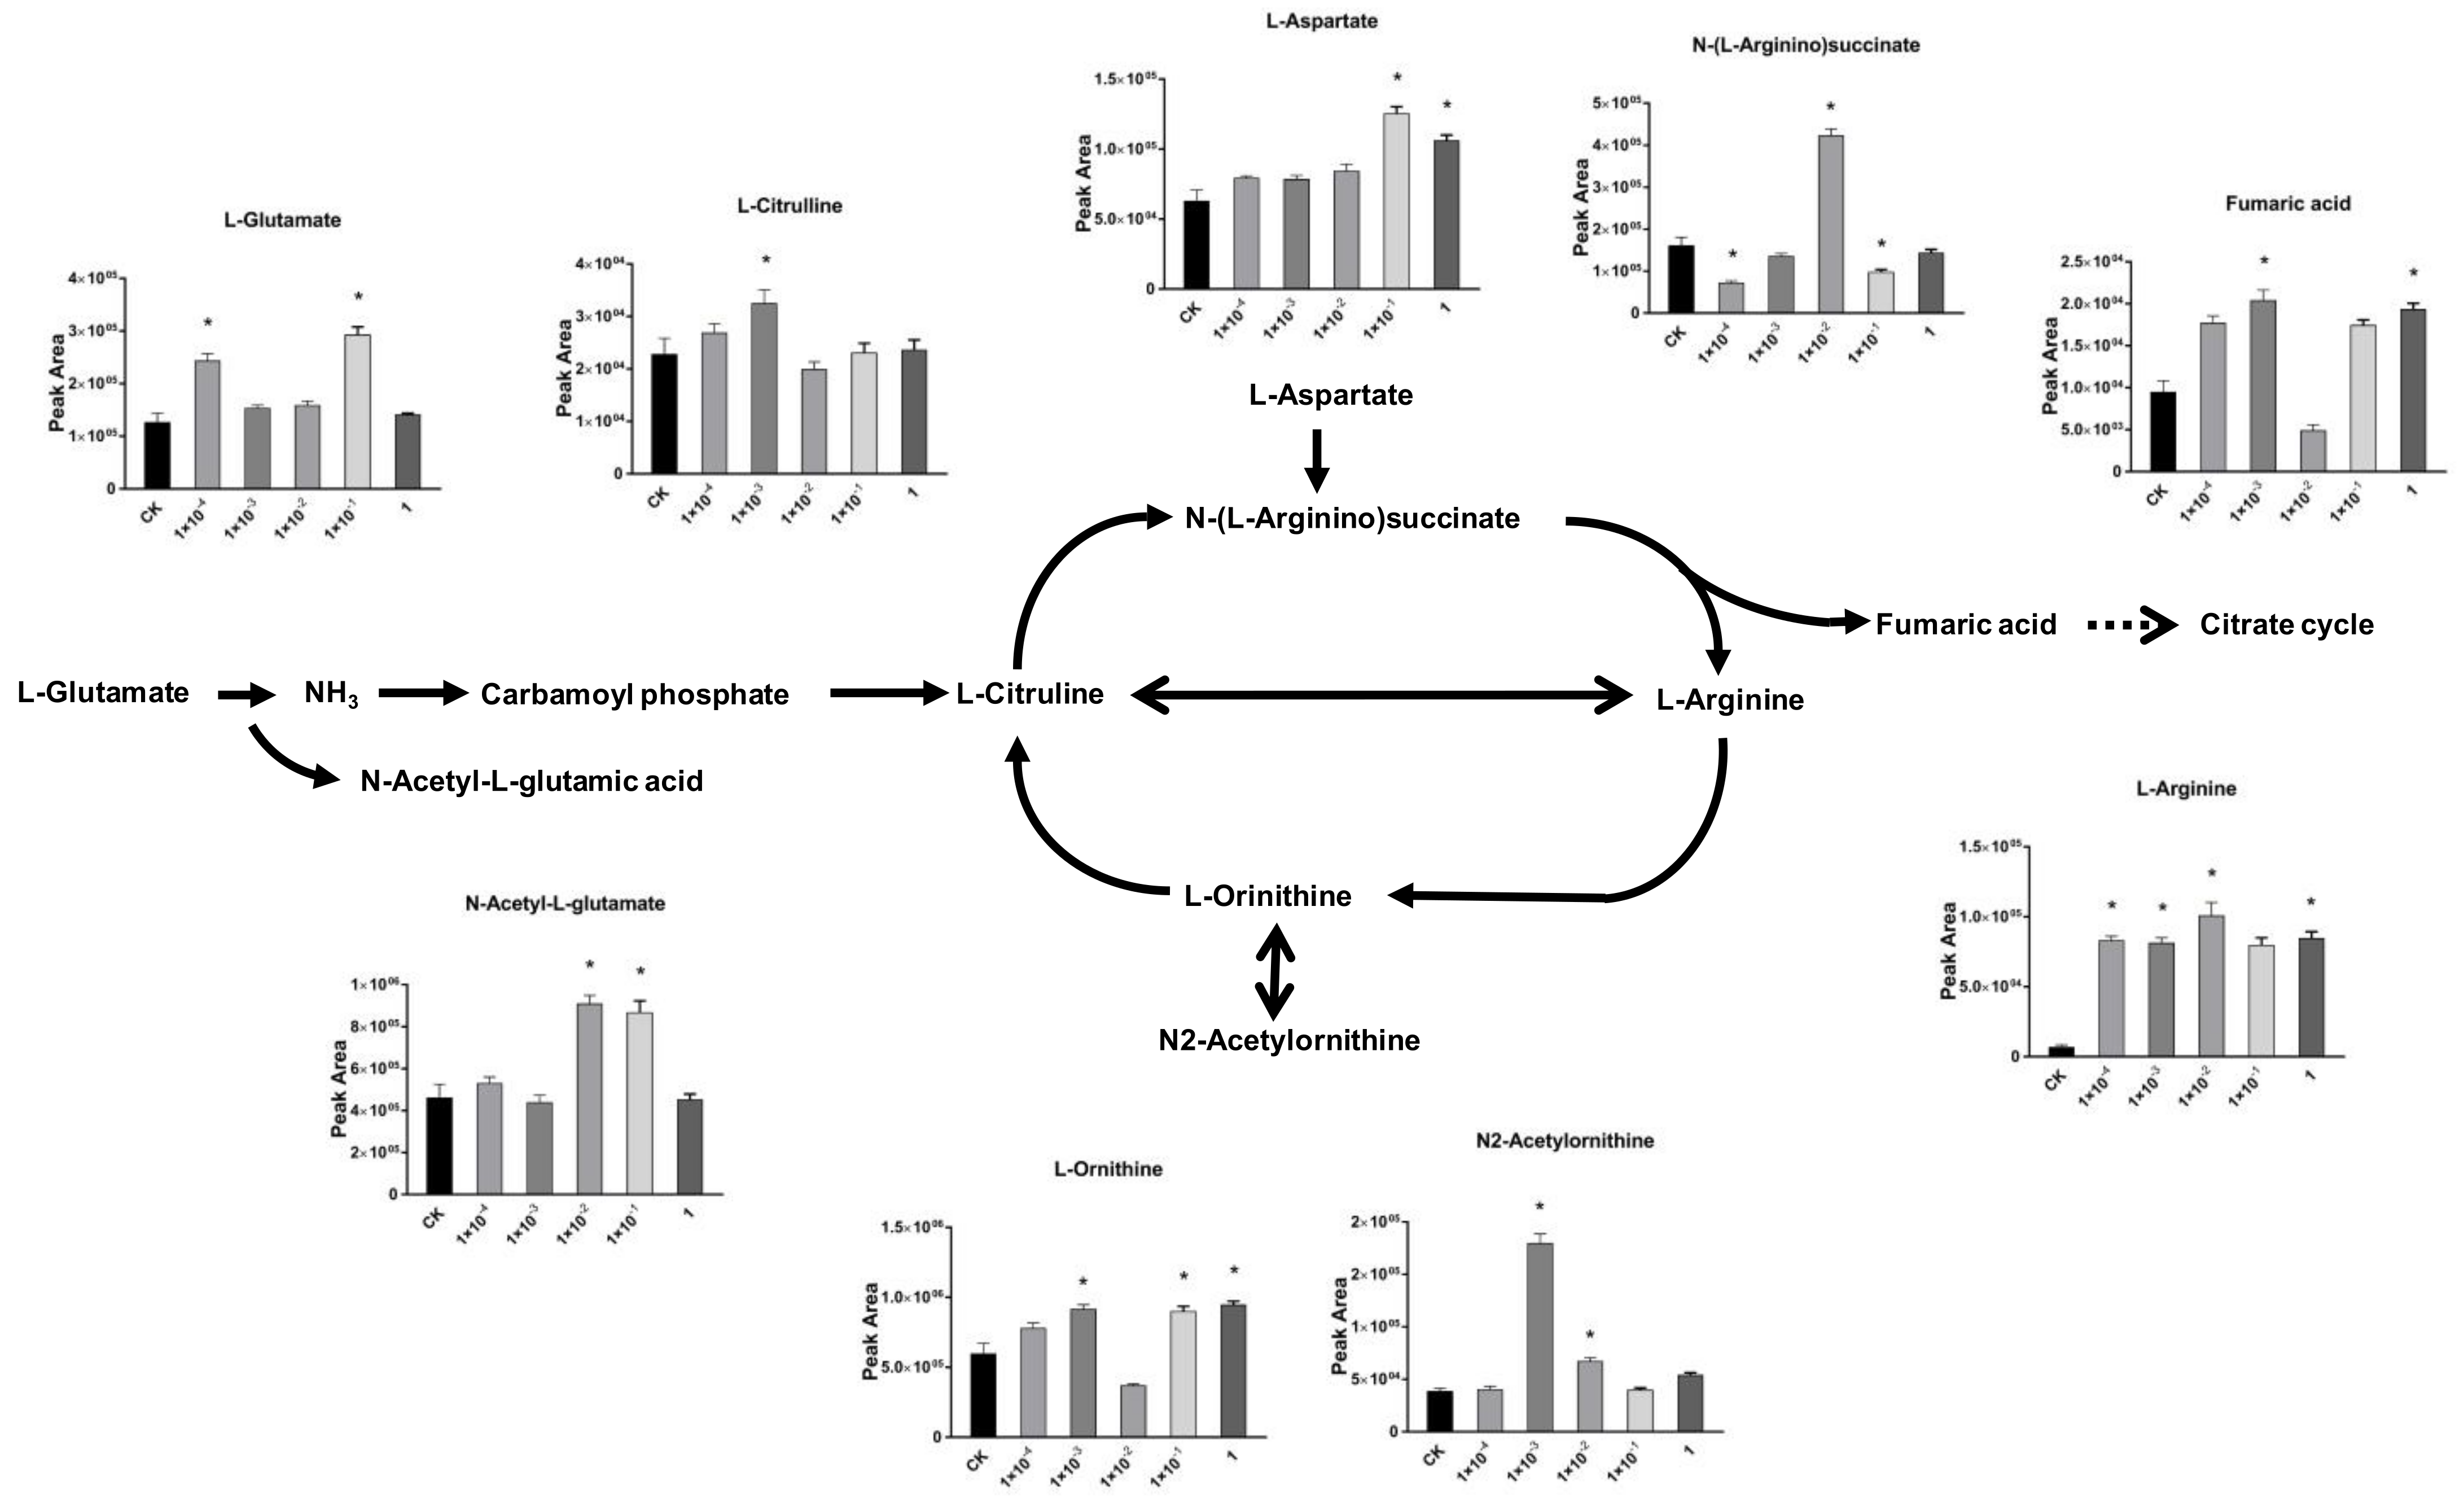
2.4. Impact of Dufulin on Tubifex Urea Cycle

Among the different metabolic pathways in Tubifex, arginine biosynthesis was the most significantly affected at all concentrations. Nitrogen oxide (NO) is synthesized from arginine through a series of metabolic pathways [69]. Arginine plays several important metabolic roles, including the transport of nitrogen and the synthesis of protein via the urea cycle [70]. Arginine can be synthesized into ornithine under the action of arginase [71]. The urea cycle is a part of the amino acid metabolism in animals, and several pathways involving arginine metabolism overlap with the urea cycle [72]. To further explore the impact of Dufulin on Tubifex, the urea cycle, with more components affected by Dufulin, was analyzed (Figure 6). In the urea cycle, the metabolites showed different changing trends under different Dufulin concentrations. Metabolome analysis showed that the concentration of L-glutamate increased while that of downstream N-acetyl-L-glutamate decreased at 1 × 10⁻³ mg/L and 1 mg/L Dufulin exposure. Meanwhile, at 1 × 10⁻² and 1 × 10⁻¹ mg/L, N-acetyl-L-glutamate increased significantly. The content of L-citrulline increased at 1 mg/mL, while it dropped at the other concentrations. The content of L-ornithine decreased at 1 × 10⁻² mg/L, while it increased at other concentrations. L-aspartate concentration increased in all treatment groups. The content of N-(L-Arginino)-succinate increased at 1 × 10⁻² mg/L, while it decreased at other concentrations. The content of fumaric acid decreased at 1 × 10⁻² mg/L and increased at other concentrations. The cleavage of N-(L-arginino)-succinate, catalyzed by the enzyme argininosuccinate lyase (ASL), is a key step in the urea cycle and arginine metabolism. Studies have shown that fluoride derivatives inhibit ASL. Fluoride derivatives form a tightly bound intermediate with ASL, which inactivates but does not kill the enzyme. The enzyme activity can be restored under appropriate conditions [73]. Thus, opposite trends were observed at 1 × 10⁻² mg/L and other concentrations. ASL activity decreased at 1 × 10⁻² mg/L, while it got activated at other concentrations. To conclude, Dufulin exposure had significant effects on the urea cycle of Tubifex. The increase in N-(L-arginino)-succinate and the decrease in fumarate revealed the inactivation of ASL. Thus, Dufulin probably acted on the urea cycle by inhibiting ASL, leading to urea cycle disorder. Earthworms with a complete urea cycle may be used to detoxify protein catabolism by increasing the production of excess ammonia [74]. In humans, the urea cycle disorder leads to the accumulation of ammonia and other neurotoxic byproducts that can lead to neurotoxicity and hyperaminemia [75], leading to irreversible neurological damage or death [76]. However, more research is needed to support the effect of urea cycle disorder in Tubifex.

3. Materials and Methods

3.1. Chemicals and Materials

Dufulin analytical standard (purity 98.5%) was obtained from the Institute for Guangxi Rural Research (Guangxi, China). Tubifex was purchased from the Beijing Da Senlin Flower Market (Beijing, China) [53].

3.2. Experimental Design

3.2.1. Growth of the Experimental Organism

Tubifex worms were maintained in a 5 L beaker containing deionized water (temperature 21 ± 1 °C and no sediment, with continuous aeration provided using an aerator under laboratory conditions for 72 h for acclimatization before the experiment. The water was replaced daily.

3.2.2. Exposure of Dufulin on Tubifex

The exposure experiment was conducted using six groups: CK and five treatment groups. One liter of water was added. In the treatment groups, Tubifex worms were exposed to Dufulin at 1 × 10⁻⁴, 1 × 10⁻³, 1 × 10⁻², 1 × 10⁻¹, and 1 mg/L concentrations. In the control group, the same volume of solvent was added. Three replicates were maintained per group. First, an average of 50 g (±10 g) of Tubifex was added to each beaker and exposed to natural light for 7 days at 18 °C (±1 °C). Water and pesticides were changed daily to maintain a constant exposure concentration. After seven days of exposure, the worms were removed from the beaker, and the dead remains were separated from the living individuals. The worms were frozen in liquid nitrogen, lyophilized, and stored at −10 °C.

3.2.3. Sample Pretreatment for the Analysis of Oxidative Stress

Worms (1 g) were selected from each replicate of each treatment group and placed in a 2 mL centrifuge tube. Then, a stainless steel ball (5 mm diameter) was placed in the tube, and the worms were ground evenly using the Retsch MM 400 mixer grinder. To this grinding solution, 5 mL of 1 M phosphatic buffer solution (PBS; pH = 7.0) was added and vortexed for 30 s. The mixture was then centrifuged at 14,000 rpm for 20 min at 4 °C. The supernatant was separated, and the procedure was done twice to eliminate any particulate suspensions.

3.2.4. Metabolomic Analysis of Tubifex by LC-Q-TOF

Freshly collected Tubifex worms were dried in a lyophilizer to constant weight, and the dried sample was placed in a 2 mL centrifuge tube. Then, a stainless steel ball (5 mm diameter) was placed in each tube, and the worms were ground evenly using a Retsch MM 400 mixer grinder. The homogenized tissue was mixed with 1.2 mL of 80% methanol, vortexed for 30 s, treated with ultrasound for 15 min, and placed at 4 °C for 30 min for thorough and even extraction. This mixture was centrifuged at 14,000 rpm and 4 °C for 20 min, and the supernatant was separated into a new tube with a pipette.
One milliliter of the supernatant was taken in a glass injection vial for metabolomic analysis. The metabolites were analyzed using the Agilent 1260 SL LC-6520 Quadrupole-Time of Flight (Q-TOF) MS system (Agilent Technologies, Santa Clara, CA, USA) [77,78,79,80].
A Waters XBridge BEH Amide column (15 cm × 2.1 mm, 2.5 μm) was used for separation. The mobile phase consisted of ACN and H2O, both containing 5 mM ammonium acetate and 0.1% acetic acid. Gradient elution was performed as follows: 95% ACN for 1.5 min, 95−78% ACN from 1.5 to 6.0 min, 78−50% ACN from 6.0 to 9.0 min, 50% B from 9.0 to 15.0 min, restoration to 95% ACN from 15.0 to 17.0 min, and continued 100% B from 17.0 to 30.0 to equilibrate the LC column.
The ESI conditions were as follows: electrospray ion-source ESI Agilent Jet Stream Technology in positive ionization mode; voltage 3.8 kV; desolvation temperature 325 °C; cone flow 20 L/h; desolvation gas flow 600 L/h; nebulizer pressure 45 psi, N2 drying gas; MS scan rate of 1.03 spectra/s across the range m/z 60–1000. Data were acquired using MassHunter Data Acquisition Workstation software (Agilent Technologies).

3.3. Biochemical Parameters Measurement

The MDA content, the catalase (CAT) and total superoxide dismutase (T-SOD) activities, the GSH content, and the total protein content of the tissue samples were measured using the kits purchased from Nanjing Jian Cheng Bioengineering Institute (Nanjing, China), following the manufacturer’s instructions. We measured the protein content of each Tubifex sample, so we divided each of measured content or activities by the total protein content. Three replicates were maintained per sample, and each sample was measured three times. One unit of SOD activity was defined as the quantity of enzyme required for 1 mg tissue proteins in 1 mL of a reaction mixture SOD inhibition rates to about 50% as monitored at 550 nm. One unit of CAT activities was defined as 1 mg tissue proteins consumed 1μmol H2O2 at 405 nm per second. The activities of SOD and CAT was demonstrated with U mg−1 proteins.

3.4. Data Analysis

The XCMS software (The Scripps Research Institute, La Jolla, CA, USA) was used for preliminary MS data processing, and ions with significant changes were extracted from the original data. Metaboananlyst 5.0 https://www.metaboanalyst.ca/, accessed on 5 June 2021), the online metabolomic analysis tool, was used to export data for multivariate statistical analysis. After deleting the unchanged peak, further analysis was carried out. The data of the obtained peak area was imported into SIMCA-P 13.0 (Umetrics, Umeå, Sweden) for multivariate statistical analysis. Pathway analysis was performed by the web-based MetPA tool (MetaboAnalyst Pathway Analysis; https://dev.metaboanalyst.ca/MetaboAnalyst/upload/PathUploadView.xhtml, accessed on 5 June 2021).
Principal component analysis (PCA) was performed to check for and rule out outliers. Furthermore, partial least square discriminant analysis (PLS-DA) was performed. The differential variables were characterized based on VIP (Variable Importance in Projection) scores calculated based on the PLS-DA model. Variables with VIP > 1 were the potential contributors to the grouping. The Kruskal-Wallis test was used to compare the means of the different treatment groups, and the differences were considered statistically significant at p < 0.05. The variables showing differences were ultimately determined at VIP > 1 and p < 0.05.

4. Conclusions

This study evaluated the effects of exposure of Dufulin at different concentrations on Tubifex by analyzing the oxidative damage and metabolome. Dufulin affected Tubifex at concentrations as low as 1 × 10⁻⁴ mg/L. It also affected the fatty acid metabolism, leading to changes in the concentration of free fatty acids. The urea cycle of Tubifex was also affected by Dufulin exposure while the possible mechanism via ASL inhibition. However, the effect of Dufulin on Tubifex was nonlinear. The study suggests that in untargeted organisms to pesticides, the impact of Dufulin even at low concentrations should be carefully considered. However, further studies should explore the mechanisms underlying the action of Dufulin at varying concentrations in Tubifex and verify whether the mechanism of the action of Dufulin is through the inhibition of ASL enzyme.

Supplementary Materials

The following are available online at https://www.mdpi.com/article/10.3390/metabo11060381/s1, Figure S1: Changes in the concentration of metabolites of butanoate metabolism in Tubifex exposed to Dufulin. Error bars indicate standard deviation (SD). (*: p < 0.05), Figure S2: Changes in the concentration of metabolites of carnitine shuttle in Tubifex exposed to Dufulin. Error bars indicate standard deviation (SD). (*: p < 0.05).

Author Contributions

Conceptualization, R.Z.; methodology, R.Z.; data analysis, Y.Y.; resources, Z.Z.; writing—original draft preparation, Y.Y.; data acquire, R.Z., Y.Y., Y.Z., J.Y.; writing—review and editing, Y.Y.; supervision, W.Z.; project administration, Z.Z.; funding acquisition, W.Z. All authors have read and agreed to the published version of the manuscript.

Funding

This research was funded by [National Key Research and Development Program of China] grant number [2016YFD0200202].

Institutional Review Board Statement

Not applicable.

Informed Consent Statement

Not applicable.

Data Availability Statement

The data presented in this study are available on request from the corresponding author. The data are not publicly available due to privacy.

Acknowledgments

We gratefully acknowledge the financial support from National Key Research and Development Program of China (2016YFD0200202), and the Young Elite Scientists Sponsorship Program by CAST.

Conflicts of Interest

The authors declare no conflict of interest.

References

  1. Cooper, J.; Dobson, H. The benefits of pesticides to mankind and the environment. Crop. Prot. 2007, 26, 1337–1348. [Google Scholar] [CrossRef]
  2. Wilhoit, L. History of Pesticide Use Reporting in California. In Managing and Analyzing Pesticide Use Data for Pest Management, Environmental Monitoring, Public Health, and Public Policy; American Chemical Society: Washington, DC, USA, 2018; pp. 3–14. [Google Scholar]
  3. Zhang, K.-K.; Hu, D.-Y.; Zhu, H.-J.; Yang, J.-C.; Song, B.-A. Enantioselective Degradation of Dufulin in Four Types of Soil. J. Agric. Food Chem. 2014, 62, 1771–1776. [Google Scholar] [CrossRef] [PubMed]
  4. Zhang, G.; Hao, G.; Pan, J.; Zhang, J.; Hu, D.; Song, B. Asymmetric Synthesis and Bioselective Activities of α-Amino-phosphonates Based on the Dufulin Motif. J. Agric. Food Chem. 2016, 64, 4207–4213. [Google Scholar] [CrossRef]
  5. Zhang, K.; Hu, D.; Zhu, H.; Yang, J.; Wu, J.; He, M.; Jin, L.; Yang, S.; Song, B. Enantioselective hydrolyzation and photolyzation of dufulin in water. Chem. Central J. 2013, 7, 86. [Google Scholar] [CrossRef] [PubMed] [Green Version]
  6. Chen, Z.; Zeng, M.; Song, B.; Hou, C.; Hu, D.; Li, X.; Wang, Z.; Fan, H.; Bi, L.; Liu, J.; et al. Dufulin Activates HrBP1 to Produce Antiviral Responses in Tobacco. PLoS ONE 2012, 7, e37944. [Google Scholar] [CrossRef] [PubMed] [Green Version]
  7. Li, J.; Xue, J.; Zhang, H.-M.; Yang, J.; Xie, L.; Chen, J.-P. Characterization of homologous and heterologous interactions between viroplasm proteins P6 and P9-1 of the fijivirus southern rice black-streaked dwarf virus. Arch. Virol. 2014, 160, 453–457. [Google Scholar] [CrossRef] [PubMed]
  8. Wang, D.; Xie, X.; Gao, D.; Chen, K.; Chen, Z.; Jin, L.; Li, X.; Song, B. Dufulin Intervenes the Viroplasmic Proteins as the Mechanism of Action against Southern Rice Black-Streaked Dwarf Virus. J. Agric. Food Chem. 2019, 67, 11380–11387. [Google Scholar] [CrossRef]
  9. Fang, H.; Yu, Y.; Chu, X.; Wang, X.; Yang, X.; Yu, J. Degradation of chlorpyrifos in laboratory soil and its impact on soil microbial functional diversity. J. Environ. Sci. 2009, 21, 380–386. [Google Scholar] [CrossRef]
  10. Wang, H.Z.; Zuo, H.G.; Ding, Y.J.; Miao, S.S.; Jiang, C.; Yang, H. Biotic and abiotic degradation of pesticide Dufulin in soils. Environ. Sci. Pollut. Res. 2014, 21, 4331–4342. [Google Scholar] [CrossRef]
  11. Teng, M.; Zhou, Y.; Song, M.; Dong, K.; Chen, X.; Wang, C.; Bi, S.; Zhu, W. Chronic Toxic Effects of Flutolanil on the Liver of Zebrafish (Danio rerio). Chem. Res. Toxicol. 2019, 32, 995–1001. [Google Scholar] [CrossRef]
  12. van den Berg, F.; Holterman, H.J.; Leistra, M. Emission of Pesticides into the Air. Water Air Soil Pollut. 1999, 115, 195–218. [Google Scholar] [CrossRef]
  13. Jiang, W.; Gan, J. Importance of Fine Particles in Pesticide Runoff from Concrete Surfaces and Its Prediction. Environ. Sci. Technol. 2012, 46, 6028–6034. [Google Scholar] [CrossRef]
  14. Borja, A.; Tueros, I.; Belzunce, M.J.; Galparsoro, I.; Garmendia, J.M.; Revilla, M.; Solaun, O.; Valencia, V. Investigative monitoring within the European Water Framework Directive: A coastal blast furnace slag disposal, as an example. J. Environ. Monit. 2008, 10, 453–462. [Google Scholar] [CrossRef] [PubMed]
  15. Camusso, M.; Galassi, S.; Vignati, D. Assessment of river Po sediment quality by micropollutant analysis. Water Res. 2002, 36, 2491–2504. [Google Scholar] [CrossRef]
  16. Lan, J.; Jia, J.; Liu, A.; Yu, Z.; Zhao, Z. Pollution levels of banned and non-banned pesticides in surface sediments from the East China Sea. Mar. Pollut. Bull. 2019, 139, 332–338. [Google Scholar] [CrossRef]
  17. Di, S.; Zhang, W.; Chen, L.; Zhou, Z.; Diao, J. Toxicokinetics and oxidative stress in Tubifex tubifex exposed to hexachlorocyclohexane isomers. RSC Adv. 2016, 6, 19016–19024. [Google Scholar] [CrossRef]
  18. Di, S.; Liu, R.; Cheng, C.; Chen, L.; Zhang, W.; Tian, Z.; Liu, C.; Zhou, Z.; Diao, J. Biomarkers in Tubifex tubifex for the metalaxyl and metalaxyl-M toxicity assessment in artificial sediment. Environ. Sci. Pollut. Res. 2016, 24, 3618–3625. [Google Scholar] [CrossRef]
  19. Lagauzère, S.; Terrail, R.; Bonzom, J.-M. Ecotoxicity of uranium to Tubifex tubifex worms (Annelida, Clitellata, Tubificidae) exposed to contaminated sediment. Ecotoxicol. Environ. Saf. 2009, 72, 527–537. [Google Scholar] [CrossRef]
  20. Wiederholm, T.; Wiederholm, A.-M.; Milbrink, G. Bulk sediment bioassays with five species of fresh-water oligochaetes. Water, Air, Soil Pollut. 1987, 36, 131–154. [Google Scholar] [CrossRef]
  21. Walker, J.G. Oxygen poisoning in the Annelid Tubifex tubifexi. Response to oxygen exposure. Biol. Bull. 1970, 138, 235–244. [Google Scholar] [CrossRef]
  22. Liu, C.; Wang, B.; Xu, P.; Liu, T.; Di, S.; Diao, J. Enantioselective Determination of Triazole Fungicide Epoxiconazole Bioaccumulation in Tubifex Based on HPLC-MS/MS. J. Agric. Food Chem. 2013, 62, 360–367. [Google Scholar] [CrossRef] [PubMed]
  23. Oplinger, R.W.; Bartley, M.; Wagner, E.G. Culture of Tubifex tubifex: Effect of Feed Type, Ration, Temperature, and Density on Juvenile Recruitment, Production, and Adult Survival. N. Am. J. Aquac. 2011, 73, 68–75. [Google Scholar]
  24. Milbrink, G. Biological characterization of sediments by standardized tubificid bioassays. Hydrobiologia 1987, 155, 267–275. [Google Scholar] [CrossRef]
  25. Di, S.; Liu, T.; Diao, J.; Zhou, Z. Enantioselective Bioaccumulation and Degradation of Sediment-Associated Metalaxyl Enantiomers in Tubifex tubifex. J. Agric. Food Chem. 2013, 61, 4997–5002. [Google Scholar] [CrossRef] [PubMed]
  26. Li, J.; Lu, P.; Hu, D.; Wang, S.; Zhang, Q.; Yu, Y.; Zeng, S. Stereoselective Bioaccumulation of Water and Soil-Associated Dufulin Enantiomers in Tubifex. J. Agric. Food Chem. 2017, 65, 8569–8577. [Google Scholar] [CrossRef]
  27. Wang, C.; Qian, Y.; Zhang, X.; Chen, F.; Zhang, Q.; Li, Z.; Zhao, M. A metabolomic study of fipronil for the anxiety-like behavior in zebrafish larvae at environmentally relevant levels. Environ. Pollut. 2016, 211, 252–258. [Google Scholar] [CrossRef]
  28. Aliferis, K.; Chrysayi-Tokousbalides, M. Metabolomics in pesticide research and development: Review and future perspec-tives. Metabolomics 2011, 7, 35–53. [Google Scholar] [CrossRef]
  29. Zhang, A.; Sun, H.; Yan, G.; Wang, P.; Wang, X. Mass spectrometry-based metabolomics: Applications to biomarker and metabolic pathway research. Biomed. Chromatogr. 2016, 30, 7–12. [Google Scholar] [CrossRef]
  30. Rinschen, M.M.; Ivanisevic, J.; Giera, M.; Siuzdak, G. Identification of bioactive metabolites using activity metabolomics. Nat. Rev. Mol. Cell Biol. 2019, 20, 353–367. [Google Scholar] [CrossRef]
  31. Nicholson, J.K.; Connelly, J.; Lindon, J.; Holmes, E. Metabonomics: A platform for studying drug toxicity and gene function. Nat. Rev. Drug Discov. 2002, 1, 153–161. [Google Scholar] [CrossRef]
  32. Yao, C.; Sheng, J.; Yan, S.; Tian, S.; Meng, Z.; Zhou, Z.; Zhu, W. Enantioselectivity effects of imazethapyr enantiomers to metabolic responses in mice. Pestic. Biochem. Physiol. 2020, 168, 104619. [Google Scholar] [CrossRef]
  33. Li, J.; Wang, Q.; Zheng, Y.; Zhou, P.; Xu, X.; Liu, X.; Zhao, L.; Liu, H. Development of a mass spectrometry-based pseudotargeted metabolomics strategy to analyze hormone-stimulated gastric cancer cells. J. Pharm. Biomed. Anal. 2020, 180, 113041. [Google Scholar] [CrossRef] [PubMed]
  34. Zhang, J.; Wu, X.; Qiu, J.; Zhang, L.; Zhang, Y.; Qiu, X.; Huang, Z.; Xu, W. Comprehensive Comparison on the Chemical Profile of Guang Chen Pi at Different Ripeness Stages Using Untargeted and Pseudotargeted Metabolomics. J. Agric. Food Chem. 2020, 68, 8483–8495. [Google Scholar] [CrossRef] [PubMed]
  35. Patti, G.J.; Yanes, O.; Siuzdak, G. Metabolomics: The apogee of the omics trilogy. Nat. Rev. Mol. Cell Biol. 2012, 13, 263–269. [Google Scholar] [CrossRef] [PubMed]
  36. Griffiths, W.J.; Koal, T.; Wang, Y.; Kohl, M.; Enot, D.P.; Deigner, H.-P. Targeted Metabolomics for Biomarker Discovery. Angew. Chem. Int. Ed. 2010, 49, 5426–5445. [Google Scholar] [CrossRef]
  37. Zha, H.; Cai, Y.; Yin, Y.; Wang, Z.; Li, K.; Zhu, Z.-J. SWATHtoMRM: Development of High-Coverage Targeted Metabolomics Method Using SWATH Technology for Biomarker Discovery. Anal. Chem. 2018, 90, 4062–4070. [Google Scholar] [CrossRef]
  38. Zhou, J.; Yin, Y. Strategies for large-scale targeted metabolomics quantification by liquid chromatography-mass spectrometry. Analyst 2016, 141, 6362–6373. [Google Scholar] [CrossRef]
  39. Evans, C.; Karnovsky, A.; Kovach, M.A.; Standiford, T.J.; Burant, C.F.; Stringer, K.A. Untargeted LC–MS Metabolomics of Bronchoalveolar Lavage Fluid Differentiates Acute Respiratory Distress Syndrome from Health. J. Proteome Res. 2014, 13, 640–649. [Google Scholar] [CrossRef]
  40. Gu, J.; Ji, C.; Yue, S.; Shu, D.; Su, F.; Zhang, Y.; Xie, Y.; Zhang, Y.; Liu, W.; Zhao, M. Enantioselective Effects of Metalaxyl Enantiomers in Adolescent Rat Metabolic Profiles Using NMR-Based Metabolomics. Environ. Sci. Technol. 2018, 52, 5438–5447. [Google Scholar] [CrossRef]
  41. Coen, M.; Holmes, E.; Lindon, J.; Nicholson, J. NMR-Based Metabolic Profiling and Metabonomic Approaches to Problems in Molecular Toxicology. Chem. Res. Toxicol. 2008, 21, 9–27. [Google Scholar] [CrossRef]
  42. Charris-Molina, A.; Riquelme, G.; Burdisso, P.; Hoijemberg, P.A. Consecutive Queries to Assess Biological Correlation in NMR Metabolomics: Performance of Comprehensive Search of Multiplets over Typical 1D 1H NMR Database Search. J. Proteome Res. 2020, 19, 2977–2988. [Google Scholar] [CrossRef]
  43. Rutledge, A.; Codreanu, S.G.; Sherrod, S.D.; McLean, J.A. Untargeted Metabolomics Strategies—Challenges and Emerging Directions. J. Am. Soc. Mass Spectrom. 2016, 27, 1897–1905. [Google Scholar] [CrossRef] [Green Version]
  44. Fraisier-Vannier, O.; Chervin, J.; Cabanac, G.; Puech-Pages, V.; Fournier, S.; Durand, V.; Amiel, A.; André, O.; Benamar, O.A.; Dumas, B.; et al. MS-CleanR: A Feature-Filtering Workflow for Untargeted LC–MS Based Metabolomics. Anal. Chem. 2020, 92, 9971–9981. [Google Scholar] [CrossRef] [PubMed]
  45. Ahn, H.-Y.; Fairfull-Smith, K.E.; Morrow, B.J.; Lussini, V.; Kim, B.; Bondar, M.V.; Bottle, S.E.; Belfield, K.D. Two-Photon Fluorescence Microscopy Imaging of Cellular Oxidative Stress Using Profluorescent Nitroxides. J. Am. Chem. Soc. 2012, 134, 4721–4730. [Google Scholar] [CrossRef] [PubMed] [Green Version]
  46. Livingstone, D.R. Oxidative stress in aquatic organisms in relation to pollution and aquaculture. Rev. Med. Veteri-Naire 2003, 154, 427–430. [Google Scholar]
  47. Analytical Currents. Measuring oxidative damage. Anal. Chem. 1998, 70, 91A. [Google Scholar] [CrossRef]
  48. Gamon, L.F.; Wille, U. Oxidative Damage of Biomolecules by the Environmental Pollutants NO2• and NO3•. Acc. Chem. Res. 2016, 49, 2136–2145. [Google Scholar] [CrossRef]
  49. Stanicka, J.; Landry, W.; Cotter, T.G. Oxidative Stress Biomarkers and ROS Molecular Probes. In Oxidative Stress: Diagnostics, Prevention, and Therapy Volume 2; American Chemical Society: Washington, DC, USA, 2015; pp. 353–374. [Google Scholar]
  50. Sergiev, P.V.; Dontsova, O.A.; Berezkin, G.V. Theories of Aging: An Ever-Evolving Field. Acta Naturae 2015, 7, 9–18. [Google Scholar] [CrossRef]
  51. Tang, J.-Y.; Ou-Yang, F.; Hou, M.-F.; Huang, H.-W.; Wang, H.-R.; Li, K.-T.; Fayyaz, S.; Shu, C.-W.; Chang, H.-W. Oxidative stress-modulating drugs have preferential anticancer effects—involving the regulation of apoptosis, DNA damage, endoplasmic reticulum stress, autophagy, metabolism, and migration. Semin. Cancer Biol. 2019, 58, 109–117. [Google Scholar] [CrossRef]
  52. Prieto, A.I.; Pichardo, S.; Jos, A.; Moreno, I.; Cameán, A.M. Time-dependent oxidative stress responses after acute exposure to toxic cyanobacterial cells containing microcystins in tilapia fish (Oreochromis niloticus) under laboratory conditions. Aquat. Toxicol. 2007, 84, 337–345. [Google Scholar] [CrossRef]
  53. Liu, T.; Diao, J.; Di, S.; Zhou, Z. Stereoselective Bioaccumulation and Metabolite Formation of Triadimefon in Tubifex tubifex. Environ. Sci. Technol. 2014, 48, 6687–6693. [Google Scholar] [CrossRef]
  54. Abdollahi, M.; Ranjbar, A.; Shadnia, S.; Nikfar, S.; Rezaiee, A. Pesticides and oxidative stress: A review. Med Sci. Monit. 2004, 10, RA141–RA147. [Google Scholar]
  55. Janero, D.R. Malondialdehyde and thiobarbituric acid-reactivity as diagnostic indices of lipid peroxidation and peroxidative tissue injury. Free. Radic. Biol. Med. 1990, 9, 515–540. [Google Scholar] [CrossRef]
  56. Shin, S.-K.; Cho, H.-W.; Song, S.-E.; Im, S.-S.; Bae, J.-H.; Song, D.-K. Oxidative stress resulting from the removal of endogenous catalase induces obesity by promoting hyperplasia and hypertrophy of white adipocytes. Redox Biol. 2020, 37, 101749. [Google Scholar] [CrossRef]
  57. Scott, M.; Meshnick, S.; Eaton, J. Superoxide dismutase-rich bacteria. Paradoxical increase in oxidant toxicity. J. Biol. Chem. 1987, 262, 3640–3645. [Google Scholar] [CrossRef]
  58. Zhu, Y.; Liu, L.; Tan, D.; Sun, W.; Ke, Q.; Yue, X.; Bai, B. S-desulfurization: A different covalent modification mechanism from persulfidation by GSH. Free. Radic. Biol. Med. 2021, 167, 54–65. [Google Scholar] [CrossRef] [PubMed]
  59. Evans, D.C.; Watt, A.P.; Nicoll-Griffith, D.A.; Baillie, T.A. Drug−Protein Adducts: An Industry Perspective on Minimizing the Potential for Drug Bioactivation in Drug Discovery and Development. Chem. Res. Toxicol. 2004, 17, 3–16. [Google Scholar] [CrossRef]
  60. Rinaldi, R.; Eliasson, E.; Swedmark, S.; Morgenstern, R. Reactive Intermediates and The Dynamics of Glutathione Transferases. Drug Metab. Dispos. 2002, 30, 1053–1058. [Google Scholar] [CrossRef] [PubMed] [Green Version]
  61. Beronius, A.; Vandenberg, L.N. Using systematic reviews for hazard and risk assessment of endocrine disrupting chemicals. Rev. Endocr. Metab. Disord. 2015, 16, 273–287. [Google Scholar] [CrossRef] [PubMed] [Green Version]
  62. Nakata, S.; Fujita, R. Self-Propelled Motion of Camphor Disk on Nervonic Acid Molecular Layer and Its Dependence on Phase Transition. J. Phys. Chem. B 2020, 124, 5525–5529. [Google Scholar] [CrossRef]
  63. Tu, X.; Wan, J.; Xie, Y.; Wei, F.; Quek, S.; Lv, X.; Du, L.; Chen, H. Lipid analysis of three special nervonic acid resources in China. Oil Crop. Sci. 2020, 5, 180–186. [Google Scholar] [CrossRef]
  64. Watkins, P.A. Fatty acid activation. Prog. Lipid Res. 1997, 36, 55–83. [Google Scholar] [CrossRef]
  65. Spiekerkoetter, U.; Duran, M. Mitochondrial Fatty Acid Oxidation Disorders, in Physician’s Guide to the Diagnosis, Treatment, and Follow-Up of Inherited Metabolic Diseases; Blau, N., Duran, M., Gibson, K.M., Dionisi-Vici, C., Eds.; Springer: Berlin/Heidelberg, Germany, 2014; pp. 247–264. [Google Scholar]
  66. Houten, S.M.; Wanders, R.J.A. A general introduction to the biochemistry of mitochondrial fatty acid β-oxidation. J. Inherit. Metab. Dis. 2010, 33, 469–477. [Google Scholar] [CrossRef] [PubMed] [Green Version]
  67. Longo, N.; Frigeni, M.; Pasquali, M. Carnitine transport and fatty acid oxidation. Biochim. Biophys. Acta Bioenerg. 2016, 1863, 2422–2435. [Google Scholar] [CrossRef]
  68. Li, J.-M.; Li, L.-Y.; Qin, X.; Ning, L.-J.; Lu, D.-L.; Zhang, M.-L.; Wang, X.; Du, Z.-Y. Systemic regulation of L-carnitine in nutritional metabolism in zebrafish, Danio rerio. Sci. Rep. 2017, 7, 40815. [Google Scholar] [CrossRef] [PubMed] [Green Version]
  69. Epstein, F.H.; Moncada, S.; Higgs, A. The L-Arginine-Nitric Oxide Pathway. N. Engl. J. Med. 1993, 329, 2002–2012. [Google Scholar] [CrossRef]
  70. Beaumier, L.; Castillo, L.; Yu, Y.M.; Ajami, A.M.; Young, V.R. Arginine: New and exciting developments for an “old” amino acid. Biomed. Environ. Sci. 1996, 9, 296–315. [Google Scholar]
  71. Cabello, J.; Basílio, C.; Prajoux, V. Kinetic properties of erythrocyte- and liver arginase. Biochim. Biophys. Acta 1961, 48, 148–152. [Google Scholar] [CrossRef]
  72. Morris, J.S. Regulation of enzymes of the urea cycle and arginine metabolism. Annu. Rev. Nutr. 2002, 22, 87–105. [Google Scholar] [CrossRef]
  73. Garrard, L.J.; Mathis, J.M.; Raushel, F.M. Substrate-induced inactivation of argininosuccinate lyase by mono-fluorofumarate and difluorofumarate. Biochemistry 1983, 22, 3729–3735. [Google Scholar] [CrossRef]
  74. Bishop, S.H.; Campbell, J.W. Arginine and urea biosynthesis in the earthworm Lumbricus terrestris. Comp. Biochem. Physiol. 1965, 15, 51–71. [Google Scholar] [CrossRef]
  75. Wang, F.S.; Goh, D.L.M.; Ong, H.T. Urea cycle disorder presenting as bilateral mesial temporal sclerosis—An un-usual cause of seizures: A case report and review of the literature. J. Med Case Rep. 2018, 12, 208. [Google Scholar]
  76. Wang, B.; Jha, P. A Case of Atypical Adult Presentation of Urea Cycle Disorder. WMJ Off. Publ. State Med. Soc. Wis. 2019, 118, 98–100. [Google Scholar]
  77. Du, D.; Gu, H.; Djukovic, D.; Bettcher, L.; Gong, M.; Zheng, W.; Hu, L.; Zhang, X.; Zhang, R.; Wang, D.; et al. Multiplatform Metabolomics Investigation of Antiadipogenic Effects on 3T3-L1 Adipocytes by a Potent Diarylheptanoid. J. Proteome Res. 2018, 17, 2092–2101. [Google Scholar] [CrossRef]
  78. Wei, Y.; Jasbi, P.; Shi, X.; Turner, C.; Hrovat, J.; Liu, L.; Rabena, Y.; Porter, P.; Gu, H. Early Breast Cancer Detection Using Untargeted and Targeted Metabolomics. J. Proteome Res. 2021. [Google Scholar] [CrossRef]
  79. Peng, Y.; Hong, J.; Raftery, D.; Xia, Q.; Du, D. Metabolomic-based clinical studies and murine models for acute pancreatitis disease: A review. Biochim. Biophys. Acta Mol. Basis Dis. 2021, 1867, 166123. [Google Scholar] [CrossRef]
  80. Zhang, X.; Dong, J.; Raftery, D. Five Easy Metrics of Data Quality for LC–MS-Based Global Metabolomics. Anal. Chem. 2020, 92, 12925–12933. [Google Scholar] [CrossRef]
Figure 1. Changes in MDA, SOD, CAT, and GSH in Tubifex after exposure to Dufulin at different concentrations for 7 days. Each data set is represented as the mean value of three samples. Error bars indicate standard deviation (SD). (*: p < 0.05).
Metabolites 11 00381 g001
Figure 2. Statistical analysis of six groups (CK, 1 × 10⁻⁴, 1 × 10⁻³, 1 × 10⁻², 1 × 10⁻¹ mg/L). (A) Principal component analysis (PCA) score plot and (B) partial least-squares discriminant analysis (PLS-DA).
Metabolites 11 00381 g002
Figure 3. Heat map.
Figure 3. Heat map.
Metabolites 11 00381 g003
Figure 4. Metabolic pathway analysis by MetaboAnalyst. The pathway analysis was based on 41 unique metabolites. The x-axis represents the pathway impact value from pathway topology analysis, and the y-axis represents the -log p-value from pathway enrichment analysis. The node color and radius are based on p-value and pathway impact value, respectively.
Metabolites 11 00381 g004
Figure 5. Changes in the concentration of metabolites of fatty acid in Tubifex exposed to Dufulin. Error bars indicate standard deviation (SD). (*: p < 0.05).
Metabolites 11 00381 g005
Figure 6. Schematic representation of the urea cycle exposed to Dufulin in Tubifex. Error bars indicate standard deviation (SD). (*: p < 0.05).
Metabolites 11 00381 g006
Publisher’s Note: MDPI stays neutral with regard to jurisdictional claims in published maps and institutional affiliations.

