
Hypothalamic Expression of Neuropeptide Y (NPY) and Pro-OpioMelanoCortin (POMC) in Adult Male Mice Is Affected by Chronic Exposure to Endocrine Disruptors

 , , ,
, , ,  and
and 
Abstract
1. Introduction
2. Results
2.1. Body Weight
2.2. Immunohistochemistry
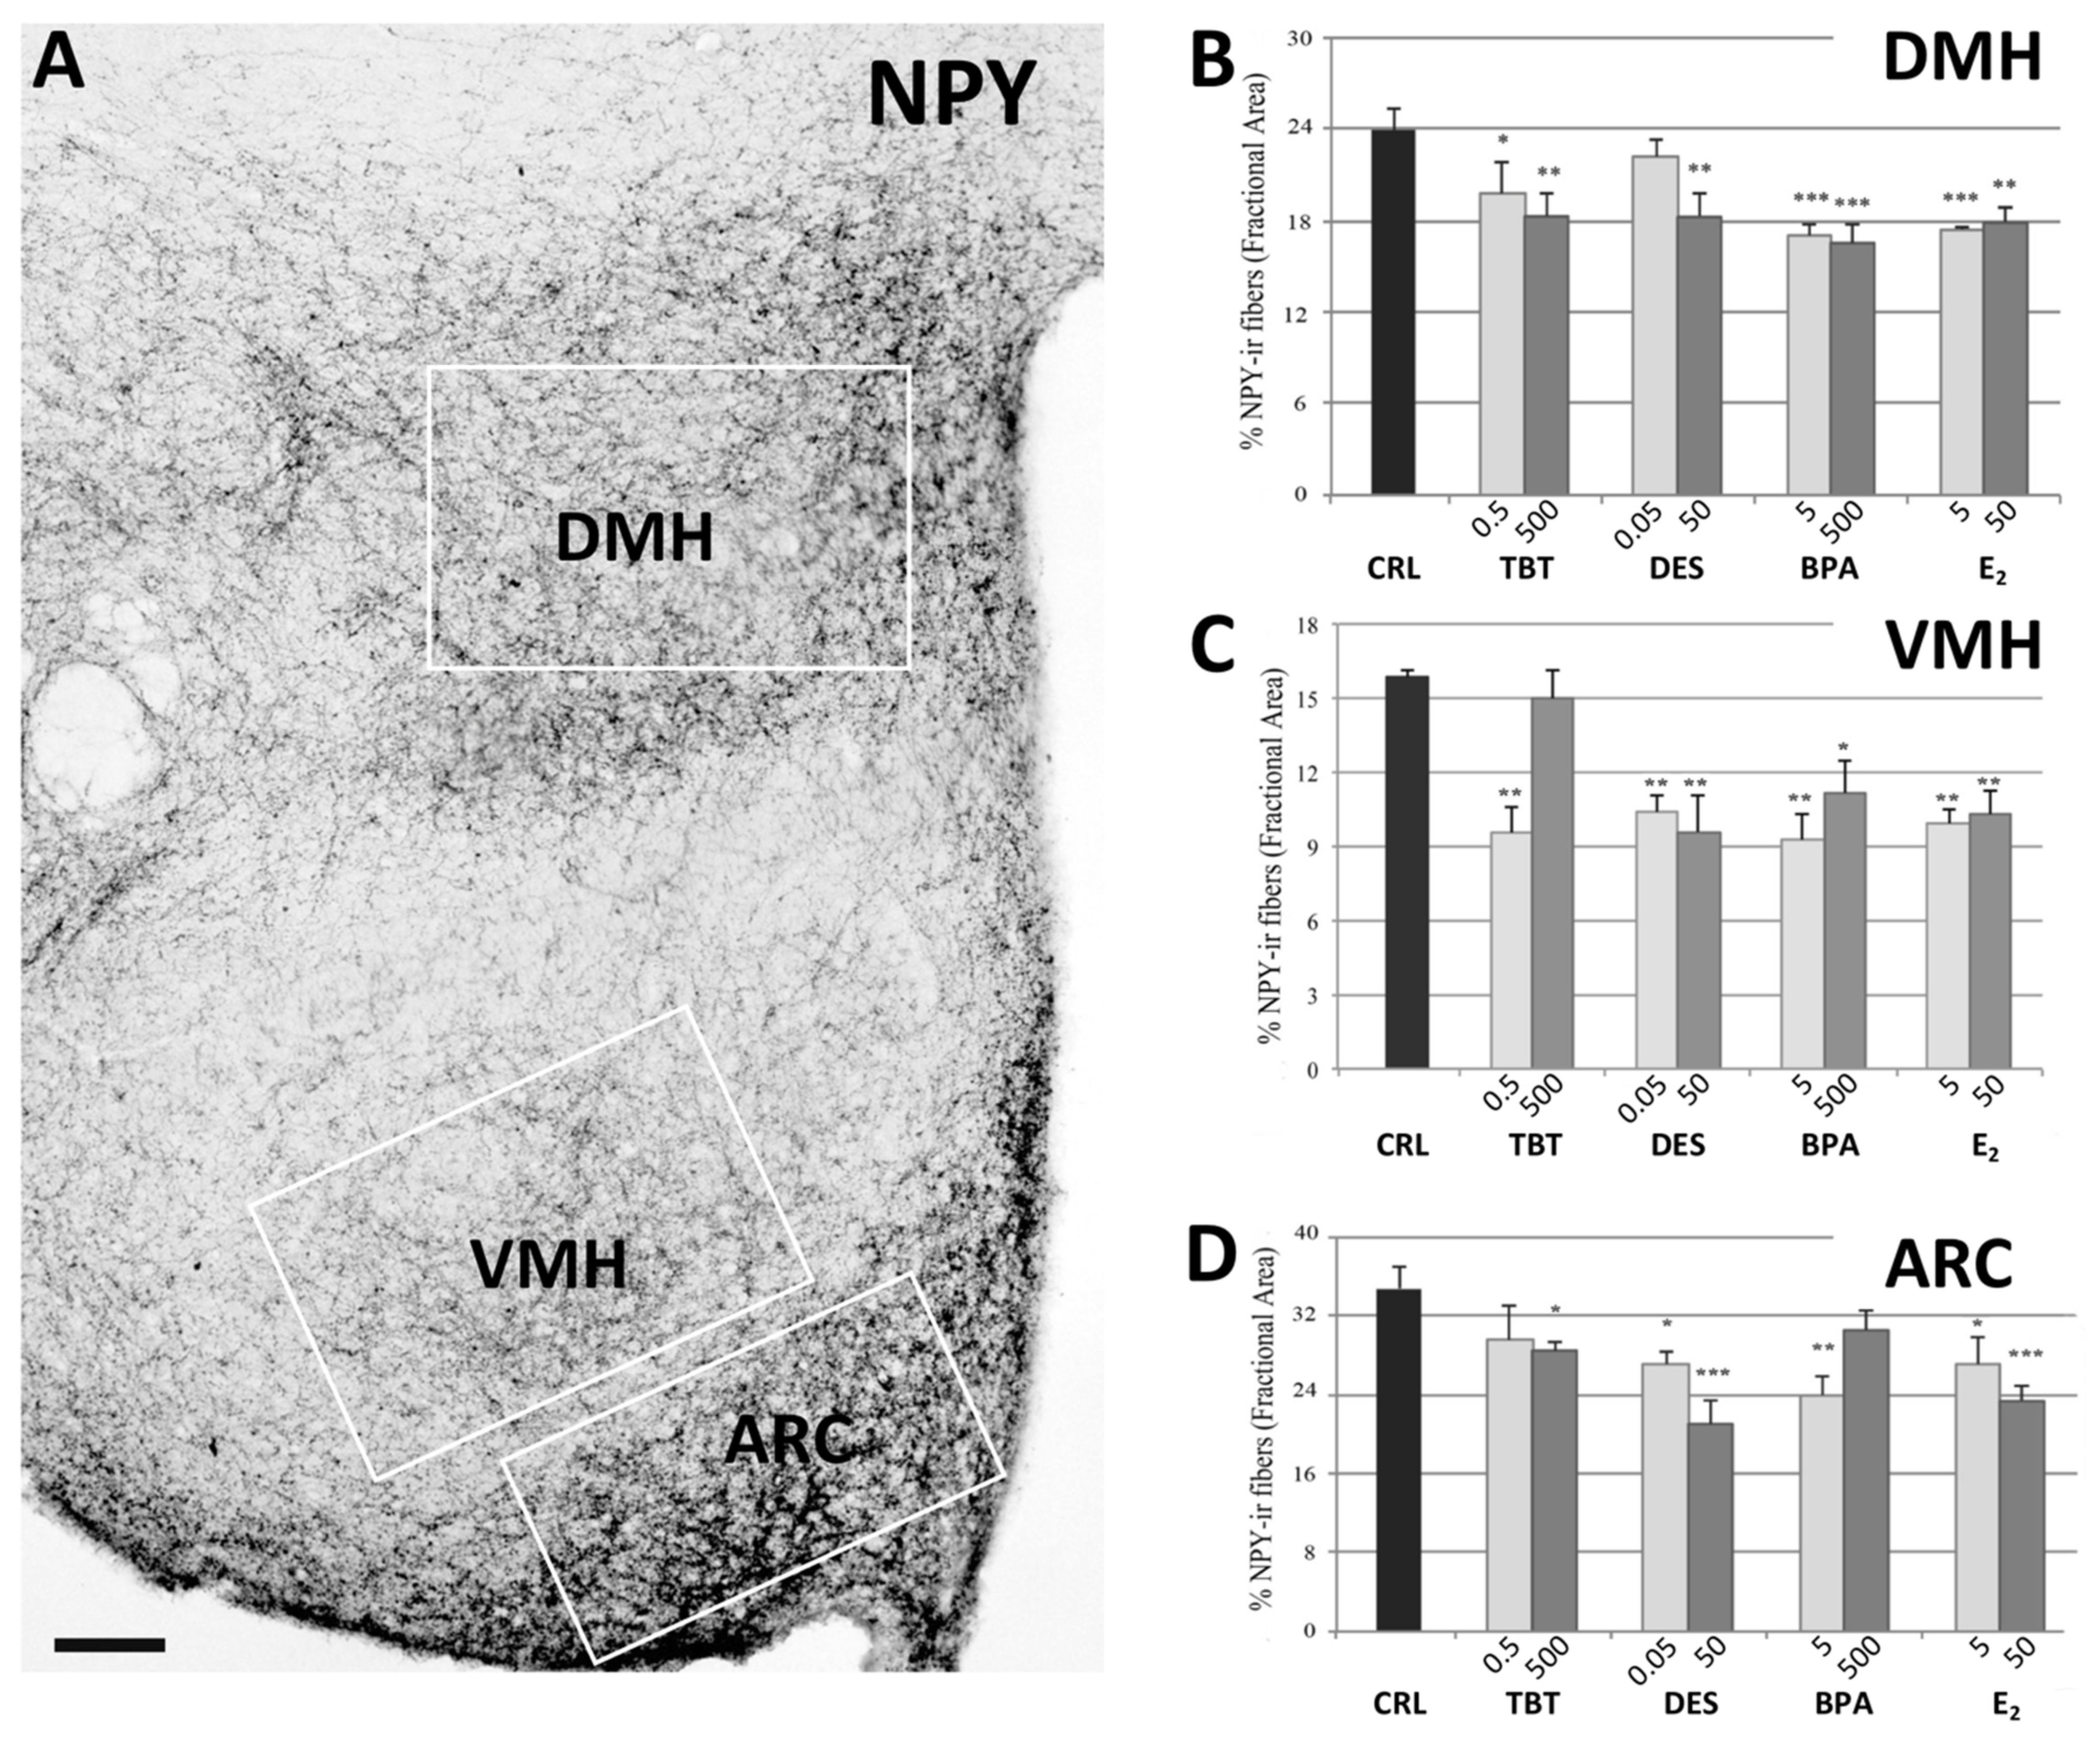
2.2.1. NPY System
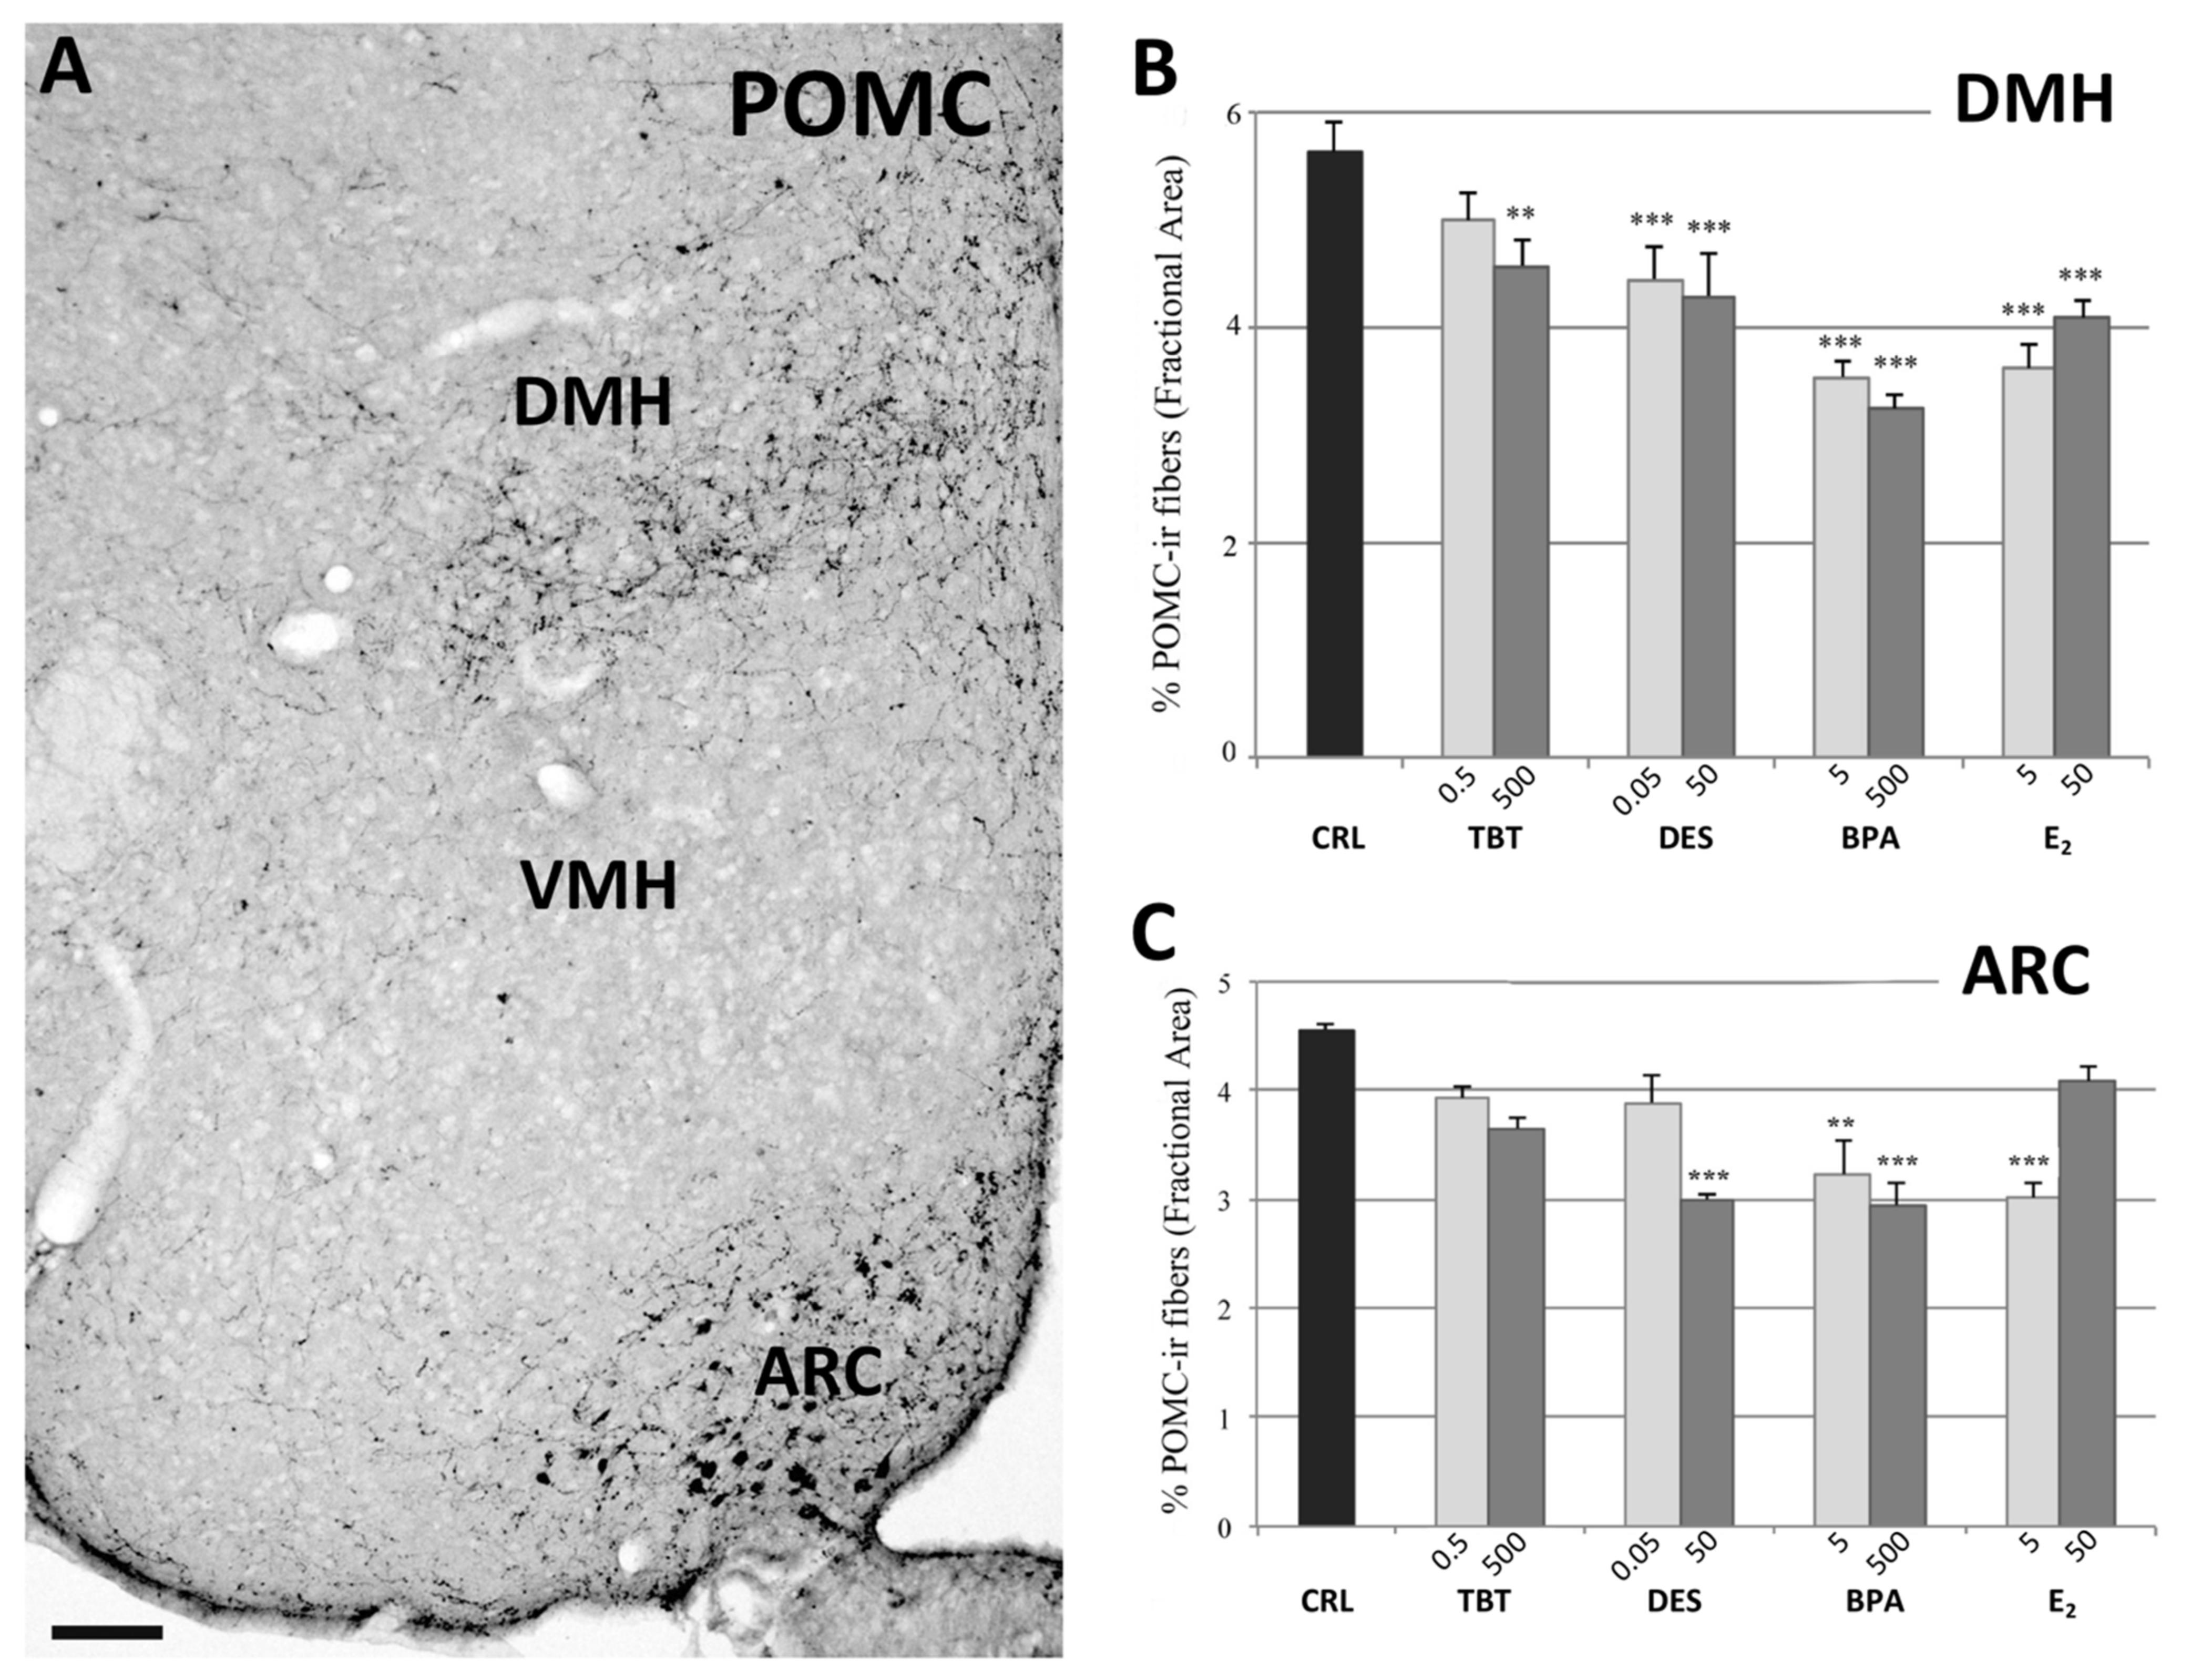
2.2.2. POMC System
3. Discussion
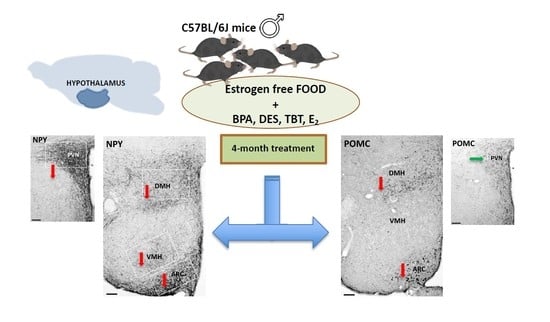
4. Materials and Methods
4.1. Animals and Treatment
4.2. Tissue Sampling and Histological Examination
4.3. Quantitative Analysis
4.4. Statistical Analysis
Supplementary Materials
Author Contributions
Funding
Institutional Review Board Statement
Informed Consent Statement
Data Availability Statement
Acknowledgments
Conflicts of Interest
References
- Broberger, C. Brain regulation of food intake and appetite: Molecules and networks. J. Intern. Med. 2005, 258, 301–327. [Google Scholar] [CrossRef]
- Kalra, S.P.; Dube, M.G.; Pu, S.; Xu, B.; Horvath, T.L.; Kalra, P.S. Interacting appetite-regulating pathways in the hypothalamic regulation of body weight. Endocr. Rev. 1999, 20, 68–100. [Google Scholar] [CrossRef]
- Grun, F.; Blumberg, B. Endocrine disrupters as obesogens. Mol. Cell Endocrinol. 2009, 304, 19–29. [Google Scholar] [CrossRef]
- Clegg, D.J. Minireview: The year in review of estrogen regulation of metabolism. Mol. Endocrinol. 2012, 26, 1957–1960. [Google Scholar] [CrossRef]
- Stincic, T.L.; Ronnekleiv, O.K.; Kelly, M.J. Diverse actions of estradiol on anorexigenic and orexigenic hypothalamic arcuate neurons. Horm. Behav. 2018, 104, 146–155. [Google Scholar] [CrossRef] [PubMed]
- Roepke, T.A.; Bosch, M.A.; Rick, E.A.; Lee, B.; Wagner, E.J.; Seidlova-Wuttke, D.; Wuttke, W.; Scanlan, T.S.; Ronnekleiv, O.K.; Kelly, M.J. Contribution of a membrane estrogen receptor to the estrogenic regulation of body temperature and energy homeostasis. Endocrinology 2010, 151, 4926–4937. [Google Scholar] [CrossRef] [PubMed]
- Gao, Q.; Horvath, T.L. Cross-talk between estrogen and leptin signaling in the hypothalamus. Am. J. Physiol. Endocrinol. Metab. 2008, 294, E817–E826. [Google Scholar] [CrossRef]
- Casabiell, X.; Pineiro, V.; Peino, R.; Lage, M.; Camina, J.; Gallego, R.; Vallejo, L.G.; Dieguez, C.; Casanueva, F.F. Gender differences in both spontaneous and stimulated leptin secretion by human omental adipose tissue in vitro: Dexamethasone and estradiol stimulate leptin release in women, but not in men. J. Clin. Endocrinol. Metab. 1998, 83, 2149–2155. [Google Scholar] [CrossRef]
- Ainslie, D.A.; Morris, M.J.; Wittert, G.; Turnbull, H.; Proietto, J.; Thorburn, A.W. Estrogen deficiency causes central leptin insensitivity and increased hypothalamic neuropeptide Y. Int. J. Obes. 2001, 25, 1680–1688. [Google Scholar] [CrossRef]
- Shimizu, H.; Ohtani, K.; Kato, Y.; Tanaka, Y.; Mori, M. Withdrawal of estrogen increases hypothalamic neuropeptide Y (NPY) mRNA expression in ovariectomized obese rat. Neurosci. Lett. 1996, 204, 81–84. [Google Scholar] [CrossRef]
- La Merrill, M.A.; Vandenberg, L.N.; Smith, M.T.; Goodson, W.; Browne, P.; Patisaul, H.B.; Guyton, K.Z.; Kortenkamp, A.; Cogliano, V.J.; Woodruff, T.J.; et al. Consensus on the key characteristics of endocrine-disrupting chemicals as a basis for hazard identification. Nat. Rev. Endocrinol. 2020, 16, 45–57. [Google Scholar] [CrossRef]
- Panzica, G.C.; Bo, E.; Martini, M.A.; Miceli, D.; Mura, E.; Viglietti-Panzica, C.; Gotti, S. Neuropeptides and enzymes are targets for the action of endocrine disrupting chemicals in the vertebrate brain. J. Toxicol. Environ. Health Part B 2011, 14, 449–472. [Google Scholar] [CrossRef] [PubMed]
- Heindel, J.J.; Blumberg, B.; Cave, M.; Machtinger, R.; Mantovani, A.; Mendez, M.A.; Nadal, A.; Palanza, P.; Panzica, G.; Sargis, R.; et al. Metabolism disrupting chemicals and metabolic disorders. Reprod. Toxicol. 2017, 68, 3–33. [Google Scholar] [CrossRef] [PubMed]
- Marraudino, M.; Bonaldo, B.; Farinetti, A.; Panzica, G.; Ponti, G.; Gotti, S. Metabolism Disrupting Chemicals and Alteration of Neuroendocrine Circuits Controlling Food Intake and Energy Metabolism. Front. Endocrinol. 2018, 9, 766. [Google Scholar] [CrossRef]
- Alonso-Magdalena, P.; Laribi, O.; Ropero, A.B.; Fuentes, E.; Ripoll, C.; Soria, B.; Nadal, A. Low doses of bisphenol A and diethylstilbestrol impair Ca2+ signals in pancreatic alpha-cells through a nonclassical membrane estrogen receptor within intact islets of Langerhans. Environ. Health Perspect. 2005, 113, 969–977. [Google Scholar] [CrossRef]
- Thomas, P.; Dong, J. Binding and activation of the seven-transmembrane estrogen receptor GPR30 by environmental estrogens: A potential novel mechanism of endocrine disruption. J. Steroid Biochem. Mol. Biol. 2006, 102, 175–179. [Google Scholar] [CrossRef]
- Ropero, A.B.; Alonso-Magdalena, P.; Ripoll, C.; Fuentes, E.; Nadal, A. Rapid endocrine disruption: Environmental estrogen actions triggered outside the nucleus. J. Steroid Biochem. Mol. Biol. 2006, 102, 163–169. [Google Scholar] [CrossRef]
- MacKay, H.; Abizaid, A. A plurality of molecular targets: The receptor ecosystem for bisphenol-A (BPA). Horm. Behav. 2017. [Google Scholar] [CrossRef] [PubMed]
- Loganathan, N.; Salehi, A.; Chalmers, J.A.; Belsham, D.D. Bisphenol A Alters Bmal1, Per2, and Rev-Erba mRNA and Requires Bmal1 to Increase Neuropeptide Y Expression in Hypothalamic Neurons. Endocrinology 2019, 160, 181–192. [Google Scholar] [CrossRef]
- Loganathan, N.; McIlwraith, E.K.; Belsham, D.D. BPA Differentially Regulates NPY Expression in Hypothalamic Neurons Through a Mechanism Involving Oxidative Stress. Endocrinology 2020, 161. [Google Scholar] [CrossRef] [PubMed]
- Loganathan, N.; McIlwraith, E.K.; Belsham, D.D. Bisphenol A induces Agrp gene expression in hypothalamic neurons through a mechanism involving ATF3. Neuroendocrinology 2020. [Google Scholar] [CrossRef] [PubMed]
- Goldberg, J.M.; Falcone, T. Effect of diethylstilbestrol on reproductive function. Fertil. Steril. 1999, 72, 1–7. [Google Scholar] [CrossRef]
- Tapiero, H.; Nguyen Ba, G.; Tew, K.D. Estrogens and environmental estrogens. Biomed. Pharmacother. 2002, 56, 36–44. [Google Scholar] [CrossRef]
- Nam, K.; Marshall, P.; Wolf, R.M.; Cornell, W. Simulation of the different biological activities of diethylstilbestrol (DES) on estrogen receptor alpha and estrogen-related receptor gamma. Biopolymers 2003, 68, 130–138. [Google Scholar] [CrossRef] [PubMed]
- Zhang, Y.B.; Zhang, Y.; Li, L.N.; Zhao, X.Y.; Na, X.L. Soy isoflavone and its effect to regulate hypothalamus and peripheral orexigenic gene expression in ovariectomized rats fed on a high-fat diet. Biomed. Environ. Sci. 2010, 23, 68–75. [Google Scholar] [CrossRef]
- Zuo, Z.; Chen, S.; Wu, T.; Zhang, J.; Su, Y.; Chen, Y.; Wang, C. Tributyltin causes obesity and hepatic steatosis in male mice. Environ. Toxicol. 2011, 26, 79–85. [Google Scholar] [CrossRef]
- McAllister, B.G.; Kime, D.E. Early life exposure to environmental levels of the aromatase inhibitor tributyltin causes masculinisation and irreversible sperm damage in zebrafish (Danio rerio). Aquat. Toxicol. 2003, 65, 309–316. [Google Scholar] [CrossRef]
- Golub, M.; Doherty, J. Triphenyltin as a potential human endocrine disruptor. J. Toxicol. Environ. Health B Crit. Rev. 2004, 7, 281–295. [Google Scholar] [CrossRef]
- Si, J.; Wu, X.; Wan, C.; Zeng, T.; Zhang, M.; Xie, K.; Li, J. Peripubertal exposure to low doses of tributyltin chloride affects the homeostasis of serum T, E2, LH, and body weight of male mice. Environ. Toxicol. 2011, 26, 307–314. [Google Scholar] [CrossRef]
- Bo, E.; Farinetti, A.; Marraudino, M.; Sterchele, D.; Eva, C.; Gotti, S.; Panzica, G. Adult exposure to tributyltin affects hypothalamic neuropeptide Y, Y1 receptor distribution, and circulating leptin in mice. Andrology 2016, 4, 723–734. [Google Scholar] [CrossRef] [PubMed]
- Farinetti, A.; Marraudino, M.; Ponti, G.; Panzica, G.; Gotti, S. Chronic treatment with tributyltin induces sexually dimorphic alterations in the hypothalamic POMC system of adult mice. Cell Tissue Res. 2018, 374, 587–594. [Google Scholar] [CrossRef]
- Ohtaki, K.; Aihara, M.; Takahashi, H.; Fujita, H.; Takahashi, K.; Funabashi, T.; Hirasawa, T.; Ikezawa, Z. Effects of tributyltin on the emotional behavior of C57BL/6 mice and the development of atopic dermatitis-like lesions in DS-Nh mice. J. Dermatol. Sci. 2007, 47, 209–216. [Google Scholar] [CrossRef]
- Yamabe, Y.; Hoshino, A.; Imura, N.; Suzuki, T.; Himeno, S. Enhancement of androgen-dependent transcription and cell proliferation by tributyltin and triphenyltin in human prostate cancer cells. Toxicol. Appl. Pharmacol. 2000, 169, 177–184. [Google Scholar] [CrossRef]
- Zhang, J.; Zuo, Z.; Zhu, W.; Sun, P.; Wang, C. Sex-different effects of tributyltin on brain aromatase, estrogen receptor and retinoid X receptor gene expression in rockfish (Sebastiscus marmoratus). Mar. Environ. Res. 2013, 90, 113–118. [Google Scholar] [CrossRef] [PubMed]
- Nakanishi, T. Endocrine disruption induced by organotin compounds; organotins function as a powerful agonist for nuclear receptors rather than an aromatase inhibitor. J. Toxicol. Sci. 2008, 33, 269–276. [Google Scholar] [CrossRef]
- Grun, F.; Blumberg, B. Environmental obesogens: Organotins and endocrine disruption via nuclear receptor signaling. Endocrinology 2006, 147, S50–S55. [Google Scholar] [CrossRef]
- Zhan, J.; Ma, X.; Liu, D.; Liang, Y.; Li, P.; Cui, J.; Zhou, Z.; Wang, P. Gut microbiome alterations induced by tributyltin exposure are associated with increased body weight, impaired glucose and insulin homeostasis and endocrine disruption in mice. Environ. Pollut. 2020, 266, 115276. [Google Scholar] [CrossRef] [PubMed]
- Oberto, A.; Mele, P.; Zammaretti, F.; Panzica, G.C.; Eva, C. Evidence of Altered Neuropeptide Y Content and Neuropeptide Y1 Receptor Gene Expression in the Hypothalamus of Pregnant Transgenic Mice. Endocrinology 2003, 144, 4826–4830. [Google Scholar] [CrossRef][Green Version]
- Chronwall, B.M. Anatomical distribution of NPY and NPY messenger RNA in rat brain. In Neuropeptide Y; Mutt, V., Ed.; Raven Press: New York, NY, USA, 1989; pp. 51–59. [Google Scholar]
- Danger, J.M.; Tonon, M.C.; Basille, C.; Jenks, B.G.; Saint Pierre, S.; Martel, J.C.; Fasolo, A.; Quirion, R.; Pelletier, G.; Vaudry, H. Neuropeptide Y: Localization in the central nervous system and neuroendocrine functions. Fundam. Clin. Pharmacol. 1990, 4, 307–340. [Google Scholar] [CrossRef]
- Morris, B.J. Neuronal localisation of neuropeptide Y gene expression in rat brain. J. Comp. Neurol. 1989, 290, 358–368. [Google Scholar] [CrossRef] [PubMed]
- Gumbs, M.C.R.; Vuuregge, A.H.; Eggels, L.; Unmehopa, U.A.; Lamuadni, K.; Mul, J.D.; la Fleur, S.E. Afferent neuropeptide Y projections to the ventral tegmental area in normal-weight male Wistar rats. J. Comp. Neurol. 2019, 527, 2659–2674. [Google Scholar] [CrossRef] [PubMed]
- Watson, S.J.; Richard, C.W., 3rd; Barchas, J.D. Adrenocorticotropin in rat brain: Immunocytochemical localization in cells and axons. Science 1978, 200, 1180–1182. [Google Scholar] [CrossRef]
- Jacobowitz, D.M.; O’Donohue, T.L. alpha-Melanocyte stimulating hormone: Immunohistochemical identification and mapping in neurons of rat brain. Proc. Natl. Acad. Sci. USA 1978, 75, 6300–6304. [Google Scholar] [CrossRef]
- Bagnol, D.; Lu, X.Y.; Kaelin, C.B.; Day, H.E.; Ollmann, M.; Gantz, I.; Akil, H.; Barsh, G.S.; Watson, S.J. Anatomy of an endogenous antagonist: Relationship between Agouti-related protein and proopiomelanocortin in brain. J. Neurosci. 1999, 19, RC26. [Google Scholar] [CrossRef]
- King, C.M.; Hentges, S.T. Relative number and distribution of murine hypothalamic proopiomelanocortin neurons innervating distinct target sites. PLoS ONE 2011, 6, e25864. [Google Scholar] [CrossRef]
- Heindel, J.J.; Vom Saal, F.S.; Blumberg, B.; Bovolin, P.; Calamandrei, G.; Ceresini, G.; Cohn, B.A.; Fabbri, E.; Gioiosa, L.; Kassotis, C.; et al. Parma consensus statement on metabolic disruptors. Environ. Health Glob. Access Sci. Source 2015, 14, 54. [Google Scholar] [CrossRef] [PubMed]
- Cederroth, C.; Vinciguerra, M.; Kühne, F.; Madani, R.; Doerge, D.; Visser, T.; Foti, M.; Rohner-Jeanrenaud, F.; Vassalli, J.-D.; Nef, S. A phytoestrogen-rich diet increases energy expenditure and decreases adiposity in mice. Environ. Health Perspect. 2007, 115, 1467–1473. [Google Scholar] [CrossRef] [PubMed]
- Murata, Y.; Robertson, K.M.; Jones, M.E.; Simpson, E.R. Effect of estrogen deficiency in the male: The ArKO mouse model. Mol. Cell Endocrinol. 2002, 193, 7–12. [Google Scholar] [CrossRef]
- Heine, P.A.; Taylor, J.A.; Iwamoto, G.A.; Lubahn, D.B.; Cooke, P.S. Increased adipose tissue in male and female estrogen receptor-alpha knockout mice. Proc. Natl. Acad. Sci. USA 2000, 97, 12729–12734. [Google Scholar] [CrossRef]
- Welshons, W.V.; Nagel, S.C.; vom Saal, F.S. Large effects from small exposures. III. Endocrine mechanisms mediating effects of bisphenol A at levels of human exposure. Endocrinology 2006, 147, S56–S69. [Google Scholar] [CrossRef]
- Allera, A.; Lo, S.; King, I.; Steglich, F.; Klingmuller, D. Impact of androgenic/antiandrogenic compounds (AAC) on human sex steroid metabolizing key enzymes. Toxicology 2004, 205, 75–85. [Google Scholar] [CrossRef]
- De Souza, F.S.; Nasif, S.; Lopez-Leal, R.; Levi, D.H.; Low, M.J.; Rubinsten, M. The estrogen receptor alpha colocalizes with proopiomelanocortin in hypothalamic neurons and binds to a conserved motif present in the neuron-specific enhancer nPE2. Eur. J. Pharmacol. 2011, 660, 181–187. [Google Scholar] [CrossRef] [PubMed]
- Marraudino, M.; Miceli, D.; Farinetti, A.; Ponti, G.; Panzica, G.; Gotti, S. Kisspeptin innervation of the hypothalamic paraventricular nucleus: Sexual dimorphism and effect of estrous cycle in female mice. J. Anat. 2017, 230, 775–786. [Google Scholar] [CrossRef] [PubMed]
- Vandenberg, L.N.; Colborn, T.; Hayes, T.B.; Heindel, J.J.; Jacobs, D.R., Jr.; Lee, D.H.; Shioda, T.; Soto, A.M.; vom Saal, F.S.; Welshons, W.V.; et al. Hormones and endocrine-disrupting chemicals: Low-dose effects and nonmonotonic dose responses. Endocr. Rev. 2012, 33, 378–455. [Google Scholar] [CrossRef] [PubMed]
- Arletti, R.; Benelli, A.; Bertolini, A. Oxytocin inhibits food and fluid intake in rats. Physiol. Behav. 1990, 48, 825–830. [Google Scholar] [CrossRef]
- Maejima, Y.; Sakuma, K.; Santoso, P.; Gantulga, D.; Katsurada, K.; Ueta, Y.; Hiraoka, Y.; Nishimori, K.; Tanaka, S.; Shimomura, K.; et al. Oxytocinergic circuit from paraventricular and supraoptic nuclei to arcuate POMC neurons in hypothalamus. FEBS Lett. 2014, 588, 4404–4412. [Google Scholar] [CrossRef]
- Hrabovszky, E.; Kallo, I.; Steinhauser, A.; Merchenthaler, I.; Coen, C.W.; Petersen, S.L.; Liposits, Z. Estrogen receptor-beta in oxytocin and vasopressin neurons of the rat and human hypothalamus: Immunocytochemical and in situ hybridization studies. J. Comp. Neurol. 2004, 473, 315–333. [Google Scholar] [CrossRef]
- Forsling, M.L.; Kallo, I.; Hartley, D.E.; Heinze, L.; Ladek, R.; Coen, C.W.; File, S.E. Oestrogen receptor-beta and neurohypophysial hormones: Functional interaction and neuroanatomical localisation. Pharmacol. Biochem. Behav. 2003, 76, 535–542. [Google Scholar] [CrossRef]
- Gamber, K.M.; Macarthur, H.; Westfall, T.C. Cannabinoids augment the release of neuropeptide Y in the rat hypothalamus. Neuropharmacology 2005, 49, 646–652. [Google Scholar] [CrossRef]
- Koch, M.; Varela, L.; Kim, J.G.; Kim, J.D.; Hernandez-Nuno, F.; Simonds, S.E.; Castorena, C.M.; Vianna, C.R.; Elmquist, J.K.; Morozov, Y.M.; et al. Hypothalamic POMC neurons promote cannabinoid-induced feeding. Nature 2015, 519, 45–50. [Google Scholar] [CrossRef] [PubMed]
- Gonzalez, S.; Mauriello-Romanazzi, G.; Berrendero, F.; Ramos, J.A.; Franzoni, M.F.; Fernandez-Ruiz, J. Decreased cannabinoid CB1 receptor mRNA levels and immunoreactivity in pituitary hyperplasia induced by prolonged exposure to estrogens. Pituitary 2000, 3, 221–226. [Google Scholar] [CrossRef]
- Suglia, A.; Chianese, R.; Migliaccio, M.; Ambrosino, C.; Fasano, S.; Pierantoni, R.; Cobellis, G.; Chioccarelli, T. Bisphenol A induces hypothalamic down-regulation of the the cannabinoid receptor 1 and anorexigenic effects in male mice. Pharmacol. Res. 2016, 113, 376–383. [Google Scholar] [CrossRef]
- Garcia, S.M.; Hirschberg, P.R.; Sarkar, P.; Siegel, D.M.; Teegala, S.B.; Vail, G.M.; Routh, V.H. Insulin actions on hypothalamic glucose-sensing neurones. J. Neuroendocrinol. 2021, 33, e12937. [Google Scholar] [CrossRef]
- Farrugia, F.; Aquilina, A.; Vassallo, J.; Pace, N.P. Bisphenol A and Type 2 Diabetes Mellitus: A Review of Epidemiologic, Functional, and Early Life Factors. Int. J. Environ. Res. Public. Health 2021, 18, 716. [Google Scholar] [CrossRef] [PubMed]
- Hao, C.J.; Cheng, X.J.; Xia, H.F.; Ma, X. The endocrine disruptor diethylstilbestrol induces adipocyte differentiation and promotes obesity in mice. Toxicol. Appl. Pharmacol. 2012, 263, 102–110. [Google Scholar] [CrossRef] [PubMed]
- Ahmed, E.I.; Zehr, J.L.; Schulz, K.M.; Lorenz, B.H.; DonCarlos, L.L.; Sisk, C.L. Pubertal hormones modulate the addition of new cells to sexually dimorphic brain regions. Nat. Neurosci. 2008, 11, 995–997. [Google Scholar] [CrossRef] [PubMed]
- Morishita, M.; Maejima, S.; Tsukahara, S. Gonadal Hormone-Dependent Sexual Differentiation of a Female-Biased Sexually Dimorphic Cell Group in the Principal Nucleus of the Bed Nucleus of the Stria Terminalis in Mice. Endocrinology 2017, 158, 3512–3525. [Google Scholar] [CrossRef] [PubMed]
- Bouret, S.G. Development of Hypothalamic Circuits That Control Food Intake and Energy Balance. In Appetite and Food Intake: Central Control; Harris, R.B.S., Ed.; CRC Press: Boca Raton, FL, USA, 2017; pp. 135–154. [Google Scholar]
- Ishii, Y.; Bouret, S.G. Embryonic birthdate of hypothalamic leptin-activated neurons in mice. Endocrinology 2012, 153, 3657–3667. [Google Scholar] [CrossRef] [PubMed]
- Melnick, I.; Pronchuk, N.; Cowley, M.A.; Grove, K.L.; Colmers, W.F. Developmental switch in neuropeptide Y and melanocortin effects in the paraventricular nucleus of the hypothalamus. Neuron 2007, 56, 1103–1115. [Google Scholar] [CrossRef]
- Safahani, M.; Aligholi, H.; Noorbakhsh, F.; Djalali, M.; Pishva, H.; Modarres Mousavi, S.M.; Alizadeh, L.; Gorji, A.; Koohdani, F. Switching from high-fat diet to foods containing resveratrol as a calorie restriction mimetic changes the architecture of arcuate nucleus to produce more newborn anorexigenic neurons. Eur. J. Nutr. 2019, 58, 1687–1701. [Google Scholar] [CrossRef]
- Yirun, A.; Ozkemahli, G.; Balci, A.; Erkekoglu, P.; Zeybek, N.D.; Yersal, N.; Kocer-Gumusel, B. Neuroendocrine disruption by bisphenol A and/or di(2-ethylhexyl) phthalate after prenatal, early postnatal and lactational exposure. Environ. Sci. Pollut. Res. Int. 2021. [Google Scholar] [CrossRef] [PubMed]
- Penza, M.; Jeremic, M.; Marrazzo, E.; Maggi, A.; Ciana, P.; Rando, G.; Grigolato, P.G.; Di Lorenzo, D. The environmental chemical tributyltin chloride (TBT) shows both estrogenic and adipogenic activities in mice which might depend on the exposure dose. Toxicol. Appl. Pharmacol. 2011, 255, 65–75. [Google Scholar] [CrossRef]
- Harkness, J.E.; Wagner, J.E. The Biology and Medicine of Rabbits and Rodents, 3rd ed.; Lea and Febiger: Philadelphia, PA, USA, 1989. [Google Scholar]
- Watson, R.E.; Wiegand, S.J.; Clough, R.W.; Hoffman, G.E. Use of cryoprotectant to maintain long-term peptide immunoreactivity and tissue morphology. Peptides 1986, 7, 155–159. [Google Scholar] [CrossRef]
- Gouaze, A.; Brenachot, X.; Rigault, C.; Krezymon, A.; Rauch, C.; Nedelec, E.; Lemoine, A.; Gascuel, J.; Bauer, S.; Penicaud, L.; et al. Cerebral cell renewal in adult mice controls the onset of obesity. PLoS ONE 2013, 8, e72029. [Google Scholar] [CrossRef] [PubMed]
- Kabra, D.G.; Pfuhlmann, K.; Garcia-Caceres, C.; Schriever, S.C.; Casquero Garcia, V.; Kebede, A.F.; Fuente-Martin, E.; Trivedi, C.; Heppner, K.; Uhlenhaut, N.H.; et al. Hypothalamic leptin action is mediated by histone deacetylase 5. Nat. Commun. 2016, 7, 10782. [Google Scholar] [CrossRef]
- Pelletier, G.; Desy, L.; Kerkerian, L.; Cote, J. Immunocytochemical localization of neuropeptide Y (NPY) in the human hypothalamus. Cell Tissue Res. 1984, 238, 203–205. [Google Scholar] [CrossRef]
- Pelletier, G.; Guy, J.; Allen, Y.S.; Polak, J.M. Electron microscopic immunocytochemical localization of neuropeptide Y (NPY) in the rat brain. Neuropeptides 1984, 4, 319–324. [Google Scholar] [CrossRef]
- Lemus, M.B.; Bayliss, J.A.; Lockie, S.H.; Santos, V.V.; Reichenbach, A.; Stark, R.; Andrews, Z.B. A stereological analysis of NPY, POMC, Orexin, GFAP astrocyte, and Iba1 microglia cell number and volume in diet-induced obese male mice. Endocrinology 2015, 156, 1701–1713. [Google Scholar] [CrossRef]
- Marraudino, M.; Martini, M.; Trova, S.; Farinetti, A.; Ponti, G.; Gotti, S.; Panzica, G. Kisspeptin system in ovariectomized mice: Estradiol and progesterone regulation. Brain Res. 2018, 1688, 8–14. [Google Scholar] [CrossRef] [PubMed]
- Paxinos, G.; Franklin, K.B.J. The Mouse Brain in Stereotaxic Coordinates, 2nd ed.; Academic Press: San Diego, CA, USA, 2001. [Google Scholar]


| Groups | Body Weight (g) Mean +/− SEM | p Value |
|---|---|---|
| CRL | 31.2 ± 2.92 | |
| TBT 0.5 | 31 ± 0.89 | 0.912 |
| TBT 500 | 31.2 ± 0.80 | 1.000 |
| DES 0.05 | 29.4 ± 1.21 | 0.323 |
| DES 50 | 26.6 ± 0.93 | 0.015 * |
| BPA 5 | 28.6 ± 0.75 | 0.156 |
| BPA 500 | 29.6 ± 0.93 | 0.379 |
| E2 5 | 26.75 ± 0.48 | 0.025 * |
| E2 50 | 27.17 ± 0.65 | 0.025 * |
Publisher’s Note: MDPI stays neutral with regard to jurisdictional claims in published maps and institutional affiliations. |
© 2021 by the authors. Licensee MDPI, Basel, Switzerland. This article is an open access article distributed under the terms and conditions of the Creative Commons Attribution (CC BY) license (https://creativecommons.org/licenses/by/4.0/).
Share and Cite
Marraudino, M.; Bo, E.; Carlini, E.; Farinetti, A.; Ponti, G.; Zanella, I.; Di Lorenzo, D.; Panzica, G.C.; Gotti, S. Hypothalamic Expression of Neuropeptide Y (NPY) and Pro-OpioMelanoCortin (POMC) in Adult Male Mice Is Affected by Chronic Exposure to Endocrine Disruptors. Metabolites 2021, 11, 368. https://doi.org/10.3390/metabo11060368
Marraudino M, Bo E, Carlini E, Farinetti A, Ponti G, Zanella I, Di Lorenzo D, Panzica GC, Gotti S. Hypothalamic Expression of Neuropeptide Y (NPY) and Pro-OpioMelanoCortin (POMC) in Adult Male Mice Is Affected by Chronic Exposure to Endocrine Disruptors. Metabolites. 2021; 11(6):368. https://doi.org/10.3390/metabo11060368
Chicago/Turabian StyleMarraudino, Marilena, Elisabetta Bo, Elisabetta Carlini, Alice Farinetti, Giovanna Ponti, Isabella Zanella, Diego Di Lorenzo, Gian Carlo Panzica, and Stefano Gotti. 2021. "Hypothalamic Expression of Neuropeptide Y (NPY) and Pro-OpioMelanoCortin (POMC) in Adult Male Mice Is Affected by Chronic Exposure to Endocrine Disruptors" Metabolites 11, no. 6: 368. https://doi.org/10.3390/metabo11060368
APA StyleMarraudino, M., Bo, E., Carlini, E., Farinetti, A., Ponti, G., Zanella, I., Di Lorenzo, D., Panzica, G. C., & Gotti, S. (2021). Hypothalamic Expression of Neuropeptide Y (NPY) and Pro-OpioMelanoCortin (POMC) in Adult Male Mice Is Affected by Chronic Exposure to Endocrine Disruptors. Metabolites, 11(6), 368. https://doi.org/10.3390/metabo11060368