
Identification and Reproducibility of Urinary Metabolomic Biomarkers of Habitual Food Intake in a Cross-Sectional Analysis of the Cancer Prevention Study-3 Diet Assessment Sub-Study

 , ,
, ,
Abstract
1. Introduction
2. Results
2.1. Participant Characteristics
2.2. 24 h Urinary Metabolites Correlated with Habitual Dietary Intake Assessed by Post-FFQ and 24HRs
2.2.1. Fruits
2.2.2. Vegetables
2.2.3. Grains
2.2.4. Proteins
2.2.5. Dairy/Dairy Alternatives
2.2.6. Fats and Oils
2.2.7. Alcohol
2.2.8. Beverages
2.2.9. Miscellaneous
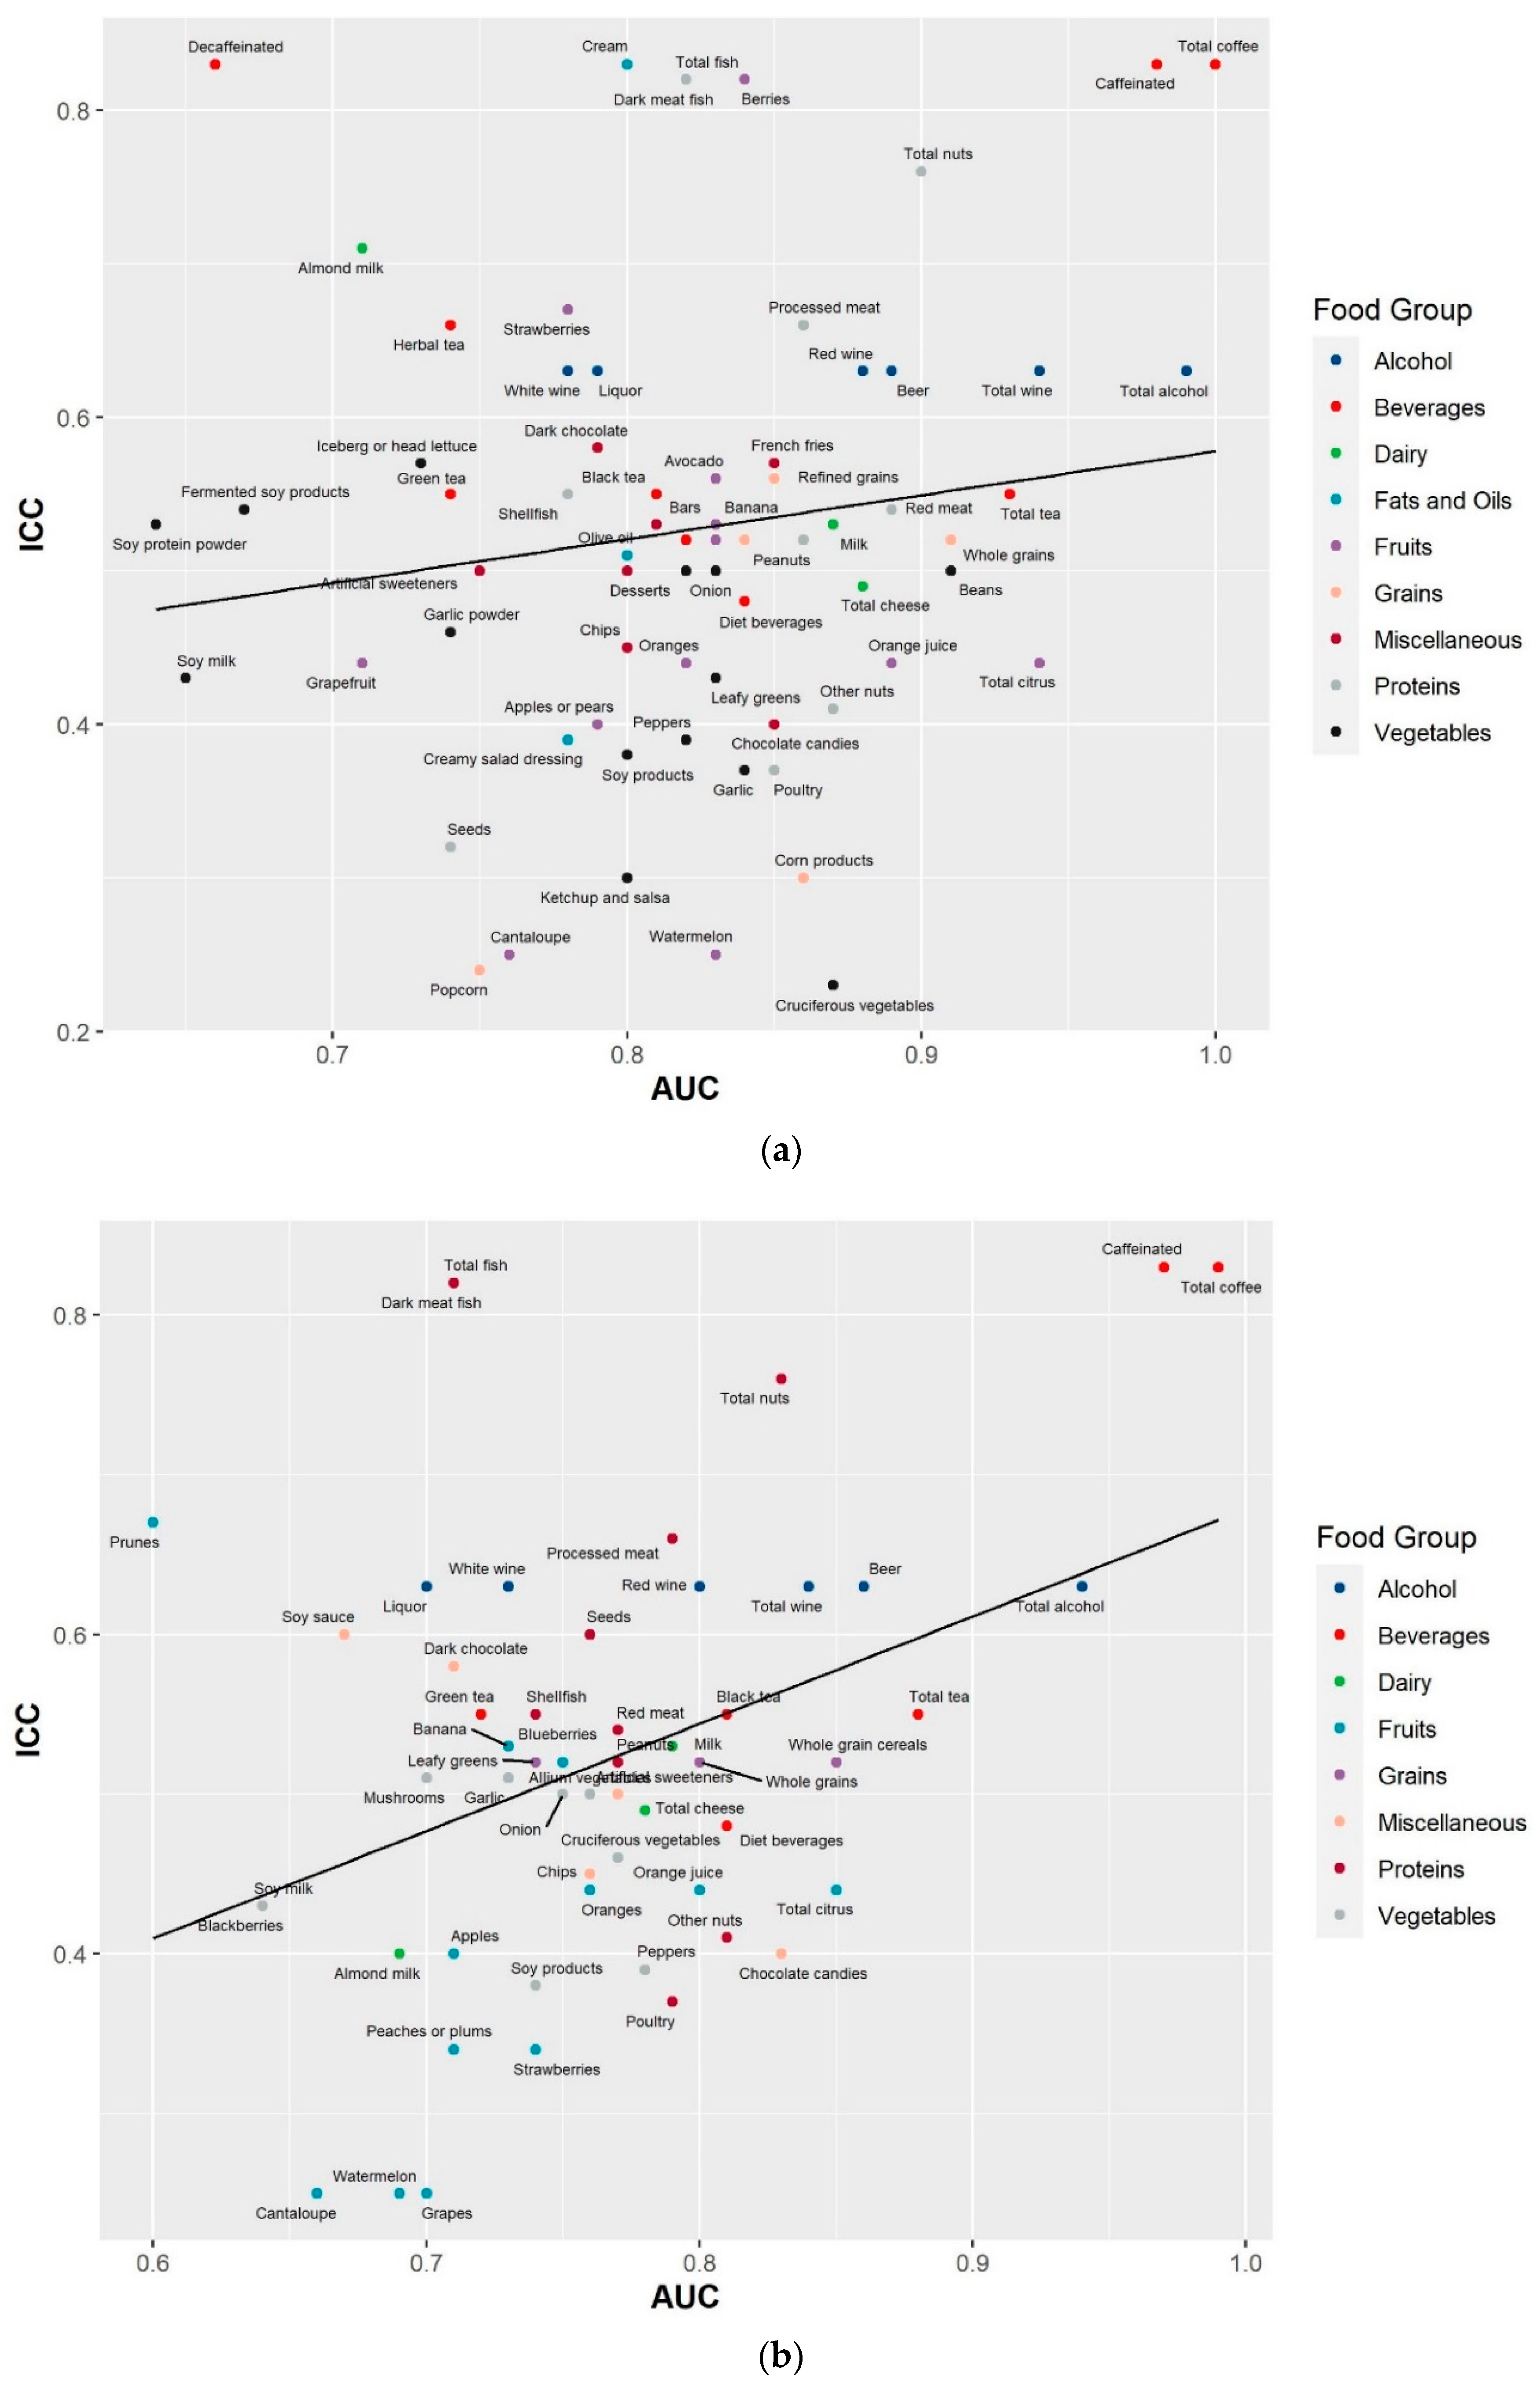
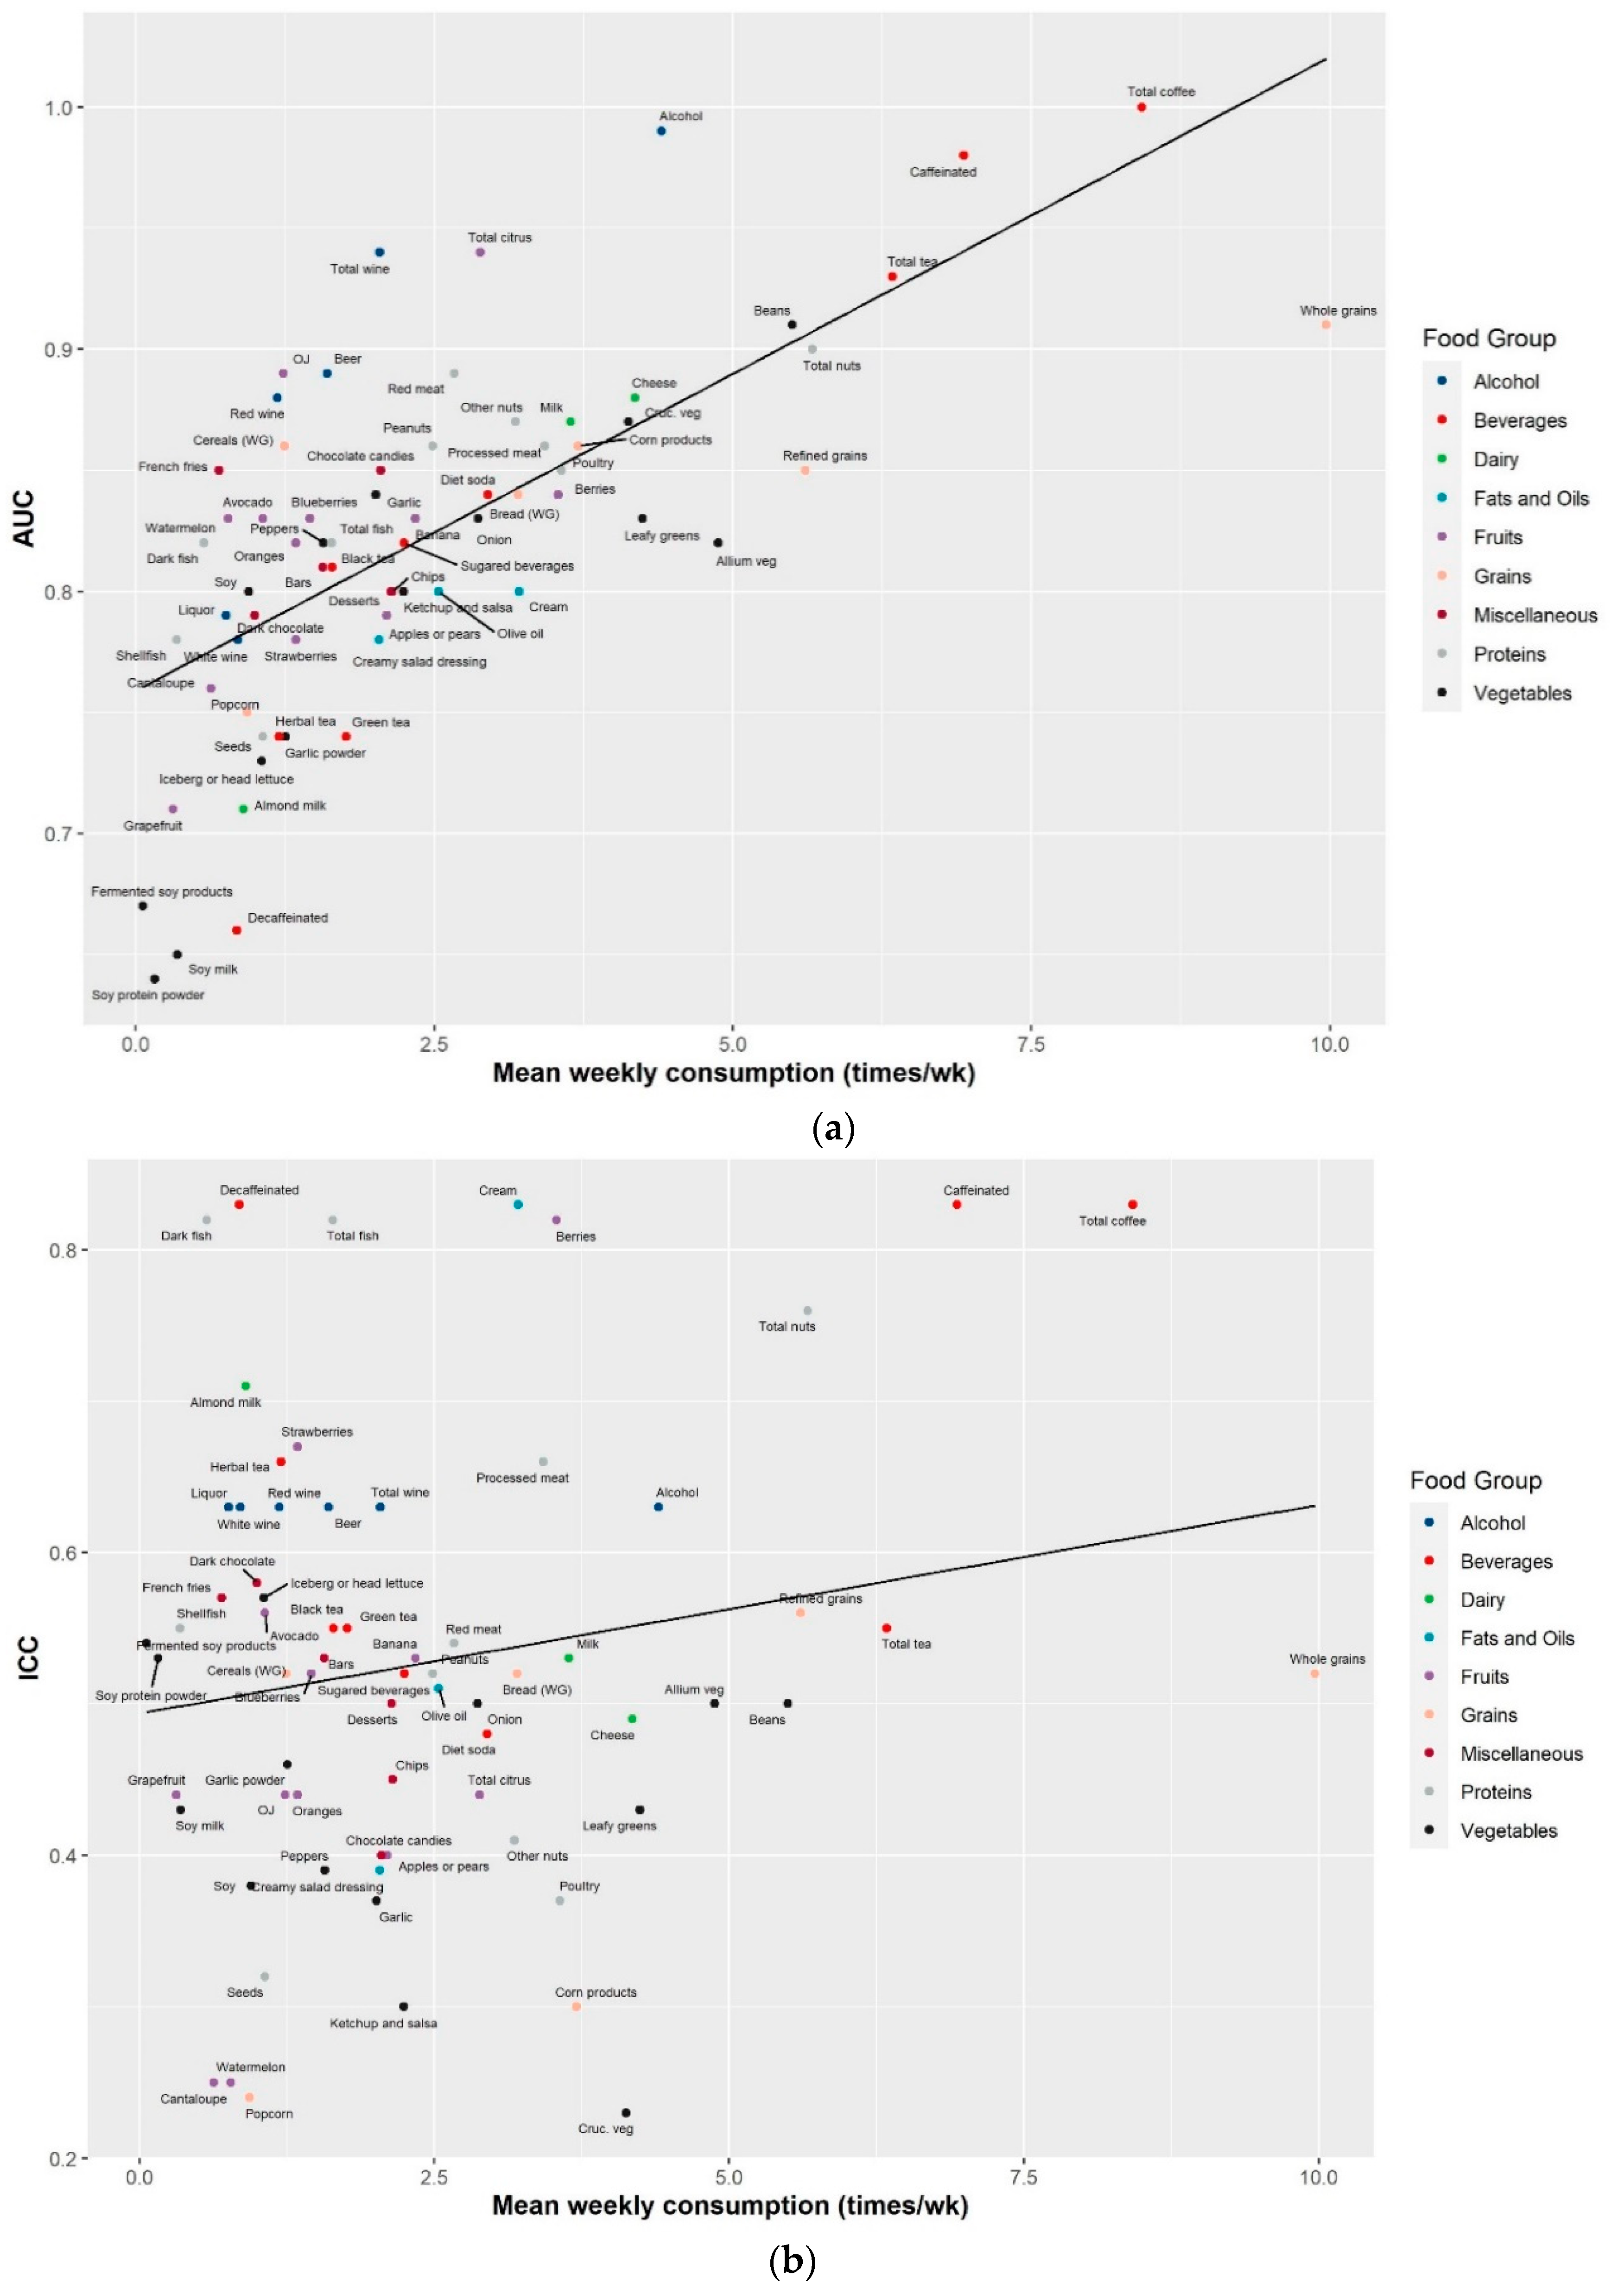
2.3. Reproducibility of the Identified Food Metabolites
3. Discussion
4. Materials and Methods
4.1. Study Population
4.2. Diet Assessment
4.3. 24 h Urine Collection and Processing
4.4. Metabolomics Analysis
4.5. Statistical Analysis
5. Conclusions
Supplementary Materials
Author Contributions
Funding
Institutional Review Board Statement
Informed Consent Statement
Data Availability Statement
Acknowledgments
Conflicts of Interest
Disclaimer
References
- Rock, C.L.; Thomson, C.; Gansler, T.; Gapstur, S.M.; McCullough, M.L.; Patel, A.V.; Andrews, K.S.; Bandera, E.V.; Spees, C.K.; Robien, K.; et al. American Cancer Society guideline for diet and physical activity for cancer prevention. CA Cancer J. Clin. 2020, 70, 245–271. [Google Scholar] [CrossRef]
- US Department of Health and Human Services; US Department of Agriculture. 2015–2020 Dietary Guidelines for Americans. Available online: http://www.health.gov/DietaryGuidelines (accessed on 18 August 2020).
- World Cancer Research Fund; American Institute for Cancer Research. Diet, Nutrition, Physical Activity and Cancer: A Global Perspective. Continuous Update Project Expert Report 2018. Available online: https://www.wcrf.org/sites/default/files/Summary-of-Third-Expert-Report-2018.pdf (accessed on 18 August 2020).
- Brennan, L.; Hu, F.B. Metabolomics-Based Dietary Biomarkers in Nutritional Epidemiology-Current Status and Future Opportunities. Mol. Nutr. Food Res. 2019, 63, e1701064. [Google Scholar] [CrossRef]
- Scalbert, A.; Brennan, L.; Manach, C.; Andres-Lacueva, C.; Dragsted, L.O.; Draper, J.; Rappaport, S.M.; van der Hooft, J.J.; Wishart, D.S. The food metabolome: A window over dietary exposure. Am. J. Clin. Nutr. 2014, 99, 1286–1308. [Google Scholar] [CrossRef]
- Wang, Y.; Gapstur, S.M.; Carter, B.D.; Hartman, T.J.; Stevens, V.L.; Gaudet, M.M.; McCullough, M.L. Untargeted Metabolomics Identifies Novel Potential Biomarkers of Habitual Food Intake in a Cross-Sectional Study of Postmenopausal Women. J. Nutr. 2018, 148, 932–943. [Google Scholar] [CrossRef]
- Pallister, T.; Jennings, A.; Mohney, R.P.; Yarand, D.; Mangino, M.; Cassidy, A.; MacGregor, A.; Spector, T.D.; Menni, C. Characterizing Blood Metabolomics Profiles Associated with Self-Reported Food Intakes in Female Twins. PLoS ONE 2016, 11, e0158568. [Google Scholar] [CrossRef] [PubMed]
- Guertin, K.A.; Moore, S.C.; Sampson, J.N.; Huang, W.Y.; Xiao, Q.; Stolzenberg-Solomon, R.Z.; Sinha, R.; Cross, A.J. Metabolomics in nutritional epidemiology: Identifying metabolites associated with diet and quantifying their potential to uncover diet-disease relations in populations. Am. J. Clin. Nutr. 2014, 100, 208–217. [Google Scholar] [CrossRef] [PubMed]
- Andersen, M.B.; Kristensen, M.; Manach, C.; Pujos-Guillot, E.; Poulsen, S.K.; Larsen, T.M.; Astrup, A.; Dragsted, L. Discovery and validation of urinary exposure markers for different plant foods by untargeted metabolomics. Anal. Bioanal. Chem. 2014, 406, 1829–1844. [Google Scholar] [CrossRef] [PubMed]
- Zheng, Y.; Yu, B.; Alexander, D.; Steffen, L.M.; Boerwinkle, E. Human metabolome associates with dietary intake habits among African Americans in the atherosclerosis risk in communities study. Am. J. Epidemiol. 2014, 179, 1424–1433. [Google Scholar] [CrossRef]
- Playdon, M.C.; Sampson, J.N.; Cross, A.J.; Sinha, R.; Guertin, K.A.; Moy, K.A.; Rothman, N.; Irwin, M.L.; Mayne, S.T.; Stolzenberg-Solomon, R.; et al. Comparing metabolite profiles of habitual diet in serum and urine. Am. J. Clin. Nutr. 2016, 104, 776–789. [Google Scholar] [CrossRef] [PubMed]
- Edmands, W.M.; Ferrari, P.; Rothwell, J.A.; Rinaldi, S.; Slimani, N.; Barupal, D.K.; Biessy, C.; Jenab, M.; Clavel-Chapelon, F.; Fagherazzi, G.; et al. Polyphenol metabolome in human urine and its association with intake of polyphenol-rich foods across European countries. Am. J. Clin. Nutr. 2015, 102, 905–913. [Google Scholar] [CrossRef]
- Wang, Y.; Hodge, R.A.; Stevens, V.L.; Hartman, T.J.; McCullough, M.L. Identification and Reproducibility of Plasma Metabolomic Biomarkers of Habitual Food Intake in a US Diet Validation Study. Metabolites 2020, 10, 382. [Google Scholar] [CrossRef] [PubMed]
- Playdon, M.C.; Moore, S.C.; Derkach, A.; Reedy, J.; Subar, A.F.; Sampson, J.N.; Albanes, D.; Gu, F.; Kontto, J.; Lassale, C.; et al. Identifying biomarkers of dietary patterns by using metabolomics. Am. J. Clin. Nutr. 2017, 105, 450–465. [Google Scholar] [CrossRef]
- McCullough, M.L.; Maliniak, M.L.; Stevens, V.L.; Carter, B.D.; Hodge, R.A.; Wang, Y. Metabolomic markers of healthy dietary patterns in US postmenopausal women. Am. J. Clin. Nutr. 2019, 109, 1439–1451. [Google Scholar] [CrossRef] [PubMed]
- Maruvada, P.; Lampe, J.W.; Wishart, D.S.; Barupal, D.; Chester, D.N.; Dodd, D.; Djoumbou-Feunang, Y.; Dorrestein, P.C.; Dragsted, L.O.; Draper, J.; et al. Perspective: Dietary Biomarkers of Intake and Exposure-Exploration with Omics Approaches. Adv. Nutr. 2020, 11, 200–215. [Google Scholar] [CrossRef]
- Sampson, J.N.; Boca, S.M.; Shu, X.O.; Stolzenberg-Solomon, R.Z.; Matthews, C.E.; Hsing, A.W.; Tan, Y.T.; Ji, B.T.; Chow, W.H.; Cai, Q.; et al. Metabolomics in epidemiology: Sources of variability in metabolite measurements and implications. Cancer Epidemiol. Biomark. Prev. 2013, 22, 631–640. [Google Scholar] [CrossRef] [PubMed]
- Xiao, Q.; Moore, S.C.; Boca, S.M.; Matthews, C.E.; Rothman, N.; Stolzenberg-Solomon, R.Z.; Sinha, R.; Cross, A.J.; Sampson, J.N. Sources of variability in metabolite measurements from urinary samples. PLoS ONE 2014, 9, e95749. [Google Scholar] [CrossRef] [PubMed]
- Davis, B.D.; Needs, P.W.; Kroon, P.A.; Brodbelt, J.S. Identification of isomeric flavonoid glucuronides in urine and plasma by metal complexation and LC-ESI-MS/MS. J. Mass Spectrom. 2006, 41, 911–920. [Google Scholar] [CrossRef]
- Pimpao, R.C.; Ventura, M.R.; Ferreira, R.B.; Williamson, G.; Santos, C.N. Phenolic sulfates as new and highly abundant metabolites in human plasma after ingestion of a mixed berry fruit puree. Br. J. Nutr. 2015, 113, 454–463. [Google Scholar] [CrossRef] [PubMed]
- Shelnutt, S.R.; Cimino, C.O.; Wiggins, P.A.; Ronis, M.J.; Badger, T.M. Pharmacokinetics of the glucuronide and sulfate conjugates of genistein and daidzein in men and women after consumption of a soy beverage. Am. J. Clin. Nutr. 2002, 76, 588–594. [Google Scholar] [CrossRef]
- Shelnutt, S.R.; Cimino, C.O.; Wiggins, P.A.; Badger, T.M. Urinary pharmacokinetics of the glucuronide and sulfate conjugates of genistein and daidzein. Cancer Epidemiol. Biomark. Prev. 2000, 9, 413–419. [Google Scholar]
- Saha, S.; Hollands, W.; Teucher, B.; Needs, P.W.; Narbad, A.; Ortori, C.A.; Barrett, D.A.; Rossiter, J.T.; Mithen, R.F.; Kroon, P.A. Isothiocyanate concentrations and interconversion of sulforaphane to erucin in human subjects after consumption of commercial frozen broccoli compared to fresh broccoli. Mol. Nutr. Food Res. 2012, 56, 1906–1916. [Google Scholar] [CrossRef] [PubMed]
- de Rooij, B.M.; Boogaard, P.J.; Rijksen, D.A.; Commandeur, J.N.; Vermeulen, N.P. Urinary excretion of N-acetyl-S-allyl-L-cysteine upon garlic consumption by human volunteers. Arch. Toxicol. 1996, 70, 635–639. [Google Scholar] [CrossRef]
- Pratico, G.; Gao, Q.; Manach, C.; Dragsted, L.O. Biomarkers of food intake for Allium vegetables. Genes Nutr. 2018, 13, 34. [Google Scholar] [CrossRef] [PubMed]
- Zhu, Y.; Wang, P.; Sha, W.; Sang, S. Urinary Biomarkers of Whole Grain Wheat Intake Identified by Non-targeted and Targeted Metabolomics Approaches. Sci. Rep. 2016, 6, 36278. [Google Scholar] [CrossRef]
- Heinzmann, S.S.; Holmes, E.; Kochhar, S.; Nicholson, J.K.; Schmitt-Kopplin, P. 2-Furoylglycine as a Candidate Biomarker of Coffee Consumption. J. Agric. Food Chem. 2015, 63, 8615–8621. [Google Scholar] [CrossRef]
- Manach, C.; Williamson, G.; Morand, C.; Scalbert, A.; Remesy, C. Bioavailability and bioefficacy of polyphenols in humans. I. Review of 97 bioavailability studies. Am. J. Clin. Nutr. 2005, 81, 230S–242S. [Google Scholar] [CrossRef]
- Dragsted, L.O.; Gao, Q.; Scalbert, A.; Vergeres, G.; Kolehmainen, M.; Manach, C.; Brennan, L.; Afman, L.A.; Wishart, D.S.; Andres Lacueva, C.; et al. Validation of biomarkers of food intake-critical assessment of candidate biomarkers. Genes Nutr. 2018, 13, 14. [Google Scholar] [CrossRef] [PubMed]
- Patel, A.V.; Jacobs, E.J.; Dudas, D.M.; Briggs, P.J.; Lichtman, C.J.; Bain, E.B.; Stevens, V.L.; McCullough, M.L.; Teras, L.R.; Campbell, P.T.; et al. The American Cancer Society’s Cancer Prevention Study 3 (CPS-3): Recruitment, study design, and baseline characteristics. Cancer 2017, 123, 2014–2024. [Google Scholar] [CrossRef] [PubMed]
- Troeschel, A.N.; Hartman, T.J.; Flanders, W.D.; Wang, Y.; Hodge, R.A.; McCullough, L.E.; Mitchell, D.C.; Sampson, L.; Patel, A.V.; McCullough, M.L. The American Cancer Society Cancer Prevention Study-3 FFQ Has Reasonable Validity and Reproducibility for Food Groups and a Diet Quality Score. J. Nutr. 2020, 150, 1566–1578. [Google Scholar] [CrossRef] [PubMed]
- Rimm, E.B.; Giovannucci, E.L.; Stampfer, M.J.; Colditz, G.A.; Litin, L.B.; Willett, W.C. Reproducibility and validity of an expanded self-administered semiquantitative food frequency questionnaire among male health professionals. Am. J. Epidemiol. 1992, 135, 1114–1126; discussion 1127–1136. [Google Scholar] [CrossRef]
- Feskanich, D.; Rimm, E.B.; Giovannucci, E.L.; Colditz, G.A.; Stampfer, M.J.; Litin, L.B.; Willett, W.C. Reproducibility and validity of food intake measurements from a semiquantitative food frequency questionnaire. J. Am. Diet. Assoc. 1993, 93, 790–796. [Google Scholar] [CrossRef]
- Evans, A.M.; DeHaven, C.D.; Barrett, T.; Mitchell, M.; Milgram, E. Integrated, nontargeted ultrahigh performance liquid chromatography/electrospray ionization tandem mass spectrometry platform for the identification and relative quantification of the small-molecule complement of biological systems. Anal. Chem. 2009, 81, 6656–6667. [Google Scholar] [CrossRef] [PubMed]
- Evans, A.M.; Bridgewater, B.; Liu, Q.; Mitchell, M.; Robinson, R.; Dai, H.; Stewart, S.; DeHaven, C.; Miller, L.J.M. High resolution mass spectrometry improves data quantity and quality as compared to unit mass resolution mass spectrometry in high-throughput profiling. Metabolomics 2014, 4, 1. [Google Scholar]
- Huber, W.; Von Heydebreck, A.; Sültmann, H.; Poustka, A.; Vingron, M. Variance stabilization applied to microarray data calibration and to the quantification of differential expression. Bioinformatics 2002, 18, S96–S104. [Google Scholar] [CrossRef] [PubMed]
- Robin, X.; Turck, N.; Hainard, A.; Tiberti, N.; Lisacek, F.; Sanchez, J.-C.; Müller, M. pROC: An open-source package for R and S+ to analyze and compare ROC curves. BMC Bioinform. 2011, 12, 77. [Google Scholar] [CrossRef] [PubMed]


| Characteristics | Men (n = 227) | Women (n = 421) |
|---|---|---|
| Age (year) | 52.3 ± 10.1 | 52.2 ± 9.1 |
| Race/ethnicity | ||
| White | 146 (64.3) | 246 (58.4) |
| Black | 38 (16.7) | 120 (28.5) |
| Hispanic | 43 (18.9) | 55 (13.1) |
| BMI at pre-FFQ (kg/m2) | 27.2 (5.0) | 27.8 (6.5) |
| Education | ||
| <College | 39 (17.2) | 104 (24.7) |
| College | 78 (34.4) | 137 (32.5) |
| ≥Graduate school | 101 (44.5) | 167 (39.7) |
| Unknown | 9 (4.0) | 13 (3.1) |
| Smoking status | ||
| Never | 178 (78.4) | 336 (79.8) |
| Former | 49 (21.6) | 85 (20.2) |
| Recreational physical activity (MET-h/wk) | ||
| 0–<5 | 41 (18.1) | 120 (28.5) |
| 5–<10 2 | 71 (31.3) | 143 (34.0) |
| 10–<15 | 49 (21.6) | 72 (17.1) |
| ≥15 | 66 (29.1) | 86 (20.4) |
| Ethanol intake (g/d) | 10.4 ± 14.1 | 6.8 ± 11.1 |
| Energy from post-FFQ (kcal/d) | 2134 ± 687 | 2001 ± 611 |
| Average energy intake from 24HRs (kcal/d) | 2198 ± 570 | 1724 ± 407 |
| Food Group/Items | Biochemical Name 2 | Super Pathway | Sub Pathway | Post-FFQ | Average 24HRs | ICC 3 | ||||
|---|---|---|---|---|---|---|---|---|---|---|
| R | p Value | AUC | R | p Value | AUC | |||||
| FRUITS | ||||||||||
| Grapes | naringenin 7-glucuronide | Xenobiotics | Food Component/Plant | 0.10 | 1.52 × 10⁻² | 0.73 | 0.21 | 1.42 × 10⁻⁷ | 0.70 | 0.25 (0.17, 0.34) |
| Prunes | vanillactate | Amino Acid | Tyrosine Metabolism | 0.11 | 7.29 × 10⁻³ | 0.63 | 0.21 | 1.68 × 10⁻⁷ | 0.60 | 0.67 (0.62, 0.72) |
| Banana | dopamine 3-O-sulfate | Amino Acid | Tyrosine Metabolism | 0.30 | 6.60 × 10⁻¹⁵ | 0.83 | 0.25 | 1.48 × 10⁻¹⁰ | 0.73 | 0.53 (0.47, 0.60) |
| X-24338 | 0.30 | 3.37 × 10⁻¹⁴ | 0.82 | 0.27 | 5.94 × 10⁻¹² | 0.73 | 0.40 (0.33, 0.48) | |||
| ethyl pyruvate | Xenobiotics | Food Component/Plant | 0.25 | 2.24 × 10⁻¹⁰ | 0.80 | 0.25 | 1.17 × 10⁻¹⁰ | 0.74 | 0.38 (0.31, 0.46) | |
| Avocado | 3-methyladipate | Lipid | Fatty Acid, Dicarboxylate | 0.27 | 2.91 × 10⁻¹² | 0.83 | 0.18 | 7.13 × 10⁻⁶ | 0.74 | 0.56 (0.50, 0.62) |
| homocitrate | Xenobiotics | Food Component/Plant | 0.21 | 1.75 × 10⁻⁷ | 0.82 | 0.13 | 8.34 × 10⁻⁴ | 0.74 | 0.50 (0.44, 0.57) | |
| X-17335 | 0.21 | 1.23 × 10⁻⁷ | 0.82 | 0.08 | 5.29 × 10⁻² | 0.72 | 0.38 (0.31, 0.46) | |||
| Apples or pears | 4-allylphenol sulfate | Xenobiotics | Food Component/Plant | 0.21 | 1.34 × 10⁻⁷ | 0.79 | 0.40 (0.32, 0.47) | |||
| xylose | Carbohydrate | Pentose Metabolism | 0.21 | 1.74 × 10⁻⁷ | 0.77 | 0.34 (0.27, 0.43) | ||||
| Apples 4 | 4-allylphenol sulfate | Xenobiotics | Food Component/Plant | 0.25 | 1.10 × 10⁻¹⁰ | 0.71 | 0.40 (0.32, 0.47) | |||
| xylose | Carbohydrate | Pentose Metabolism | 0.24 | 1.94 × 10⁻⁹ | 0.71 | 0.34 (0.27, 0.43) | ||||
| X-25838 | 0.25 | 2.01 × 10⁻¹⁰ | 0.70 | 0.40 (0.32, 0.47) | ||||||
| Total citrus fruits and juices | stachydrine | Xenobiotics | Food Component/Plant | 0.52 | 7.41 × 10−45 | 0.94 | 0.46 | 6.06 × 10⁻³⁵ | 0.85 | 0.44 (0.37, 0.51) |
| N-methylglutamate | Amino Acid | Glutamate Metabolism | 0.46 | 4.00 × 10⁻³⁴ | 0.90 | 0.39 | 1.90 × 10⁻²⁴ | 0.82 | 0.47 (0.40, 0.54) | |
| X-12111 | 0.40 | 4.24 × 10⁻²⁶ | 0.90 | 0.40 | 9.72 × 10⁻²⁶ | 0.82 | 0.40 (0.33, 0.48) | |||
| Oranges | stachydrine | Xenobiotics | Food Component/Plant | 0.30 | 5.24 × 10⁻¹⁵ | 0.82 | 0.27 | 5.55 × 10⁻¹² | 0.76 | 0.44 (0.37, 0.51) |
| N-methylglutamate | Amino Acid | Glutamate Metabolism | 0.25 | 1.23 × 10⁻¹⁰ | 0.81 | 0.20 | 2.09 × 10⁻⁷ | 0.73 | 0.47 (0.40, 0.54) | |
| X-19183 | 0.24 | 1.94 × 10⁻⁹ | 0.79 | 0.25 | 1.42 × 10⁻¹⁰ | 0.75 | 0.34 (0.27, 0.42) | |||
| Orange juice | stachydrine | Xenobiotics | Food Component/Plant | 0.36 | 9.49 × 10⁻²¹ | 0.89 | 0.35 | 9.29 × 10⁻²⁰ | 0.80 | 0.44 (0.37, 0.51) |
| N-methylglutamate | Amino Acid | Glutamate Metabolism | 0.36 | 2.62 × 10⁻²⁰ | 0.88 | 0.34 | 2.14 × 10⁻¹⁸ | 0.79 | 0.47 (0.40, 0.54) | |
| X-12111 | 0.32 | 1.35 × 10⁻¹⁶ | 0.87 | 0.35 | 1.38 × 10⁻¹⁹ | 0.79 | 0.40 (0.33, 0.48) | |||
| Grapefruit | stachydrine | Xenobiotics | Food Component/Plant | 0.25 | 1.87 × 10⁻¹⁰ | 0.71 | 0.18 | 7.47 × 10⁻⁶ | 0.62 | 0.44 (0.37, 0.51) |
| N-methylglutamate | Amino Acid | Glutamate Metabolism | 0.21 | 8.50 × 10⁻⁸ | 0.71 | 0.15 | 1.22 × 10⁻⁴ | 0.61 | 0.47 (0.40, 0.54) | |
| Watermelon | X-25271 | 0.38 | 1.43 × 10⁻²³ | 0.83 | 0.31 | 6.53 × 10⁻¹⁶ | 0.69 | 0.25 (0.17, 0.34) | ||
| Cantaloupe | X-25271 | 0.31 | 2.17 × 10⁻¹⁵ | 0.76 | 0.21 | 1.88 × 10⁻⁷ | 0.66 | 0.25 (0.17, 0.34) | ||
| Berries | quinate | Xenobiotics | Food Component/Plant | 0.21 | 5.87 × 10⁻⁸ | 0.84 | 0.10 | 1.54 × 10⁻² | 0.71 | 0.82 (0.79, 0.85) |
| 4-allylphenol sulfate | Xenobiotics | Food Component/Plant | 0.20 | 2.67 × 10⁻⁷ | 0.83 | 0.19 | 2.05 × 10⁻⁶ | 0.75 | 0.40 (0.32, 0.47) | |
| X-24757 | 0.23 | 4.37 × 10⁻⁹ | 0.82 | 0.12 | 3.62 × 10⁻³ | 0.72 | 0.64 (0.59, 0.69) | |||
| Strawberries | xylose | Carbohydrate | Pentose Metabolism | 0.19 | 8.56 × 10⁻⁷ | 0.78 | 0.22 | 3.30 × 10⁻⁸ | 0.74 | 0.34 (0.27, 0.43) |
| X-25523 | 0.15 | 1.56 × 10⁻⁴ | 0.78 | 0.21 | 7.47 × 10⁻⁸ | 0.72 | 0.49 (0.42, 0.56) | |||
| ursocholate | Lipid | Secondary Bile Acid Metabolism | −0.21 | 1.12 × 10⁻⁷ | 0.78 | −0.06 | 1.58 × 10⁻¹ | 0.69 | 0.67 (0.61, 0.71) | |
| Blueberries | X-23970 | 0.22 | 1.26 × 10⁻⁸ | 0.83 | 0.24 | 4.83 × 10⁻¹⁰ | 0.75 | 0.52 (0.46, 0.59) | ||
| X-25523 | 0.22 | 2.00 × 10⁻⁸ | 0.83 | 0.21 | 1.09 × 10⁻⁷ | 0.73 | 0.49 (0.42, 0.56) | |||
| catechol sulfate | Xenobiotics | Benzoate Metabolism | 0.22 | 2.65 × 10⁻⁸ | 0.83 | 0.15 | 1.50 × 10⁻⁴ | 0.72 | 0.71 (0.66, 0.75) | |
| Blackberries 4 | isocitric lactone | Energy | TCA Cycle | 0.22 | 3.49 × 10⁻⁸ | 0.64 | 0.43 (0.36, 0.51) | |||
| Peaches or plums | xylose | Carbohydrate | Pentose Metabolism | 0.09 | 2.16 × 10⁻² | 0.76 | 0.22 | 3.62 × 10⁻⁸ | 0.71 | 0.34 (0.27, 0.43) |
| VEGETABLES | ||||||||||
| Ketchup and salsa | X-25247 | 0.21 | 1.25 × 10⁻⁷ | 0.80 | 0.12 | 1.79 × 10⁻³ | 0.72 | 0.30 (0.23, 0.39) | ||
| Beans | X-17365 | 0.23 | 7.88 × 10⁻⁹ | 0.91 | 0.18 | 4.68 × 10⁻⁶ | 0.71 | 0.50 (0.43, 0.56) | ||
| N-acetylalliin | Xenobiotics | Food Component/Plant | 0.23 | 2.64 × 10⁻⁹ | 0.91 | 0.17 | 2.73 × 10⁻⁵ | 0.71 | 0.37 (0.30, 0.45) | |
| X-23639 | 0.22 | 2.43 × 10⁻⁸ | 0.91 | 0.12 | 1.72 × 10⁻³ | 0.70 | 0.66 (0.61, 0.71) | |||
| Soy products | glycitein glucuronide (2) * | Xenobiotics | Food Component/Plant | 0.39 | 6.26 × 10⁻²⁵ | 0.80 | 0.39 | 5.00 × 10⁻²⁵ | 0.74 | 0.38 (0.31, 0.46) |
| glycitein sulfate (2) | Xenobiotics | Food Component/Plant | 0.35 | 1.52 × 10⁻¹⁹ | 0.79 | 0.39 | 7.49 × 10⁻²⁴ | 0.75 | 0.46 (0.39, 0.53) | |
| daidzein sulfate (2) | Xenobiotics | Food Component/Plant | 0.35 | 6.36 × 10⁻²⁰ | 0.79 | 0.35 | 1.54 × 10⁻¹⁹ | 0.74 | 0.44 (0.37, 0.52) | |
| Fermented soy products | carnosine | Amino Acid | Histidine Metabolism | −0.20 | 2.17 × 10⁻⁷ | 0.68 | −0.10 | 1.01 × 10⁻² | 0.60 | 0.40 (0.33, 0.47) |
| isovalerylcarnitine (C5) | Amino Acid | Leucine, Isoleucine and Valine Metabolism | −0.24 | 6.68 × 10⁻¹⁰ | 0.67 | −0.12 | 2.86 × 10⁻³ | 0.59 | 0.54 (0.47, 0.60) | |
| N,N,N-trimethyl-5-aminovalerate | Amino Acid | Lysine Metabolism | −0.20 | 3.51 × 10⁻⁷ | 0.67 | −0.08 | 5.80 × 10⁻² | 0.59 | 0.40 (0.33, 0.48) | |
| Soy milk | daidzein sulfate (1) | Xenobiotics | Food Component/Plant | 0.31 | 1.97 × 10⁻¹⁵ | 0.65 | 0.37 | 1.85 × 10⁻²¹ | 0.64 | 0.43 (0.36, 0.50) |
| X-18750 | 0.28 | 7.48 × 10⁻¹³ | 0.65 | 0.31 | 6.07 × 10⁻¹⁶ | 0.62 | 0.40 (0.33, 0.47) | |||
| glycitein sulfate (2) | Xenobiotics | Food Component/Plant | 0.30 | 9.22 × 10⁻¹⁵ | 0.65 | 0.31 | 5.51 × 10⁻¹⁶ | 0.62 | 0.46 (0.39, 0.53) | |
| Soy protein powder | X-16649 | 0.21 | 9.86 × 10⁻⁸ | 0.64 | 0.12 | 1.70 × 10⁻³ | 0.60 | 0.53 (0.46, 0.59) | ||
| daidzein sulfate (1) | Xenobiotics | Food Component/Plant | 0.20 | 2.28 × 10⁻⁷ | 0.64 | 0.10 | 1.16 × 10⁻² | 0.60 | 0.43 (0.36, 0.50) | |
| genistein | Xenobiotics | Food Component/Plant | 0.20 | 2.68 × 10⁻⁷ | 0.63 | 0.07 | 5.94 × 10⁻² | 0.61 | 0.36 (0.28, 0.44) | |
| Cruciferous vegetables | X-25217 | 0.37 | 8.67 × 10⁻²² | 0.87 | 0.19 | 8.94 × 10⁻⁷ | 0.74 | 0.23 (0.16, 0.33) | ||
| S-methylcysteine sulfoxide | Amino Acid | Methionine, Cysteine, SAM and Taurine Metabolism | 0.30 | 8.50 × 10⁻¹⁵ | 0.86 | 0.21 | 1.50 × 10⁻⁷ | 0.77 | 0.46 (0.39, 0.53) | |
| X-24330 | 0.25 | 1.84 × 10⁻¹⁰ | 0.85 | 0.14 | 3.83 × 10⁻⁴ | 0.70 | 0.57 (0.51, 0.63) | |||
| Leafy greens | cytosine | Nucleotide | Pyrimidine Metabolism, Cytidine containing | 0.22 | 2.39 × 10⁻⁸ | 0.83 | 0.08 | 4.02 × 10⁻² | 0.69 | 0.43 (0.36, 0.50) |
| X-23970 | 0.19 | 1.07 × 10⁻⁶ | 0.81 | 0.21 | 1.35 × 10⁻⁷ | 0.74 | 0.52 (0.46, 0.59) | |||
| Iceberg or head lettuce | pentose acid * | Partially Characterized Molecules | Partially Characterized Molecules | −0.22 | 3.45 × 10⁻⁸ | 0.73 | −0.11 | 4.15 × 10⁻³ | 0.58 | 0.57 (0.50, 0.62) |
| Peppers | X-23780 | 0.28 | 9.82 × 10⁻¹³ | 0.82 | 0.21 | 8.85 × 10⁻⁸ | 0.78 | 0.39 (0.31, 0.47) | ||
| X-17365 | 0.22 | 2.35 × 10⁻⁸ | 0.80 | 0.16 | 8.55 × 10⁻⁵ | 0.75 | 0.50 (0.43, 0.56) | |||
| Mushrooms 4 | N-methyltaurine | Amino Acid | Methionine, Cysteine, SAM and Taurine Metabolism | 0.23 | 4.77 × 10⁻⁹ | 0.70 | 0.51 (0.44, 0.57) | |||
| X-17365 | 0.22 | 4.53 × 10⁻⁸ | 0.70 | 0.50 (0.43, 0.56) | ||||||
| N-acetylalliin | Xenobiotics | Food Component/Plant | 0.21 | 9.37 × 10⁻⁸ | 0.70 | 0.37 (0.30, 0.45) | ||||
| Allium vegetables | X-17365 | 0.37 | 4.08 × 10⁻²² | 0.82 | 0.22 | 3.19 × 10⁻⁸ | 0.76 | 0.50 (0.43, 0.56) | ||
| N-methyltaurine | Amino Acid | Methionine, Cysteine, SAM and Taurine Metabolism | 0.34 | 2.14 × 10⁻¹⁸ | 0.82 | 0.24 | 7.67 × 10⁻¹⁰ | 0.75 | 0.51 (0.44, 0.57) | |
| 2,3-dimethylsuccinate | Amino Acid | Leucine, Isoleucine and Valine Metabolism | 0.29 | 1.79 × 10⁻¹³ | 0.81 | 0.20 | 2.10 × 10⁻⁷ | 0.74 | 0.36 (0.28, 0.44) | |
| Onion | X-17365 | 0.36 | 1.10 × 10⁻²⁰ | 0.83 | 0.21 | 9.24 × 10⁻⁸ | 0.75 | 0.50 (0.43, 0.56) | ||
| N-methyltaurine | Amino Acid | Methionine, Cysteine, SAM and Taurine Metabolism | 0.33 | 2.65 × 10⁻¹⁷ | 0.83 | 0.23 | 2.79 × 10⁻⁹ | 0.73 | 0.51 (0.44, 0.57) | |
| 2,3-dimethylsuccinate | Amino Acid | Leucine, Isoleucine and Valine Metabolism | 0.28 | 1.12 × 10⁻¹² | 0.81 | 0.20 | 4.48 × 10⁻⁷ | 0.72 | 0.36 (0.28, 0.44) | |
| Garlic | N-acetylalliin | Xenobiotics | Food Component/Plant | 0.38 | 2.58 × 10⁻²³ | 0.84 | 0.20 | 3.59 × 10⁻⁷ | 0.71 | 0.37 (0.30, 0.45) |
| N-methyltaurine | Amino Acid | Methionine, Cysteine, SAM and Taurine Metabolism | 0.23 | 9.41 × 10⁻⁹ | 0.82 | 0.21 | 8.04 × 10⁻⁸ | 0.73 | 0.51 (0.44, 0.57) | |
| X-17365 | 0.29 | 5.77 × 10⁻¹⁴ | 0.82 | 0.21 | 1.49 × 10⁻⁷ | 0.72 | 0.50 (0.43, 0.56) | |||
| Garlic powder | N-acetyl-S-allyl-L-cysteine | Xenobiotics | Food Component/Plant | 0.23 | 5.31 × 10⁻⁹ | 0.74 | 0.04 | 2.72 × 10⁻¹ | 0.69 | 0.46 (0.39, 0.53) |
| S-allylcysteine | Xenobiotics | Food Component/Plant | 0.22 | 2.18 × 10⁻⁸ | 0.73 | 0.06 | 1.07 × 10⁻¹ | 0.69 | 0.35 (0.28, 0.44) | |
| GRAINS | ||||||||||
| Whole grains | 2,6-dihydroxybenzoic acid | Xenobiotics | Drug-Topical Agents | 0.32 | 5.70 × 10⁻¹⁷ | 0.91 | 0.23 | 2.50 × 10⁻⁹ | 0.80 | 0.52 (0.45, 0.58) |
| 2-acetamidophenol sulfate | Xenobiotics | Drug-Analgesics, Anesthetics | 0.34 | 3.29 × 10⁻¹⁸ | 0.90 | 0.26 | 5.93 × 10⁻¹¹ | 0.80 | 0.51 (0.44, 0.57) | |
| 4-methoxyphenol sulfate | Amino Acid | Tyrosine Metabolism | 0.27 | 7.24 × 10⁻¹² | 0.89 | 0.16 | 8.07 × 10⁻⁵ | 0.77 | 0.33 (0.26, 0.41) | |
| Whole-grain bread | 3,5-dihydroxybenzoic acid | Xenobiotics | Food Component/Plant | 0.31 | 1.42 × 10⁻¹⁵ | 0.84 | 0.28 | 1.53 × 10⁻¹² | 0.74 | 0.52 (0.46, 0.59) |
| 2-acetamidophenol sulfate | Xenobiotics | Drug-Analgesics, Anesthetics | 0.23 | 2.99 × 10⁻⁹ | 0.81 | 0.19 | 1.67 × 10⁻⁶ | 0.71 | 0.51 (0.44, 0.57) | |
| Whole-grain cereals | 2,6-dihydroxybenzoic acid | Xenobiotics | Drug-Topical Agents | 0.36 | 2.30 × 10⁻²⁰ | 0.86 | 0.35 | 1.62 × 10⁻¹⁹ | 0.85 | 0.52 (0.45, 0.58) |
| 2-acetamidophenol sulfate | Xenobiotics | Drug-Analgesics, Anesthetics | 0.36 | 1.07 × 10⁻²⁰ | 0.85 | 0.31 | 2.85 × 10⁻¹⁵ | 0.82 | 0.51 (0.44, 0.57) | |
| 2-aminophenol sulfate | Xenobiotics | Chemical | 0.30 | 6.27 × 10⁻¹⁵ | 0.83 | 0.28 | 1.13 × 10⁻¹² | 0.80 | 0.45 (0.39, 0.53) | |
| Corn products | X-25247 | 0.32 | 1.19 × 10⁻¹⁶ | 0.86 | 0.12 | 1.93 × 10⁻³ | 0.73 | 0.30 (0.23, 0.39) | ||
| X-23680 | 0.26 | 2.38 × 10⁻¹¹ | 0.86 | 0.11 | 5.39 × 10⁻³ | 0.73 | 0.56 (0.50, 0.62) | |||
| carnitine of C10H14O2 (2) * | Partially Characterized Molecules | Partially Characterized Molecules | 0.21 | 5.12 × 10⁻⁸ | 0.85 | 0.05 | 1.95 × 10⁻¹ | 0.72 | 0.39 (0.32, 0.47) | |
| Popcorn | glucuronide of C12H20O3 (1) * | Partially Characterized Molecules | Partially Characterized Molecules | 0.24 | 6.28 × 10⁻¹⁰ | 0.75 | 0.19 | 8.12 × 10⁻⁷ | 0.70 | 0.24 (0.16, 0.33) |
| X-25247 | 0.26 | 6.63 × 10⁻¹¹ | 0.75 | 0.16 | 4.24 × 10⁻⁵ | 0.69 | 0.30 (0.23, 0.39) | |||
| Other whole grains | 3,5-dihydroxybenzoic acid | Xenobiotics | Food Component/Plant | 0.20 | 2.33 × 10⁻⁷ | 0.78 | 0.18 | 6.67 × 10⁻⁶ | 0.69 | 0.52 (0.46, 0.59) |
| Refined grains | X-23680 | 0.21 | 1.78 × 10⁻⁷ | 0.85 | 0.11 | 3.85 × 10⁻³ | 0.84 | 0.56 (0.50, 0.62) | ||
| 1,5-anhydroglucitol (1,5-AG) | Carbohydrate | Glycolysis, Gluconeogenesis, and Pyruvate Metabolism | 0.21 | 7.39 × 10⁻⁸ | 0.83 | 0.08 | 5.81 × 10⁻² | 0.84 | 0.42 (0.35, 0.49) | |
| N6-carbamoylthreonyladenosine | Nucleotide | Purine Metabolism, Adenine containing | 0.21 | 1.86 × 10⁻⁷ | 0.83 | 0.01 | 7.49 × 10⁻¹ | 0.83 | 0.64 (0.58, 0.69) | |
| PROTEINS | ||||||||||
| Red meat | isovalerylcarnitine (C5) | Amino Acid | Leucine, Isoleucine and Valine Metabolism | 0.31 | 8.67 × 10⁻¹⁶ | 0.89 | 0.25 | 2.07 × 10⁻¹⁰ | 0.77 | 0.54 (0.47, 0.60) |
| 3,4-dihydroxyphenylacetate sulfate | Amino Acid | Tyrosine Metabolism | −0.28 | 5.22 × 10⁻¹³ | 0.88 | −0.26 | 6.04 × 10⁻¹¹ | 0.79 | 0.54 (0.48, 0.61) | |
| N,N,N-trimethyl-5-aminovalerate | Amino Acid | Lysine Metabolism | 0.31 | 9.55 × 10⁻¹⁶ | 0.88 | 0.23 | 5.08 × 10⁻⁹ | 0.77 | 0.40 (0.33, 0.48) | |
| Processed meat | 1-ribosyl-imidazoleacetate * | Amino Acid | Histidine Metabolism | −0.34 | 8.25 × 10⁻¹⁹ | 0.86 | −0.26 | 4.02 × 10⁻¹¹ | 0.79 | 0.66 (0.60, 0.71) |
| X-23970 | −0.31 | 3.37 × 10⁻¹⁵ | 0.86 | −0.16 | 3.16 × 10⁻⁵ | 0.78 | 0.52 (0.46, 0.59) | |||
| pentose acid * | Partially Characterized Molecules | Partially Characterized Molecules | −0.31 | 2.70 × 10⁻¹⁵ | 0.85 | −0.18 | 6.15 × 10⁻⁶ | 0.78 | 0.57 (0.50, 0.62) | |
| Poultry | anserine | Amino Acid | Histidine Metabolism | 0.52 | 3.02 × 10−44 | 0.85 | 0.37 | 2.40 × 10⁻²² | 0.79 | 0.37 (0.30, 0.45) |
| 3-methylhistidine | Amino Acid | Histidine Metabolism | 0.56 | 1.01 × 10−54 | 0.84 | 0.45 | 2.89 × 10⁻³² | 0.82 | 0.46 (0.39, 0.53) | |
| X-13835 | 0.56 | 3.71 × 10−53 | 0.84 | 0.43 | 1.67 × 10⁻²⁹ | 0.82 | 0.60 (0.54, 0.66) | |||
| Total fish | CMPF | Lipid | Fatty Acid, Dicarboxylate | 0.39 | 5.89 × 10⁻²⁴ | 0.82 | 0.28 | 1.25 × 10⁻¹² | 0.71 | 0.82 (0.79, 0.85) |
| X-25419 | 0.31 | 1.96 × 10⁻¹⁵ | 0.80 | 0.24 | 2.02 × 10⁻⁹ | 0.71 | 0.55 (0.49, 0.61) | |||
| X-13835 | 0.31 | 2.68 × 10⁻¹⁵ | 0.77 | 0.17 | 2.64 × 10⁻⁵ | 0.66 | 0.60 (0.54, 0.66) | |||
| Dark meat fish | CMPF | Lipid | Fatty Acid, Dicarboxylate | 0.38 | 2.03 × 10⁻²³ | 0.82 | 0.23 | 2.64 × 10⁻⁹ | 0.71 | 0.82 (0.79, 0.85) |
| X-25419 | 0.29 | 3.68 × 10⁻¹⁴ | 0.78 | 0.17 | 1.28 × 10⁻⁵ | 0.73 | 0.55 (0.49, 0.61) | |||
| X-13835 | 0.24 | 1.51 × 10⁻⁹ | 0.77 | 0.15 | 1.48 × 10⁻⁴ | 0.68 | 0.60 (0.54, 0.66) | |||
| Shellfish | X-25419 | 0.39 | 1.92 × 10⁻²⁴ | 0.78 | 0.27 | 6.23 × 10⁻¹² | 0.74 | 0.55 (0.49, 0.61) | ||
| CMPF | Lipid | Fatty Acid, Dicarboxylate | 0.24 | 1.43 × 10⁻⁹ | 0.69 | 0.17 | 2.08 × 10⁻⁵ | 0.70 | 0.82 (0.79, 0.85) | |
| X-23587 | 0.23 | 4.70 × 10⁻⁹ | 0.69 | 0.13 | 9.62 × 10⁻⁴ | 0.68 | 0.56 (0.49, 0.62) | |||
| Total nuts | tryptophan betaine | Amino Acid | Tryptophan Metabolism | 0.42 | 2.59 × 10⁻²⁸ | 0.90 | 0.31 | 2.38 × 10⁻¹⁵ | 0.83 | 0.76 (0.72, 0.79) |
| X-24412 | 0.38 | 8.07 × 10⁻²⁴ | 0.90 | 0.32 | 5.62 × 10⁻¹⁷ | 0.83 | 0.52 (0.46, 0.59) | |||
| X-23644 | 0.31 | 7.22 × 10⁻¹⁶ | 0.89 | 0.26 | 3.59 × 10⁻¹¹ | 0.80 | 0.31 (0.24, 0.40) | |||
| Peanuts | X-24412 | 0.43 | 6.25 × 10⁻³⁰ | 0.86 | 0.38 | 1.01 × 10⁻²² | 0.77 | 0.52 (0.46, 0.59) | ||
| tryptophan betaine | Amino Acid | Tryptophan Metabolism | 0.42 | 4.80 × 10⁻²⁸ | 0.86 | 0.34 | 1.98 × 10⁻¹⁸ | 0.76 | 0.76 (0.72, 0.79) | |
| 4-vinylphenol sulfate | Xenobiotics | Benzoate Metabolism | 0.40 | 2.88 × 10⁻²⁵ | 0.86 | 0.25 | 3.70 × 10⁻¹⁰ | 0.71 | 0.41 (0.33, 0.48) | |
| Other nuts | X-25524 | 0.27 | 1.13 × 10⁻¹¹ | 0.87 | 0.27 | 3.75 × 10⁻¹² | 0.81 | 0.41 (0.33, 0.48) | ||
| X-25523 | 0.26 | 1.41 × 10⁻¹¹ | 0.86 | 0.26 | 3.57 × 10⁻¹¹ | 0.81 | 0.49 (0.42, 0.56) | |||
| X-23970 | 0.27 | 2.17 × 10⁻¹² | 0.86 | 0.25 | 2.48 × 10⁻¹⁰ | 0.79 | 0.52 (0.46, 0.59) | |||
| Seeds | X-11847 | 0.15 | 2.06 × 10⁻⁴ | 0.75 | 0.26 | 1.63 × 10⁻¹¹ | 0.76 | 0.60 (0.54, 0.66) | ||
| X-11858 | 0.13 | 7.09 × 10⁻⁴ | 0.74 | 0.24 | 5.89 × 10⁻¹⁰ | 0.76 | 0.50 (0.43, 0.56) | |||
| X-18059 | 0.24 | 1.10 × 10⁻⁹ | 0.74 | 0.18 | 3.92 × 10⁻⁶ | 0.71 | 0.32 (0.24, 0.40) | |||
| DAIRY/DAIRY ALTERNATIVES | ||||||||||
| Milk | phenylacetylglycine | Peptide | Acetylated Peptides | 0.40 | 2.79 × 10⁻²⁶ | 0.87 | 0.28 | 4.49 × 10⁻¹³ | 0.79 | 0.53 (0.47, 0.59) |
| 2,8-quinolinediol sulfate | Xenobiotics | Food Component/Plant | 0.31 | 3.17 × 10⁻¹⁵ | 0.84 | 0.19 | 1.24 × 10⁻⁶ | 0.77 | 0.50 (0.43, 0.57) | |
| N,N,N-trimethyl-5-aminovalerate | Amino Acid | Lysine Metabolism | 0.30 | 1.02 × 10⁻¹⁴ | 0.83 | 0.28 | 1.67 × 10⁻¹² | 0.79 | 0.40 (0.33, 0.48) | |
| Almond milk or rice milk | N,N,N-trimethyl-5-aminovalerate | Amino Acid | Lysine Metabolism | −0.16 | 5.33 × 10⁻⁵ | 0.71 | −0.21 | 1.38 × 10⁻⁷ | 0.69 | 0.40 (0.33, 0.48) |
| catechol sulfate | Xenobiotics | Benzoate Metabolism | 0.22 | 1.69 × 10⁻⁸ | 0.71 | 0.22 | 1.20 × 10⁻⁸ | 0.65 | 0.71 (0.66, 0.75) | |
| X-25800 | 0.16 | 3.56 × 10⁻⁵ | 0.69 | 0.21 | 1.20 × 10⁻⁷ | 0.65 | 0.33 (0.26, 0.42) | |||
| Total cheese | heptenedioate (C7:1-DC) * | Lipid | Fatty Acid, Dicarboxylate | 0.24 | 2.07 × 10⁻⁹ | 0.88 | 0.22 | 2.14 × 10⁻⁸ | 0.78 | 0.49 (0.42, 0.55) |
| 4-methylhexanoylglutamine | Lipid | Fatty Acid Metabolism (Acyl Glutamine) | 0.24 | 1.87 × 10⁻⁹ | 0.87 | 0.23 | 5.23 × 10⁻⁹ | 0.78 | 0.51 (0.44, 0.57) | |
| glutamine conjugate of C9H16O2 (1) * | Partially Characterized Molecules | Partially Characterized Molecules | 0.15 | 2.23 × 10⁻⁴ | 0.86 | 0.22 | 1.26 × 10⁻⁸ | 0.78 | 0.52 (0.46, 0.59) | |
| Cream | glucuronide of C19H28O4 (1)* | Partially Characterized Molecules | Partially Characterized Molecules | 0.39 | 4.89 × 10⁻²⁴ | 0.80 | 0.13 | 1.22 × 10⁻³ | 0.70 | 0.83 (0.79, 0.85) |
| X-25500 | 0.34 | 4.09 × 10⁻¹⁹ | 0.79 | 0.12 | 1.80 × 10⁻³ | 0.68 | 0.63 (0.57, 0.68) | |||
| X-12738 | 0.35 | 8.62 × 10⁻²⁰ | 0.78 | 0.10 | 1.22 × 10⁻² | 0.68 | 0.72 (0.67, 0.76) | |||
| FATS AND OILS | ||||||||||
| Creamy salad dressing | carnitine of C10H14O2 (2) * | Partially Characterized Molecules | Partially Characterized Molecules | 0.26 | 4.09 × 10⁻¹¹ | 0.78 | 0.16 | 5.02 × 10⁻⁵ | 0.67 | 0.39 (0.32, 0.47) |
| X-24363 | 0.26 | 4.26 × 10⁻¹¹ | 0.77 | 0.18 | 4.13 × 10⁻⁶ | 0.67 | 0.56 (0.50, 0.62) | |||
| X-13693 | 0.22 | 1.04 × 10⁻⁸ | 0.77 | 0.19 | 1.81 × 10⁻⁶ | 0.67 | 0.47 (0.40, 0.54) | |||
| Oil and vinegar salad dressing | N-methyltaurine | Amino Acid | Methionine, Cysteine, SAM and Taurine Metabolism | 0.16 | 5.45 × 10⁻⁵ | 0.76 | 0.20 | 2.63 × 10⁻⁷ | 0.80 | 0.51 (0.44, 0.57) |
| Olive oil | N-methyltaurine | Amino Acid | Methionine, Cysteine, SAM and Taurine Metabolism | 0.24 | 4.33 × 10⁻¹⁰ | 0.80 | 0.20 | 7.40 × 10⁻⁷ | 0.76 | 0.51 (0.44, 0.57) |
| X-25419 | 0.24 | 4.25 × 10⁻¹⁰ | 0.79 | 0.18 | 5.28 × 10⁻⁶ | 0.74 | 0.55 (0.49, 0.61) | |||
| X-17733 | −0.21 | 6.36 × 10⁻⁸ | 0.78 | −0.13 | 7.26 × 10⁻⁴ | 0.74 | 0.50 (0.44, 0.57) | |||
| MISCELLANEOUS | ||||||||||
| French fries | pentose acid * | Partially Characterized Molecules | Partially Characterized Molecules | −0.27 | 2.28 × 10⁻¹² | 0.85 | −0.07 | 1.00 × 10⁻¹ | 0.72 | 0.57 (0.50, 0.62) |
| abscisate | Xenobiotics | Food Component/Plant | −0.28 | 6.40 × 10⁻¹³ | 0.85 | −0.03 | 4.65 × 10⁻¹ | 0.72 | 0.47 (0.40, 0.54) | |
| catechol sulfate | Xenobiotics | Benzoate Metabolism | −0.24 | 1.01 × 10⁻⁹ | 0.84 | −0.09 | 2.68 × 10⁻² | 0.72 | 0.71 (0.66, 0.75) | |
| Chips | glutamine conjugate of C8H12O2 (2) * | Partially Characterized Molecules | Partially Characterized Molecules | 0.25 | 9.16 × 10⁻¹¹ | 0.80 | 0.25 | 1.45 × 10⁻¹⁰ | 0.76 | 0.45 (0.38, 0.52) |
| glucuronide of C10H14O2 (1) * | Partially Characterized Molecules | Partially Characterized Molecules | 0.28 | 6.97 × 10⁻¹³ | 0.80 | 0.18 | 8.55 × 10⁻⁶ | 0.74 | 0.42 (0.35, 0.50) | |
| X-23970 | −0.20 | 2.30 × 10⁻⁷ | 0.79 | −0.10 | 1.45 × 10⁻² | 0.72 | 0.52 (0.46, 0.59) | |||
| Chocolate candy | X-12823 | 0.38 | 4.94 × 10⁻²³ | 0.85 | 0.30 | 3.18 × 10⁻¹⁴ | 0.83 | 0.40 (0.33, 0.48) | ||
| 3-methylxanthine | Xenobiotics | Xanthine Metabolism | 0.32 | 1.98 × 10⁻¹⁶ | 0.83 | 0.27 | 4.96 × 10⁻¹² | 0.82 | 0.60 (0.54, 0.66) | |
| 7-methylurate | Xenobiotics | Xanthine Metabolism | 0.32 | 1.50 × 10⁻¹⁶ | 0.83 | 0.28 | 3.94 × 10⁻¹³ | 0.82 | 0.62 (0.56, 0.67) | |
| Dark chocolate | theobromine | Xenobiotics | Xanthine Metabolism | 0.29 | 6.72 × 10⁻¹⁴ | 0.79 | 0.23 | 3.38 × 10⁻⁹ | 0.71 | 0.58 (0.52, 0.64) |
| X-12823 | 0.32 | 5.05 × 10⁻¹⁷ | 0.79 | 0.25 | 1.36 × 10⁻¹⁰ | 0.69 | 0.40 (0.33, 0.48) | |||
| 3, 7-dimethylurate | Xenobiotics | Xanthine Metabolism | 0.30 | 2.03 × 10⁻¹⁴ | 0.79 | 0.22 | 1.76 × 10⁻⁸ | 0.69 | 0.56 (0.50, 0.62) | |
| Desserts | X-24340 | 0.21 | 8.12 × 10⁻⁸ | 0.80 | 0.15 | 1.96 × 10⁻⁴ | 0.74 | 0.50 (0.44, 0.57) | ||
| 3, 4-methylene heptanoylglycine | Lipid | Fatty Acid Metabolism (Acyl Glycine) | 0.21 | 1.32 × 10⁻⁷ | 0.80 | 0.10 | 1.07 × 10⁻² | 0.73 | 0.56 (0.50, 0.62) | |
| Bars | X-16649 | 0.21 | 5.23 × 10⁻⁸ | 0.81 | 0.20 | 4.42 × 10⁻⁷ | 0.73 | 0.53 (0.46, 0.59) | ||
| 2-(4-hydroxyphenyl)propionate | Xenobiotics | Benzoate Metabolism | 0.21 | 1.13 × 10⁻⁷ | 0.80 | 0.15 | 1.13 × 10⁻⁴ | 0.71 | 0.36 (0.29, 0.44) | |
| sucralose | Xenobiotics | Food Component/Plant | 0.21 | 1.41 × 10⁻⁷ | 0.80 | 0.11 | 5.11 × 10⁻³ | 0.70 | 0.50 (0.43, 0.56) | |
| Soy sauce | X-11847 | 0.17 | 9.43 × 10⁻⁶ | 0.74 | 0.22 | 2.46 × 10⁻⁸ | 0.67 | 0.60 (0.54, 0.66) | ||
| X-11849 | 0.18 | 2.84 × 10⁻⁶ | 0.74 | 0.20 | 2.50 × 10⁻⁷ | 0.66 | 0.63 (0.58, 0.69) | |||
| Artificial sweeteners | sucralose | Xenobiotics | Food Component/Plant | 0.31 | 5.88 × 10⁻¹⁶ | 0.75 | 0.35 | 2.71 × 10⁻¹⁹ | 0.77 | 0.50 (0.43, 0.56) |
| acesulfame | Xenobiotics | Food Component/Plant | 0.21 | 4.72 × 10⁻⁸ | 0.75 | 0.25 | 2.78 × 10⁻¹⁰ | 0.73 | 0.49 (0.43, 0.56) | |
| X-25785 | 0.23 | 3.71 × 10⁻⁹ | 0.72 | 0.17 | 1.59 × 10⁻⁵ | 0.68 | 0.48 (0.41, 0.55) | |||
| ALCOHOL | ||||||||||
| Total alcohol | ethyl glucuronide | Xenobiotics | Chemical | 0.65 | 5.84 × 10−78 | 0.99 | 0.59 | 1.08 × 10−60 | 0.94 | 0.63 (0.57, 0.68) |
| ethyl alpha-glucopyranoside | Xenobiotics | Food Component/Plant | 0.57 | 4.01 × 10−56 | 0.97 | 0.48 | 2.15 × 10−38 | 0.90 | 0.53 (0.46, 0.59) | |
| 2,3-dihydroxyisovalerate | Xenobiotics | Food Component/Plant | 0.44 | 5.03 × 10⁻³¹ | 0.92 | 0.42 | 1.22 × 10⁻²⁸ | 0.86 | 0.46 (0.39, 0.53) | |
| Beer | ethyl glucuronide | Xenobiotics | Chemical | 0.45 | 5.34 × 10⁻³³ | 0.89 | 0.41 | 5.84 × 10⁻²⁷ | 0.86 | 0.63 (0.57, 0.68) |
| ethyl alpha-glucopyranoside | Xenobiotics | Food Component/Plant | 0.43 | 4.82 × 10⁻³⁰ | 0.86 | 0.38 | 9.29 × 10⁻²⁴ | 0.84 | 0.53 (0.46, 0.59) | |
| 2,3-dihydroxy-3-methylvalerate | Amino Acid | Leucine, Isoleucine and Valine Metabolism | 0.30 | 2.87 × 10⁻¹⁴ | 0.83 | 0.28 | 7.16 × 10⁻¹³ | 0.82 | 0.42 (0.35, 0.50) | |
| Total wine | ethyl glucuronide | Xenobiotics | Chemical | 0.62 | 1.86 × 10−68 | 0.94 | 0.49 | 7.76 × 10−39 | 0.84 | 0.63 (0.57, 0.68) |
| ethyl alpha-glucopyranoside | Xenobiotics | Food Component/Plant | 0.51 | 1.55 × 10−43 | 0.91 | 0.39 | 7.03 × 10⁻²⁴ | 0.78 | 0.53 (0.46, 0.59) | |
| X-17306 | 0.52 | 1.81 × 10−45 | 0.89 | 0.48 | 5.30 × 10−38 | 0.83 | 0.57 (0.51, 0.63) | |||
| Red wine | ethyl glucuronide | Xenobiotics | Chemical | 0.54 | 3.62 × 10−50 | 0.88 | 0.41 | 1.48 × 10⁻²⁷ | 0.80 | 0.63 (0.57, 0.68) |
| ethyl alpha-glucopyranoside | Xenobiotics | Food Component/Plant | 0.45 | 1.47 × 10⁻³³ | 0.84 | 0.32 | 2.12 × 10⁻¹⁶ | 0.76 | 0.53 (0.46, 0.59) | |
| 2,3-dihydroxy-3-methylvalerate | Amino Acid | Leucine, Isoleucine and Valine Metabolism | 0.44 | 7.17 × 10⁻³² | 0.81 | 0.36 | 2.02 × 10⁻²⁰ | 0.77 | 0.42 (0.35, 0.50) | |
| White wine | ethyl glucuronide | Xenobiotics | Chemical | 0.44 | 4.89 × 10⁻³¹ | 0.78 | 0.36 | 2.24 × 10⁻²¹ | 0.73 | 0.63 (0.57, 0.68) |
| ethyl alpha-glucopyranoside | Xenobiotics | Food Component/Plant | 0.36 | 1.22 × 10⁻²⁰ | 0.75 | 0.31 | 1.76 × 10⁻¹⁵ | 0.71 | 0.53 (0.46, 0.59) | |
| X-17306 | 0.35 | 1.62 × 10⁻¹⁹ | 0.74 | 0.36 | 6.39 × 10⁻²¹ | 0.72 | 0.57 (0.51, 0.63) | |||
| Liquor | ethyl glucuronide | Xenobiotics | Chemical | 0.42 | 1.65 × 10⁻²⁸ | 0.79 | 0.25 | 1.26 × 10⁻¹⁰ | 0.70 | 0.63 (0.57, 0.68) |
| ethyl alpha-glucopyranoside | Xenobiotics | Food Component/Plant | 0.36 | 2.17 × 10⁻²⁰ | 0.77 | 0.19 | 2.12 × 10⁻⁶ | 0.67 | 0.53 (0.46, 0.59) | |
| N-acetyltaurine | Amino Acid | Methionine, Cysteine, SAM and Taurine Metabolism | 0.27 | 7.24 × 10⁻¹² | 0.73 | 0.16 | 7.99 × 10⁻⁵ | 0.68 | 0.63 (0.58, 0.69) | |
| BEVERAGES | ||||||||||
| Total coffee | glucuronide of C19H28O4 (1) * | Partially Characterized Molecules | Partially Characterized Molecules | 0.83 | 0.56 × 10165 | 1.00 | 0.81 | 0.82 × 10145 | 0.99 | 0.83 (0.79, 0.85) |
| citraconate/glutaconate | Energy | TCA Cycle | 0.71 | 0.35 × 10100 | 1.00 | 0.69 | 2.65 × 10−89 | 0.97 | 0.77 (0.73, 0.81) | |
| feruloylquinate (3) | Xenobiotics | Food Component/Plant | 0.68 | 2.40 × 10−86 | 0.99 | 0.66 | 4.46 × 10−79 | 0.97 | 0.71 (0.67, 0.76) | |
| Decaffeinated | glucuronide of C19H28O4 (1) * | Partially Characterized Molecules | Partially Characterized Molecules | 0.24 | 1.83 × 10⁻⁹ | 0.66 | 0.20 | 4.26 × 10⁻⁷ | 0.63 | 0.83 (0.79, 0.85) |
| quinate | Xenobiotics | Food Component/Plant | 0.21 | 1.36 × 10⁻⁷ | 0.65 | 0.16 | 4.67 × 10⁻⁵ | 0.63 | 0.82 (0.79, 0.85) | |
| X-25666 | 0.21 | 9.93 × 10⁻⁸ | 0.65 | 0.18 | 5.43 × 10⁻⁶ | 0.63 | 0.72 (0.67, 0.76) | |||
| Caffeinated | glucuronide of C19H28O4 (1) * | Partially Characterized Molecules | Partially Characterized Molecules | 0.78 | 0.27 × 10129 | 0.98 | 0.76 | 0.68 × 10121 | 0.97 | 0.83 (0.79, 0.85) |
| 3-hydroxypyridine glucuronide | Xenobiotics | Chemical | 0.69 | 2.27 × 10−91 | 0.98 | 0.66 | 2.06 × 10−80 | 0.95 | 0.77 (0.73, 0.80) | |
| 3-hydroxypyridine | Xenobiotics | Chemical | 0.72 | 0.71 × 10101 | 0.98 | 0.67 | 1.20 × 10−84 | 0.95 | 0.76 (0.72, 0.80) | |
| Total tea | N-acetyltheanine | Xenobiotics | Food Component/Plant | 0.52 | 9.90 × 10−46 | 0.93 | 0.51 | 1.04 × 10−43 | 0.88 | 0.55 (0.48, 0.61) |
| coumaroylquinate (1) | Xenobiotics | Food Component/Plant | 0.36 | 6.16 × 10⁻²¹ | 0.83 | 0.35 | 1.02 × 10⁻¹⁹ | 0.79 | 0.53 (0.47, 0.60) | |
| 2-methoxyresorcinol sulfate | Xenobiotics | Chemical | 0.31 | 9.47 × 10⁻¹⁶ | 0.81 | 0.33 | 1.20 × 10⁻¹⁷ | 0.76 | 0.62 (0.56, 0.67) | |
| Green tea | N-acetyltheanine | Xenobiotics | Food Component/Plant | 0.29 | 6.14 × 10⁻¹⁴ | 0.74 | 0.34 | 7.48 × 10⁻¹⁹ | 0.72 | 0.55 (0.48, 0.61) |
| S-adenosylhomocysteine (SAH) | Amino Acid | Methionine, Cysteine, SAM and Taurine Metabolism | −0.26 | 4.23 × 10⁻¹¹ | 0.73 | −0.26 | 4.40 × 10⁻¹¹ | 0.66 | 0.42 (0.35, 0.50) | |
| X-12740 | 0.25 | 7.96 × 10⁻¹¹ | 0.72 | 0.22 | 2.62 × 10⁻⁸ | 0.66 | 0.41 (0.33, 0.48) | |||
| Black tea | N-acetyltheanine | Xenobiotics | Food Component/Plant | 0.41 | 1.17 × 10⁻²⁷ | 0.81 | 0.47 | 4.63 × 10−36 | 0.81 | 0.55 (0.48, 0.61) |
| 2-methoxyresorcinol sulfate | Xenobiotics | Chemical | 0.25 | 8.05 × 10⁻¹¹ | 0.73 | 0.27 | 5.46 × 10⁻¹² | 0.72 | 0.62 (0.56, 0.67) | |
| 1,2,3-benzenetriol sulfate (2) | Xenobiotics | Chemical | 0.25 | 1.98 × 10⁻¹⁰ | 0.73 | 0.26 | 4.95 × 10⁻¹¹ | 0.71 | 0.57 (0.51, 0.63) | |
| Herbal tea | X-12306 | 0.24 | 1.75 × 10⁻⁹ | 0.74 | 0.19 | 1.77 × 10⁻⁶ | 0.65 | 0.66 (0.61, 0.71) | ||
| X-23423 | 0.22 | 2.43 × 10⁻⁸ | 0.74 | 0.15 | 1.18 × 10⁻⁴ | 0.63 | 0.51 (0.45, 0.58) | |||
| catechol sulfate | Xenobiotics | Benzoate Metabolism | 0.22 | 3.74 × 10⁻⁸ | 0.73 | 0.16 | 7.34 × 10⁻⁵ | 0.63 | 0.71 (0.66, 0.75) | |
| Sugar-sweetened beverages | X-23970 | −0.22 | 3.64 × 10⁻⁸ | 0.82 | −0.12 | 2.96 × 10⁻³ | 0.77 | 0.52 (0.46, 0.59) | ||
| X-23424 | 0.20 | 2.10 × 10⁻⁷ | 0.81 | 0.05 | 2.27 × 10⁻¹ | 0.76 | 0.28 (0.20, 0.37) | |||
| hydroxy-N6, N6, N6-trimethyllysine * | Amino Acid | Lysine Metabolism | 0.24 | 4.34 × 10⁻¹⁰ | 0.81 | 0.08 | 3.37 × 10⁻² | 0.76 | 0.62 (0.56, 0.67) | |
| Diet beverages | X-25785 | 0.47 | 4.73 × 10−36 | 0.84 | 0.43 | 1.04 × 10⁻²⁹ | 0.81 | 0.48 (0.41, 0.55) | ||
| acesulfame | Xenobiotics | Food Component/Plant | 0.42 | 1.45 × 10⁻²⁸ | 0.83 | 0.32 | 1.15 × 10⁻¹⁶ | 0.77 | 0.49 (0.43, 0.56) | |
| sucralose | Xenobiotics | Food Component/Plant | 0.41 | 1.79 × 10⁻²⁷ | 0.81 | 0.28 | 7.01 × 10⁻¹³ | 0.74 | 0.50 (0.43, 0.56) | |
Publisher’s Note: MDPI stays neutral with regard to jurisdictional claims in published maps and institutional affiliations. |
© 2021 by the authors. Licensee MDPI, Basel, Switzerland. This article is an open access article distributed under the terms and conditions of the Creative Commons Attribution (CC BY) license (https://creativecommons.org/licenses/by/4.0/).
Share and Cite
Wang, Y.; Hodge, R.A.; Stevens, V.L.; Hartman, T.J.; McCullough, M.L. Identification and Reproducibility of Urinary Metabolomic Biomarkers of Habitual Food Intake in a Cross-Sectional Analysis of the Cancer Prevention Study-3 Diet Assessment Sub-Study. Metabolites 2021, 11, 248. https://doi.org/10.3390/metabo11040248
Wang Y, Hodge RA, Stevens VL, Hartman TJ, McCullough ML. Identification and Reproducibility of Urinary Metabolomic Biomarkers of Habitual Food Intake in a Cross-Sectional Analysis of the Cancer Prevention Study-3 Diet Assessment Sub-Study. Metabolites. 2021; 11(4):248. https://doi.org/10.3390/metabo11040248
Chicago/Turabian StyleWang, Ying, Rebecca A. Hodge, Victoria L. Stevens, Terryl J. Hartman, and Marjorie L. McCullough. 2021. "Identification and Reproducibility of Urinary Metabolomic Biomarkers of Habitual Food Intake in a Cross-Sectional Analysis of the Cancer Prevention Study-3 Diet Assessment Sub-Study" Metabolites 11, no. 4: 248. https://doi.org/10.3390/metabo11040248
APA StyleWang, Y., Hodge, R. A., Stevens, V. L., Hartman, T. J., & McCullough, M. L. (2021). Identification and Reproducibility of Urinary Metabolomic Biomarkers of Habitual Food Intake in a Cross-Sectional Analysis of the Cancer Prevention Study-3 Diet Assessment Sub-Study. Metabolites, 11(4), 248. https://doi.org/10.3390/metabo11040248