
Urinary Metabolites Enable Differential Diagnosis and Therapeutic Monitoring of Pediatric Inflammatory Bowel Disease

 , and
, and 
Abstract

1. Introduction
2. Results
2.1. Study Population and Pediatric IBD Characteristics
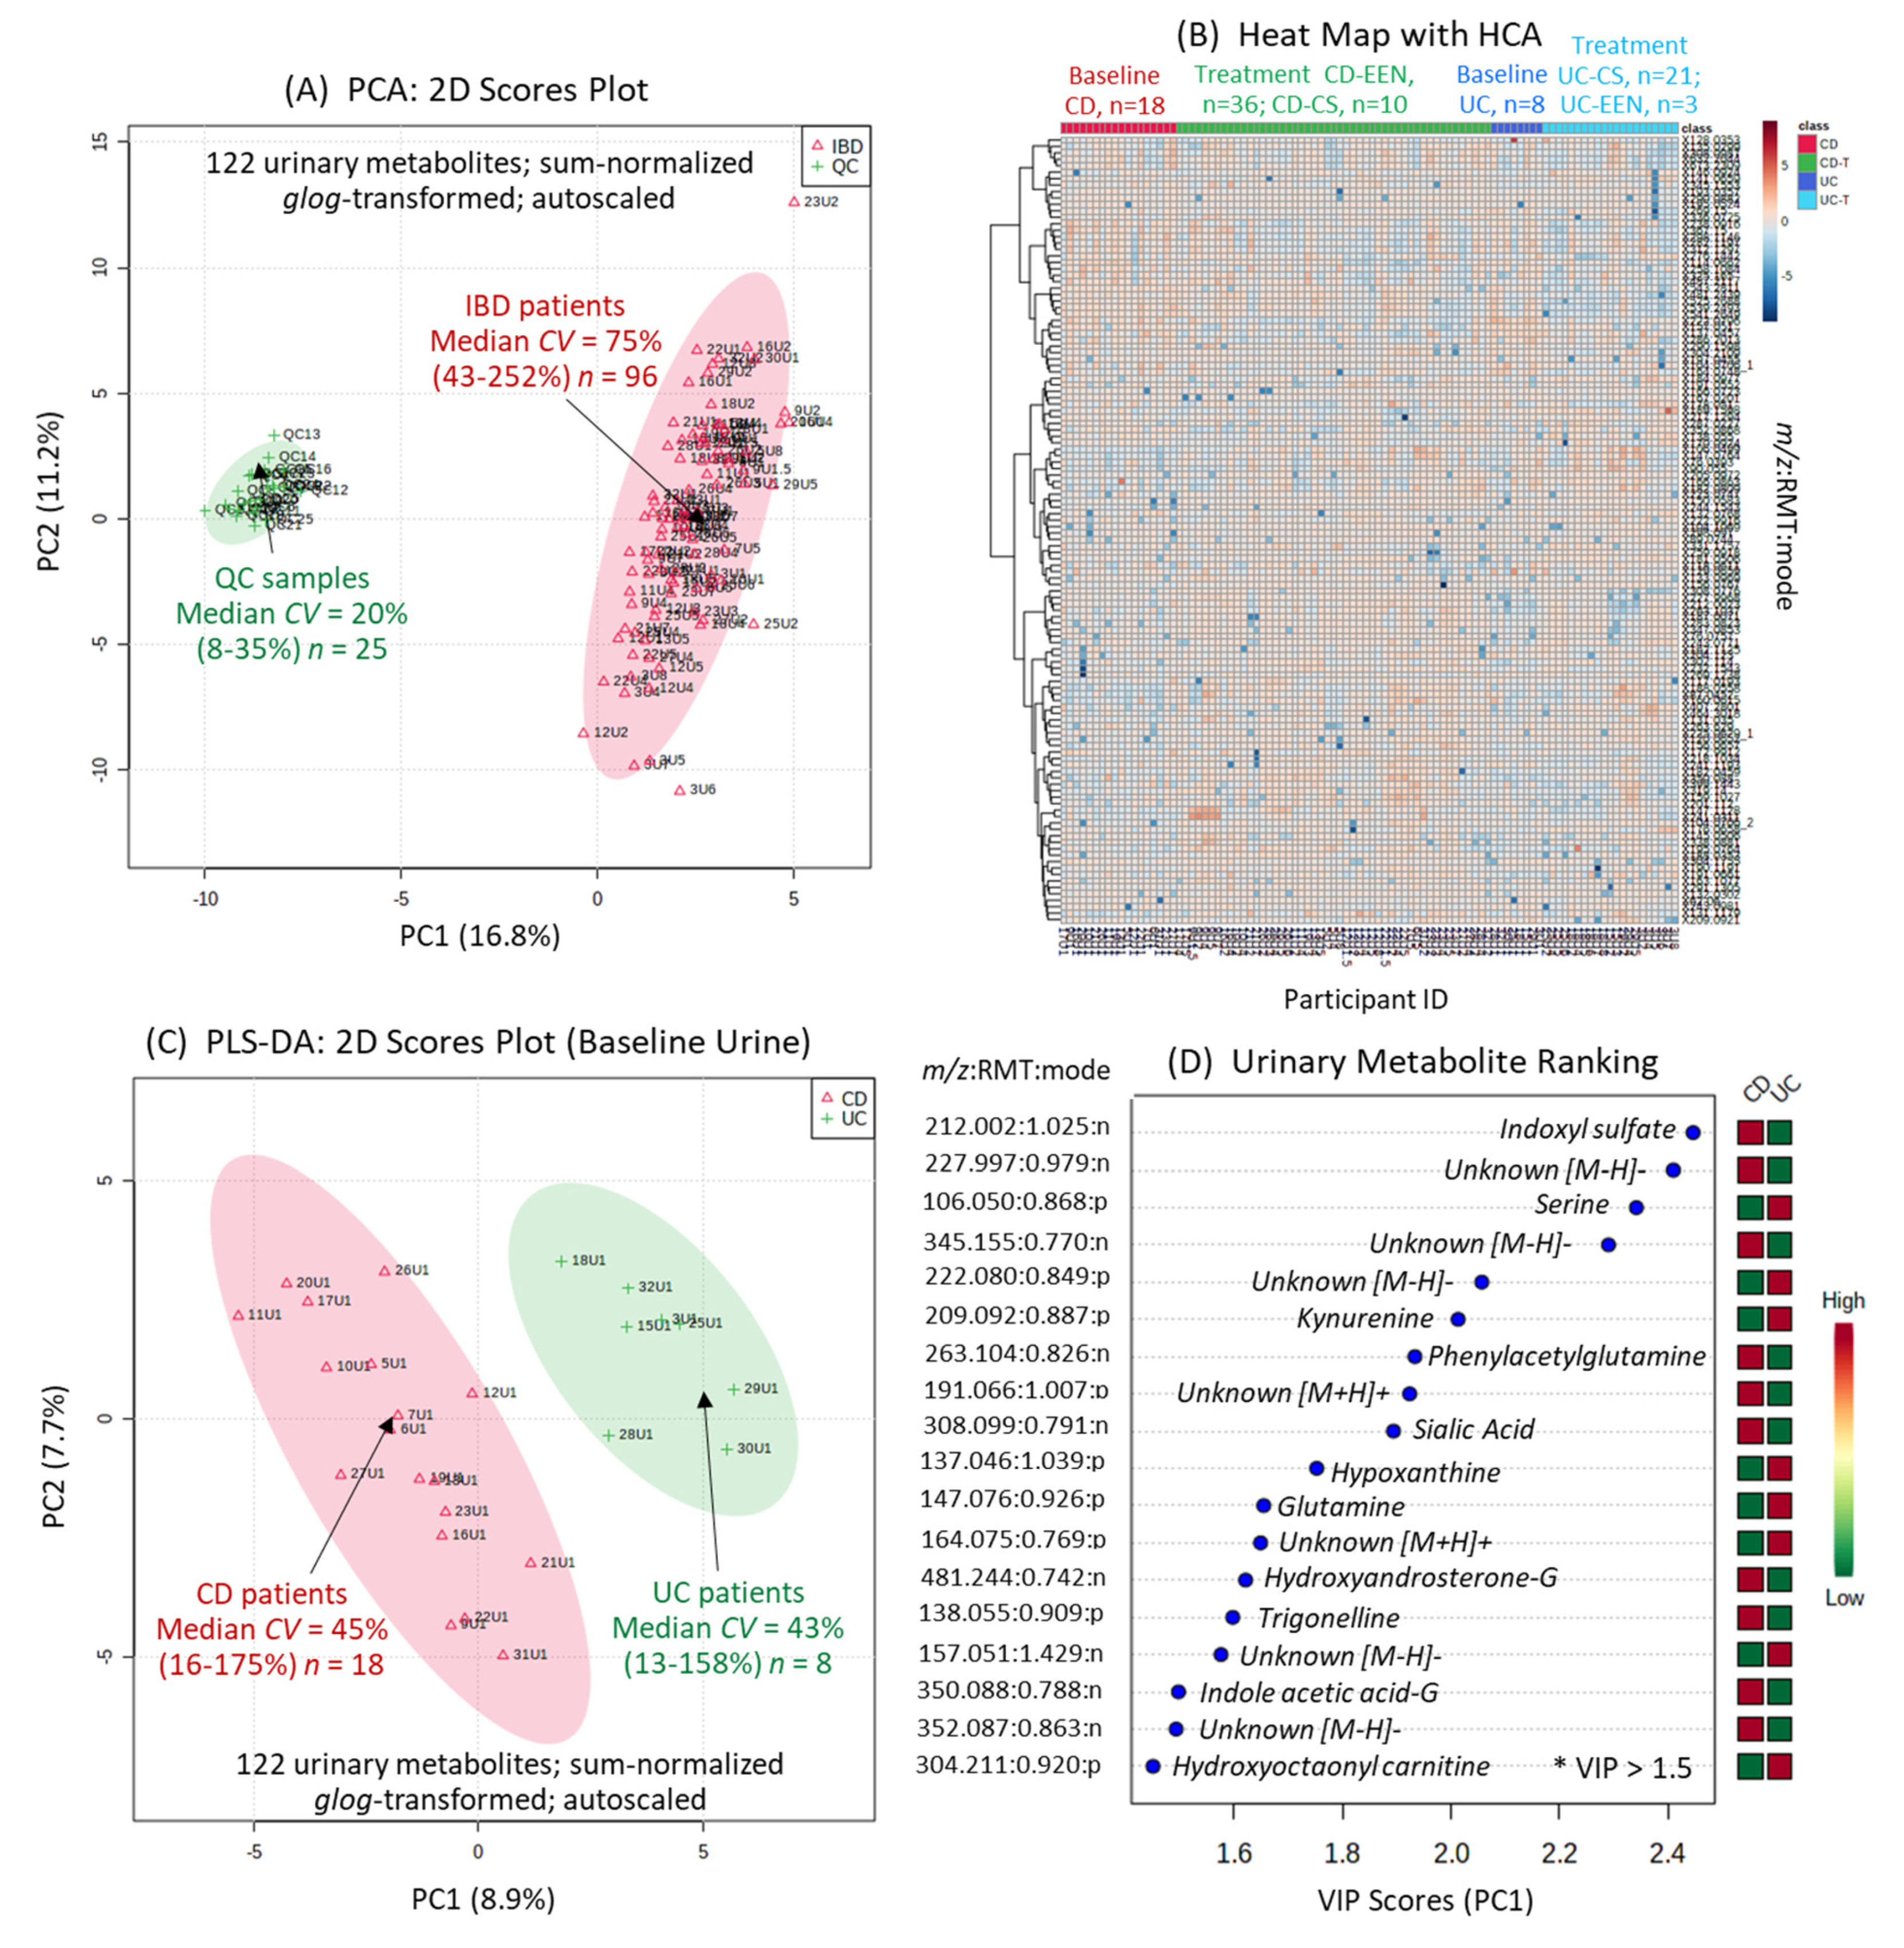
2.2. Urine Metabolome of Pediatric IBD Patients and Metabolite Authentication
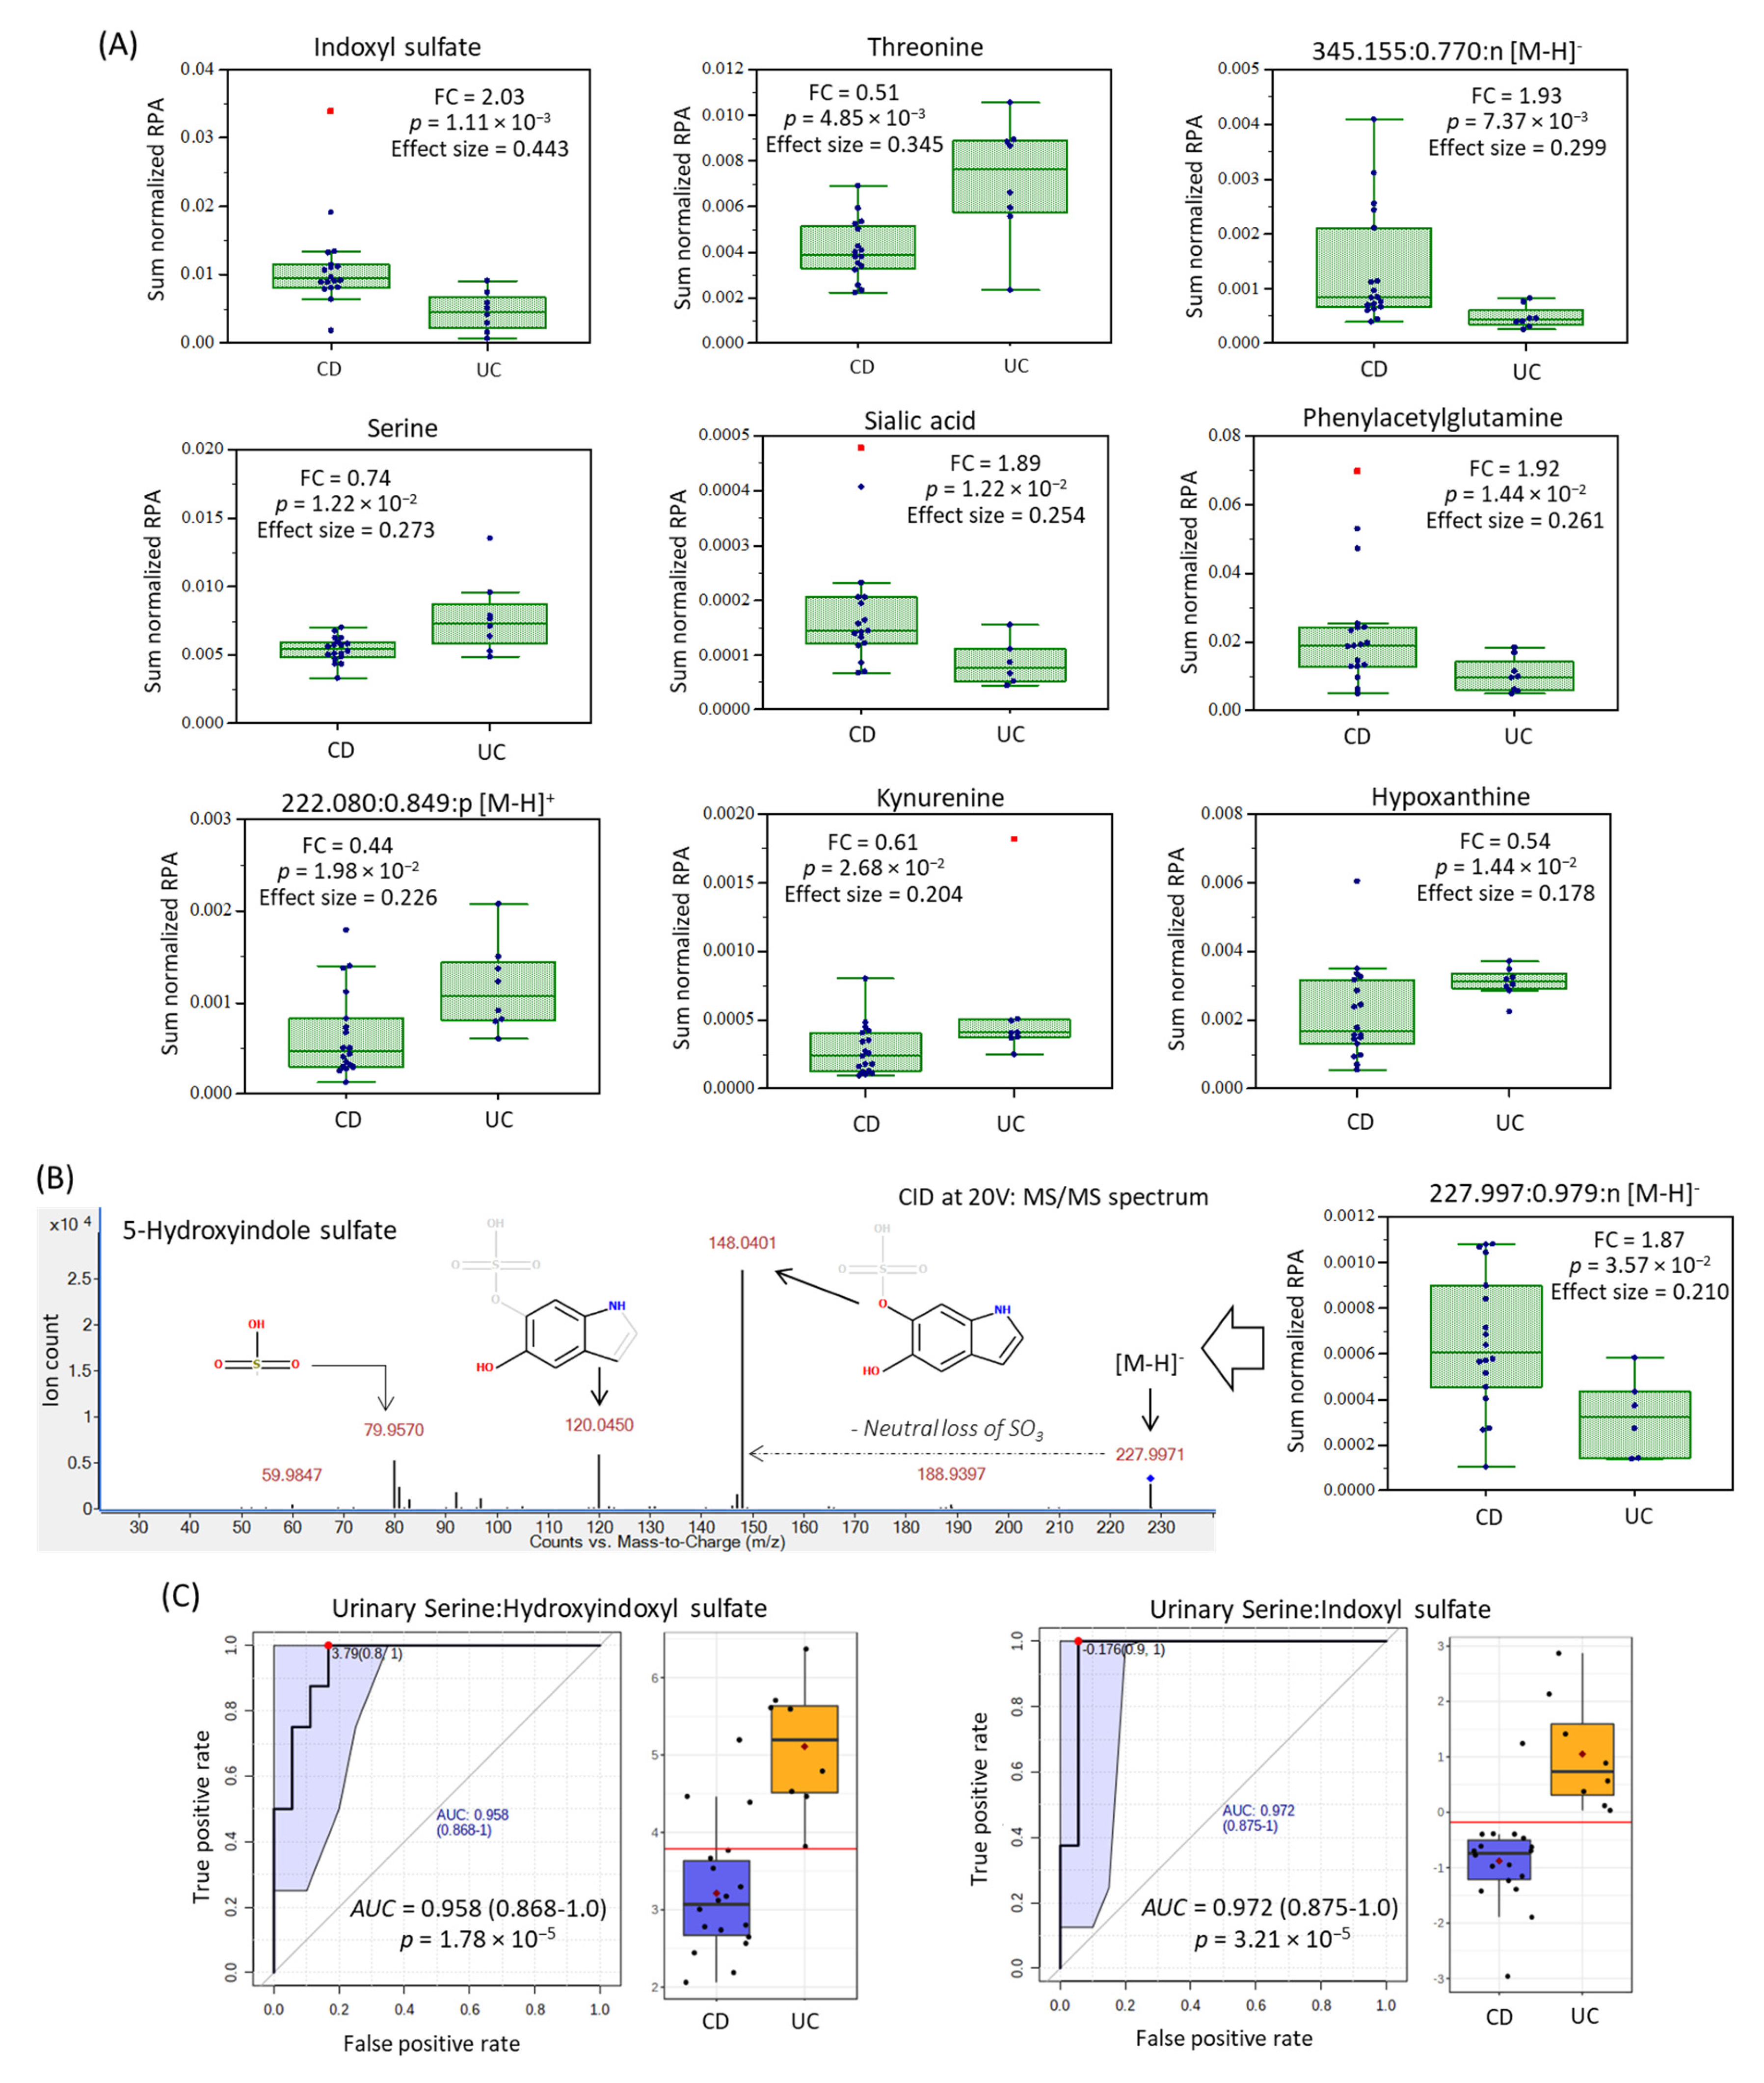
2.3. Urinary Biomarker Candidates Which Differentiate Pediatric CD from UC
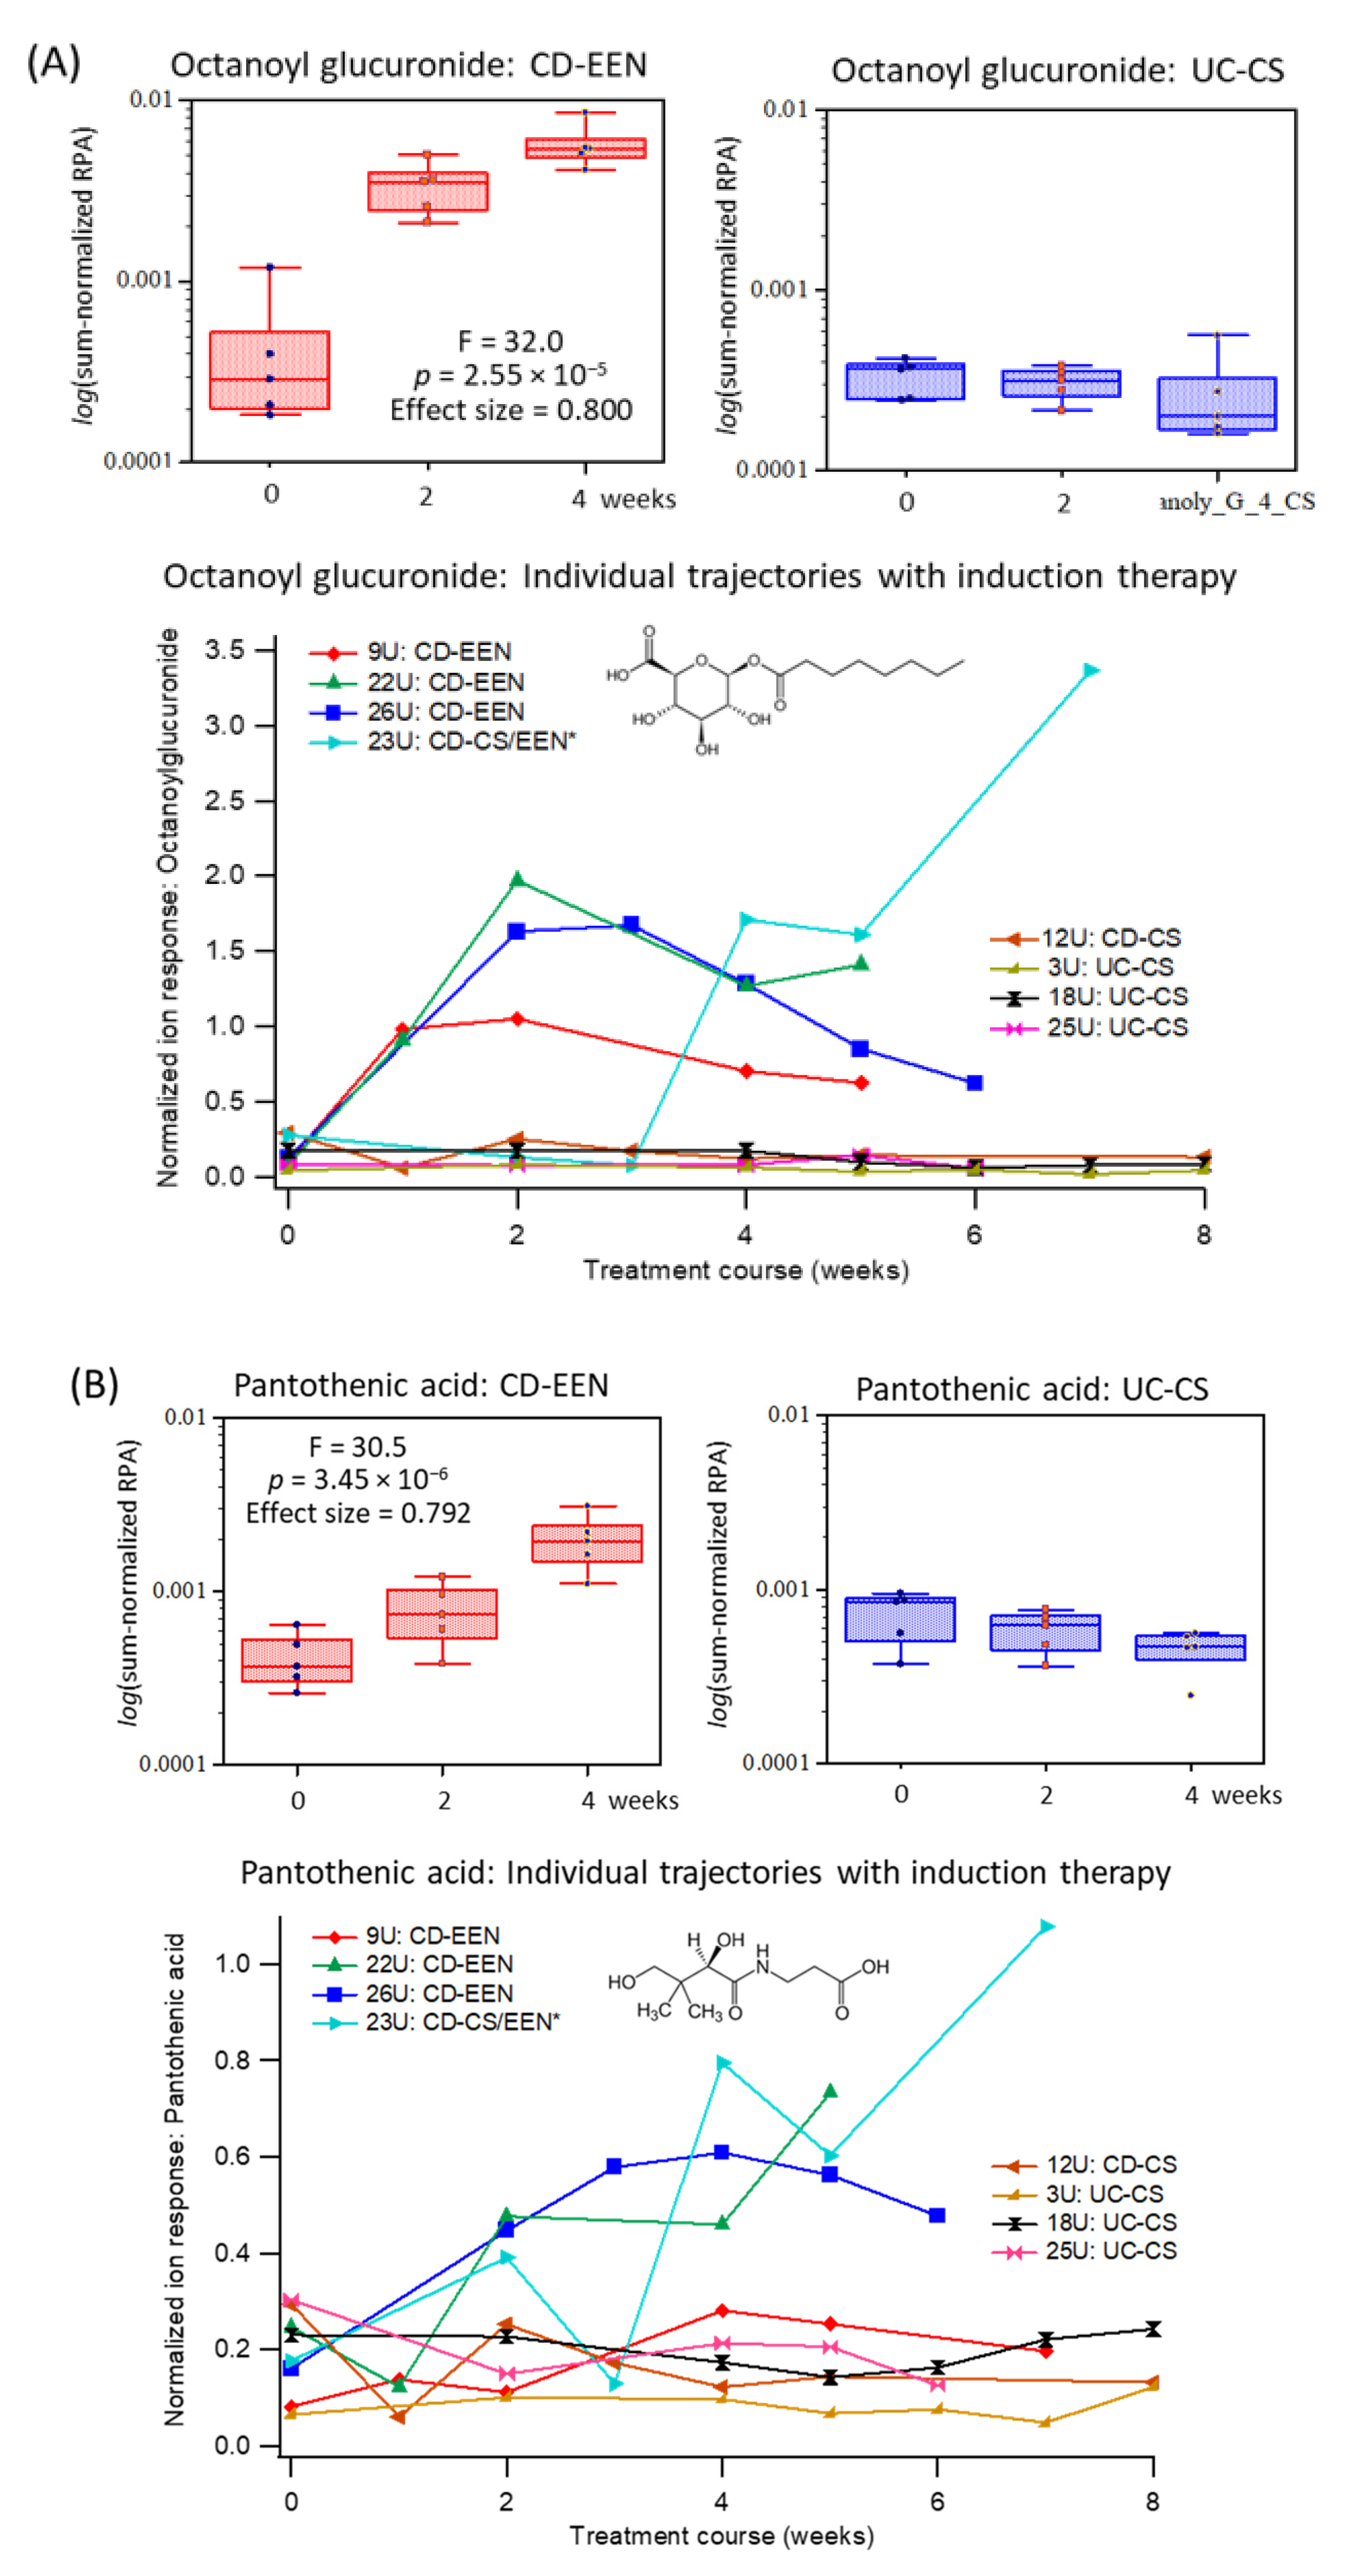
2.4. Specific Urinary Biomarkers Following EEN or CS Therapy of Pediatric IBD Patients


| m/z:RMT:Mode | Metabolite ID | Median FC | p-Value 1 | Effect Size 1 |
|---|---|---|---|---|
| 212.002:1.025:n | Indoxyl sulfate; HMDB0000682 | 2.03 | 0.00111 | 0.443 |
| 120.065:0.905:p | Threonine; HMDB0000167 | 0.51 | 0.00485 | 0.345 |
| 345.155:0.770:n | Unknown fatty acid; C16H26O8 | 1.93 | 0.00737 | 0.309 |
| 106.050:0.868:p | Serine; HMDB0000187 | 0.74 | 0.0122 | 0.273 |
| 308.099:0.791:n | Sialic acid; HMDB000230 | 1.89 | 0.0122 | 0.254 |
| 263.104:0.826:n | Phenylacetylglutamine; HMDB00006344 | 1.92 | 0.0144 | 0.261 |
| 137.046:1.039:p | Hypoxanthine; HMDB0000157 | 0.54 | 0.0144 | 0.178 |
| 222.080:0.849:p | 5-(δ-Carboxybutyl)homocysteine 2 | 0.44 | 0.0198 | 0.239 |
| 209.092:0.887:p | Kynurenine; HMDB0000684 | 0.61 | 0.0268 | 0.204 |
| 227.997:0.979:n | 5-Hydroxyindole sulfate 2 | 1.87 | 0.0357 | 0.210 |
| m/z:RMT:Mode | Metabolite ID | F-Test 1 | p-Value 1 | Effect Size 1 |
|---|---|---|---|---|
| 319.140:0.782:n | Octanoylglucuronide; 2 HMDB0010347 | 32.0 | 2.55 E-06 | 0.800 |
| 218.103:0.836:n | Pantothenic acid; HMBD0000210 | 30.5 | 3.45 E-06 | 0.792 |
| 182.046:0.948:n | Pyridoxic acid; HMDB0000017 | 10.4 | 0.00127 | 0.566 |
| 212.002:1.025:n | Indoxyl sulfate; HMDB0000682 | 6.46 | 0.00877 | 0.447 |
| 191.066:1.007:p | Unknown; C6H10N2O5 | 6.31 | 0.00952 | 0.441 |
| 138.055:0.909:p | Trigonelline; HMDB0000875 | 5.74 | 0.0132 | 0.418 |
| 201.113:1.218:n | Sebacic acid; HMDB0000792 2 | 4.37 | 0.0307 | 0.353 |
| 308.078:1.302:n | Indoxyl glucuronide; 2 HMDB0010319 | 4.30 | 0.0320 | 0.350 |

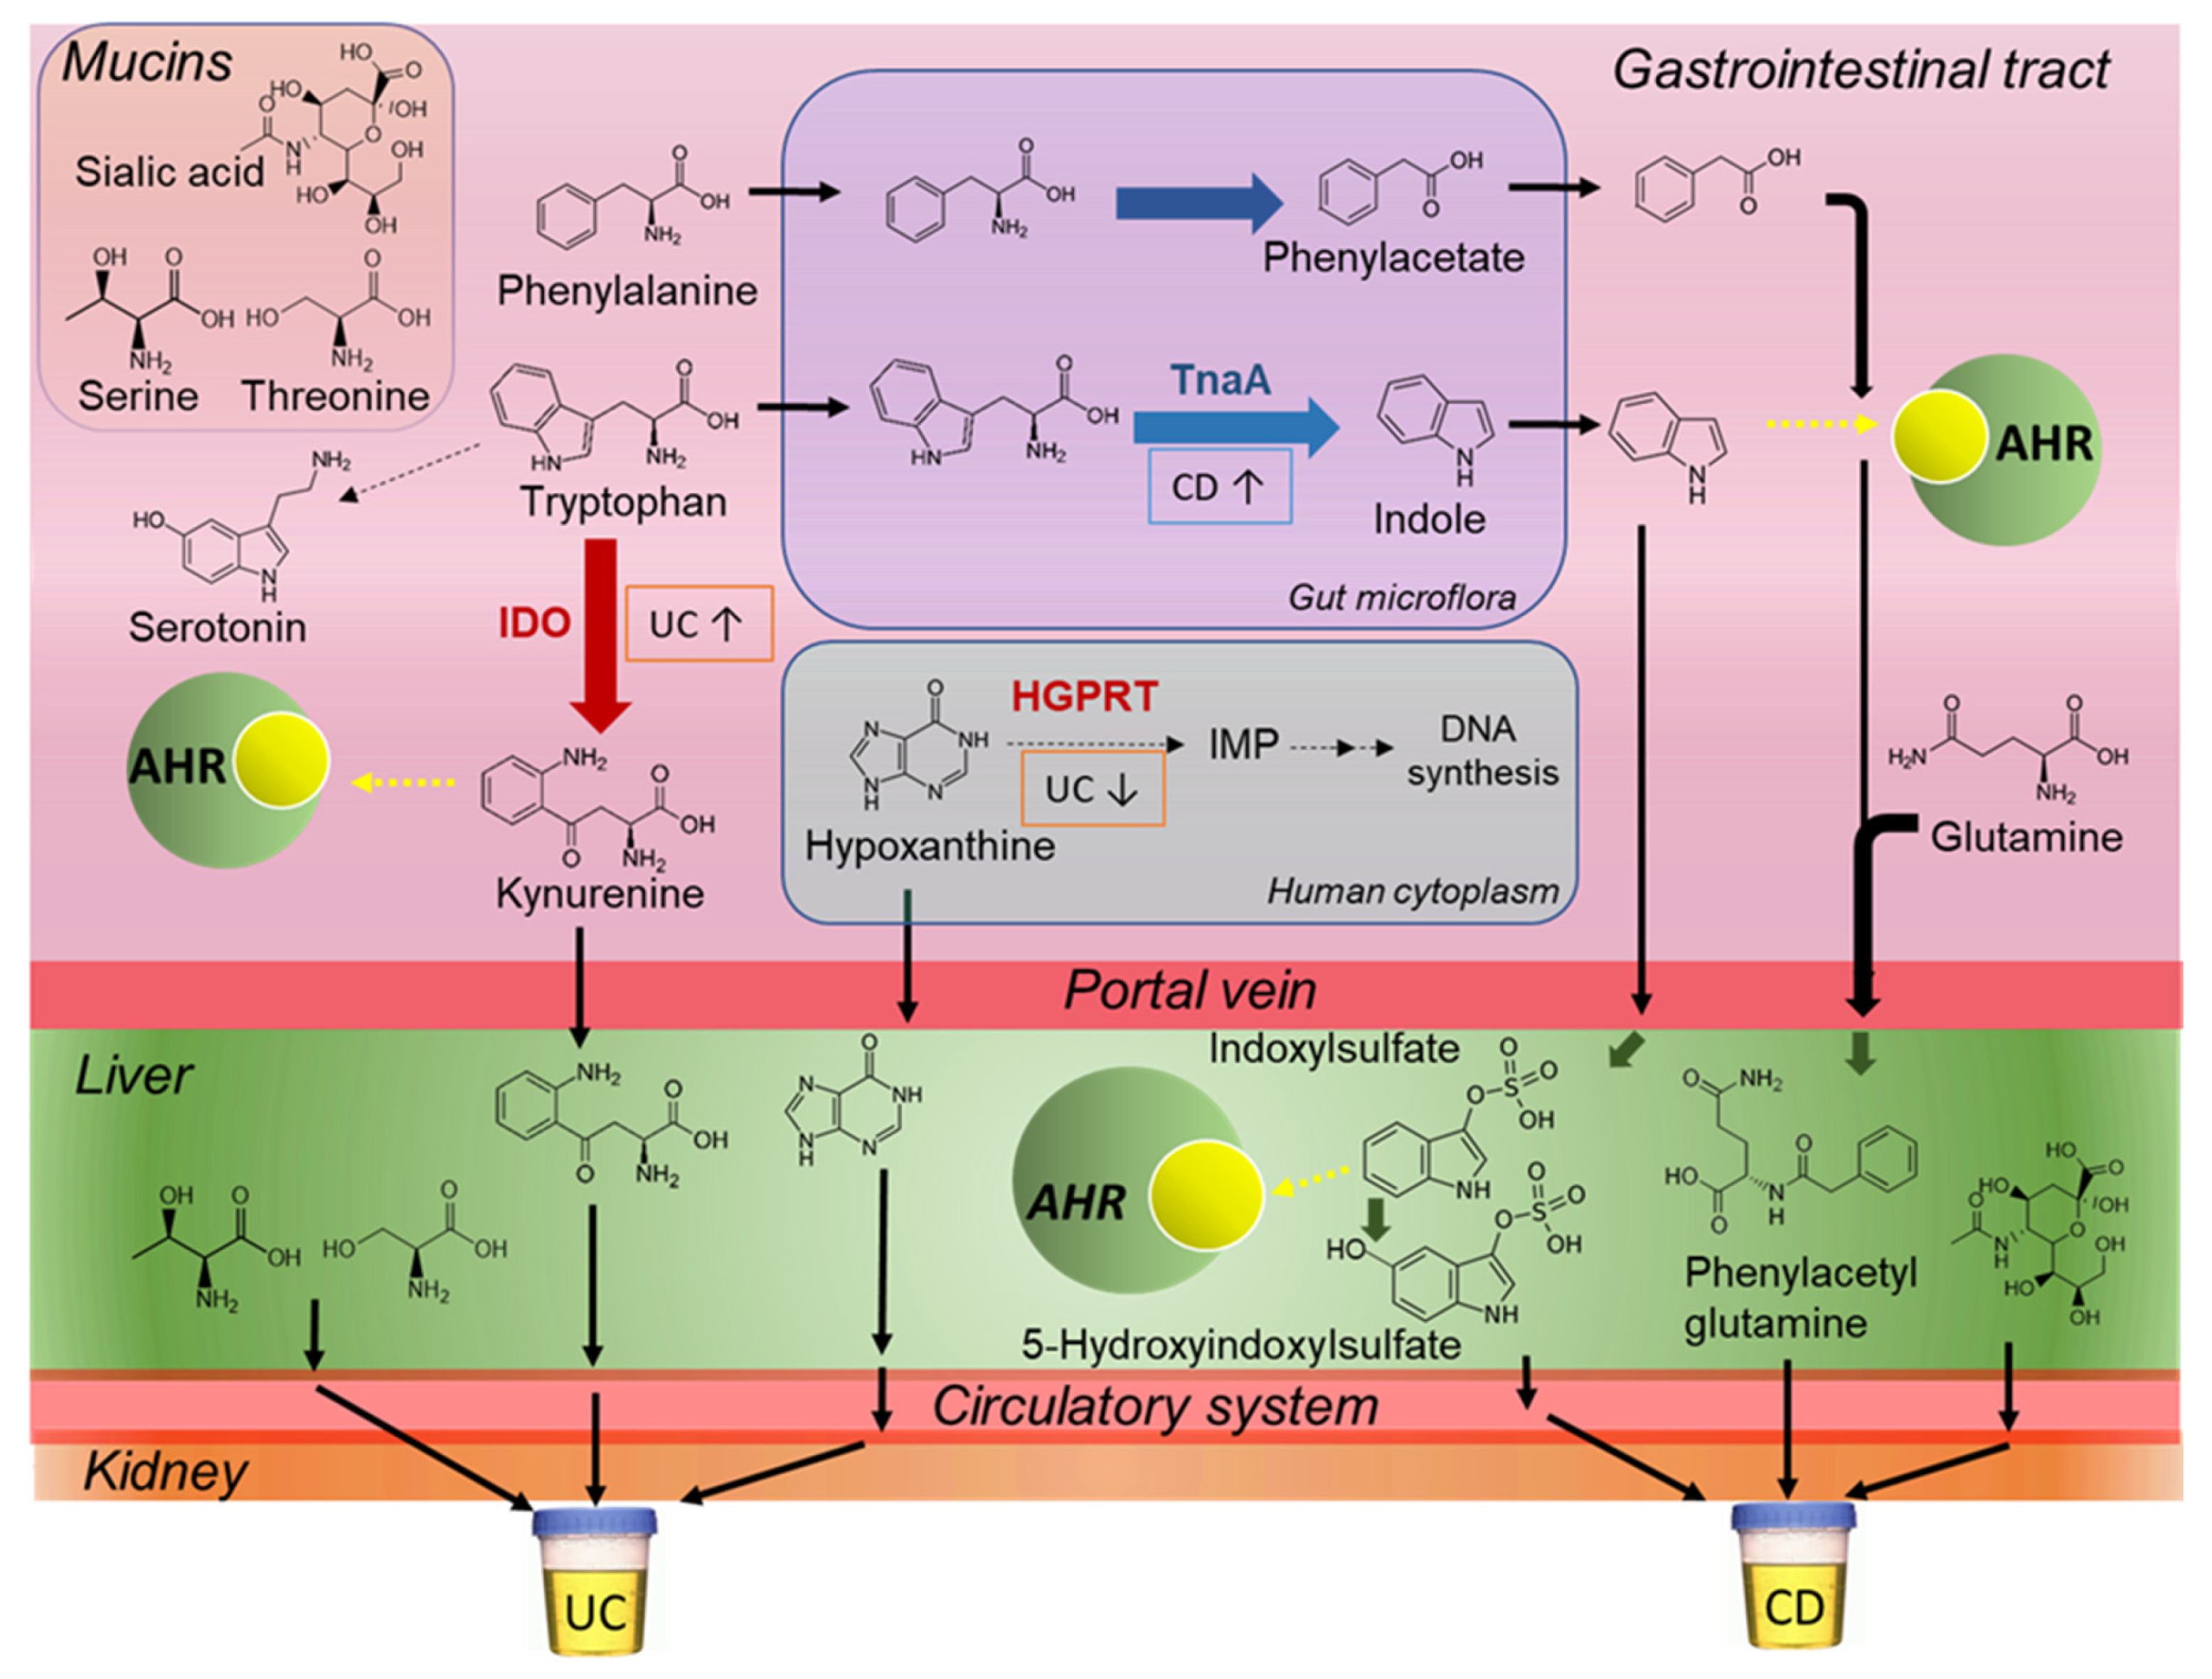
3. Discussion

4. Materials and Methods
4.1. Pediatric IBD Study Cohort
4.2. Urine Sample Collection, Storage, and Workup Procedure
4.3. Urinary Metabolite Stability Studies
4.4. Nontargeted Metabolic Phenotyping of Urine by MSI-CE-MS
4.5. Metabolomics Data Processing and Statistical Analysis
5. Conclusions
Supplementary Materials
Author Contributions
Funding
Institutional Review Board Statement
Informed Consent Statement
Data Availability Statement
Conflicts of Interest
References
- GBD 2017 Inflammatory Bowel Disease Collaborators. The global, regional, and national burden of inflammatory bowel disease in 195 countries and territories, 1990–2017: A systematic analysis for the Global Burden of Disease Study 2017. Lancet Gastroenterol. Hepatol. 2020, 5, 17–30. [Google Scholar] [CrossRef]
- Gasparetto, M.; Guariso, G.; Pozza, L.V.; Ross, A.; Heuschkel, R.; Zilbauer, M. Clinical course and outcomes of diagnosing inflammatory bowel disease in children 10 years and under: Retrospective cohort study from two tertiary centres in the United Kingdom and in Italy. BMC Gastroenterol. 2016, 16, 35. [Google Scholar] [CrossRef]
- Keethy, D.; Mrakotsky, C.; Szigethy, E. Pediatric IBD and depression: Treatment implications. Curr. Opin. Pediatr. 2014, 26, 561–567. [Google Scholar] [CrossRef]
- Kappelman, M.D.; Porter, C.Q.; Galanko, J.A.; Galanko, J.A.; Rifas-Shiman, S.L.; Ollendorf, D.A.; Sandler, R.S.; Finkelstein, J.A. Utilization of healthcare resources by U.S. children and adults with inflammatory bowel disease. Inflamm. Bowel Dis. 2011, 17, 62–68. [Google Scholar] [CrossRef]
- Ruemmele, F.M.; Veres, G.; Kolho, K.L.; Griffiths, A.; Levine, A.; Escher, J.C.; Amil Dias, J.; Barabino, A.; Braegger, C.P.; Bronsky, J.; et al. Consensus guidelines of ECCO/ESPGHAN on the medical management of pediatric Crohn’s disease. J. Crohns Colitis 2014, 8, 1179–1207. [Google Scholar] [CrossRef]
- Ruemmele, F.M.; Turner, D. Differences in the management of pediatric and adult onset ulcerative colitis--lessons from the joint ECCO and ESPGHAN consensus guidelines for the management of pediatric ulcerative colitis. J. Crohns Colitis 2014, 8, 1–4. [Google Scholar] [CrossRef] [PubMed]
- Rolandsdotter, H.; Jönsson-Videsäter, K.; Fagerberg, U.L.; Finkel, Y.; Eberhardson, M. Exclusive enteral nutrition: Clinical effects and changes in mucosal cytokine profile in pediatric new inflammatory bowel disease. Nutrients 2019, 11, 414. [Google Scholar] [CrossRef] [PubMed]
- North American Society for Pediatric Gastroenterology, Hepatology, and Nutrition; Colitis Foundation of America; Bousvaros, A.; Antonioli, D.A.; Colletti, R.B.; Dubinsky, M.C.; Glickman, J.N.; Gold, B.D.; Griffiths, A.M.; Jevon, G.P.; et al. Differentiating ulcerative colitis from Crohn disease in children and young adults: Report of a working group of the North American Society for Pediatric Gastroenterology, Hepatology, and Nutrition and the Crohn’s and Colitis Foundation of America. J. Pediatr. Gastroenterol. Nutr. 2007, 44, 653–674. [Google Scholar]
- Thurgate, L.E.; Lemberg, D.A.; Day, A.S.; Leach, S.T. An overview of inflammatory bowel disease unclassified in children. Inflamm. Intest. Dis. 2019, 4, 97–103. [Google Scholar] [CrossRef] [PubMed]
- Johnson, C.H.; Ivanisevic, J.; Siuzdak, G. Metabolomics: Beyond biomarkers and towards mechanisms. Nat. Rev. Mol. Cell Biol. 2016, 17, 451–459. [Google Scholar] [CrossRef] [PubMed]
- De Preter, V. Metabolomics in the clinical diagnosis of inflammatory bowel disease. Dig. Dis. 2015, 33, 2–10. [Google Scholar] [CrossRef] [PubMed]
- Filimoniuk, A.; Daniluk, U.; Samczuk, P.; Wasilewska, N.; Jakimiec, P.; Kucharska, M.; Lebensztejn, D.M.; Ciborowski, M. Metabolomic profiling in children with inflammatory bowel disease. Adv. Med. Sci. 2020, 65, 65–70. [Google Scholar] [CrossRef] [PubMed]
- Lloyd-Price, J.; Arze, C.; Ananthakrishnan, A.N.; Schirmer, M.; Avila-Pacheco, J.; Poon, T.W.; Andrews, E.; Ajami, N.J.; Bonham, K.S.; Brislawn, C.J.; et al. Multi-omics of the gut microbial ecosystem in inflammatory bowel diseases. Nature 2019, 569, 655–662. [Google Scholar] [CrossRef] [PubMed]
- Marchesi, J.R.; Holmes, E.; Khan, F.; Kochhar, S.; Scanlan, P.; Shanahan, F.; Wilson, A.I.D.; Wang, Y. Rapid and noninvasive metabonomic characterization of inflammatory bowel disease. J. Proteome Res. 2007, 6, 546–551. [Google Scholar] [CrossRef] [PubMed]
- Williams, H.R.T.; Cox, I.J.; Walker, D.G.; North, B.V.; Patel, V.M.; Marshall, S.E.; Jewell, D.P.; Ghosh, S.; Thomas, H.J.; Teare, J.P.; et al. Characterization of inflammatory bowel disease with urinary metabolic profiling. Am. J. Gastroenterol. 2009, 104, 1435–1444. [Google Scholar] [CrossRef] [PubMed]
- Scoville, E.A.; Allaman, M.M.; Brown, C.T.; Motley, A.K.; Horst, S.N.; Williams, C.S.; Koyama, T.; Zhao, Z.; Adams, D.W.; Beaulieu, D.B.; et al. Alterations in lipid, amino acid, and energy metabolism distinguish Crohn’s disease from ulcerative colitis and control subjects by serum metabolomic profiling. Metabolomics 2017, 14, 17. [Google Scholar] [CrossRef] [PubMed]
- Balasubramanian, K.; Kumar, S.; Singh, R.R.; Sharma, U.; Ahuja, V.; Makharia, G.K.; Jagannathan, N.R. Metabolism of the colonic mucosa in patients with inflammatory bowel diseases: An in vitro proton magnetic resonance spectroscopy study. Magn. Reason. Imaging 2009, 27, 79–86. [Google Scholar] [CrossRef]
- Kolho, K.-L.; Pessia, A.; Jaakkola, T.; de Vos, W.M.; Velagapudi, V. Faecal and serum metabolomics in paediatric inflammatory bowel disease. J. Crohns Colitis 2017, 11, 321–334. [Google Scholar] [CrossRef]
- Keshteli, A.H.; Madsen, K.L.; Mandal, R.; Boeckxstaens, G.E.; Bercik, P.; De Palma, G.; Reed, D.E.; Wishart, D.; Vanner, S.; Dieleman, L.A. Comparison of the metabolomic profiles of irritable bowel syndrome patients with ulcerative colitis patients and healthy controls: New insights into pathophysiology and potential biomarkers. Aliment Pharmacol. Ther. 2019, 49, 723–732. [Google Scholar] [CrossRef] [PubMed]
- Schicho, R.; Shaykhutdinov, R.; Ngo, J.; Nazyrova, A.; Schneider, C.; Panaccione, R.; Kaplan, G.G.; Vogel, H.J.; Storr, M. Quantitative metabolomic profiling of serum, plasma, and urine by 1H NMR spectroscopy discriminates between patients with inflammatory bowel disease and healthy individuals. J. Proteome Res. 2012, 11, 3344–3357. [Google Scholar] [CrossRef]
- Stephens, N.S.; Siffledeen, J.; Su, X.; Murdoch, T.B.; Fedorak, R.N.; Slupsky, C.M. Urinary NMR metabolomic profiles discriminate inflammatory bowel disease from healthy. J. Crohns Colitis 2013, 7, e42–e48. [Google Scholar] [CrossRef]
- Hart, L.; Farbod, Y.; Szamosi, J.C.; Yamamoto, M.; Britz-McKibbin, P.; Halgren, C.; Zachos, M.; Pai, N. Effect of exclusive enteral nutrition and corticosteroid induction therapy on the gut microbiota of pediatric patients with inflammatory bowel disease. Nutrients 2020, 12, 1691. [Google Scholar] [CrossRef] [PubMed]
- Shanmuganathan, M.; Kroezen, Z.; Gill, B.; Azab, S.; de Souza, R.J.; Teo, K.K.; Befus, D.; Morrison, K.M.; Atkinson, S.; Anand, S.S.; et al. The maternal serum metabolome by multisegment injection-capillary electrophoresis-mass spectrometry: A standardized data workflow for large-scale epidemiological studies. Nat. Prot. 2021. [Google Scholar] [CrossRef] [PubMed]
- DiBattista, A.; McIntosh, N.; Lamoureux, M.; Al-Dirbashi, O.Y.; Chakraborty, P.; Britz-McKibbin, P. Metabolic signatures of cystic fibrosis identified in dried blood spots for newborn screening without carrier identification. J. Proteome Res. 2019, 18, 841–854. [Google Scholar] [CrossRef] [PubMed]
- Yamamoto, M.; Pinto-Sanchez, M.I.; Bercik, P.; Britz-McKibbin, P. Metabolomics reveals elevated urinary excretion of collagen degradation and epithelial cell turnover products in irritable bowel syndrome patients. Metabolomics 2019, 15, 82. [Google Scholar] [CrossRef]
- Kuhara, T.; Matsumoto, I.; Ohno, M.; Ohura, T. Identification and quantification of octanoyl glucuronide in the urine of children who ingested medium-chain triglycerides. Biomed. Environ. Mass Spectrom. 1986, 13, 595–598. [Google Scholar] [CrossRef]
- Martin, F.P.; Ezri, J.; Cominetti, O.; Da Silva, L.; Kussmann, M.; Godin, J.P.; Nydegger, A. Urinary metabolic phenotyping reveals differences in the metabolic status of healthy and inflammatory bowel disease (IBD) children in relation to growth and disease activity. Int. J. Mol. Sci. 2016, 17, 1310. [Google Scholar] [CrossRef]
- Martin, F.P.; Su, M.M.; Xie, G.X.; Guiraud, S.P.; Kussmann, M.; Godin, J.P.; Jia, W.; Nydegger, A. Urinary metabolic insights into host-gut microbial interactions in healthy and IBD children. World J. Gastroenterol. 2017, 23, 3643–3654. [Google Scholar] [CrossRef] [PubMed]
- Agus, A.; Planchais, J.; Sokol, H. Gut microbiota regulation of tryptophan metabolism in health and disease. Cell Host Microbe 2018, 23, 716–724. [Google Scholar] [CrossRef] [PubMed]
- Huang, Y.; Zhou, J.; Wang, S.; Xiong, J.; Chen, Y.; Liu, Y.; Xiao, T.; Li, Y.; He, T.; Li, Y.; et al. Indoxyl sulfate induces intestinal barrier injury through IRF1-DRP1 axis-mediated mitophagy impairment. Theranostics 2020, 10, 7384–7400. [Google Scholar] [CrossRef] [PubMed]
- Sofia, M.A.; Ciorba, M.A.; Meckel, K.; Lim, C.K.; Guillemin, G.J.; Weber, C.R.; Bissonnette, M.; Pekow, J.R. Tryptophan metabolism through the kynurenine pathway is associated with endoscopic inflammation in ulcerative colitis. Inflamm. Bowel Dis. 2018, 24, 1471–1480. [Google Scholar] [CrossRef] [PubMed]
- Faure, M.; Mettraux, C.; Moennoz, D.; Godin, J.P.; Vuichoud, J.; Rochat, F.; Breuillé, D.; Obled, C.; Corthésy-Theulaz, I. Specific amino acids increase mucin synthesis and microbiota in dextran sulfate sodium-treated rats. J. Nutr. 2006, 136, 1558–1564. [Google Scholar] [CrossRef]
- Mao, X.; Zeng, X.; Qiao, S.; Wu, G.; Li, D. Specific roles of threonine in intestinal mucosal integrity and barrier function. Front. Biosci. 2011, 3, 1192–1200. [Google Scholar] [CrossRef]
- Lee, J.S.; Wang, R.X.; Alexeev, E.E.; Lanis, J.M.; Battista, K.D.; Glover, L.E.; Colgan, S.P. Hypoxanthine is a checkpoint stress metabolite in colonic epithelial energy modulation and barrier function. J. Biol. Chem. 2018, 293, 6039–6051. [Google Scholar] [CrossRef] [PubMed]
- Huang, Y.L.; Chassard, C.; Hausmann, M.; von Itzstein, M.; Hennet, T. Sialic acid catabolism drives intestinal inflammation and microbial dysbiosis in mice. Nat. Commun. 2015, 6, 8141. [Google Scholar] [CrossRef]
- Wellington, N.; Shanmuganathan, M.; de Souza, R.J.; Zulyniak, M.A.; Azab, S.; Bloomfield, J.; Mell, A.; Ly, R.; Desai, D.; Anand, S.S.; et al. Metabolic trajectories following contrasting Prudent and Western diets from food provisions: Identifying robust biomarkers of short-term changes in habitual diet. Nutrients 2019, 11, 2407. [Google Scholar] [CrossRef]
- Chong, J.; Soufan, O.; Li, C.; Caraus, I.; Li, S.; Bourque, G.; Wishart, D.S.; Xia, J. MetaboAnalyst 4.0: Towards more transparent and integrative metabolomics analysis. Nucleic Acids Res. 2018, 46, W486–W494. [Google Scholar] [CrossRef] [PubMed]
| Criteria | CD (n = 18) | UC (n = 8) |
|---|---|---|
| Age | 13 ± 2 | 12 ± 3 |
| Sex; male:female | 11:7 | 4:4 |
| Diagnosis < 1 month (%) | 13 (72%) | 6 (75%) |
| EEN; CS treatment arm (n) | 15; 3 | 1; 7 |
| Serum CRP (mg/L) 1 | 40 ± 40 | 36 ± 65 |
| FCP (µg/g) 1 | 3240 ± 2210 | 2558 ± 1150 |
| Hemoglobin (g/L) 1 | 109 ± 18 | 110 ± 16 |
| ESR (mm/h) 1 | 37 ± 26 | 43 ± 23 |
| Albumin (g/L) 1 | 28.2 ± 4.8 | 30.4 ± 2.3 |
| WBC (×109/L) 1 | 8.1 ± 2.3 | 7.3 ± 2.0 |
| Urinary creatinine (mg/L) | 11.0 ± 5.2 | 9.1 ± 6.6 |
| Urine osmolality (mOsm/kg) | 480 ± 190 | 408 ± 250 |
| Disease location: | ||
| Ileocolonic | 11 | NA |
| Ileocolonic + UGI | 2 | NA |
| Colonic | 2 | 8 |
| Colonic + UGI | 3 | NA |
| Maintenance medications:2 | ||
| Biologic | 1 (2) | 0 (0) |
| Immunomodulator | 2 (10) | 0 (0) |
| 5-ASA | 0 (2) | 1 (5) |
| Biologic + Immunomodulator | 2 (2) | 1 (2) |
| Clinical outcomes:3 | ||
| Remission; Response; No response | 11; 7; 0 | 4; 1; 2 |
Publisher’s Note: MDPI stays neutral with regard to jurisdictional claims in published maps and institutional affiliations. |
© 2021 by the authors. Licensee MDPI, Basel, Switzerland. This article is an open access article distributed under the terms and conditions of the Creative Commons Attribution (CC BY) license (https://creativecommons.org/licenses/by/4.0/).
Share and Cite
Yamamoto, M.; Shanmuganathan, M.; Hart, L.; Pai, N.; Britz-McKibbin, P. Urinary Metabolites Enable Differential Diagnosis and Therapeutic Monitoring of Pediatric Inflammatory Bowel Disease. Metabolites 2021, 11, 245. https://doi.org/10.3390/metabo11040245
Yamamoto M, Shanmuganathan M, Hart L, Pai N, Britz-McKibbin P. Urinary Metabolites Enable Differential Diagnosis and Therapeutic Monitoring of Pediatric Inflammatory Bowel Disease. Metabolites. 2021; 11(4):245. https://doi.org/10.3390/metabo11040245
Chicago/Turabian StyleYamamoto, Mai, Meera Shanmuganathan, Lara Hart, Nikhil Pai, and Philip Britz-McKibbin. 2021. "Urinary Metabolites Enable Differential Diagnosis and Therapeutic Monitoring of Pediatric Inflammatory Bowel Disease" Metabolites 11, no. 4: 245. https://doi.org/10.3390/metabo11040245
APA StyleYamamoto, M., Shanmuganathan, M., Hart, L., Pai, N., & Britz-McKibbin, P. (2021). Urinary Metabolites Enable Differential Diagnosis and Therapeutic Monitoring of Pediatric Inflammatory Bowel Disease. Metabolites, 11(4), 245. https://doi.org/10.3390/metabo11040245