
Glutamine Homeostasis and Its Role in the Adaptive Strategies of the Blind Mole Rat, Spalax
by
 ,
,
Dmitry Miskevich
1,* ,
,
Anastasia Chaban
1,
Maria Dronina
2,
Ifat Abramovich
3,
Eyal Gottlieb
3 and
Imad Shams
1,2,* 1
Department of Evolutionary and Environmental Biology, Faculty of Natural Sciences, University of Haifa, Haifa 3498838, Israel
2
Institute of Evolution, University of Haifa, Haifa 3498838, Israel
3
Technion Faculty of Medicine, Haifa 3525433, Israel
*
Authors to whom correspondence should be addressed.
Metabolites 2021, 11(11), 755; https://doi.org/10.3390/metabo11110755
Submission received: 9 October 2021
/
Revised: 26 October 2021
/
Accepted: 30 October 2021
/
Published: 31 October 2021
(This article belongs to the Special Issue Metabolic Strategies in Hypoxia)
Abstract
:Oxidative metabolism is fine-tuned machinery that combines two tightly coupled fluxes of glucose and glutamine-derived carbons. Hypoxia interrupts the coordination between the metabolism of these two nutrients and leads to a decrease of the system efficacy and may eventually cause cell death. The subterranean blind mole rat, Spalax, is an underexplored, underground, hypoxia-tolerant mammalian group which spends its life under sharply fluctuating oxygen levels. Primary Spalax cells are an exceptional model to study the metabolic strategies that have evolved in mammals inhabiting low-oxygen niches. In this study we explored the metabolic frame of glutamine (Gln) homeostasis in Spalax skin cells under normoxic and hypoxic conditions and their impacts on the metabolism of rat cells. Targeted metabolomics employing liquid chromatography and mass spectrometry (LC-MS) was used to track the fate of heavy glutamine carbons (13C5 Gln) after 24 h under normoxia or hypoxia (1% O2). Our results indicated that large amounts of glutamine-originated carbons were detected as proline (Pro) and hydroxyproline (HPro) in normoxic Spalax cells with a further increase under hypoxia, suggesting a strategy for reduced Gln carbons storage in proteins. The intensity of the flux and the presence of HPro suggests collagen as a candidate protein that is most abundant in animals, and as the primary source of HPro. An increased conversion of αKG to 2 HG that was indicated in hypoxic Spalax cells prevents the degradation of hypoxia-inducible factor 1α (HIF-1α) and, consequently, maintains cytosolic and mitochondrial carbons fluxes that were uncoupled via inhibition of the pyruvate dehydrogenase complex. A strong antioxidant defense in Spalax cells can be attributed, at least in part, to the massive usage of glutamine-derived glutamate for glutathione (GSH) production. The present study uncovers additional strategies that have evolved in this unique mammal to support its hypoxia tolerance, and probably contribute to its cancer resistance, longevity, and healthy aging.
1. Introduction
Glucose (Glc) and glutamine (Gln) are two central metabolic nutrients that maintain cellular metabolism. Gln has a more pleiotropic role in cellular metabolism than Glc. It incorporates directly into proteins [1] and participates in the proteostasis regulation [2]; provides carbons and nitrogen for the biosynthesis of amino acids, nucleotides, and hexosamines [1,3,4]; replenishes the tricarboxylic acid (TCA) cycle with carbons [5]; and plays an important role in the gluconeogenesis (GNG) [6].
Hypoxia upregulates the level of hypoxia-inducible factor 1α (HIF-1α) which switches cellular bioenergetics to anaerobic mode [7]. The anaerobic mode includes reduced pyruvate metabolism, uncoupling of the glycolysis and the TCA cycle, and the subsequent shortage of glucose-derived acetyl-CoA (Ac-CoA) [8,9]. In turn, the deficit of ac-CoA could result in a decreasing citrate (Citr) level that is essential for multiple biosynthetic reactions and signaling [10]. Replenishing of the TCA cycle with Gln-derived carbons, termed Gln anaplerosis (Gln-An), is the only known way to maintain appropriate levels of Citr and anabolic processes in case of a Glc-derived Ac-CoA deficit [8]. Gln-An works independently of Glc entry into the cycle and allows the TCA cycle to function regardless of oxygen availability. Gln-An can furnish the cells’ necessities by several ways, e.g., conversion to malate (Mal) and further to pyruvate (Pyr) via a malic enzyme (ME) reaction thereby maintaining NADPH+ level. Pyr can be converted to lactate (Lact) for maintaining the cytosolic NAD+ pool and is released outside, otherwise, returns to the TCA cycle via pyruvate dehydrogenase (PDH) for producing Ac-CoA. Oxaloacetate (OAA) is the downstream Mal processing product that serves as a precursor for aspartate (Asp) and asparagine (Asn), or after condensation with Ac-CoA maintains the Citr pool. Hypoxia switches the oxidative Gln metabolism to the reductive mode via ubiquitylation of SIAH2, a subunit of α-ketoglutarate (αKG) dehydrogenase (αKGDH) which is required for the conversion of αKG to succinate (Succ) [11]. Besides the TCA cycle transformations of Gln, its function and metabolism in relation to proline (Pro) biosynthesis is of special interest [12], particularly the use of Gln carbons for Pro and collagen synthesis [13,14]. The metabolism of de novo produced Pro and hydroxyproline (HPro) (as a product of collagen degradation) is suggested as an alternative way for canonical bioenergetics and signaling under hypoxia and starvation conditions for tumor cells. Phang et al. firstly presented redox cycle that couples the pentose phosphates path (PPP) and cycling of Pro and pyrolline-5–carboxylate (P5C) which generates ATP and NADP+ in rat kidney mitochondrion, termed the proline shuttle (PS) [15]. Lately, Hagedorn and Phang published direct evidence of PS existence in a cell-free experimental system and described the mechanism of its function [16]. Further investigations of Pro and HPro metabolism shed light on its antioxidant [17], signaling [18,19,20,21], and bioenergetics [22,23] roles in the cellular homeostasis under stress condition.
The present study uncovers the essentials of Gln homeostasis in primary cells that were isolated from the Spalax ehrenbergi complex (spalacidae) (hereafter, Spalax). Spalax is an underground mammal which harbors unique features such as constitutively higher levels of HIF-1α [24], hypoxia tolerance (3% under laboratory conditions, and down to ~7% oxygen recorded in natural habitat [25]), extreme longevity (up to 20 years) [26]; oxidative stress [27]; and cancer resistance [28]. Typically, most of the metabolome explorations were carried on immortal cultured cell lines or tissues that were harvested from laboratory animals. Nevertheless, a few works have characterized the metabolome of wild animals [29,30,31], however, to our best knowledge, there are no studies specifically addressing Gln metabolism. In the present study we aimed to address Gln homeostasis in primary skin cells that were harvested from Spalax that were captured in the wild, in comparison with primary skin cells that were taken from a laboratory rat (Rattus norvegicus) under regular oxygen content (~20% O2, normoxia) and under hypoxia (1% O2). A stable isotope labelling approach was chosen to achieve this purpose [32]. Typically, 13C5 Gln is a tracer of choice for the evaluation of the total contribution of Gln in the TCA cycle and lipogenesis, de novo Pro biosynthesis, and reductive carboxylation (RC) [33,34,35,36]. Cells that were cultured with medium that was enriched with stable-isotope-labeled Gln consume and metabolize it allowing heavy Gln-derived carbons to be integrated into metabolic reactions and appear as heavy metabolites. These metabolites will be designated in the study as the metabolite’s name followed by ‘M+n’ (M is the molecular mass; n is the number of heavy carbons 13C incorporated in the metabolite).
2. Results
The distributions of heavy Gln carbons through metabolic landscape after one day of the experiment demonstrates a complete 13C enrichment picture. The overall mass isotopologues distribution (MID) for major metabolites of Gln are presented in Supplementary Figure S1. Gln M+5 is a dominant mass isotopologue (MI) in the culture medium (Figure 1a) (~95% of the total pool of Gln is found in the medium), therefore the rest of its MI’s can be neglected. Further, the Gln homeostasis will be described as transformations of consumed heavy Gln M+5 carbons through three sections: glutamate (Glu) and αKG metabolic domains, and reductive Gln metabolism.
Spalax cells consumed less Gln than the rat, but metabolized it faster into Glu and further to αKG, glutathione, ornithine, and proteins.
The consumption of Gln M+5 from the medium by the normoxic rat cells was significantly higher than the Spalax (Figure 1b). The consumed Gln M+5 is deaminated by glutaminase (GLS) into Glu M+5 (Figure 1c,d) [37]. The Gln deamination rate was higher in the resting Spalax cells compared to the rat (Figure 2e). Interestingly, the GLS activity was significantly higher in Spalax cells, while elevated levels of intracellular Glu M+5 were observed in the rat. The Glu domain, besides Glu incorporation into protein, includes the usage of Glu for de-novo Pro, ornithine (Orn), reduced glutathione (GSH) biosynthesis, and its conversion to αKG [38]. Thus, in normoxic Spalax cells, Glu M+5 flux markedly bifurcates between de novo biosynthesis of Pro M+5, Orn M+5, GSH M+5, and its oxidation to αKG M+5. The newly produced Glu M+5 is distributed between αKG M+5, Orn M+5, GSH M+5, and is detected as intra/extracellular HPro M+5. (Figure 1d,e,j,k and Figure 2a,b, Figure S1k,l,o,p).
The character of Glu M+5 distribution changed under low oxygen conditions in the Spalax cells. The significantly decreased levels of αKG M+5 (Figure 1e) and the diminished glutamate dehydrogenase (GLDH) rate (Figure 2f) suggest a rerouting of the Gln-derived carbons flux from αKG to other destinations inside the Glu-domain, such as GSH and protein production (Figure 1j and Figure 2a,k). The increased heavy HPro M+5 and the elevation of non-labeled HPro M+0 in the medium hypoxic Spalax cells (Figure 1l and Figure S1p) suggest a turnover of one or more Pro-rich proteins that were also harboring HPro.
Characteristics of αKG Metabolic Domain
The αKG domain is a metabolic hub for Gln-derived carbons. αKG was subjected to oxidative metabolism entering the TCA cycle (measured as levels of Succ M+4) (Figure 1f), or reductive carboxylation (displayed as levels of Citr M+5), as well as directly converted to 2HG (observed as 2HG M+5) (Figure 1i).
GLDH mediates the conversion Glu to αKG [39]. The rate of GLDH under normoxic conditions in the Spalax cells was significantly higher than the values that were calculated for the rat cells (Figure 2f). The metabolic transformations of αKG in the normoxic rat cells seemed to be much more active compared to Spalax. Newly produced αKG M+5 in rat cells more dynamically entered the TCA cycle as Succ M+4 (Figure 1f–h) as compared to Spalax, metabolized to 2HG M+5, or alternatively subjected to reductive metabolism (detected as Citr M+5) (Figure 1f–i and Figure 2j). The RC-originated Citr M+5, after its shuttling to the cytosol, cleaves with ATP citrate lyase (ACLY) into M+3 and M+2 fragments. The M+3 fraction actively metabolizes in the Spalax cells compared to the rat cells; it is processed via phosphoenolpyruvate carboxykinase (PEPCK) losing one carbon, enters the glycolysis as phosphoenolpyruvate (PEP M+2), and sinks as Ala M+2, or is processed with PDH and appears as intro/extracellular HPro M+1 (Figure S2(Aa) and Figure 2c,d). In contrast, in the normoxic rat cells, an upstream GNG flux of M+3-originated Gln carbons was indicated (Figure S2(Ac,d)). The only active path in the Spalax cells compared to the rat cells was the shuttling of Gln-originated carbons between the mitochondria and the cytosol. We observed an ME-driven process of conversion of mitochondrial Mal M+4 (Figure 1g) to cytoplasmic Pyr M+3 (Figure S2(Ab)) and further returned them with PC assistance as mitochondrial Citr M+3 (Figure 2k). The ME reaction requires NADP, therefore the shuttling aims to maintain an appropriate NADPH pool in the Spalax cells. Both other possible directions of metabolic utilization of αKG (RC, normal anaplerosis, and its direct conversion to 2HG) were depressed in the normoxic Spalax cells. The frame of αKG metabolic domain in the Spalax cells under hypoxia was similar to normoxia: RC and TCA cycle transformations were depressed compared to those in the rat cells. The levels of Citr M+5 measuring the reductive Gln metabolism in hypoxic Spalax cells were significantly less than the values that were observed under normoxia (Figure 2j). Interestingly, the transformation of αKG M+5 to Citr M+4 increased in both the hypoxic Spalax and rat cells compared to normoxia (Figure 1e,h). In contrast, the upregulated TCA cycle transformation of Citr M+4 to Mal M+4 was detected in the rat cells only (Figure 1g). The newly produced Citr M+4 in the Spalax cells was probably shuttled to the cytosol with the citrate shuttle instead of processing in the TCA cycle reactions. On the other hand, the direct conversion rate of αKG M+5 to 2HG M+5 in the Spalax cells was strongly elevated compared to both species’ normoxic values and the hypoxic rat cells (Figure 1i and Figure S1i). Hypoxia rerouted the cytosolic fluxes of RC-derived Gln carbons in the Spalax cells. The lipogenesis (detected as M+2 C16:0) (Figure 2l) and GNG (appeared as intracellular M+2 MI’s of GAP, DHAP) (Figure S2(Ac,d)) were increased compared to normoxia. The transport of RC-originated M+3 MI via PC to the mitochondria was significantly diminished (measured as Citr M+3 levels) (Figure 2k). The PDH metabolism of cytosolic Gln-derived Pyr M+2 (measured as Citr M+1), and further, the flux to intra/extracellular HPro+1 was upregulated in the hypoxic Spalax cells (Figure 2c,d). Notably, regardless of the pathway of their metabolic transformation, Gln-originated carbons appeared as MI’s of 2HG (M+1; +2; +3; +4) exclusively in the hypoxic Spalax cells (Figure 3 and Figure S1i).
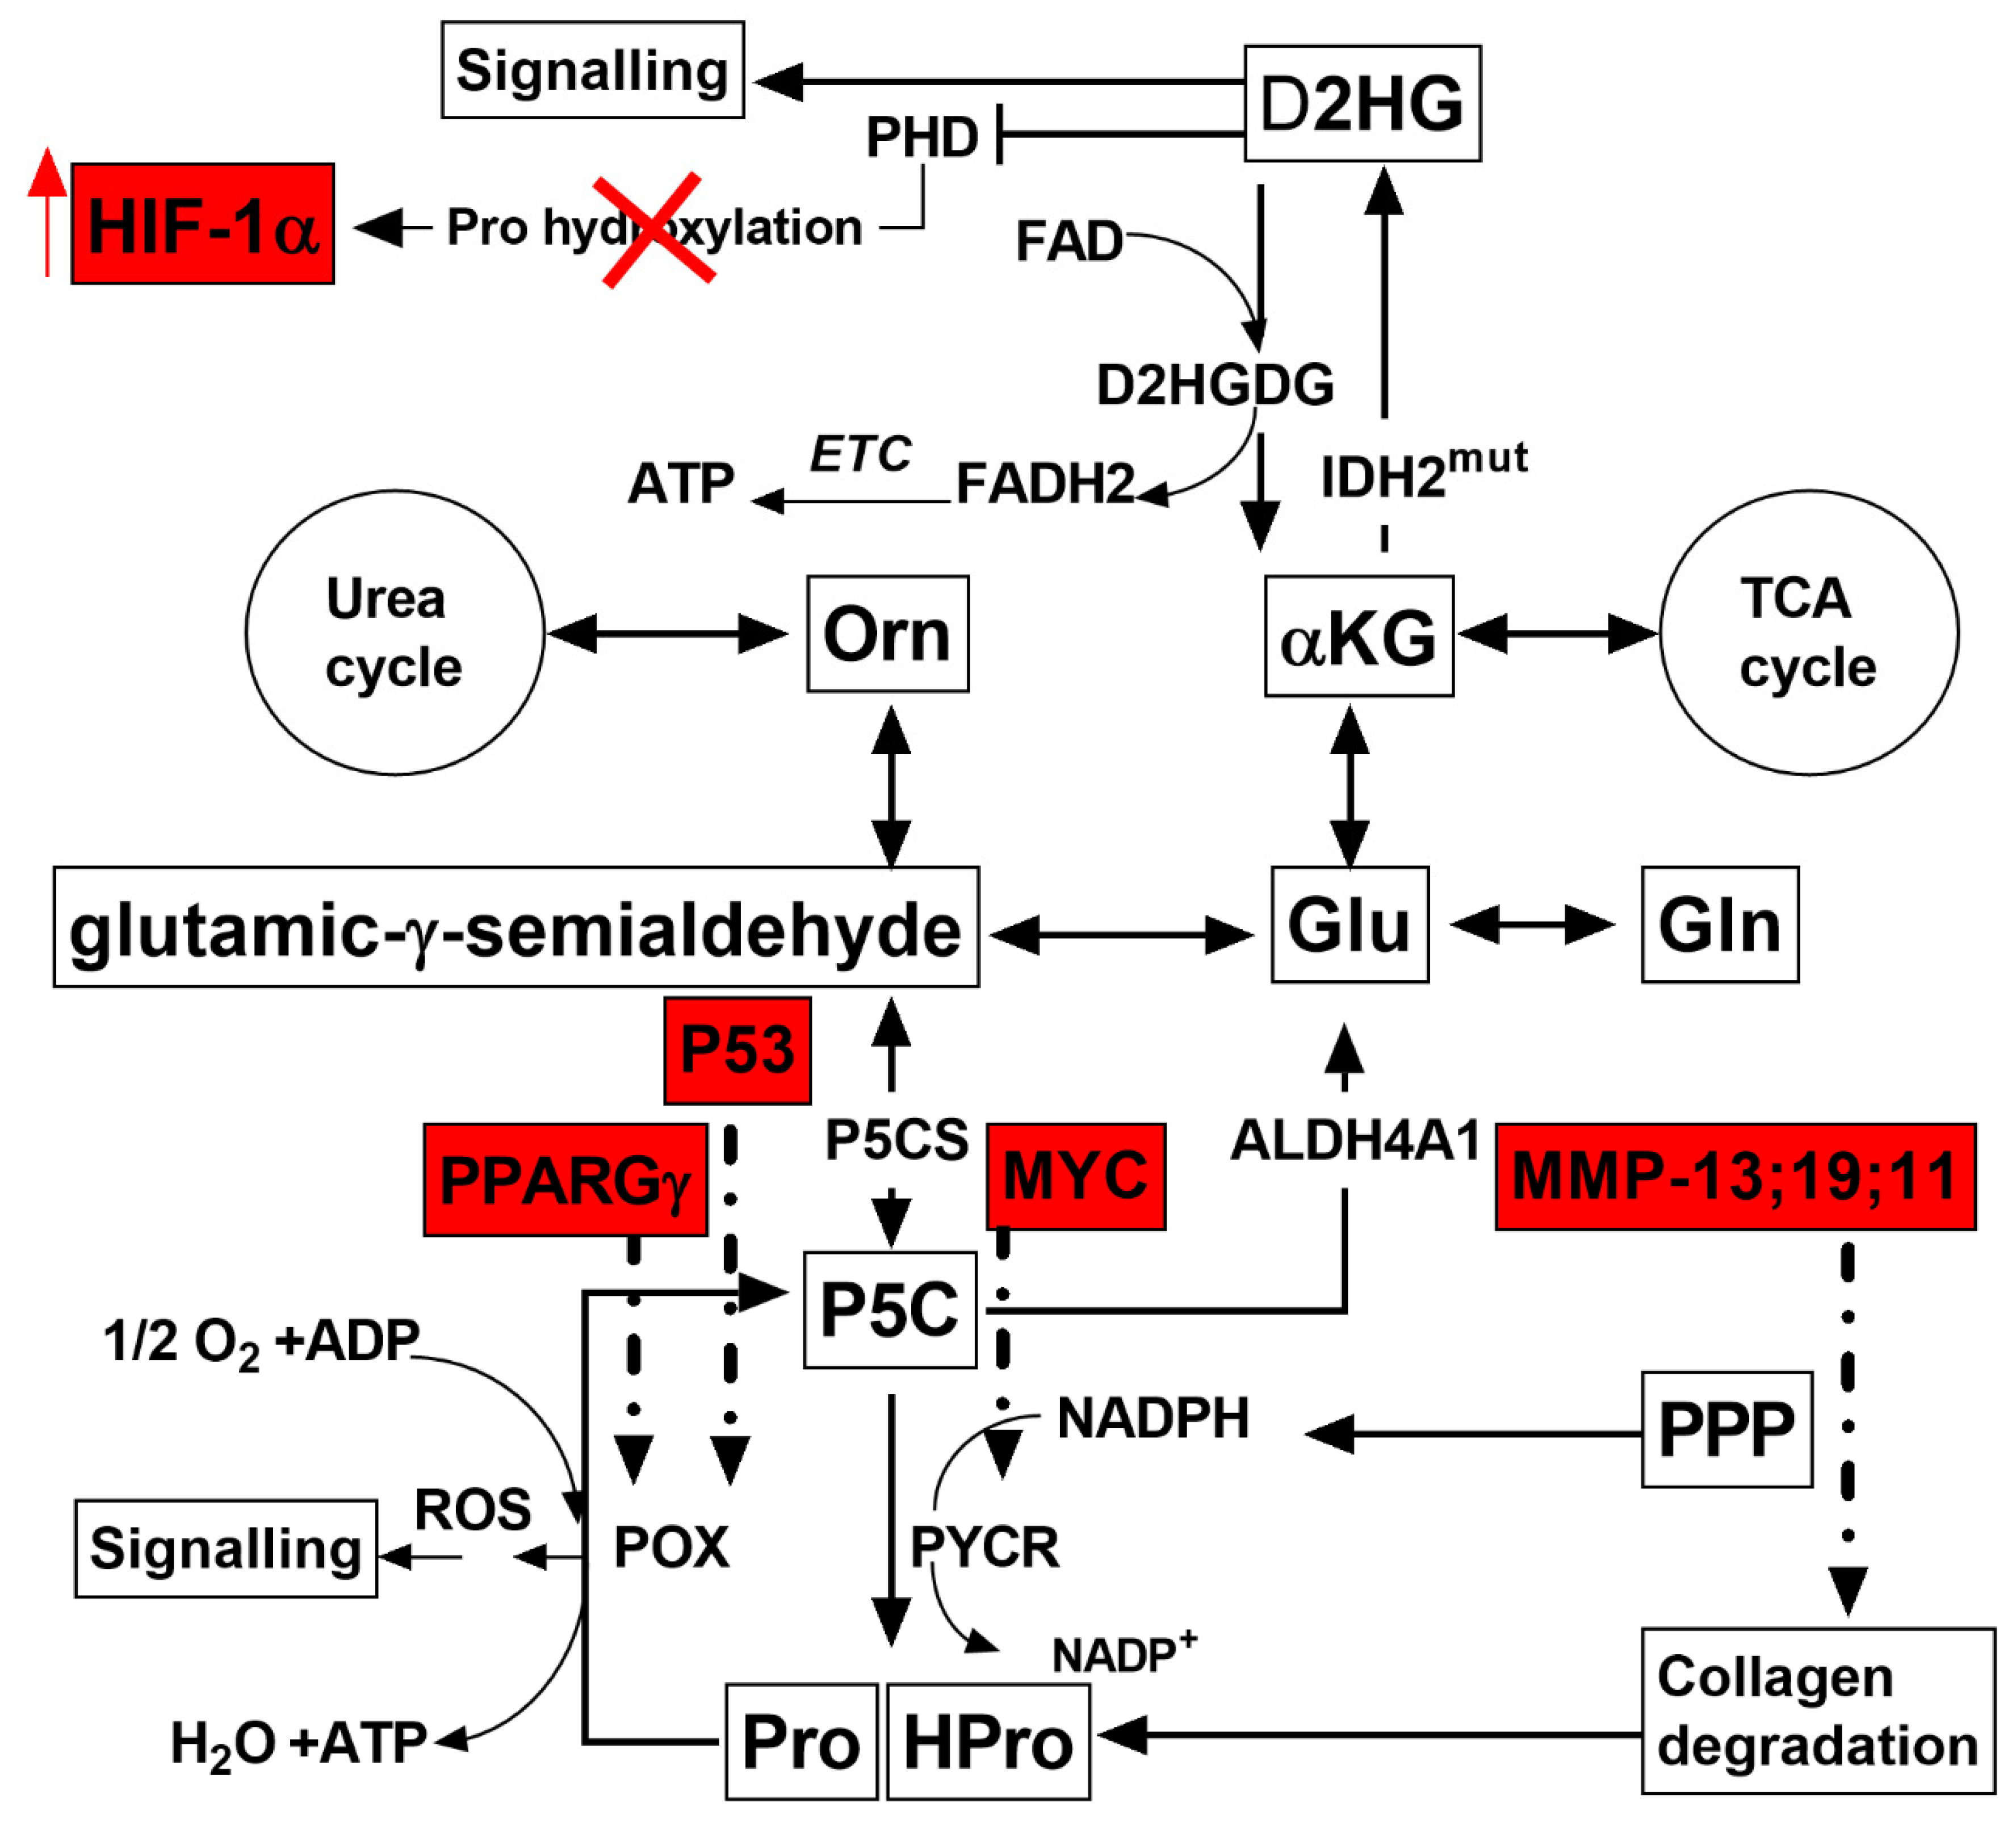
An upregulated expression P53, PPARɣ, and POX genes was observed in the Spalax under both normoxia and hypoxia, (Figures S2h,f and S5 and Figure 4). PYCR is another enzyme that plays a role in the proline shuttle which demonstrated an increased gene expression in the liver (Figure S2e). Notably, the POX expression was higher in the Spalax fibroblasts, while ALDH18 expression was remarkably higher in the Spalax liver (Figure S5). Overexpression of MMP-13, MMP-19, and MMP-11, involved in the breakdown of extracellular matrix (e.g., collagenolysis) was also marked in the present study (Figure S2j–l and Figure 4).
3. Discussion
Glutamine (Gln) is the most prevalent free amino acid in mammalian tissues, blood, and cells. It participates in both anabolic and catabolic processes. Along with glucose Gln is an abundant source of reduced carbon for oxidative metabolism [40]. Most of the Gln is consumed in the glutaminolysis pathway of Gln oxidation to pyruvate, which is involved in energy production and maintenance of the NADPH pool via ME [41]. The final product of glutaminolysis, pyruvate, is a fuel molecule that enters the TCA cycle through PC or as Ac-CoA that is transported into the mitochondria via PDH. This canonical way of utilizing the Gln carbon is a component of central carbon metabolism that is optimal for ATP production. Nevertheless, it is tightly balanced with glycolysis and is controlled via genetic, post-translation modifications, and allosteric mechanisms [42]. The machinery of central carbon metabolism is a fine-tuned system that integrates Glc and Gln carbon fluxes, and ultimately requires an appropriate level of oxygen to allow for oxidative phosphorylation (OXPHOS). It was hypothesized in the present study that in response to low oxygen environment exposure throughout its lifetime [25], Spalax evolved an alternative metabolism of Gln that is less dependent on oxygen availability. The metabolic landscape of Spalax cells is compared to that of rat cells as an example of canonical central carbon metabolism.
The framework of glutaminolysis in the Spalax cells looks different when compared to rat cells. Both of the cells increased their Gln consumption during the experiment; however, the Spalax cells consumed less Gln. Along with Gln consumption, the Spalax cells had an elevated deamination rate, thereby introducing Gln carbons to their metabolism faster. Interestingly, a significant fraction of the consumed heavy Gln-derived carbon in normoxic Spalax cells was distributed between the metabolites of the Glu domain. The incorporation of Glu M+5 into the structure of GSH (GSH M+5), as well as its direct conversion to Pro M+5 (measured as its hydroxylated form-HPro M+5) and Orn M+5, dominated specifically in the Spalax cells (Figure 1j,k, Figure 2a,b and Figure S3A). These pronounced fluxes suggest that the metabolic domains are extremely important for the maintenance of Spalax metabolic pattern. The elimination of reactive oxygen species (ROS) is vital for cells that are under hypoxic conditions. Hypoxia and especially sharp periodic changes from hypoxia to oxygenation, which are likely to occur in the Spalax underground environment, are well described as inducers of ROS production [43,44]. GSH is well known as an abundant intracellular antioxidant [45]. GSH, as a cofactor of GSH-peroxidase, participates in a non-specific reduction of hydroperoxides resulting in the formation of its oxidized form (GSSG). Thus, GSSG levels indirectly indicate the intensity of the intracellular free radical processes and reflects the balance between the reduced and oxidized forms of glutathione. The glutathione pool in the Spalax cells was significantly more reduced than in the rat cells (Figure S3(Ag)) and has the appropriate potential to cope with oxidative stress. It seems, therefore, that Spalax cells maintain a massive intracellular GSH pool to prevent oxidative damage.
The specific rewiring of Glu metabolism to Pro biosynthesis was reported after the reprogramming of human dermal fibroblasts into hepatocyte-like cells [46]. The formation of 1-pyrolline-5-carboxylic acid (P5C) is the hub of the path from Glu to Pro. At the P5C point, Glu-originated carbon has two directions for metabolism: processing via ornithine aminotransferase (OAT) to Orn, or via proline oxidase (POX) to Pro [47]. The elevated de novo production of Orn M+5 that was observed in the Spalax cells (Figure 2b) suggests a link to polyamine metabolism. We did not measure the level of polyamines in the current study. However, the levels of the expression of ornithine decarboxylase (ODC), a key enzyme of polyamine metabolism [48], and antizyme inhibitor (AZIN1), a positive regulator of polyamine levels [49], were evaluated in the previously published Spalax and rat liver transcriptome data [50] (Figure S2(Bc,f)). A strong upregulation of conversion of Glu M+5 to HPro M+5 was observed in the Spalax cells after 24 h (Figure 1j,k). De novo synthesized Pro M+5 was apparently incorporated into Pro-rich protein/s, and was detected as HPro M+5, a product of protein degradation. Collagen is suggested as a primary candidate for such protein [51]. Notably, collagens, which are the most abundant proteins in animals, are well described as the primary source of proline and, particularly, hydroxyproline [52] (and therein cited literature). Other proteins, such as elastin and HIF-1α, may also be involved. Although elastin contains a high percentage of proline (but not HPro), it is known as a durable protein with a unique stable structure that doesn’t undergo significant turnover in healthy tissues where it can last for tens of years [53]. HIF-1α contains hydroxylated proline residues and has a faster turnover; however, as a transcription factor that exists in relatively small amounts, it is unlikely to be a major source of Pro/HProline for proline shuttle.
Gln-derived carbons enter the TCA cycle after conversion of Glu to αKG by glutamate dehydrogenase (GLDH). The GLDH conversion rate in normoxic Spalax cells during the study was similar to that of glutaminase (GLS); the more Glu that was subjected to deamination, the more it was converted to αKG (Figure 2e,f). However, the TCA cycle downstream processing of αKG to Succ decreased in the normoxic Spalax cells due to the diminished SDH rate (Figure 2g). Interestingly, in the Spalax cells, the flux of Gln-derived carbon after entering the TCA cycle bifurcates at Mal M+4 point (Figure 1g) where one path follows cycle’s reactions to αKG M+4 (Figure 1e), converts to Glu M+4 and appears in the GSH structure as GSH M+4 (Figure S3(Ad)), while the other path metabolizes via ME where glutamine carbons appear as cytosolic Pyr M+3 (Figure S2(Ab)). Apparently, this Pyr M+3 returns via PC to the mitochondria and appears as Citr M+3 (Figure 2k) and following metabolic transformations it is secreted outside the cell as Glu M+3 (Figure S3(Bc)). Likely, after one turn of the TCA cycle circulation, Gln carbons undergo cataplerotic efflux as Glu M+3 from the Spalax cells under normoxia.
Glutaminolysis is an oxygen-dependent pathway which is not favored in low oxygen conditions. In hypoxic conditions some cells, such as glioblastoma [54], MRC5 cells [55], HBEC30 and HCC4017 [56] switch to reductive Gln metabolism (RC), while some cells use RC routinely in non-hypoxic conditions [57,58,59,60]. In RC, Gln-derived carbon flux forwarded from αKG directly reduces to citrate instead of being oxidized to succinate. RC machinery under hypoxia is characterized by activity of NADP+-dependent IDH1 and is regulated by HIF-1α-dependent mechanism that diverts Gln carbon to FA biosynthesis [55]. The metabolic mastering by HIF-1α includes uncoupling of the glycolysis and the TCA cycle [61], thus RC is a compromise to maintain Gln catabolism under hypoxia. The appearance of Citr M+5 as a result of direct reduction of αKG M+5 by IDH1 (Figure 1e and Figure 2j,h) and specific lipogenesis, i.e., heavy C:16 M+2 (Figure 2l), a consequence of Citr M+5 cleavage, are the signs of RC. RC was observed in cells of both animal species under normoxia. Surprisingly, RC was pronounced in the rat cells as compared to Spalax.
Uniquely for the Spalax cells, the OAA M+3 that appears after the breakdown of cytosolic RC-derived Citr M+5 enters the central glycolysis as PEP M+2, returns to the TCA cycle, diverts along with the axis αKG M+1→Glu M+1→Pro M+1 and is finally detected as intra/extracellular HPro M+1 (Figure 2c,d). This supports the hypothesis that collagen biosynthesis is a prioritized pathway of Gln-derived carbon metabolism in Spalax skin cells.
These data suggest that normoxic Spalax cells metabolize, most of Gln-derived carbons in the Glu-domain. Gln carcass is mainly used for GSH production or is diverted to Orn/Pro biosynthesis. De-novo produced Pro forwards to massive synthesis of HPro-rich proteins. Gln carbon skeleton enters the TCA cycle as αKG incorporates into GSH after one cycle or being subjected to ME shuttling and effluxes as Glu. Both cells employ reductive Gln metabolism under normoxia. However, normoxic Spalax cells use reductive Gln metabolism to a lesser extent than rat cells and divert returned after RC carbons for protein synthesis.
The lowering of oxygen concentrations is accurately sensed by HIF-1. HIF-1 induces specific metabolic reprogramming that facilitates adaptation and survival of cells under hypoxia. HIF-1 is described as heterodimer consisting of two subunits HIF-1α and HIF-1β [62]. The regulatory activity of HIF-1 proteins is determined by stability of its α-subunit. Under normoxic conditions, HIF-1α is constitutively degraded; whereas under low oxygen it stabilizes and translocates into the nucleus where it orchestrates the gene expression [63]. The proteasome degradation of HIF-1α is initiated by αKG–dependent prolyl hydroxylase (PHD) via hydroxylation of its Pro residues [64]. The hypoxic metabolic landscape is characterized by decreased levels of total αKG (sum of areas of all αKG MI’s) in both cells compared to normoxic values, while in Spalax cells, it remains significantly less than in the rat (Figure S2(Bb)). Thus, the observed αKG shortage can negatively influence on PHD activity in Spalax cells. A significant portion of newly consumed Gln M+5 in hypoxic Spalax cells after its deamination is directly converted to 2HG by D2HGDH (Figure 1i), similar to the process reported by Struys, E. A et al. for cultured lymphoblasts [65]. This is confirmed by the upregulated rate of IDH 1/2 and increased levels of 2HG M+5 in hypoxic Spalax cells as compared to the rat (Figure 1i and Figure 2h). Remarkably, nearly all cytosolic and mitochondrial pathways of Gln metabolism re-divert to 2HG production under hypoxic conditions in Spalax cells (Figure 3). The 2HG is a structural analog of αKG which may inhibit αKG-dependent PHD and prevents HIF-1α degradation; therefore, it stimulates its accumulation [66]. Both decreased level of the essential participant of PHD reaction αKG and upregulated production of PHD inhibitor 2HG eventually lead to the stabilization of HIF-1α and its steep increase in Spalax cells compared to rat cells. These suggestions agree with the previously observed higher levels of HIF-1α and its target (Epo) in Spalax kidney in vivo compared to rat under hypoxia [24]. This proposes the importance of HIF-1α constitutive expression for Spalax metabolism. Thus, rewiring of Gln flux in hypoxic Spalax cells can be involved in the development of hypoxic HIF-1α-mastered phenotype as an additional factor of HIF-1α reciprocal stabilization.
αKG and 2HG form a redox couple that may have some bioenergetics implications and could play a role in the development of specific epigenetic landscape in Spalax cells under hypoxia. 2HG is oxidized to αKG by mitochondrial D-2-hydroxyglutarate dehydrogenase (D-2HGDH) [67]. 2HG oxidation uses specific machinery involving FAD and an electron acceptor that was identified later by Struys et al. as a membrane-associated flavoprotein ubiquinone oxidoreductase (ETFQO) [68] that transfers electrons to ETC [69,70]. Transcriptome data showing that liver expression of both 2HGDH and ETFQO is much higher in Spalax as compared to the rat (Figure S2(Bm,n)) support the idea proposed here about the energetic outcome of the redox pair αKG and 2HG.
Another implication of the raised 2HG production that merits further investigation is the specific epigenetic landscape in Spalax cells. The inhibition of αKG-dependent oxidases causes alterations in hydroxylation, demethylation, halogenation, desaturation, epoxidation, ring forming reactions, etc. [71]. This may lead to specific changes in the epigenetic modifications; nevertheless, this subject requires further investigations.
Cells of both animal species reduce the rate of αKG entry into the TCA cycle under hypoxia, but the conversion of αKG M+4 to Succ M+4 as well as glutaminolysis are significantly more reduced in Spalax cells compared to the rat cells (Figure 1e,f and Figure 2e,g). Probably, the deficit of pyruvate-derived Acetyl-CoA, which is a consequence of HIF-1α-mediated inhibition of PDH [61], is the reason for the decreased carbon flux via the TCA cycle reactions that was observed in our study. Surprisingly, the RC is not activated in Spalax cells under hypoxia but actively engages in rat cells (Figure 1d).
Interestingly, hypoxic Spalax cells use a similar metabolic framework which was observed under normoxia, namely, significantly upregulated cataplerosis of consumed Gln carbon skeleton for protein biosynthesis. The heavy Gln carbon fluxes, regardless of the followed metabolic path (mitochondrial or cytosolic), return to the mitochondria where Gln carbon skeleton is used for synthesis of Pro and is likely incorporated into collagen in which Pro/HPro (Figure 1j–l, Figure 2c,d and Figure S1k,l) accounts for about 30% of amino acid residues [72,73]. The specific role of collagen as a stress substrate is reported by Phang et al. [74]. Authors figuratively defined collagen as a “sink for reducing potential that can be easily and reversibly removed from the metabolic pool” [74]. The massive carbon flux (seemingly into collagen production) observed in Spalax cells in both normoxic and hypoxic conditions suggests that collagen may play an essential role in Spalax metabolism. Collagen is considered as a ‘depot’ for Pro and HPro and some other amino acids similar to glycogen for glucose and adipose tissue for fatty acids. The particular importance of collagen is its role as a reservoir for two amino acids Pro and HPro, both of which are involved in the regulation of intracellular redox balance. The discovery of the specific redox role of POX in the degradation of Pro [75] and HPro [76] suggests that these metabolites have a special role as metabolic regulators [77] and as bioenergetic substrates alternative to glucose [16,78,79] in Spalax cell metabolism. High HPro levels in Spalax cells in normoxia is clearly shown by the present results, and their further upregulation under hypoxia suggests the involvement of these metabolites in cell bioenergetics as it was described by Phang et al. [80] who proposed ‘Proline shuttle’ as an original mechanism of redox shuttling of Pro and HPro which provides several bioenergetic advantages to cells.
The final step of Pro biosynthesis is cytosolic reduction of ∆1pirolline-5-carboxylate (P5C) by P5C reductase (PYCR) using NADPH as electron donor. This reaction is reversed by mitochondrial POX, which uses FAD as a prosthetic group and directly reduces Cytochrome-C in the ETC. Thus, the cycling of Pro in the proline shuttle allows transport of cytosolic reducing equivalents from NADPH into mitochondria with certain energetic outcome (~1.5 ATP per one FADH molecule) [16,81]. FAD, being part of POX, reduces oxygen to superoxide when exposed to dissolved intracellular oxygen instead of passing electrons to the ETC. Thus, the proline shuttle function is also responsible for ROS generation involved in the regulation of oxidative defense, apoptosis [82], senescence [18] and hypoxic response [83]. The switch between ROS production and passing electrons to the ETC in the POX takes place via moving the flexible a-helix domain of the enzyme to permit access to dissolved oxygen (ROS mode) or to block it (ETC mode) [74].
Interestingly, the proline shuttle (Figure 4) is not regulated by HIF-1α, as reported by Phang et al. POX, induced by the p53 gene [74], belongs to the family of 14 genes that are more than seven-fold expressed in response to the induction of P53 and designated as “PIGs” by Polyak et al. [84]. Another POX inducer is peroxisome proliferator-activated receptor Gamma (PPARɣ) [74]. Upregulated expression of both genes-P53; PPARɣ as well as POX was observed in Spalax compared to rat in both normoxia and hypoxia [50], (Figure 4, Figures S2h,f and S5). Other enzymes, participants of the Proline shuttle, PYCR and P5C synthase (P5Cs), are regulated by expression of oncogene MYC that controls conversion of Glu to Pro and its induction positively correlates to PYCR1 and P5Cs activity [83]. The marked overexpression of MYC in liver transcriptome [50] of Spalax compared to rat is in good agreement with the increased expression of PYCR1 in the liver (Figure S2e). Also, the expression of proline-metabolizing enzymes in skin fibroblasts and liver tissues of Spalax and rat under normoxia and hypoxia was evaluated using q-PCR approach. Interestingly, in tested skin fibroblasts the POX expression is significantly higher in Spalax, while the liver specifically upregulated ALDH18 expression, the enzyme converting Glu to P5C, and POX/PYCR maintaining redox coupling between Pro/HPro and P5C (Figure S5).
Pro circulation in the proline shuttle can be easily terminated, and carbon skeleton may get further metabolized as Glu or Pro. De novo produced Pro can be secreted from the cell and reabsorbed back when necessary [85], or used intracellularly. Collagen is an essential source of Pro. Collagen from extracellular matrix (ECM) is easily degraded by a family of matrix metallopeptidases (MMP) [86]; however, according to experimental data reported by Imberman et al., a greater part of collagen produced de novo by fibroblasts in culture degrades intracellularly before its secretion from the cell and is detected as HPro [51]. Increased levels of HPro detected in our study in both intra- and extracellular space in Spalax compared to rat is clear evidence of facilitated collagen metabolism. The importance of collagen degradation in the Spalax metabolism is supported by overexpression of specific MMP-13, MMP-19 and MMP-11 which are involved in the breakdown of extracellular matrix (collagenolysis) (Figure S2j–l). Increased Pro and HPro production in tumor cell lines in response to hypoxia is regulated by HIF-1α [87]. Similarly, hypoxia-induced upregulation of HPro levels was observed in Spalax cells. Free HPro is not a proteinogenic amino acid [88], and its enzymatic degradation is performed by the same machinery that is used for Pro degradation [89]. Therefore, both free Pro and HPro can be metabolized by the Proline shuttle and considered as an alternative bioenergetic substrate for survival under hypoxic stress.
Two factors have probably influenced the development of the metabolic pattern of Spalax cells, hypoxia and diet. Spalax spends most of its life underground in self-constructed burrows system and accumulates food mainly from the underground sources. Spalax is a strict vegetarian. We have found food storages in Spalax nests that were full mostly of root pieces, bulbs, local flora’s leaves, and stalks during multiple field expeditions. Spalax individuals used for the study were captured from the Lower Galilee. The traditional ancient crop of this land is a chickpea (Cicer arietinum) [90],which roots (visually defined) have found in the food storage of Spalax. With a high degree of probability, the roots of Fabaceae family plants are a major meal for Spalax. The essential feature of Fabacea plant’s roots is their ability to symbiotic nitrogen fixation by rhizobium [91] and high production of nitrogen-rich amino acids such as Gln [92] and Asn [93]. Seemingly, the Gln and Asn-rich ration and lesser/sporadic availability of Glc was a trigger to evolving the specific bioenergetics mode. The thin diet during evolution processes have forced to shape the metabolic systems with a deficient of some specific vital compounds. For example, we observed lower levels of niacine, nicotinamide, pathothenate, folate, riboflavin (Figure S4) in Spalax cells compared to the rat. The deficit of these metabolites may seriously influence on the metabolic machinery in general and pyruvate dehydrogenase complex in particular, and therefore influences/interrupts/changes its machinery. The combination of thin diet and permanent low oxygen conditions may influence pyruvate dehydrogenase complex (PDC) and limit its functions as a metabolic hub of central carbon fluxes in Spalax cells. Therefore, due to specific environmental conditions evolutionary processes may have compromised the role of PDC in Spalax evidenced in our study. Another aspect that probably had influenced the evolution of Spalax cells’ metabolic model is periods of starvation. The tunneling activity of Spalax is limited to the rainy period when the soil is wet and can be easily excavated. This period (about 4–5 months) is the only time for building new galleries, mating, annual food harvesting and storage. Drought, common in Middle East, possesses starvation challenge for this mammalian group. Glycogen and fat are emergency tools for fixing glucose starvation for most mammals. Seemingly, when Glc is less accessible than glutamine, the accumulation of Glc carbons as glycogen or converting them to fat is less advantageous than the storage of Gln-derived carbons as extracellular collagen suggested in the present study.
4. Materials and Methods
4.1. General Experimental Design
The work was performed on cultured primary fibroblasts and on tissues harvested from Spalax and rats. For metabolic studies, cells were treated by hypoxia (1% O2) and compared to normoxic cells. For gene expression analyses, total RNA was extracted from hypoxic and normoxic animal tissues (6%, or 21% O2, respectively) RNA was subjected to cDNA synthesis and quantitative real-time PCR.
4.2. Animals
Three newborn blind-mole rats captured during several field expeditions (in 2018, 2019 around Carmel mt. area) and three newborn laboratory rats (Rattus norvegicus) were used. The animals were anaesthetized with isoflurane overdose and subjected to the primary cells’ isolation protocol described below. Animals experiments were approved by the Institutional Ethics Committee (Reference #316/14, 420/16 and 671/19).
4.3. Cell Culture
Primary skin cells were isolated from the animals’ underarm skin region according to previously described method [28]. The primary cells were cultured in DMEM-F12 medium supplemented with 5% fetal bovine serum (FBS) under ambient humidified atmosphere (5% of CO2 and 95% of air) at 37 °C On their 2nd passage cells were plated into six-well plates (5 × 10⁵ cells/well) for the targeted metabolomics experiment (for six technical replicates) or into 100 mm culture dishes (1 × 10⁶ cells/dish) for the quantitative PCR assay.
4.4. Metabolomic Analysis
The culture medium was removed and replaced for the next 12 h with serum-free (SFM) Dubellco’s Modified Eagle Medium-F12, glucose- and Gln-free (Gibco) supplemented with bovine serum albumin/insulin/transferrin; 2.5 mg/L of ascorbic acid phosphate; 1 mg/L of glutathione; 0.0003 mg/L of ammonium metavanadate; 0.25 nM of manganous chloride; 0.1 mM of acetate; 5 mMg of glucose; 0.6 mM of Gln.
Two hrs. prior to the beginning of the experiment, freshly-prepared medium with labeled 13C5 glutamine [Glutamine (U-13C5, 99%)-Cambridge Isotope Laboratories, USA, CLM-1822-H-0.25] (the same composition to SFM a with the non-labelled glutamine replaced by 0.6 mM of 13C5 glutamine), as well as PBS for control were placed under 1% of O2 atmosphere for deoxygenation. The cells were transferred to the hypoxic chamber, the medium removed, and after PBS washing, it was replaced with deoxygenated medium containing 13C5 glutamine. Similar manipulations were performed for the normoxic conditions in a regular CO2 incubator (~20% O2). The cells were supplied with labelled 13C5 glutamine, exposed for 24 hrs. under normoxic (20% of O2, normoxia), and hypoxic (1% of O2, hypoxia) in the hypoxic chamber (HypOxystation® H35, HypOxygen, Frederick, MD, USA) conditions. After incubation, culture medium was collected, cells were washed twice with ice-cold PBS and intracellular metabolites were extracted using methanol/acetonitrile/water solution (5:3:2) on the rocker shaker (10 min at 4 °C). The extracts and medium samples were centrifuged (16,000× g 10 min, 4 °C), the supernatants (medium samples after 1:50 dilution with mobile phase) were transferred to −80 °C and stored until subjected to LC-MS analysis as described in [94].
4.5. qPCR Assay
RNA was isolated from rat and Spalax skin fibroblasts passages 2–3 cultivated under normal or hypoxic conditions (1% oxygen, 24 h) using standard TRI-reagent protocol. RNA concentration and extraction quality were assessed by Epoch microplate spectrophotometer (BioTek, Winooski, VT, USA). For cDNA synthesis iScript cDNA synthesis kit (Bio Rad, Hercules, CA, USA) was used. 1 mg of total RNA was used for 20 µL cDNA.
Primers for RT qPCR were designed in Primer Express 3.0.1 software (Applied Biosystems, Waltham, MA, USA). Separate pairs of primers were designed for Spalax and rat RNA.
RT qPCR reactions were performed by using Fast SYBR Green master mix protocol (Applied Biosystems, USA).1 µL of the cDNA was used for each well (diluted to 5 µL with dH2O to ensure accurate pipetting). Serial dilutions of cDNA were used for calibration curve building for the quantification of Spalax and rat ALDH4, ALDH18, PYCR and PRODH genes. The reactions were performed in StepOnePlus Real-Time PCR System (Applied Biosystems) and the data was obtained and analyzed by StepOne software v2.3 (Applied Biosystems). The subsequent statistical analysis and graph plotting was made in Microsoft Excel software pack.
4.6. Statistical Analysis
Raw data were normalized and p values were calculated with GraphPad Prizm 8 software using unpaired Student’s t-test (p < 0.05 was considered to be statistically significant as specified in the figures legend).
5. Conclusions
The metabolic patterns of most terrestrial mammals, which evolved to function in the regular oxygen atmosphere (~20% O2), are characterized by tight and obligatory coupling of Glc and Gln carbon fluxes in the TCA cycle. This system works excellently when all components are available; however, a temporary shortage of oxygen or one of the two nutrients may cause a failure. Oxygen is the keystone of this system; Glc and Gln starvation can be rescued via gluconeogenesis, glycogenosis, or proteolysis, whereas hypoxia can be tolerated only for short periods. The essential challenge for the function of oxidative carbon metabolism under low oxygen conditions is the obligatory coupling of the anaerobic glycolysis and the mitochondrial OXPHOS. Mild and short hypoxic conditions are effectively resolved by HIF family of transcription factors that reprogram metabolism to adapt to oxygen shortage via upregulation of anaerobic glycolysis, decreasing flux of Glc carbons to the TCA cycle and slowdown OXPHOS. Hypoxic HIF-1α-reprogrammed metabolism causes outcomes such as lactic acidosis, specific ROS productions, increased lipid peroxidation, energy shortage, changing redox state, etc., and may lead to apoptotic death of the cell. Nearly 60 years ago, Otto Warburg described the metabolic frame, named Warburg effect [95], that helps several cancer cells to tolerate severe and continuous hypoxia by uncoupling the ATP synthesis from ETC and depending on glycolysis as an energy provider [96]. The ideal metabolic machinery that effectively functions under varying oxygen concentrations must be less dependent on HIF-1α regulations and process cytosolic and mitochondrial carbon fluxes independently or semi-independently. Apparently, Spalax’s metabolic adaptation strategy meets these requirements. Gln metabolism in Spalax cells mainly focuses on the Glu domain, where the flux of Gln-originated carbon switches between GSH and protein production instead of being processed by TCA cycle reactions. The major rerouting of Gln flux to protein production, putatively collagen, was observed in normoxic and increased in hypoxic Spalax cells. The enormous forwarding of Glu to protein production in Spalax cell under both normoxia and hypoxia can be considered as storage of reduced Gln carbons and suggests its involvement in bioenergetics and signaling via cycling in Pro shuttle which is HIF-1α-independent. Increased conversion of αKG to 2HG prevents degradation of HIF-1α in hypoxic Spalax cells, and thus maintains cytosolic and mitochondrial carbon fluxes uncoupled via inhibition of PDH and suggests specific bioenergetics model that relies on HIF-1α-independent/less dependent coupling to Glc carbons flux. Strong antioxidant defense in Spalax cells is attributed to massive use of Glu for GSH production.
In summary, hypoxic Spalax cells employ similar to described under normoxia metabolic frame for distribution of Gln-derived carbons. The upregulation of Gln flux to collagen synthesis and 2HG production are essential metabolic signatures of hypoxic Spalax cells that are involved in bioenergetics, antioxidant and epigenetic adaptive strategies to face harsh environmental challenges.
Supplementary Materials
The following are available online at www.mdpi.com/article/10.3390/metabo11110755/s1, Figure S1: Mass isotoplogues distribution of Spalax and rat cells, Figure S2: Selected characteristics of 13C5 tracing in Spalax and rat cells, levels of selected intracellular metabolites, and mRNA expression of selected genes in Spalax liver tissues, Figure S3: Selected mitochondrial fluxes of Gln-originated carbons in Spalax and rat skin cells, Figure S4: The levels of selected non-labelled metabolites, Figure S5: The levels of mRNA expression of some genes of proline shuttle enzymes in Spalax and rat liver tissues and skin fibroblasts.
Author Contributions
Conceptualization, D.M., I.S. and E.G.; methodology, D.M., I.A. and E.G.; software, D.M. and I.A.; validation, A.C. and M.D.; investigation, D.M., M.D., A.C. and I.A.; writing—original draft preparation, D.M. and I.A.; writing—review and editing, D.M., I.S. and E.G.; supervision, I.S.; funding acquisition, I.S. All authors have read and agreed to the published version of the manuscript.
Funding
This work was funded by the Israel Science Foundation (Grant #1935/17 to I.S.), John Templeton Foundation (Grant # 53057 to I.S.), and Kadas Family Charitable Foundation (UK).
Institutional Review Board Statement
Animals experiments were approved by the University of Haifa Institutional Ethics Committee (References #316/14, 420/16 and 671/19).
Informed Consent Statement
Not applicable.
Data Availability Statement
Data is contained within the article and supplementary material.
Acknowledgments
This work is supported by the Israel Science Foundation (Grant # 1935/17 to I.S.), John Templeton Foundation (Grant # 53057 to I.S.), and Kadas Family Charitable Foundation. We thank NIH Scientist Emeritus James M. Phang for his valuable advice and Eyal Gottlieb’s laboratory staff for their support and assistance. Special thank for Hanna Shevalye, Department of Ophthalmology and Visual Sciences, Carver College of Medicine, University of Iowa—for the help in technical manuscript editing.
Conflicts of Interest
The authors declare no conflict of interests.
References
- Roth, E. Nonnutritive effects of glutamine. J. Nutr. 2008, 138, 2025S–2031S. [Google Scholar] [CrossRef]
- Coloff, J.L.; Murphy, J.P.; Braun, C.R.; Harris, I.S.; Shelton, L.M.; Kami, K.; Gygi, S.P.; Selfors, L.M.; Brugge, J.S. Differential Glutamate Metabolism in Proliferating and Quiescent Mammary Epithelial Cells. Cell Metab. 2016, 23, 867–880. [Google Scholar] [CrossRef]
- Curi, R.; Lagranha, C.J.; Doi, S.Q.; Sellitti, D.F.; Procopio, J.; Pithon-Curi, T.C.; Corless, M.; Newsholme, P. Molecular mechanisms of glutamine action. J. Cell. Physiol. 2005, 204, 392–401. [Google Scholar] [CrossRef]
- Cruzat, V.; Macedo Rogero, M.; Noel Keane, K.; Curi, R.; Newsholme, P. Glutamine: Metabolism and Immune Function, Supplementation and Clinical Translation. Nutrients 2018, 10, 1564. [Google Scholar] [CrossRef] [Green Version]
- Yang, C.; Ko, B.; Hensley, C.T.; Jiang, L.; Wasti, A.T.; Kim, J.; Sudderth, J.; Calvaruso, M.A.; Lumata, L.; Mitsche, M.; et al. Glutamine oxidation maintains the TCA cycle and cell survival during impaired mitochondrial pyruvate transport. Mol. Cell 2014, 56, 414–424. [Google Scholar] [CrossRef] [PubMed] [Green Version]
- Stumvoll, M.; Perriello, G.; Meyer, C.; Gerich, J. Role of glutamine in human carbohydrate metabolism in kidney and other tissues. Kidney Int. 1999, 55, 778–792. [Google Scholar] [CrossRef] [PubMed] [Green Version]
- Prabhakar, N.R.; Semenza, G.L. Oxygen Sensing and Homeostasis. Physiology 2015, 30, 340–348. [Google Scholar] [CrossRef] [Green Version]
- Pavlova, N.N.; Thompson, C.B. The Emerging Hallmarks of Cancer Metabolism. Cell Metab. 2016, 23, 27–47. [Google Scholar] [CrossRef] [PubMed] [Green Version]
- Nakazawa, M.S.; Keith, B.; Simon, M.C. Oxygen availability and metabolic adaptations. Nat. Rev. Cancer 2016, 16, 663–673. [Google Scholar] [CrossRef] [PubMed] [Green Version]
- Williams, N.C.; O’Neill, L.A.J. A Role for the Krebs Cycle Intermediate Citrate in Metabolic Reprogramming in Innate Immunity and Inflammation. Front. Immunol. 2018, 9, 141. [Google Scholar] [CrossRef] [Green Version]
- Sun, R.C.; Denko, N.C. Hypoxic regulation of glutamine metabolism through HIF1 and SIAH2 supports lipid synthesis that is necessary for tumor growth. Cell Metab. 2014, 19, 285–292. [Google Scholar] [CrossRef] [PubMed] [Green Version]
- Watford, M. Glutamine metabolism and function in relation to proline synthesis and the safety of glutamine and proline supplementation. J. Nutr. 2008, 138, 2003S–2007S. [Google Scholar] [CrossRef] [Green Version]
- Phang, J.M.; Liu, W.; Hancock, C.; Christian, K.J. The proline regulatory axis and cancer. Front. Oncol. 2012, 2, 60. [Google Scholar] [CrossRef] [PubMed] [Green Version]
- Liu, W.; Glunde, K.; Bhujwalla, Z.M.; Raman, V.; Sharma, A.; Phang, J.M. Proline oxidase promotes tumor cell survival in hypoxic tumor microenvironments. Cancer Res. 2012, 72, 3677–3686. [Google Scholar] [CrossRef] [PubMed] [Green Version]
- Phang, J.M.; Downing, S.J.; Yeh, G.C. Linkage of the HMP pathway to ATP generation by the proline cycle. Biochem. Biophys. Res. Commun. 1980, 93, 462–470. [Google Scholar] [CrossRef]
- Hagedorn, C.H.; Phang, J.M. Transfer of reducing equivalents into mitochondria by the interconversions of proline and delta 1-pyrroline-5-carboxylate. Arch. Biochem. Biophys. 1983, 225, 95–101. [Google Scholar] [CrossRef]
- Krishnan, N.; Dickman, M.B.; Becker, D.F. Proline modulates the intracellular redox environment and protects mammalian cells against oxidative stress. Free Radic Biol. Med. 2008, 44, 671–681. [Google Scholar] [CrossRef] [Green Version]
- Nagano, T.; Nakashima, A.; Onishi, K.; Kawai, K.; Awai, Y.; Kinugasa, M.; Iwasaki, T.; Kikkawa, U.; Kamada, S. Proline dehydrogenase promotes senescence through the generation of reactive oxygen species. J. Cell Sci. 2017, 130, 1413–1420. [Google Scholar] [CrossRef] [Green Version]
- Wadhawan, S.; Gautam, S.; Sharma, A. Involvement of proline oxidase (PutA) in programmed cell death of Xanthomonas. PLoS ONE 2014, 9, e96423. [Google Scholar] [CrossRef] [Green Version]
- Rivera, A.; Maxwell, S.A. The p53-induced gene-6 (proline oxidase) mediates apoptosis through a calcineurin-dependent pathway. J. Biol. Chem. 2005, 280, 29346–29354. [Google Scholar] [CrossRef] [Green Version]
- Goncalves, R.L.; Rothschild, D.E.; Quinlan, C.L.; Scott, G.K.; Benz, C.C.; Brand, M.D. Sources of superoxide/H2O2 during mitochondrial proline oxidation. Redox Biol. 2014, 2, 901–909. [Google Scholar] [CrossRef] [PubMed] [Green Version]
- Scaraffia, P.Y.; Wells, M.A. Proline can be utilized as an energy substrate during flight of Aedes aegypti females. J. Insect Physiol. 2003, 49, 591–601. [Google Scholar] [CrossRef]
- Pandhare, J.; Donald, S.P.; Cooper, S.K.; Phang, J.M. Regulation and function of proline oxidase under nutrient stress. J. Cell Biochem. 2009, 107, 759–768. [Google Scholar] [CrossRef] [PubMed] [Green Version]
- Shams, I.; Avivi, A.; Nevo, E. Hypoxic stress tolerance of the blind subterranean mole rat: Expression of erythropoietin and hypoxia-inducible factor 1 alpha. Proc. Natl. Acad. Sci. USA 2004, 101, 9698–9703. [Google Scholar] [CrossRef] [Green Version]
- Shams, I.; Avivi, A.; Nevo, E. Oxygen and carbon dioxide fluctuations in burrows of subterranean blind mole rats indicate tolerance to hypoxic-hypercapnic stresses. Comp. Biochem. Physiol. A Mol. Integr. Physiol. 2005, 142, 376–382. [Google Scholar] [CrossRef] [PubMed]
- Tacutu, R.; Craig, T.; Budovsky, A.; Wuttke, D.; Lehmann, G.; Taranukha, D.; Costa, J.; Fraifeld, V.E.; de Magalhaes, J.P. Human Ageing Genomic Resources: Integrated databases and tools for the biology and genetics of ageing. Nucleic Acids Res. 2013, 41, D1027–D1033. [Google Scholar] [CrossRef]
- Caballero, B.; Tomas-Zapico, C.; Vega-Naredo, I.; Sierra, V.; Tolivia, D.; Hardeland, R.; Rodriguez-Colunga, M.J.; Joel, A.; Nevo, E.; Avivi, A.; et al. Antioxidant activity in Spalax ehrenbergi: A possible adaptation to underground stress. J. Comp. Physiol. A Neuroethol. Sens. Neural Behav. Physiol. 2006, 192, 753–759. [Google Scholar] [CrossRef]
- Manov, I.; Hirsh, M.; Iancu, T.C.; Malik, A.; Sotnichenko, N.; Band, M.; Avivi, A.; Shams, I. Pronounced cancer resistance in a subterranean rodent, the blind mole-rat, Spalax: In vivo and in vitro evidence. BMC Biol. 2013, 11, 91. [Google Scholar] [CrossRef] [Green Version]
- Viltard, M.; Durand, S.; Perez-Lanzon, M.; Aprahamian, F.; Lefevre, D.; Leroy, C.; Madeo, F.; Kroemer, G.; Friedlander, G. The metabolomic signature of extreme longevity: Naked mole rats versus mice. Aging 2019, 11, 4783–4800. [Google Scholar] [CrossRef]
- Park, T.J.; Reznick, J.; Peterson, B.L.; Blass, G.; Omerbasic, D.; Bennett, N.C.; Kuich, P.; Zasada, C.; Browe, B.M.; Hamann, W.; et al. Fructose-driven glycolysis supports anoxia resistance in the naked mole-rat. Science 2017, 356, 307–311. [Google Scholar] [CrossRef] [Green Version]
- Faulkes, C.G.; Eykyn, T.R.; Aksentijevic, D. Cardiac metabolomic profile of the naked mole-rat-glycogen to the rescue. Biol. Lett. 2019, 15, 20190710. [Google Scholar] [CrossRef] [PubMed]
- Zhang, J.; Ahn, W.S.; Gameiro, P.A.; Keibler, M.A.; Zhang, Z.; Stephanopoulos, G. 13C isotope-assisted methods for quantifying glutamine metabolism in cancer cells. Methods Enzymol. 2014, 542, 369–389. [Google Scholar] [CrossRef] [PubMed] [Green Version]
- Yoo, H.; Stephanopoulos, G.; Kelleher, J.K. Quantifying carbon sources for de novo lipogenesis in wild-type and IRS-1 knockout brown adipocytes. J. Lipid Res. 2004, 45, 1324–1332. [Google Scholar] [CrossRef] [PubMed] [Green Version]
- Liu, W.; Le, A.; Hancock, C.; Lane, A.N.; Dang, C.V.; Fan, T.W.; Phang, J.M. Reprogramming of proline and glutamine metabolism contributes to the proliferative and metabolic responses regulated by oncogenic transcription factor c-MYC. Proc. Natl. Acad. Sci. USA 2012, 109, 8983–8988. [Google Scholar] [CrossRef] [PubMed] [Green Version]
- Le, A.; Lane, A.N.; Hamaker, M.; Bose, S.; Gouw, A.; Barbi, J.; Tsukamoto, T.; Rojas, C.J.; Slusher, B.S.; Zhang, H.; et al. Glucose-independent glutamine metabolism via TCA cycling for proliferation and survival in B cells. Cell Metab. 2012, 15, 110–121. [Google Scholar] [CrossRef] [Green Version]
- Fendt, S.M.; Bell, E.L.; Keibler, M.A.; Olenchock, B.A.; Mayers, J.R.; Wasylenko, T.M.; Vokes, N.I.; Guarente, L.; Vander Heiden, M.G.; Stephanopoulos, G. Reductive glutamine metabolism is a function of the alpha-ketoglutarate to citrate ratio in cells. Nat. Commun. 2013, 4, 2236. [Google Scholar] [CrossRef] [Green Version]
- Taylor, L.; Curthoys, N.P. Glutamine metabolism: Role in acid-base balance. Biochem. Mol. Biol. Educ. 2004, 32, 291–304. [Google Scholar] [CrossRef]
- Yelamanchi, S.D.; Jayaram, S.; Thomas, J.K.; Gundimeda, S.; Khan, A.A.; Singhal, A.; Keshava Prasad, T.S.; Pandey, A.; Somani, B.L.; Gowda, H. A pathway map of glutamate metabolism. J. Cell Commun. Signal. 2016, 10, 69–75. [Google Scholar] [CrossRef] [Green Version]
- Häussinger, D.; Sies, H. Glutamine Metabolism in Mammalian Tissues; Springer: Berlin/Heidelberg, Germany, 1984. [Google Scholar]
- McKeehan, W.L. Glycolysis, glutaminolysis and cell proliferation. Cell Biol. Int. Rep. 1982, 6, 635–650. [Google Scholar] [CrossRef]
- Reitzer, L.J.; Wice, B.M.; Kennell, D. Evidence that glutamine, not sugar, is the major energy source for cultured HeLa cells. J. Biol. Chem. 1979, 254, 2669–2676. [Google Scholar] [CrossRef]
- Ros, S.; Schulze, A. Balancing glycolytic flux: The role of 6-phosphofructo-2-kinase/fructose 2,6-bisphosphatases in cancer metabolism. Cancer Metab. 2013, 1, 8. [Google Scholar] [CrossRef] [Green Version]
- Chandel, N.S.; Maltepe, E.; Goldwasser, E.; Mathieu, C.E.; Simon, M.C.; Schumacker, P.T. Mitochondrial reactive oxygen species trigger hypoxia-induced transcription. Proc. Natl. Acad. Sci. USA 1998, 95, 11715–11720. [Google Scholar] [CrossRef] [PubMed] [Green Version]
- de Groot, H.; Littauer, A. Hypoxia, reactive oxygen, and cell injury. Free Radic Biol. Med. 1989, 6, 541–551. [Google Scholar] [CrossRef]
- Pompella, A.; Visvikis, A.; Paolicchi, A.; De Tata, V.; Casini, A.F. The changing faces of glutathione, a cellular protagonist. Biochem. Pharmacol. 2003, 66, 1499–1503. [Google Scholar] [CrossRef]
- Ballester, M.; Sentandreu, E.; Luongo, G.; Santamaria, R.; Bolonio, M.; Alcoriza-Balaguer, M.I.; Palomino-Schatzlein, M.; Pineda-Lucena, A.; Castell, J.; Lahoz, A.; et al. Glutamine/glutamate metabolism rewiring in reprogrammed human hepatocyte-like cells. Sci. Rep. 2019, 9, 17978. [Google Scholar] [CrossRef]
- Bertolo, R.F.; Burrin, D.G. Comparative aspects of tissue glutamine and proline metabolism. J. Nutr. 2008, 138, 2032S–2039S. [Google Scholar] [CrossRef] [PubMed] [Green Version]
- Pegg, A.E.; Casero, R.A., Jr. Current status of the polyamine research field. Methods Mol. Biol. 2011, 720, 3–35. [Google Scholar] [CrossRef] [Green Version]
- Pegg, A.E. Regulation of ornithine decarboxylase. J. Biol. Chem. 2006, 281, 14529–14532. [Google Scholar] [CrossRef] [Green Version]
- Schmidt, H.; Malik, A.; Bicker, A.; Poetzsch, G.; Avivi, A.; Shams, I.; Hankeln, T. Hypoxia tolerance, longevity and cancer-resistance in the mole rat Spalax—A liver transcriptomics approach. Sci. Rep. 2017, 7, 14348. [Google Scholar] [CrossRef]
- Imberman, M.; Oppenheim, F.; Franzblau, C. The appearance of free hydroxyproline as the major product of degradation of newly synthesized collagen in cell culture. Biochim. Biophys. Acta 1982, 719, 480–487. [Google Scholar] [CrossRef]
- Hu, S.; He, W.; Wu, G. Hydroxyproline in animal metabolism, nutrition, and cell signaling. Amino Acids 2021. [Google Scholar] [CrossRef] [PubMed]
- Heinz, A. Elastases and elastokines: Elastin degradation and its significance in health and disease. Crit. Rev. Biochem. Mol. Biol. 2020, 55, 252–273. [Google Scholar] [CrossRef]
- Wise, D.R.; Ward, P.S.; Shay, J.E.; Cross, J.R.; Gruber, J.J.; Sachdeva, U.M.; Platt, J.M.; DeMatteo, R.G.; Simon, M.C.; Thompson, C.B. Hypoxia promotes isocitrate dehydrogenase-dependent carboxylation of alpha-ketoglutarate to citrate to support cell growth and viability. Proc. Natl. Acad. Sci. USA 2011, 108, 19611–19616. [Google Scholar] [CrossRef] [PubMed] [Green Version]
- Metallo, C.M.; Gameiro, P.A.; Bell, E.L.; Mattaini, K.R.; Yang, J.; Hiller, K.; Jewell, C.M.; Johnson, Z.R.; Irvine, D.J.; Guarente, L.; et al. Reductive glutamine metabolism by IDH1 mediates lipogenesis under hypoxia. Nature 2011, 481, 380–384. [Google Scholar] [CrossRef] [PubMed] [Green Version]
- Jiang, L.; Shestov, A.A.; Swain, P.; Yang, C.; Parker, S.J.; Wang, Q.A.; Terada, L.S.; Adams, N.D.; McCabe, M.T.; Pietrak, B.; et al. Reductive carboxylation supports redox homeostasis during anchorage-independent growth. Nature 2016, 532, 255–258. [Google Scholar] [CrossRef]
- Du, J.; Yanagida, A.; Knight, K.; Engel, A.L.; Vo, A.H.; Jankowski, C.; Sadilek, M.; Tran, V.T.; Manson, M.A.; Ramakrishnan, A.; et al. Reductive carboxylation is a major metabolic pathway in the retinal pigment epithelium. Proc. Natl. Acad. Sci. USA 2016, 113, 14710–14715. [Google Scholar] [CrossRef] [PubMed] [Green Version]
- Gaude, E.; Schmidt, C.; Gammage, P.A.; Dugourd, A.; Blacker, T.; Chew, S.P.; Saez-Rodriguez, J.; O’Neill, J.S.; Szabadkai, G.; Minczuk, M.; et al. NADH Shuttling Couples Cytosolic Reductive Carboxylation of Glutamine with Glycolysis in Cells with Mitochondrial Dysfunction. Mol. Cell 2018, 69, 581–593.e587. [Google Scholar] [CrossRef] [Green Version]
- Lemons, J.M.; Feng, X.J.; Bennett, B.D.; Legesse-Miller, A.; Johnson, E.L.; Raitman, I.; Pollina, E.A.; Rabitz, H.A.; Rabinowitz, J.D.; Coller, H.A. Quiescent fibroblasts exhibit high metabolic activity. PLoS Biol. 2010, 8, e1000514. [Google Scholar] [CrossRef] [Green Version]
- Yoo, H.; Antoniewicz, M.R.; Stephanopoulos, G.; Kelleher, J.K. Quantifying reductive carboxylation flux of glutamine to lipid in a brown adipocyte cell line. J. Biol. Chem. 2008, 283, 20621–20627. [Google Scholar] [CrossRef] [Green Version]
- Kim, J.W.; Tchernyshyov, I.; Semenza, G.L.; Dang, C.V. HIF-1-mediated expression of pyruvate dehydrogenase kinase: A metabolic switch required for cellular adaptation to hypoxia. Cell Metab. 2006, 3, 177–185. [Google Scholar] [CrossRef] [Green Version]
- Wang, G.L.; Semenza, G.L. Purification and characterization of hypoxia-inducible factor 1. J. Biol. Chem. 1995, 270, 1230–1237. [Google Scholar] [CrossRef] [PubMed] [Green Version]
- Semenza, G.L. Oxygen sensing, hypoxia-inducible factors, and disease pathophysiology. Annu. Rev. Pathol. 2014, 9, 47–71. [Google Scholar] [CrossRef] [PubMed]
- Chowdhury, R.; Leung, I.K.; Tian, Y.M.; Abboud, M.I.; Ge, W.; Domene, C.; Cantrelle, F.X.; Landrieu, I.; Hardy, A.P.; Pugh, C.W.; et al. Structural basis for oxygen degradation domain selectivity of the HIF prolyl hydroxylases. Nat. Commun. 2016, 7, 12673. [Google Scholar] [CrossRef] [PubMed]
- Struys, E.A.; Verhoeven, N.M.; Brunengraber, H.; Jakobs, C. Investigations by mass isotopomer analysis of the formation of D-2-hydroxyglutarate by cultured lymphoblasts from two patients with D-2-hydroxyglutaric aciduria. FEBS Lett. 2004, 557, 115–120. [Google Scholar] [CrossRef] [Green Version]
- Zhao, S.; Lin, Y.; Xu, W.; Jiang, W.; Zha, Z.; Wang, P.; Yu, W.; Li, Z.; Gong, L.; Peng, Y.; et al. Glioma-derived mutations in IDH1 dominantly inhibit IDH1 catalytic activity and induce HIF-1alpha. Science 2009, 324, 261–265. [Google Scholar] [CrossRef] [PubMed] [Green Version]
- Achouri, Y.; Noel, G.; Vertommen, D.; Rider, M.H.; Veiga-Da-Cunha, M.; Van Schaftingen, E. Identification of a dehydrogenase acting on D-2-hydroxyglutarate. Biochem. J. 2004, 381, 35–42. [Google Scholar] [CrossRef] [PubMed] [Green Version]
- Struys, E.A.; Verhoeven, N.M.; Jansen, E.E.; Ten Brink, H.J.; Gupta, M.; Burlingame, T.G.; Quang, L.S.; Maher, T.; Rinaldo, P.; Snead, O.C.; et al. Metabolism of gamma-hydroxybutyrate to d-2-hydroxyglutarate in mammals: Further evidence for d-2-hydroxyglutarate transhydrogenase. Metabolism 2006, 55, 353–358. [Google Scholar] [CrossRef]
- Parker, A.; Engel, P.C. Preliminary evidence for the existence of specific functional assemblies between enzymes of the beta-oxidation pathway and the respiratory chain. Biochem. J. 2000, 345 Pt 3, 429–435. [Google Scholar] [CrossRef]
- Toplak, M.; Brunner, J.; Schmidt, J.; Macheroux, P. Biochemical characterization of human D-2-hydroxyglutarate dehydrogenase and two disease related variants reveals the molecular cause of D-2-hydroxyglutaric aciduria. Biochim. Biophys. Acta Proteins Proteom. 2019, 1867, 140255. [Google Scholar] [CrossRef]
- Islam, M.S.; Leissing, T.M.; Chowdhury, R.; Hopkinson, R.J.; Schofield, C.J. 2-Oxoglutarate-Dependent Oxygenases. Annu. Rev. Biochem. 2018, 87, 585–620. [Google Scholar] [CrossRef]
- Karna, E.; Szoka, L.; Huynh, T.Y.L.; Palka, J.A. Proline-dependent regulation of collagen metabolism. Cell. Mol. Life Sci. 2020, 77, 1911–1918. [Google Scholar] [CrossRef] [PubMed] [Green Version]
- Priest, R.E.; Davies, L.M. Cellular proliferation and synthesis of collagen. Lab. Investig. 1969, 21, 138–142. [Google Scholar] [PubMed]
- Klionsky, D.J.; Abdalla, F.C.; Abeliovich, H.; Abraham, R.T.; Acevedo-Arozena, A.; Adeli, K.; Agholme, L.; Agnello, M.; Agostinis, P.; Aguirre-Ghiso, J.A.; et al. Guidelines for the use and interpretation of assays for monitoring autophagy. Autophagy 2012, 8, 445–544. [Google Scholar] [CrossRef] [PubMed]
- Palka, J.A.; Phang, J.M. Prolidase in human breast cancer MCF-7 cells. Cancer Lett. 1998, 127, 63–70. [Google Scholar] [CrossRef]
- Wu, Z.; Hou, Y.; Dai, Z.; Hu, C.A.; Wu, G. Metabolism, Nutrition, and Redox Signaling of Hydroxyproline. Antioxid. Redox Signal. 2019, 30, 674–682. [Google Scholar] [CrossRef]
- Phang, J.M.; Harrop, S.J.; Duff, A.P.; Sokolova, A.V.; Crossett, B.; Walsh, J.C.; Beckham, S.A.; Nguyen, C.D.; Davies, R.B.; Glockner, C.; et al. Structural characterization suggests models for monomeric and dimeric forms of full-length ezrin. Biochem. J. 2016, 473, 2763–2782. [Google Scholar] [CrossRef] [Green Version]
- Yeh, G.C.; Phang, J.M. Stimulation of phosphoribosyl pyrophosphate and purine nucleotide production by pyrroline 5-carboxylate in human erythrocytes. J. Biol. Chem. 1988, 263, 13083–13089. [Google Scholar] [CrossRef]
- Balboni, E. A proline shuttle in insect flight muscle. Biochem. Biophys. Res. Commun. 1978, 85, 1090–1096. [Google Scholar] [CrossRef]
- Phang, J.M.; Liu, W.; Zabirnyk, O. Proline metabolism and microenvironmental stress. Annu. Rev. Nutr. 2010, 30, 441–463. [Google Scholar] [CrossRef] [Green Version]
- Boyle, J. Lehninger Principles of Biochemistry, 4th ed.; Biochemistry and Molecular Biology, Education; Nelson, D., Cox, M., Eds.; Freeman and Company: New York, NY, USA, 2005; pp. 74–75. [Google Scholar] [CrossRef]
- Tang, L.; Yang, G.; Ma, M.; Liu, X.; Li, B.; Xie, J.; Fu, Y.; Chen, T.; Yu, Y.; Chen, W.; et al. An effector of a necrotrophic fungal pathogen targets the calcium-sensing receptor in chloroplasts to inhibit host resistance. Mol. Plant Pathol. 2020. [Google Scholar] [CrossRef] [Green Version]
- Wang, T.; Gao, X.; Yang, J.; Guo, W.; Wu, Z.; Tang, L.; Cao, S.; Cai, X.; Liu, T.; Jia, Q.; et al. Treatment strategies and outcomes for spinal rhabdomyosarcoma: A series of 11 cases in a single center and review of the literature. Clin. Neurol. Neurosurg. 2020, 192, 105729. [Google Scholar] [CrossRef]
- Polyak, K.; Xia, Y.; Zweier, J.L.; Kinzler, K.W.; Vogelstein, B. A model for p53-induced apoptosis. Nature 1997, 389, 300–305. [Google Scholar] [CrossRef] [PubMed]
- Stoner, G.D.; Merchant, D.J. Amino acid utilization by L-M strain mouse cells in a chemically defined medium. In Vitro 1972, 7, 330–343. [Google Scholar] [CrossRef]
- Verma, R.P.; Hansch, C. Matrix metalloproteinases (MMPs): Chemical-biological functions and (Q)SARs. Bioorg. Med. Chem. 2007, 15, 2223–2268. [Google Scholar] [CrossRef] [PubMed]
- Tang, L.; Yang, M.; Qin, L.; Li, X.; He, G.; Liu, X.; Xu, W. Deficiency of DICER reduces the invasion ability of trophoblasts and impairs the pro-angiogenic effect of trophoblast-derived microvesicles. J. Cell. Mol. Med. 2020. [Google Scholar] [CrossRef] [PubMed] [Green Version]
- Stetten, M.R. Some aspects of the metabolism of hydroxyproline, studied with the aid of isotopic nitrogen. J. Biol. Chem. 1949, 181, 31–37. [Google Scholar] [CrossRef]
- Valle, D.; Goodman, S.I.; Harris, S.C.; Phang, J.M. Genetic evidence for a common enzyme catalyzing the second step in the degradation of proline and hydroxyproline. J. Clin. Investig. 1979, 64, 1365–1370. [Google Scholar] [CrossRef]
- Galili, S.; Ran, H.; Dor, E.; Hershenhorn, J.; Harel, A.; Amir-Segev, O.; Bellalou, A.; Badani, H.; Smirnov, E.; Achdari, G. The history of chickpea cultivation and breeding in Israel. Israel J. Plant Sci. 2018, 65, 186–194. [Google Scholar] [CrossRef]
- Parsons, R.; Sunley, R.J. Nitrogen nutrition and the role of root–shoot nitrogen signalling particularly in symbiotic systems. J. Exp. Bot. 2001, 52, 435–443. [Google Scholar] [CrossRef]
- Hasanuzzaman, M.; Araújo, S.; Gill, S.S. The Plant Family Fabaceae: Biology and Physiological Responses to Environmental Stresses; Springer: Singapore, 2020. [Google Scholar]
- Sulieman, S.; Tran, L.-S.P. Asparagine: An amide of particular distinction in the regulation of symbiotic nitrogen fixation of legumes. Crit. Rev. Biotechnol. 2013, 33, 309–327. [Google Scholar] [CrossRef]
- Miskevich, D.; Chaban, A.; Dronina, M.; Abramovich, I.; Gottlieb, E.; Shams, I. Comprehensive Analysis of 13C6 Glucose Fate in the Hypoxia-Tolerant Blind Mole Rat Skin Fibroblasts. Metabolites 2021, 11, 734. [Google Scholar] [CrossRef]
- Warburg, O. On the origin of cancer cells. Science 1956, 123, 309–314. [Google Scholar] [CrossRef] [PubMed]
- Velez, J.; Hail, N., Jr.; Konopleva, M.; Zeng, Z.; Kojima, K.; Samudio, I.; Andreeff, M. Mitochondrial uncoupling and the reprograming of intermediary metabolism in leukemia cells. Front. Oncol. 2013, 3, 67. [Google Scholar] [CrossRef] [PubMed] [Green Version]
Figure 1.
Selected characteristics of Gln homeostasis in the Spalax and rat cells after one day under normoxia and hypoxia: (a) the MID for medium Gln, (b) the Gln M+5 that was consumed by the cells (c), (d)-intracellular levels of Gln M+5 and Glu M+5; the levels of the TCA cycle Gln-derived intermediates: (e–h) the levels of intracellular αKG M+5, succinate M+4, malate M+4, citrate M+4, Orn M+5, HPro M+5; and the fate of diverted from the TCA cycle Gln M+5: (i,j) intracellular levels of 2HG M+5, HPro M+5; (k,l), secreted outside HPro M+5, HPro M+0. S.20%, R. 20%, S.1%, R1% represents Spalax (S) and rat (R) cells that were exposed to an atmosphere containing 20% or 1% O2, respectively; ns, (nonsignificant) p > 0.05; * p < 0.05; ** p < 0.01; *** p < 0.001; **** p < 0.0001, the error bars represent standard deviation of six or more biological repeats. Every point on the chart represents one technical repeat.
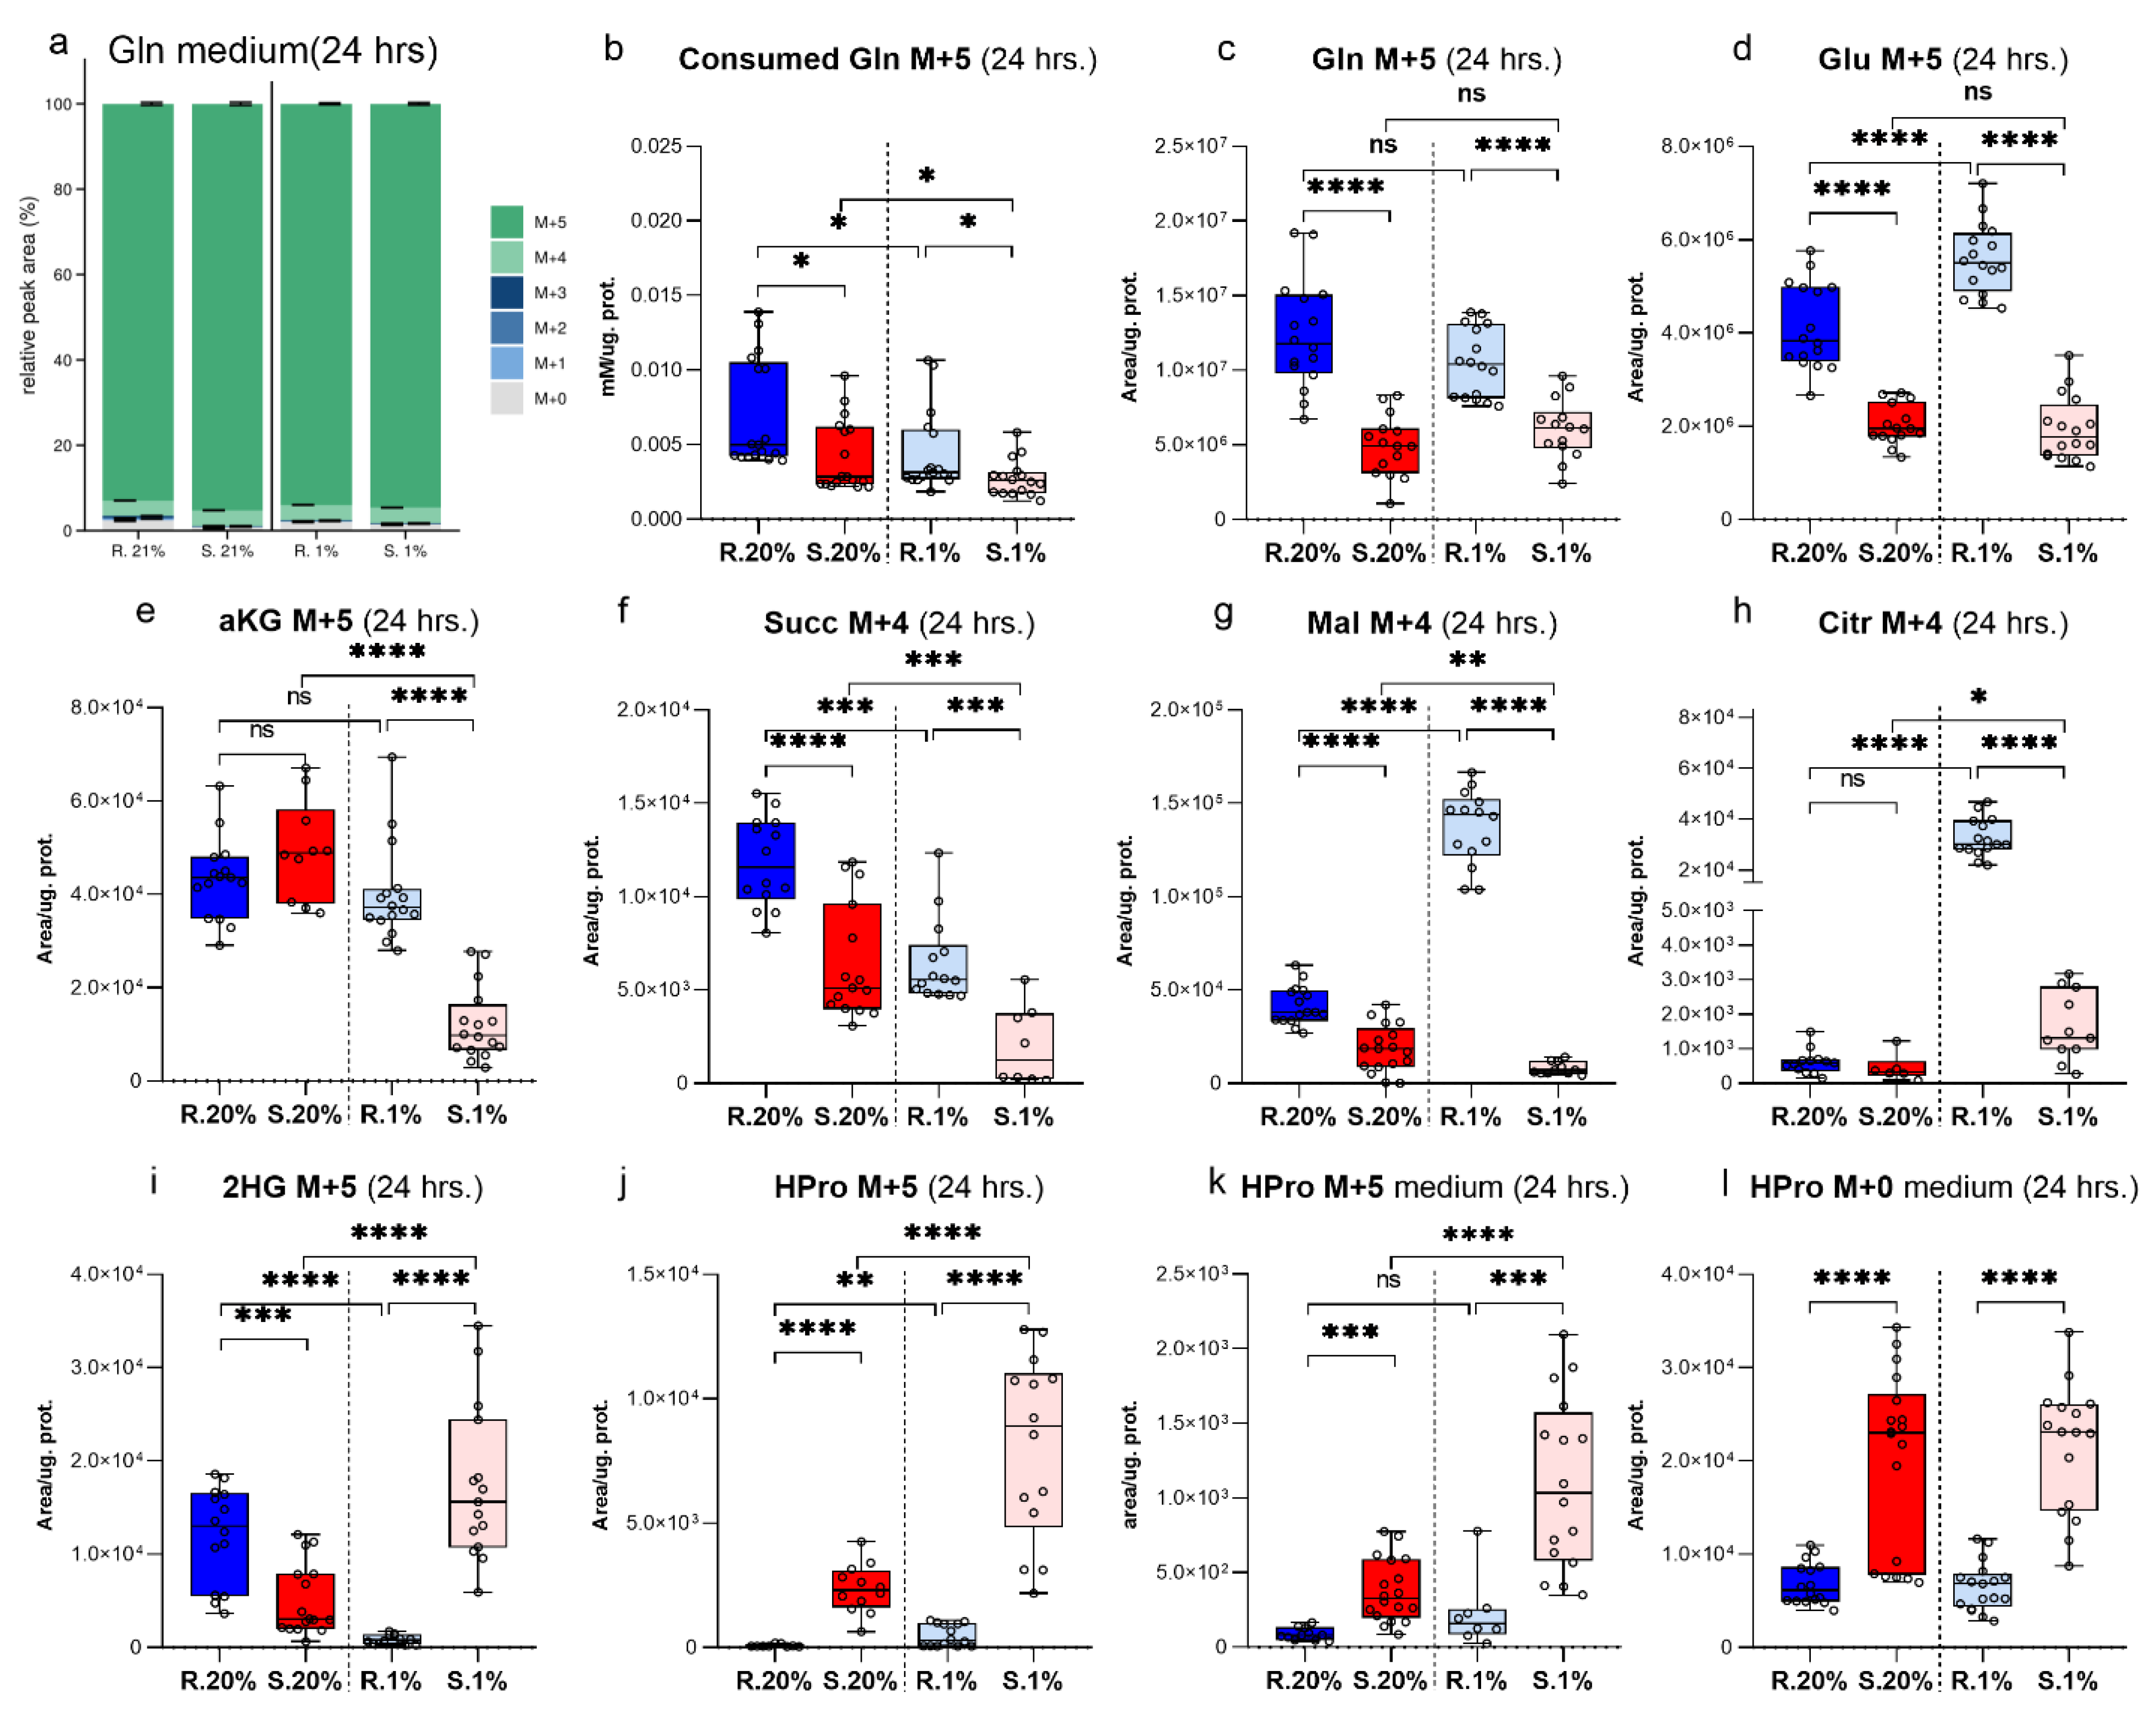
Figure 2.
Tracking the fate of Gln+5 after non-TCA cycle transformations: intracellular levels of (a) GSH+5; (b) Orn+5; The reductive carboxylation of Gln+5; intracellular levels of (c) HPro+1; (j) citrate+5; (l) C16:0+2; (d) extracellular levels of HPro+1; the Malic Enzyme-metabolized Gln+5: intracellular levels of (k) citrate+3. The calculated rates for (e–i) glutaminase, glutamate dehydrogenase, succinate dehydrogenase, and isocitrate dehydrogenase in Spalax and rat cells that were cultivated for one day under normoxia and hypoxia. S.20%, R. 20%, S.1%, R1% represent the Spalax (S) and rat (R) cells that were exposed to an atmosphere containing 20% or 1% O2, respectively; ns, (nonsignificant) p > 0.05; * p < 0.05; ** p < 0.01; *** p < 0.001; **** p < 0.0001, the error bars represent standard deviation of 6 or more biological repeats. Each point on the chart represents one technical repeat.
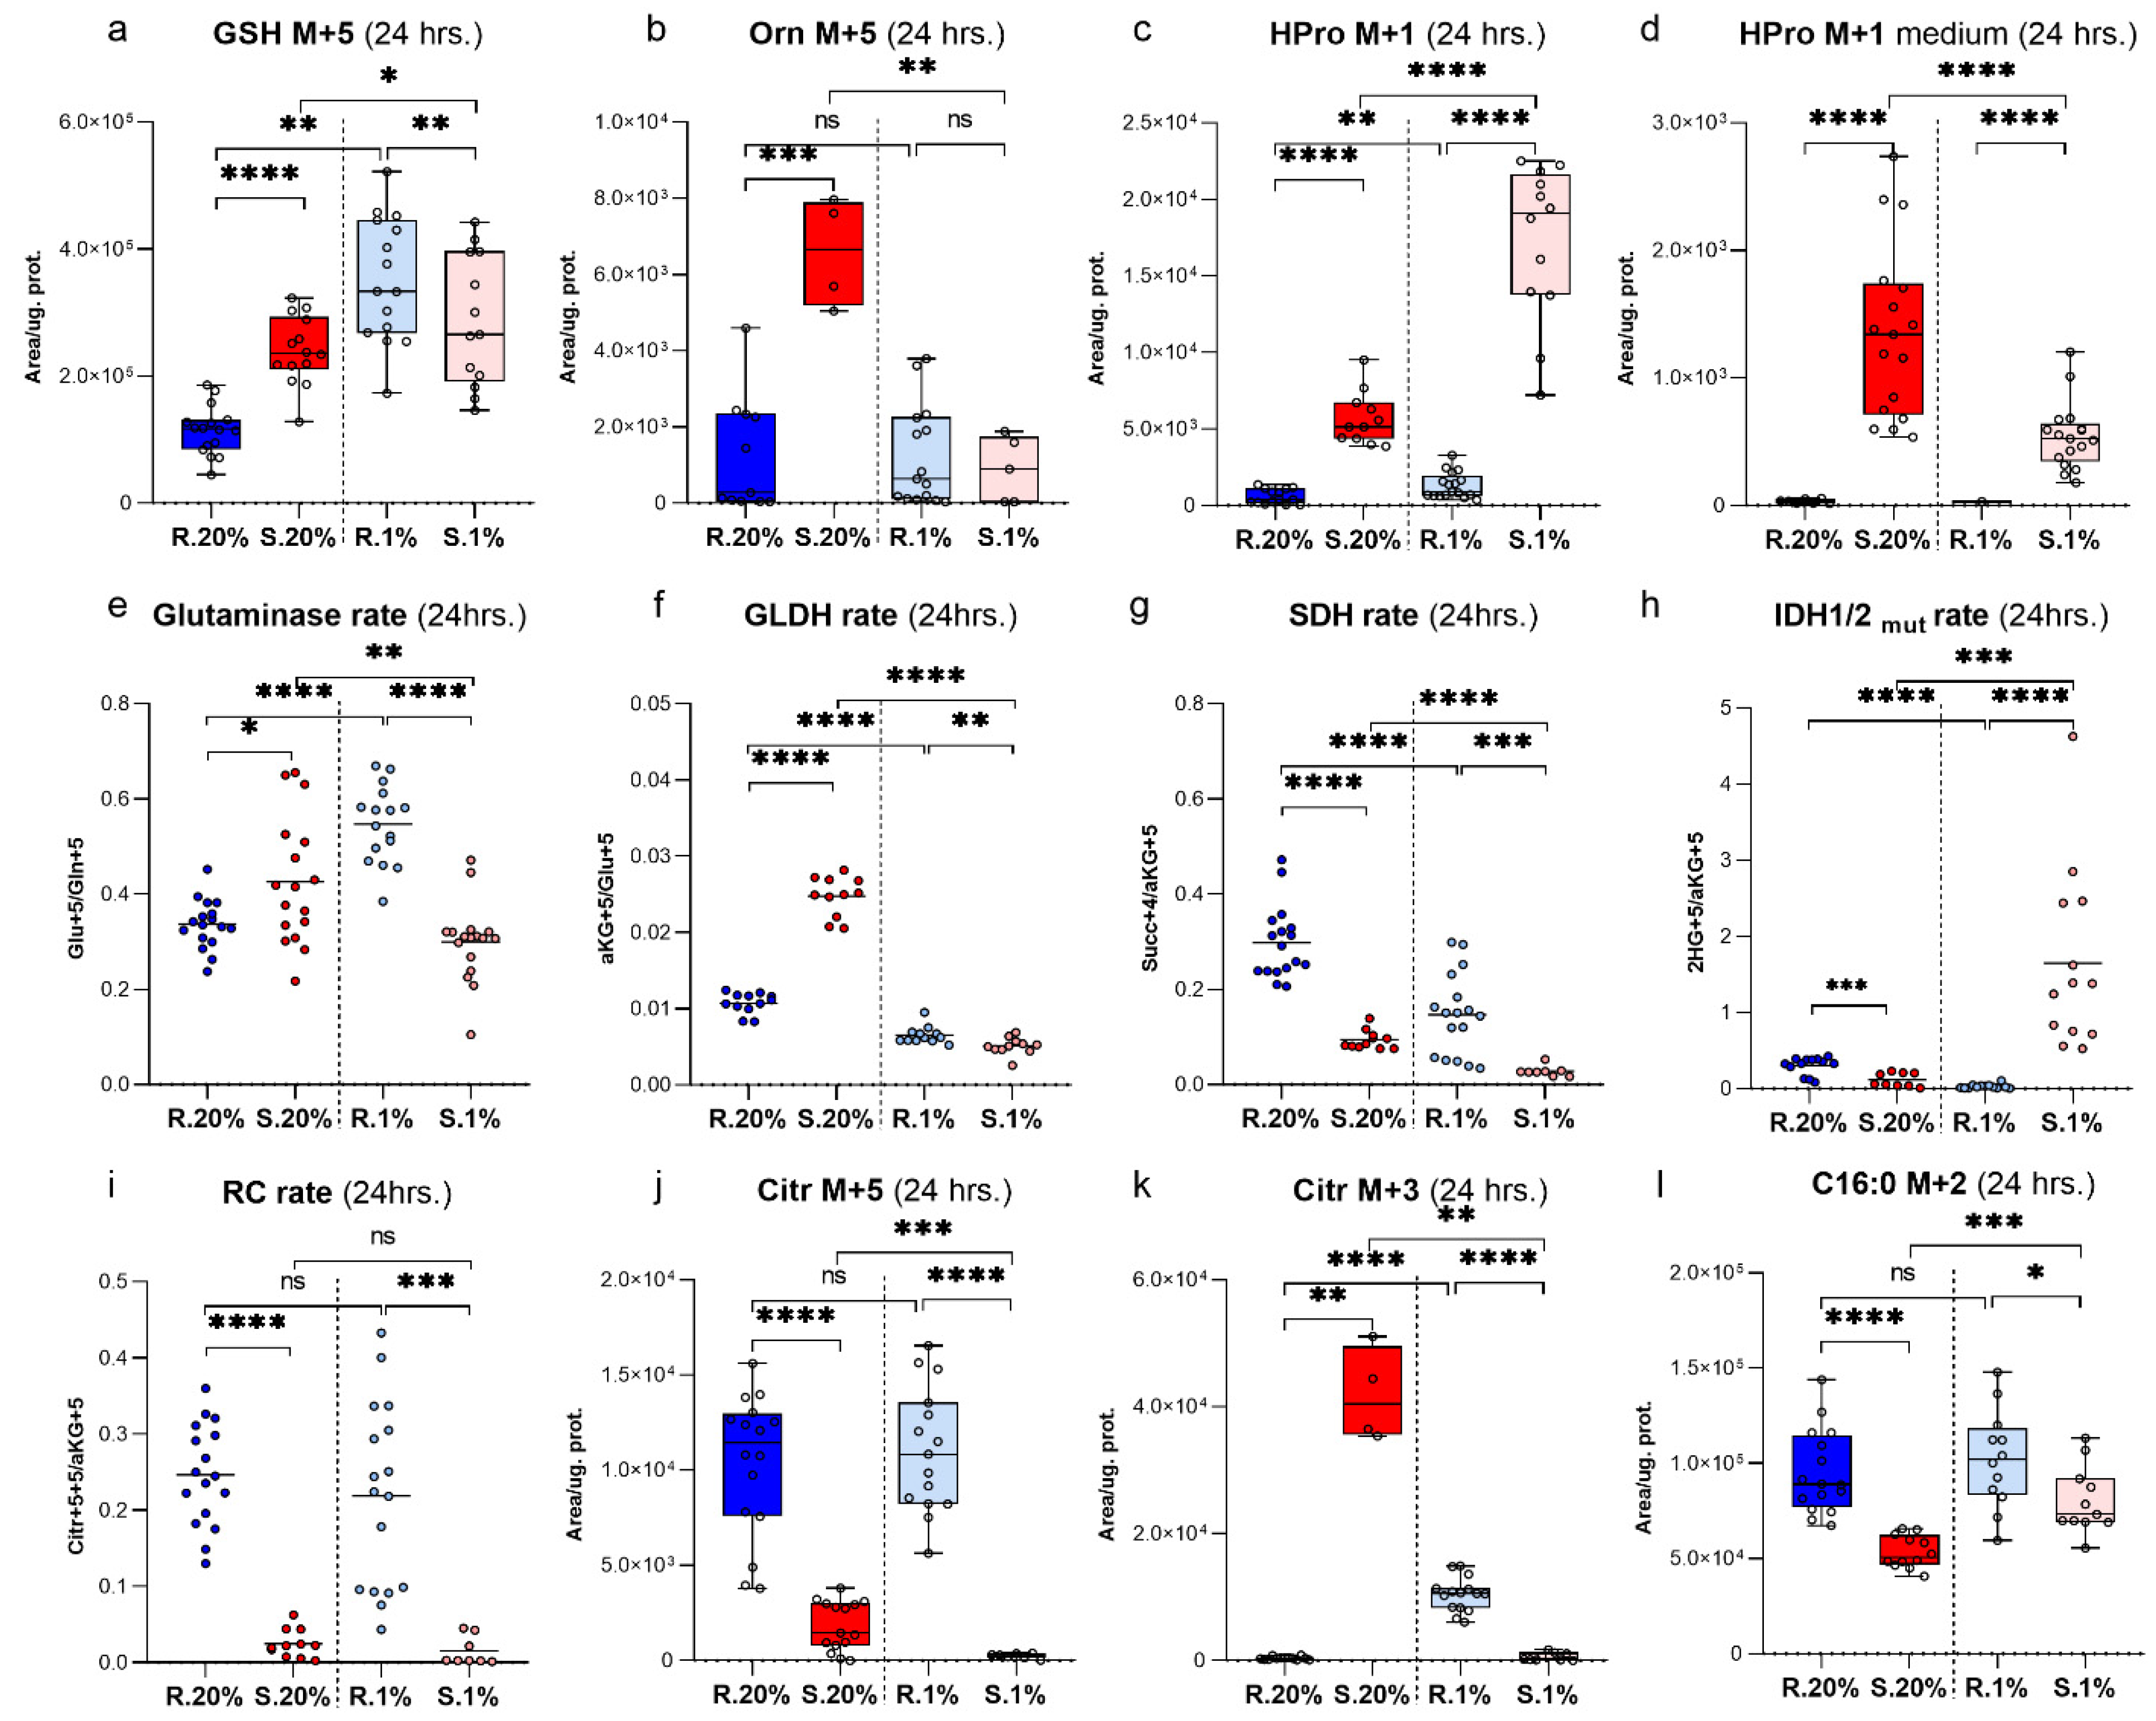
Figure 3.
The intracellular levels of different mass isotopologues of 2HG. (a) 2HG M+1; (b) 2HG M+2; (c), 2HG M+3; and (d) 2HG M+4 in the Spalax and rat cells under normoxia and hypoxia after they were cultivated for one day under normoxia and hypoxia. S.20%, R. 20%, S.1%, R1% represent the Spalax (S) and rat (R) cells that were exposed to an atmosphere containing 20% or 1% O2, respectively; ns, (nonsignificant) p > 0.05; * p < 0.05; **** p < 0.0001, the error bars represent the standard deviation of six or more biological repeats. Every point on the chart represents one technical repeat. LLOD-lower limit of detection.

Figure 4.
Primary scheme of redox shuttling of Pro/HPro and D2DGDH in the Spalax cells. Red-colored abbreviations and lines represent significantly upregulated mRNAs in the liver tissues of Spalax cells compared to the rat cells. IDH2mut, mutant IDH is known to facilitate 2HG production; nonetheless, the Spalax gene (NCBI Reference Sequence XP_008844432.1) does not harbor these mutations/substitutions.
Publisher’s Note: MDPI stays neutral with regard to jurisdictional claims in published maps and institutional affiliations. |
© 2021 by the authors. Licensee MDPI, Basel, Switzerland. This article is an open access article distributed under the terms and conditions of the Creative Commons Attribution (CC BY) license (https://creativecommons.org/licenses/by/4.0/).
Share and Cite
MDPI and ACS Style
Miskevich, D.; Chaban, A.; Dronina, M.; Abramovich, I.; Gottlieb, E.; Shams, I. Glutamine Homeostasis and Its Role in the Adaptive Strategies of the Blind Mole Rat, Spalax. Metabolites 2021, 11, 755. https://doi.org/10.3390/metabo11110755
AMA Style
Miskevich D, Chaban A, Dronina M, Abramovich I, Gottlieb E, Shams I. Glutamine Homeostasis and Its Role in the Adaptive Strategies of the Blind Mole Rat, Spalax. Metabolites. 2021; 11(11):755. https://doi.org/10.3390/metabo11110755
Chicago/Turabian StyleMiskevich, Dmitry, Anastasia Chaban, Maria Dronina, Ifat Abramovich, Eyal Gottlieb, and Imad Shams. 2021. "Glutamine Homeostasis and Its Role in the Adaptive Strategies of the Blind Mole Rat, Spalax" Metabolites 11, no. 11: 755. https://doi.org/10.3390/metabo11110755
Note that from the first issue of 2016, this journal uses article numbers instead of page numbers. See further details here.