
Urinary Metabolomic Profile of Neonates Born to Women with Gestational Diabetes Mellitus

 , , , , and
Abstract
:
1. Introduction
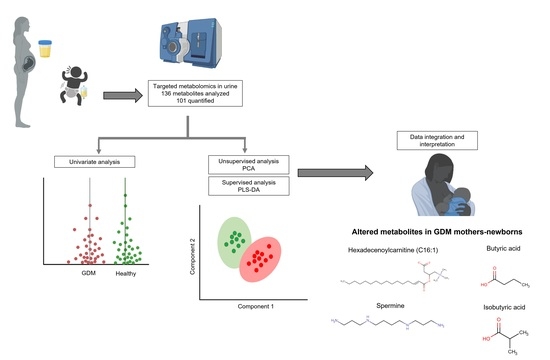
2. Results
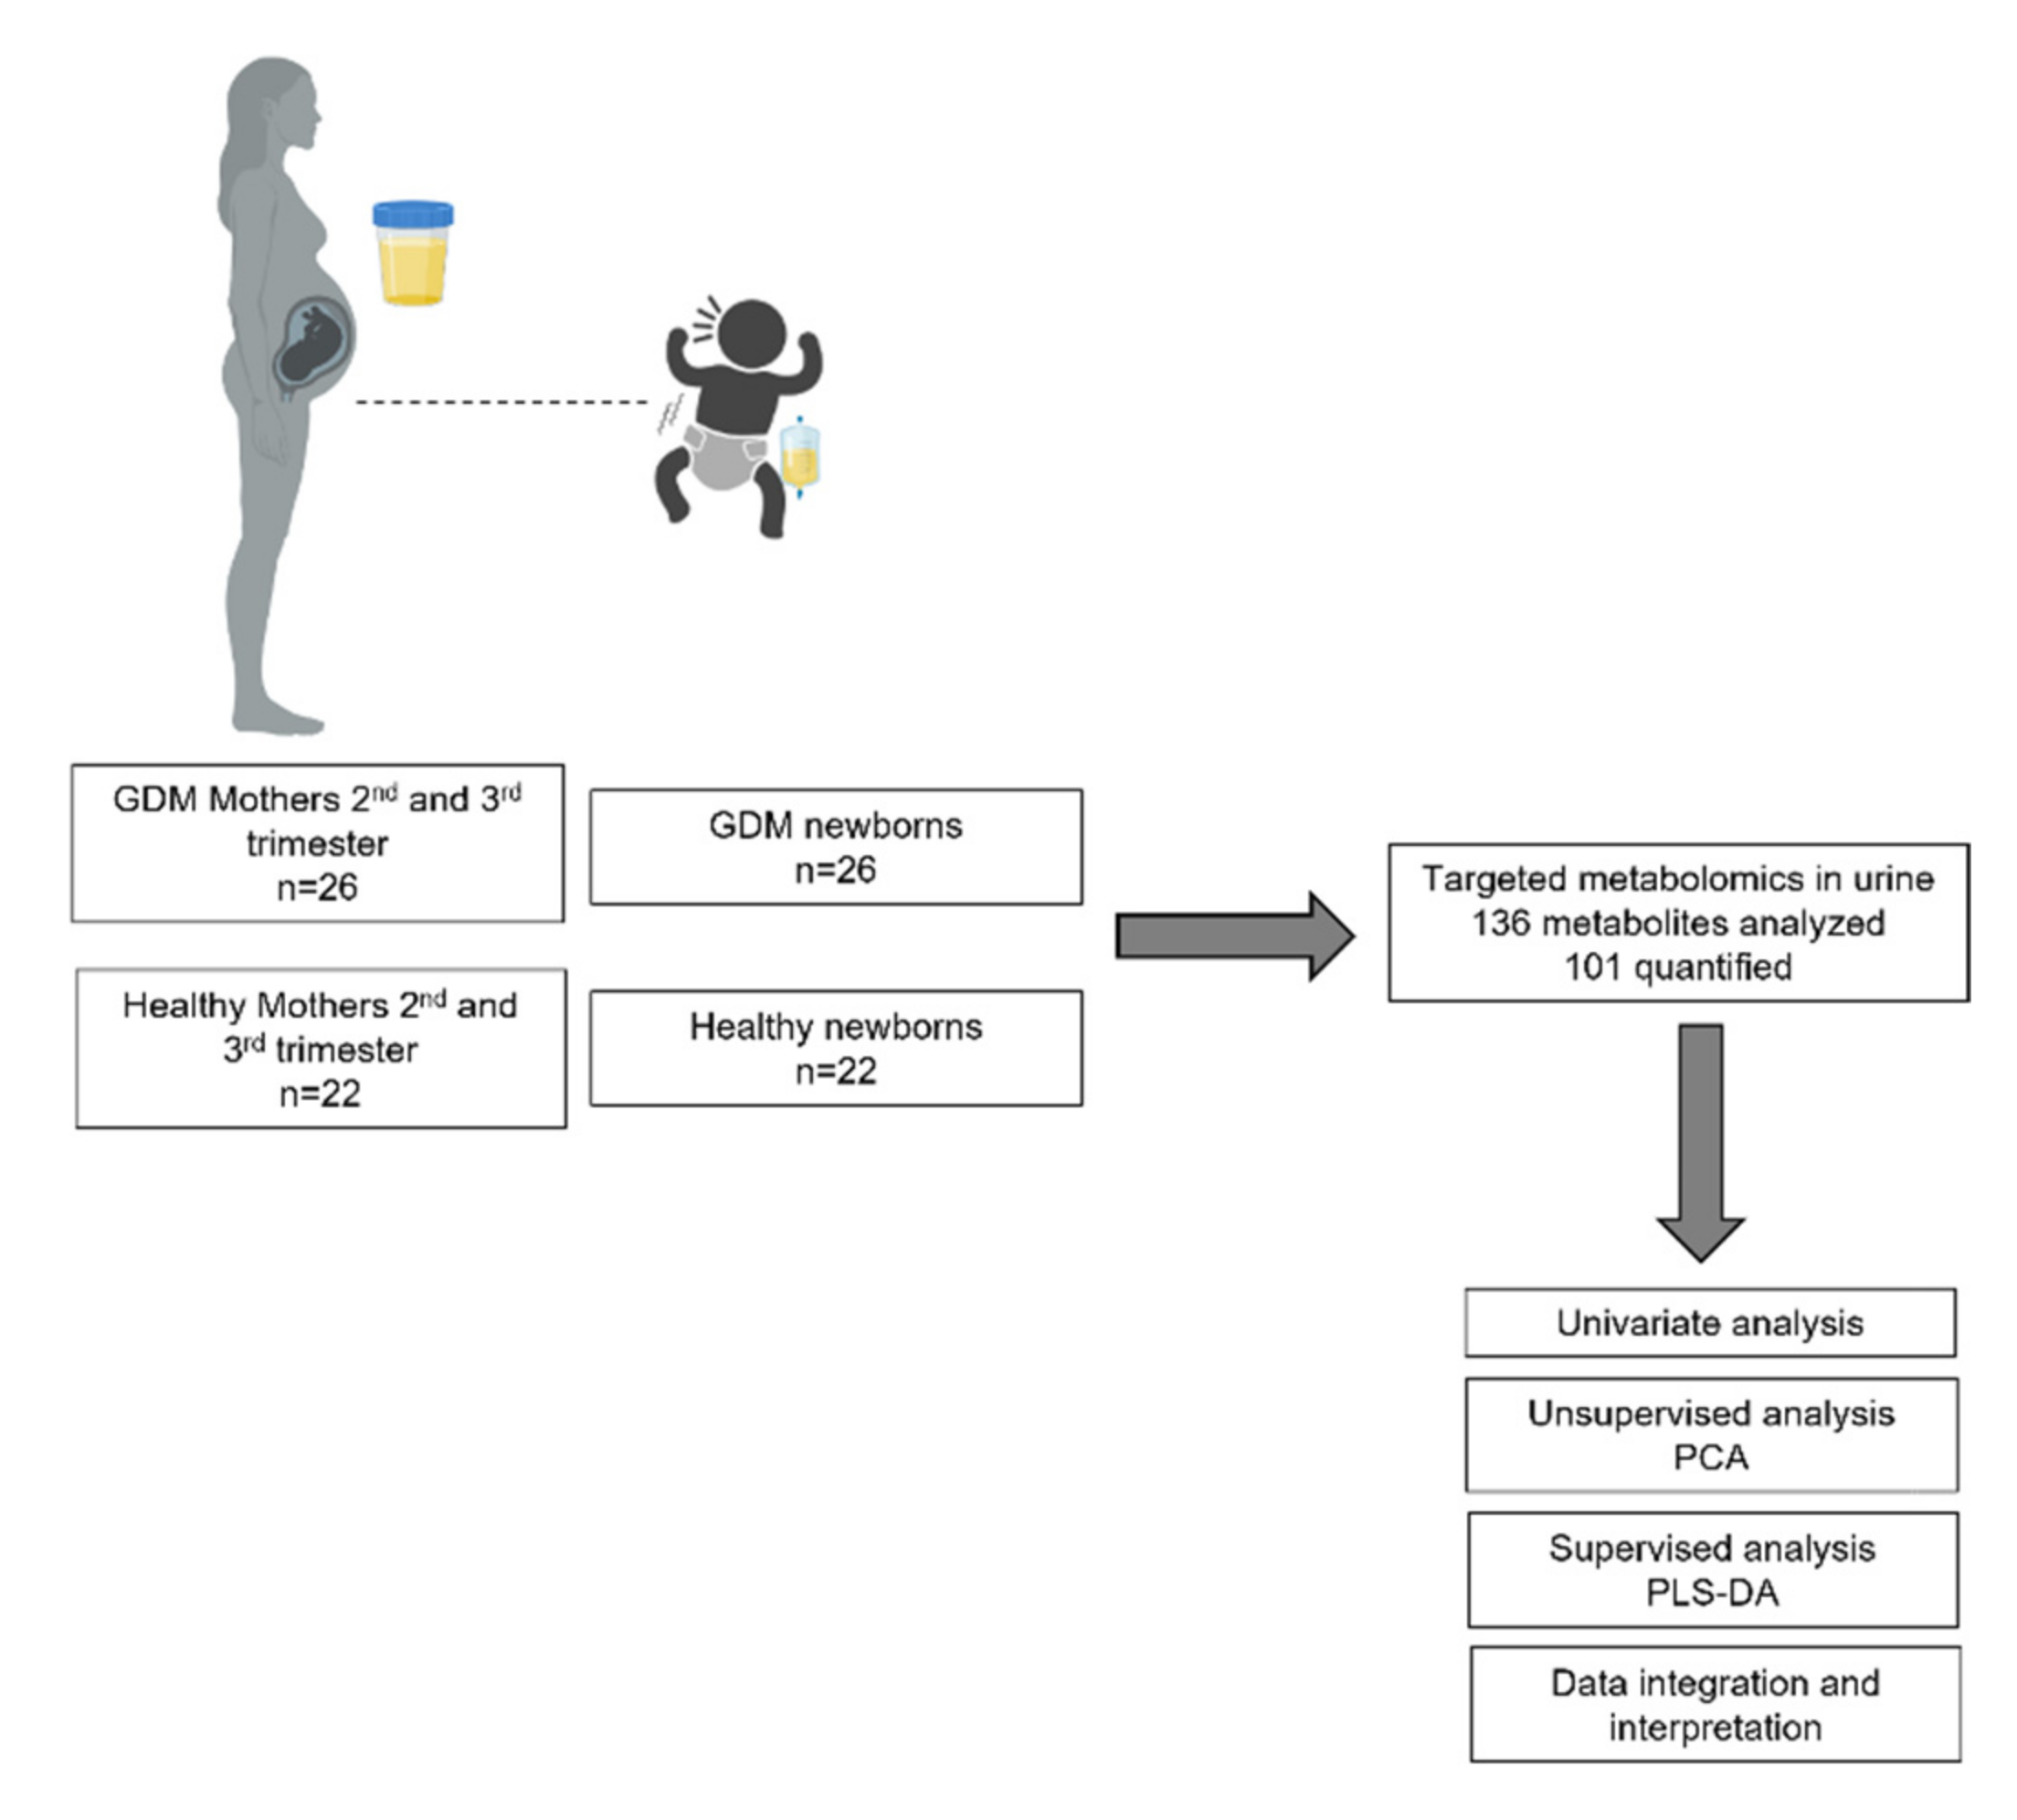
2.1. Clinical Characteristics of Newborns and Mothers
2.2. Urinary Concentration Values of 101 Metabolites of Newborns to Diabetic and Healthy Mothers
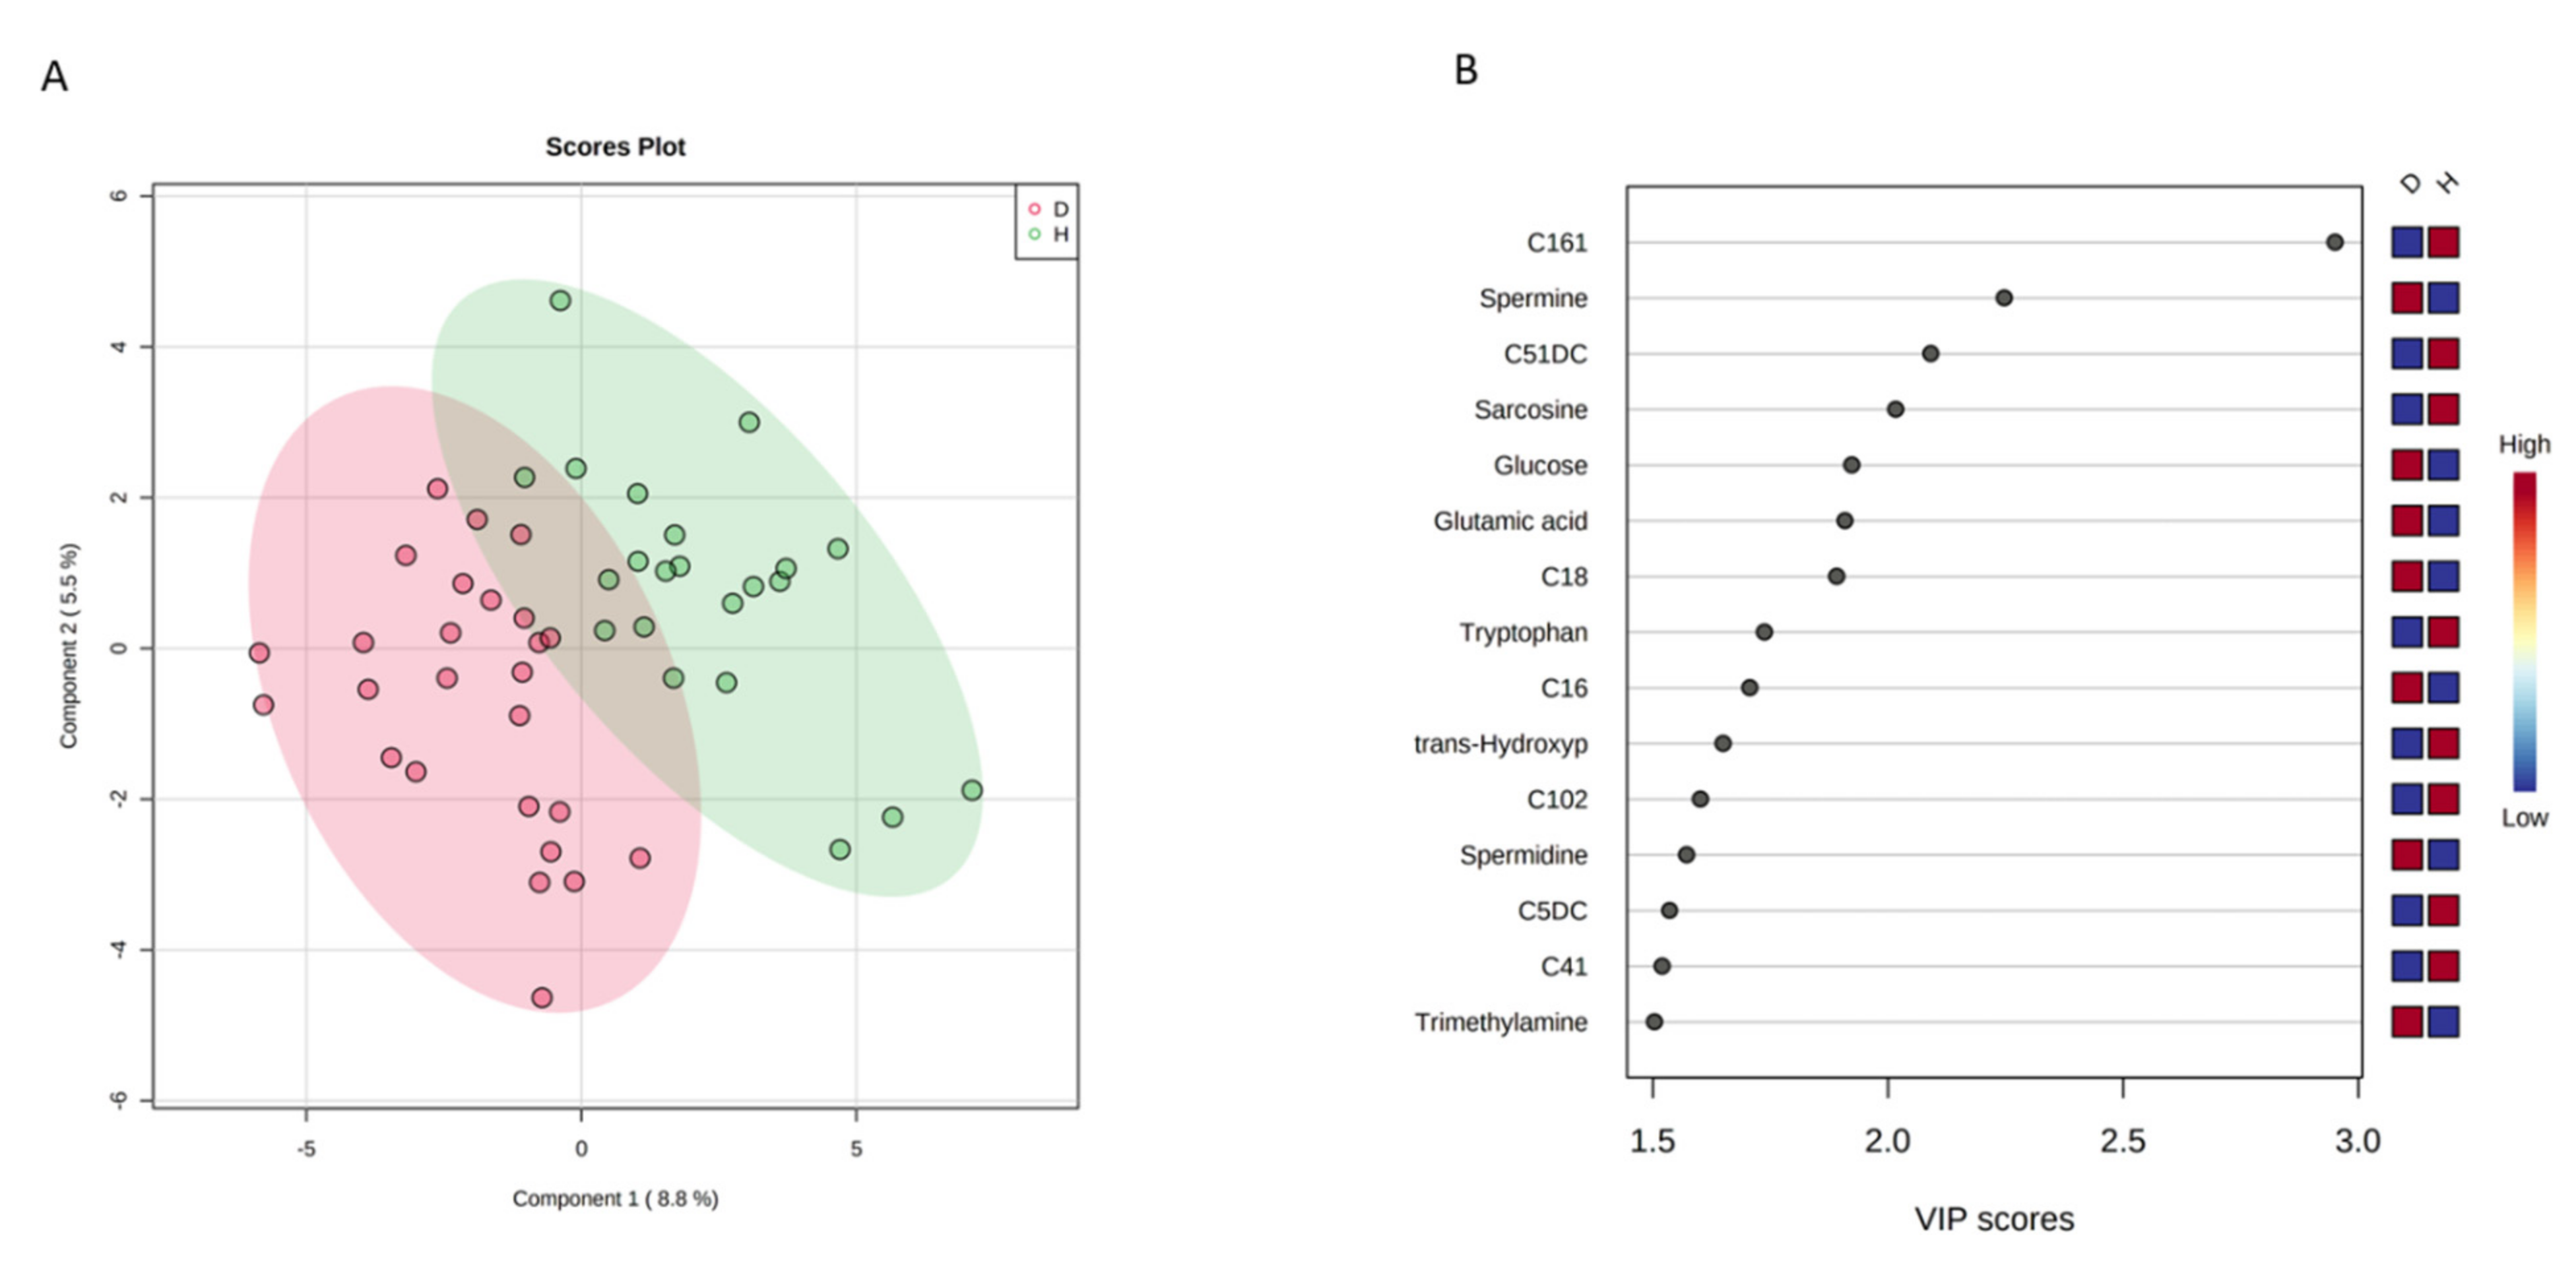
2.3. Multivariate Analysis
2.4. Analysis of the Maternal Urinary Metabolome during the Second and Third Trimesters of Pregnancy
3. Discussion
4. Materials and Methods
4.1. Study Design and Research Ethics Approval
4.2. Study Population
4.3. Metabolite Measurements
4.4. Statistical Analysis
5. Conclusions
Supplementary Materials
Author Contributions
Funding
Institutional Review Board Statement
Informed Consent Statement
Data Availability Statement
Acknowledgments
Conflicts of Interest
References
- Chu, S.Y.; Callaghan, W.M.; Kim, S.Y.; Schmid, C.H.; Lau, J.; England, L.J.; Dietz, P.M. Maternal Obesity and Risk of Gestational Diabetes Mellitus. Diabetes Care 2007, 30, 2070–2076. [Google Scholar] [CrossRef] [PubMed]
- Hod, M.; Kapur, A.; McIntyre, H.D. Evidence in support of the International Association of Diabetes in Pregnancy study groups’ criteria for diagnosing gestational diabetes mellitus worldwide in 2019. Am. J. Obstet. Gynecol. 2019, 221, 109–116. [Google Scholar] [CrossRef]
- Carracher, A.M.; Marathe, P.H.; Close, K.L. International Diabetes Federation 2017. J. Diabetes 2018, 10, 353–356. [Google Scholar] [CrossRef] [PubMed]
- Dani, C.; Bresci, C.; Berti, E.; Ottanelli, S.; Mello, G.; Mecacci, F.; Breschi, R.; Hu, X.; Tenori, L.; Luchinat, C. Metabolomic profile of term infants of gestational diabetic mothers. J. Matern. Neonatal Med. 2013, 27, 537–542. [Google Scholar] [CrossRef]
- Peng, S.; Zhang, J.; Liu, L.; Zhang, X.; Huang, Q.; Alamdar, A.; Tian, M.; Shen, H. Newborn Meconium and Urinary Metabolome Response to Maternal Gestational Diabetes Mellitus: A Preliminary Case–Control Study. J. Proteome Res. 2015, 14, 1799–1809. [Google Scholar] [CrossRef]
- Walejko, J.M.; Chelliah, A.; Keller-Wood, M.; Wasserfall, C.; Atkinson, M.; Gregg, A.; Edison, A.S. Diabetes Leads to Alterations in Normal Metabolic Transitions of Pregnancy as Revealed by Time-Course Metabolomics. Metabolites 2020, 10, 350. [Google Scholar] [CrossRef]
- Shokry, E.; Marchioro, L.; Uhl, O.; Bermúdez, M.G.; García-Santos, J.A.; Segura, M.T.; Campoy, C.; Koletzko, B. Impact of maternal BMI and gestational diabetes mellitus on maternal and cord blood metabolome: Results from the PREOBE cohort study. Acta Diabetol. 2019, 56, 421–430. [Google Scholar] [CrossRef]
- Lu, Y.-P.; Reichetzeder, C.; Prehn, C.; Von Websky, K.; Slowinski, T.; Chen, Y.-P.; Yin, L.-H.; Kleuser, B.; Yang, X.-S.; Adamski, J.; et al. Fetal Serum Metabolites Are Independently Associated with Gestational Diabetes Mellitus. Cell. Physiol. Biochem. 2018, 45, 625–638. [Google Scholar] [CrossRef]
- Mansell, T.; Vlahos, A.; Collier, F.; Ponsonby, A.-L.; Vuillermin, P.; Ellul, S.; Tang, M.L.K.; Burgner, D.; Saffery, R.; Carlin, J.; et al. The newborn metabolome: Associations with gestational diabetes, sex, gestation, birth mode, and birth weight. Pediatr. Res. 2021, 1–10. [Google Scholar] [CrossRef]
- López-Hernández, Y.; Oropeza-Valdez, J.J.; Blanco-Sandate, J.O.; Oostdam, A.S.H.-V.; Zheng, J.; Guo, A.C.; Lima-Rogel, V.; Rajabzadeh, R.; Salgado-Bustamante, M.; Adrian-Lopez, J.; et al. The Urinary Metabolome of Healthy Newborns. Metabolites 2020, 10, 165. [Google Scholar] [CrossRef] [PubMed]
- Hsu, C.-N.; Tain, Y.-L. Impact of Arginine Nutrition and Metabolism during Pregnancy on Offspring Outcomes. Nutrients 2019, 11, 1452. [Google Scholar] [CrossRef]
- Martín, R.S.; Sobrevia, L. Gestational diabetes and the adenosine/l-Arginine/nitric oxide (ALANO) pathway in human umbilical vein endothelium. Placenta 2006, 27, 1–10. [Google Scholar] [CrossRef]
- Codoñer-Franch, P.; Tavárez-Alonso, S.; Murria-Estal, R.; Herrera-Martín, G.; Alonso-Iglesias, E. Polyamines Are Increased in Obese Children and Are Related to Markers of Oxidative/Nitrosative Stress and Angiogenesis. J. Clin. Endocrinol. Metab. 2011, 96, 2821–2825. [Google Scholar] [CrossRef] [PubMed]
- Tofalo, R.; Cocchi, S.; Suzzi, G. Polyamines and Gut Microbiota. Front. Nutr. 2019, 6, 16. [Google Scholar] [CrossRef] [PubMed]
- Ali, M.A.; Strandvik, B.; Palme-Kilander, C.; Yngve, A. Lower polyamine levels in breast milk of obese mothers compared to mothers with normal body weight. J. Hum. Nutr. Diet. 2013, 26, 164–170. [Google Scholar] [CrossRef]
- Pappa, K.I.; Anagnou, N.P.; Salamalekis, E.; Bikouvarakis, S.; Maropoulos, G.; Anogianaki, N.; Evangeliou, A.; Koumantakis, E. Gestational diabetes exhibits lack of carnitine deficiency despite relatively low carnitine levels and alterations in ketogenesis. J. Matern. Neonatal Med. 2005, 17, 63–68. [Google Scholar] [CrossRef] [PubMed]
- Adams, S.; Hoppel, C.L.; Lok, K.H.; Zhao, L.; Wong, S.W.; Minkler, P.E.; Hwang, D.H.; Newman, J.; Garvey, W.T. Plasma Acylcarnitine Profiles Suggest Incomplete Long-Chain Fatty Acid β-Oxidation and Altered Tricarboxylic Acid Cycle Activity in Type 2 Diabetic African-American Women. J. Nutr. 2009, 139, 1073–1081. [Google Scholar] [CrossRef]
- Möder, M.; Kießling, A.; Löster, H.; Brüggemann, L. The pattern of urinary acylcarnitines determined by electrospray mass spectrometry: A new tool in the diagnosis of diabetes mellitus. Anal. Bioanal. Chem. 2003, 375, 200–210. [Google Scholar] [CrossRef]
- Mihalik, S.J.; Goodpaster, B.H.; Kelley, D.E.; Chace, D.H.; Vockley, J.; Toledo, F.; Delany, J.P. Increased Levels of Plasma Acylcarnitines in Obesity and Type 2 Diabetes and Identification of a Marker of Glucolipotoxicity. Obesity 2010, 18, 1695–1700. [Google Scholar] [CrossRef]
- Lin, Y.; Wu, J.; Zhu, Y.; Hinkle, S.N.; Rawal, S.; Liang, L.; Weir, N.L.; Tsai, M.Y.; Zhang, C. A longitudinal study of plasma acylcarnitines throughout pregnancy and associations with risk of gestational diabetes mellitus. Clin. Nutr. 2021, 40, 4863–4870. [Google Scholar] [CrossRef]
- Batchuluun, B.; Al Rijjal, D.; Prentice, K.J.; Eversley, J.A.; Burdett, E.; Mohan, H.; Bhattacharjee, A.; Gunderson, E.P.; Liu, Y.; Wheeler, M.B. Elevated Medium-Chain Acylcarnitines Are Associated With Gestational Diabetes Mellitus and Early Progression to Type 2 Diabetes and Induce Pancreatic β-Cell Dysfunction. Diabetes 2018, 67, 885–897. [Google Scholar] [CrossRef]
- Sánchez-Pintos, P.; De Castro, M.-J.; Roca, I.; Rite, S.; López, M.; Couce, M.L. Similarities between acylcarnitine profiles in large for gestational age newborns and obesity. Sci. Rep. 2017, 7, 16267. [Google Scholar] [CrossRef]
- Liu, X.; Wang, X.; Sun, H.; Guo, Z.; Liu, X.; Yuan, T.; Fu, Y.; Tang, X.; Li, J.; Sun, W.; et al. Urinary metabolic variation analysis during pregnancy and application in Gestational Diabetes Mellitus and spontaneous abortion biomarker discovery. Sci. Rep. 2019, 9, 2605. [Google Scholar] [CrossRef] [PubMed]
- Sachse, D.; Sletner, L.; Mørkrid, K.; Jenum, A.K.; Birkeland, K.I.; Rise, F.; Piehler, A.P.; Berg, J.P. Metabolic Changes in Urine during and after Pregnancy in a Large, Multiethnic Population-Based Cohort Study of Gestational Diabetes. PLoS ONE 2012, 7, e52399. [Google Scholar] [CrossRef] [PubMed]
- Dudzik, D.; Zorawski, M.; Skotnicki, M.; Zarzycki, W.; Kozlowska, G.; Bibik-Malinowska, K.; Vallejo, M.; García, A.; Barbas, C.; Ramos, M.P. Metabolic fingerprint of Gestational Diabetes Mellitus. J. Proteom. 2014, 103, 57–71. [Google Scholar] [CrossRef]
- Graça, G.; Goodfellow, B.J.; Barros, A.S.; Diaz, S.; Duarte, I.F.; Spagou, K.; Veselkov, K.; Want, E.J.; Lindon, J.C.; Carreira, I.M.; et al. UPLC-MS metabolic profiling of second trimester amniotic fluid and maternal urine and comparison with NMR spectral profiling for the identification of pregnancy disorder biomarkers. Mol. BioSyst. 2012, 8, 1243–1254. [Google Scholar] [CrossRef] [PubMed]
- Law, K.P.; Han, T.-L.; Mao, X.; Zhang, H. Tryptophan and purine metabolites are consistently upregulated in the urinary metabolome of patients diagnosed with gestational diabetes mellitus throughout pregnancy: A longitudinal metabolomics study of Chinese pregnant women part 2. Clin. Chim. Acta 2017, 468, 126–139. [Google Scholar] [CrossRef]
- Granado-Serrano, A.B.; Martín-Garí, M.; Sánchez, V.; Solans, M.R.; Berdún, R.; Ludwig, I.A.; Rubió, L.; Vilaprinyo, E.; Portero-Otin, M.; Serrano, J.C.E. Faecal bacterial and short-chain fatty acids signature in hypercholesterolemia. Sci. Rep. 2019, 9, 1772. [Google Scholar] [CrossRef]
- Ferrocino, I.; Ponzo, V.; Gambino, R.; Zarovska, A.; Leone, F.; Monzeglio, C.; Goitre, I.; Rosato, R.; Romano, A.; Grassi, G.; et al. Changes in the gut microbiota composition during pregnancy in patients with gestational diabetes mellitus (GDM). Sci. Rep. 2018, 8, 12216. [Google Scholar] [CrossRef]
- Chávez-Carbajal, A.; Nirmalkar, K.; Pérez-Lizaur, A.; Hernández-Quiroz, F.; Ramírez-Del-Alto, S.; García-Mena, J.; Hernández-Guerrero, C. Gut Microbiota and Predicted Metabolic Pathways in a Sample of Mexican Women Affected by Obesity and Obesity Plus Metabolic Syndrome. Int. J. Mol. Sci. 2019, 20, 438. [Google Scholar] [CrossRef]
- Ramos-Molina, B.; Queipo-Ortuño, M.I.; Lambertos, A.; Tinahones, F.J.; Peñafiel, R. Dietary and Gut Microbiota Polyamines in Obesity- and Age-Related Diseases. Front. Nutr. 2019, 6, 24. [Google Scholar] [CrossRef] [PubMed]
- Zheng, J.; Zhang, L.; Johnson, M.; Mandal, R.; Wishart, D.S. Comprehensive Targeted Metabolomic Assay for Urine Analysis. Anal. Chem. 2020, 92, 10627–10634. [Google Scholar] [CrossRef] [PubMed]
- Wishart, D.S. Computational Approaches to Metabolomics. Methods Mol. Biol. 2009, 593, 283–313. [Google Scholar] [CrossRef]
- Xia, J.; Wishart, D.S. Using MetaboAnalyst 3.0 for Comprehensive Metabolomics Data Analysis. Curr. Protoc. Bioinform. 2016, 55, 14.10.1–14.10.91. [Google Scholar] [CrossRef] [PubMed]
- Jafari, M.; Ansari-Pour, N. Why, When and How to Adjust Your P Values? Cell J. 2018, 20, 604–607. [Google Scholar] [CrossRef]


| Characteristics | GDM | Healthy | p-Value * |
|---|---|---|---|
| Newborns, n (%) | 26 (54.1) | 22 (45.8) | |
| Sex, n (%) b | |||
| Female | 16 (61.5) | 4 (18.1) | 0.003 ** |
| Male | 10 (38.4) | 18 (81.8) | |
| Gestational age (weeks) a | 38.5 ± 1.3 | 38.3 ± 1.2 | 0.5 |
| APGAR score, min 1 b | 8 (100.0) | 8 (100.0) | 1.00 |
| APGAR score, min 5 b | 9 (100.0) | 9 (100.0) | 1.00 |
| Silverman-Anderson score b | 0 (100.0) | 0 (100.0) | 1.00 |
| Weight (g) a | 3026 ± 399 | 2943 ± 477 | 0.4 |
| Delivery, n (%) b | |||
| Vaginal | 9 (34.6) | 13 (59.1) | 0.1 |
| C-section | 17 (65.4) | 9 (40.9) | |
| Mothers, n (%) | 26 (54.1) | 22 (45.8) | |
| Age (years) a | 28.4 ± 4.7 | 25.6 ± 2.2 | 0.05 |
| Pre-BMI (Kg/m2) a | 27.87 ± 4.12 | 25.58 ± 4.22 | 0.06 |
| Normal weight, n (%) b | 8 (30.8) | 10 (45.5) | 0.3 |
| Overweight, n (%) b | 10 (38.5) | 9 (40.9) | 0.3 |
| Obese, n (%) b | 8 (30.8) | 3 (13.6) | 0.3 |
| Glucose (mg/dL) a | 86.94 ± 13.3 | 79.81 ± 8.7 | 0.03 * |
| Creatinine (mg/dL) a | 0.56 ± 0.08 | 0.57 ± 0.09 | 0.6 |
| Urea (mg/dL) a | 14.26 ± 4.0 | 14.19 ± 3.91 | 1.0 |
| Hemoglobin (g/dL) a | 13.02 ± 1.0 | 12.81 ± 0.75 | 0.4 |
| Leucocytes (×103) a | 9.01 ± 2.65 | 8.34 ± 1.70 | 0.3 |
| SBP (mm Hg) a | 113.1 ± 8.7 | 108.2 ± 9.6 | 0.07 |
| DBP (mm Hg) a | 74.23 ± 7.02 | 72.73 ± 7.67 | 0.5 |
| Treatment, n (%) | |||
| Metformin | 15 (57.7) | ||
| Diet and exercise | 10 (38.5) | ||
| Insulin + Metformin | 1 (3.8) |
| Metabolite | Healthy Newborns | GDM Newborns | p Value |
|---|---|---|---|
| Median (2.5–97.5 IQR) (μM/mM Creatinine) | Median (2.5–97.5 IQR) (μM/mM Creatinine) | ||
| trans-Hydroxyproline | 36.0 (8.1–96.65) | 26.4 (11.31–60.82) | 0.01 |
| Glutamic acid | 7.4 (1.88–25.28) | 12.4 (3.72–36.52) | 0.01 |
| DOPA | 0.06 (0.02–0.17) | 0.04 (0.01–0.08) | 0.04 |
| Spermine | 0.03 (0.007–0.09) | 0.04 (0.006–0.72) | 0.003 * |
| Lactic acid | 85.6 (46.95–797.5) | 112.0 (47.14–359.8) | 0.04 |
| Butyric acid | 0.33 (0.12–0.9) | 0.22 (0.06–0.7) | 0.02 |
| Isobutyric acid | 0.08 (0.03–1.0) | 0.05 (0.02–1.0) | 0.03 |
| Glutaconylcarnitine (C5:1DC) | 0.02 (0.008–0.03) | 0.01 (0.005–0.03) | 0.009 * |
| Glutarylcarnitine (C5DC) | 0.05 (0.03–0.1) | 0.04 (0.02–0.06) | 0.006 * |
| C10:2 | 0.03 (0.02–0.07) | 0.03 (0.014–0.05) | 0.01 |
| Hexadecenoylcarnitine (C16:1) | 0.012 (0.007–0.03) | 0.009 (0.004–0.027) | 0.01 |
Publisher’s Note: MDPI stays neutral with regard to jurisdictional claims in published maps and institutional affiliations. |
© 2021 by the authors. Licensee MDPI, Basel, Switzerland. This article is an open access article distributed under the terms and conditions of the Creative Commons Attribution (CC BY) license (https://creativecommons.org/licenses/by/4.0/).
Share and Cite
Herrera-Van Oostdam, A.S.; Salgado-Bustamante, M.; Lima-Rogel, V.; Oropeza-Valdez, J.J.; López, J.A.; Rodríguez, I.D.R.; Toro-Ortiz, J.C.; Herrera-Van Oostdam, D.A.; López-Hernández, Y.; Monárrez-Espino, J. Urinary Metabolomic Profile of Neonates Born to Women with Gestational Diabetes Mellitus. Metabolites 2021, 11, 723. https://doi.org/10.3390/metabo11110723
Herrera-Van Oostdam AS, Salgado-Bustamante M, Lima-Rogel V, Oropeza-Valdez JJ, López JA, Rodríguez IDR, Toro-Ortiz JC, Herrera-Van Oostdam DA, López-Hernández Y, Monárrez-Espino J. Urinary Metabolomic Profile of Neonates Born to Women with Gestational Diabetes Mellitus. Metabolites. 2021; 11(11):723. https://doi.org/10.3390/metabo11110723
Chicago/Turabian StyleHerrera-Van Oostdam, Ana Sofía, Mariana Salgado-Bustamante, Victoria Lima-Rogel, Juan José Oropeza-Valdez, Jesús Adrián López, Iván Daniel Román Rodríguez, Juan Carlos Toro-Ortiz, David Alejandro Herrera-Van Oostdam, Yamilé López-Hernández, and Joel Monárrez-Espino. 2021. "Urinary Metabolomic Profile of Neonates Born to Women with Gestational Diabetes Mellitus" Metabolites 11, no. 11: 723. https://doi.org/10.3390/metabo11110723
APA StyleHerrera-Van Oostdam, A. S., Salgado-Bustamante, M., Lima-Rogel, V., Oropeza-Valdez, J. J., López, J. A., Rodríguez, I. D. R., Toro-Ortiz, J. C., Herrera-Van Oostdam, D. A., López-Hernández, Y., & Monárrez-Espino, J. (2021). Urinary Metabolomic Profile of Neonates Born to Women with Gestational Diabetes Mellitus. Metabolites, 11(11), 723. https://doi.org/10.3390/metabo11110723