
Identification of Possible Salivary Metabolic Biomarkers and Altered Metabolic Pathways in South American Patients Diagnosed with Oral Squamous Cell Carcinoma

 , ,
, ,  ,
,  ,
,
Abstract
1. Introduction
2. Results
2.1. Demographic Data
2.2. Metabolomic Analysis
2.3. Analysis of Altered Metabolic Pathways in the OSCC Group
2.4. Analysis of Possible Salivary Biomarkers for the OSCC Group
3. Discussion
3.1. The Malate-Aspartate Shuttle Pathway
3.2. Warburg Effect Pathway
3.3. Beta-Alanine Pathway
3.4. Biomarkers
4. Materials and Methods
4.1. Collection and Storage of Salivary Samples
4.2. Preparation and Metabolomic Analysis of Salivary Samples
- MRM analysis method
- running time: 67 min
- injection temperature: 280 °C
- interface temperature: 280 °C
- ionization source temperature: 200 °C
- heating rate: from 100 °C to 320 °C in a linear ramp of 4 °C/min, remaining at this temperature for 8 min.
4.3. Statistical Analysis
5. Conclusions
Author Contributions
Funding
Institutional Review Board Statement
Informed Consent Statement
Data Availability Statement
Acknowledgments
Conflicts of Interest
References
- MacCarthy, D.; Flint, S.R.; Healy, C.; Stassen, L.F. Oral and neck examination for early detection of oral cancer–A practical guide. J. Ir. Dent. Assoc. 2011, 57, 195–199. [Google Scholar]
- Bray, F.; Ferlay, J.; Soerjomataram, I.; Siegel, R.L.; Torre, L.A.; Jemal, A. Global cancer statistics 2018: GLOBOCAN estimates of incidence and mortality worldwide for 36 cancers in 185 countries. CA Cancer J. Clin. 2018, 68, 394–424. [Google Scholar] [CrossRef]
- Rivera, C. Essentials of oral cancer. Int. J. Clin. Exp. Pathol. 2015, 8, 11884–11894. [Google Scholar] [PubMed]
- Neville, B.W.; Day, T.A. Oral cancer and precancerous lesions. CA Cancer J. Clin. 2002, 52, 195–215. [Google Scholar] [CrossRef]
- Chen, J.K.; Katz, R.V.; Krutchkoff, D.J. Intraoral squamous cell carcinoma. Epidemiologic patterns in Connecticut from 1935 to 1985. Cancer 1990, 66, 1288–1296. [Google Scholar] [CrossRef]
- Schantz, S.P.; Yu, G.P. Head and neck cancer incidence trends in young Americans, 1973-1997, with a special analysis for tongue cancer. Arch. Otolaryngol. Head Neck Surg. 2002, 128, 268–274. [Google Scholar] [CrossRef] [PubMed]
- Dumache, R.; Rogobete, A.F.; Andreescu, N.; Puiu, M. Genetic and Epigenetic Biomarkers of Molecular Alterations in Oral Carcinogenesis. Clin. Lab. 2015, 61, 1373–1381. [Google Scholar] [CrossRef] [PubMed]
- Gomez, I.; Seoane, J.; Varela-Centelles, P.; Diz, P.; Takkouche, B. Is diagnostic delay related to advanced-stage oral cancer? A meta-analysis. Eur. J. Oral Sci. 2009, 117, 541–546. [Google Scholar] [CrossRef]
- Scott, S.E.; Grunfeld, E.A.; McGurk, M. The idiosyncratic relationship between diagnostic delay and stage of oral squamous cell carcinoma. Oral Oncol. 2005, 41, 396–403. [Google Scholar] [CrossRef] [PubMed]
- Fontes, P.C.; Correa, G.H.; Issa, J.S.; Brandao, A.A.; Almeida, J.D. Comparison of exfoliative pap stain and AgNOR counts of the tongue in smokers and nonsmokers. Head Neck Pathol. 2008, 2, 157–162. [Google Scholar] [CrossRef] [PubMed]
- Guneri, P.; Epstein, J.B. Late stage diagnosis of oral cancer: Components and possible solutions. Oral Oncol. 2014, 50, 1131–1136. [Google Scholar] [CrossRef]
- Sahingur, S.E.; Yeudall, W.A. Chemokine function in periodontal disease and oral cavity cancer. Front. Immunol. 2015, 6, 214. [Google Scholar] [CrossRef] [PubMed]
- Califano, J.; van der Riet, P.; Westra, W.; Nawroz, H.; Clayman, G.; Piantadosi, S.; Corio, R.; Lee, D.; Greenberg, B.; Koch, W.; et al. Genetic progression model for head and neck cancer: Implications for field cancerization. Cancer Res. 1996, 56, 2488–2492. [Google Scholar] [CrossRef]
- Santosh, A.B.; Jones, T.; Harvey, J. A review on oral cancer biomarkers: Understanding the past and learning from the present. J. Cancer Res. Ther. 2016, 12, 486–492. [Google Scholar] [CrossRef]
- Mikkonen, J.J.; Singh, S.P.; Herrala, M.; Lappalainen, R.; Myllymaa, S.; Kullaa, A.M. Salivary metabolomics in the diagnosis of oral cancer and periodontal diseases. J. Periodontal Res. 2016, 51, 431–437. [Google Scholar] [CrossRef]
- Singh, P.; Verma, J.K.; Singh, J.K. Validation of Salivary Markers, IL-1beta, IL-8 and Lgals3bp for Detection of Oral Squamous Cell Carcinoma in an Indian Population. Sci. Rep. 2020, 10, 7365. [Google Scholar] [CrossRef]
- Mishra, A.; Verma, M. Cancer biomarkers: Are we ready for the prime time? Cancers 2010, 2, 190–208. [Google Scholar] [CrossRef] [PubMed]
- Clayton, T.A.; Lindon, J.C.; Cloarec, O.; Antti, H.; Charuel, C.; Hanton, G.; Provost, J.P.; Le Net, J.L.; Baker, D.; Walley, R.J.; et al. Pharmaco-metabonomic phenotyping and personalized drug treatment. Nature 2006, 440, 1073–1077. [Google Scholar] [CrossRef] [PubMed]
- Fiehn, O. Metabolomics–The link between genotypes and phenotypes. Plant Mol. Biol. 2002, 48, 155–171. [Google Scholar] [CrossRef] [PubMed]
- Holmes, E.; Wilson, I.D.; Nicholson, J.K. Metabolic phenotyping in health and disease. Cell 2008, 134, 714–717. [Google Scholar] [CrossRef]
- Chicharro, J.L.; Lucia, A.; Perez, M.; Vaquero, A.F.; Urena, R. Saliva composition and exercise. Sports Med. 1998, 26, 17–27. [Google Scholar] [CrossRef]
- Bigler, L.R.; Streckfus, C.F.; Dubinsky, W.P. Salivary biomarkers for the detection of malignant tumors that are remote from the oral cavity. Clin. Lab. Med. 2009, 29, 71–85. [Google Scholar] [CrossRef]
- Samaranayake, L. Saliva as a diagnostic fluid. Int. Dent. J. 2007, 57, 295–299. [Google Scholar] [CrossRef]
- Wong, D.T. Towards a simple, saliva-based test for the detection of oral cancer ‘oral fluid (saliva), which is the mirror of the body, is a perfect medium to be explored for health and disease surveillance’. Expert Rev. Mol. Diagn. 2006, 6, 267–272. [Google Scholar] [CrossRef]
- Wong, D.T. Salivary diagnostics for oral cancer. J. Calif. Dent. Assoc. 2006, 34, 303–308. [Google Scholar] [PubMed]
- Humphrey, S.P.; Williamson, R.T. A review of saliva: Normal composition, flow, and function. J. Prosthet. Dent. 2001, 85, 162–169. [Google Scholar] [CrossRef]
- Ishikawa, S.; Sugimoto, M.; Kitabatake, K.; Sugano, A.; Nakamura, M.; Kaneko, M.; Ota, S.; Hiwatari, K.; Enomoto, A.; Soga, T.; et al. Identification of salivary metabolomic biomarkers for oral cancer screening. Sci. Rep. 2016, 6, 31520. [Google Scholar] [CrossRef]
- Ishikawa, S.; Sugimoto, M.; Edamatsu, K.; Sugano, A.; Kitabatake, K.; Iino, M. Discrimination of oral squamous cell carcinoma from oral lichen planus by salivary metabolomics. Oral Dis. 2020, 26, 35–42. [Google Scholar] [CrossRef] [PubMed]
- Ishikawa, S.; Wong, D.T.W.; Sugimoto, M.; Gleber-Netto, F.O.; Li, F.; Tu, M.; Zhang, Y.; Akin, D.; Iino, M. Identification of salivary metabolites for oral squamous cell carcinoma and oral epithelial dysplasia screening from persistent suspicious oral mucosal lesions. Clin. Oral Investig. 2019, 23, 3557–3563. [Google Scholar] [CrossRef]
- Song, X.; Yang, X.; Narayanan, R.; Shankar, V.; Ethiraj, S.; Wang, X.; Duan, N.; Ni, Y.H.; Hu, Q.; Zare, R.N. Oral squamous cell carcinoma diagnosed from saliva metabolic profiling. Proc. Natl. Acad. Sci. USA 2020, 117, 16167–16173. [Google Scholar] [CrossRef] [PubMed]
- Sugimoto, M.; Wong, D.T.; Hirayama, A.; Soga, T.; Tomita, M. Capillary electrophoresis mass spectrometry-based saliva metabolomics identified oral, breast and pancreatic cancer-specific profiles. Metabolomics 2010, 6, 78–95. [Google Scholar] [CrossRef] [PubMed]
- Wang, J.; Christison, T.T.; Misuno, K.; Lopez, L.; Huhmer, A.F.; Huang, Y.; Hu, S. Metabolomic profiling of anionic metabolites in head and neck cancer cells by capillary ion chromatography with Orbitrap mass spectrometry. Anal. Chem. 2014, 86, 5116–5124. [Google Scholar] [CrossRef]
- Wang, Q.; Gao, P.; Cheng, F.; Wang, X.; Duan, Y. Measurement of salivary metabolite biomarkers for early monitoring of oral cancer with ultra performance liquid chromatography-mass spectrometry. Talanta 2014, 119, 299–305. [Google Scholar] [CrossRef] [PubMed]
- Wang, Q.; Gao, P.; Wang, X.; Duan, Y. The early diagnosis and monitoring of squamous cell carcinoma via saliva metabolomics. Sci. Rep. 2014, 4, 6802. [Google Scholar] [CrossRef] [PubMed]
- Wang, Q.; Gao, P.; Wang, X.; Duan, Y. Investigation and identification of potential biomarkers in human saliva for the early diagnosis of oral squamous cell carcinoma. Clin. Chim. Acta 2014, 427, 79–85. [Google Scholar] [CrossRef]
- Wei, J.; Xie, G.; Zhou, Z.; Shi, P.; Qiu, Y.; Zheng, X.; Chen, T.; Su, M.; Zhao, A.; Jia, W. Salivary metabolite signatures of oral cancer and leukoplakia. Int. J. Cancer 2011, 129, 2207–2217. [Google Scholar] [CrossRef]
- Ohshima, M.; Sugahara, K.; Kasahara, K.; Katakura, A. Metabolomic analysis of the saliva of Japanese patients with oral squamous cell carcinoma. Oncol. Rep. 2017, 37, 2727–2734. [Google Scholar] [CrossRef] [PubMed]
- Lohavanichbutr, P.; Zhang, Y.; Wang, P.; Gu, H.; Nagana Gowda, G.A.; Djukovic, D.; Buas, M.F.; Raftery, D.; Chen, C. Salivary metabolite profiling distinguishes patients with oral cavity squamous cell carcinoma from normal controls. PLoS ONE 2018, 13, e0204249. [Google Scholar] [CrossRef]
- Sridharan, G.; Ramani, P.; Patankar, S. Serum metabolomics in oral leukoplakia and oral squamous cell carcinoma. J. Cancer Res. Ther. 2017, 13, 556–561. [Google Scholar] [CrossRef] [PubMed]
- Awasthi, N. Role of salivary biomarkers in early detection of oral squamous cell carcinoma. Indian J. Pathol. Microbiol. 2017, 60, 464–468. [Google Scholar] [CrossRef]
- Bel’skaya, L.V.; Sarf, E.A.; Solomatin, D.V.; Kosenok, V.K. Diagnostic and Prognostic Value of Salivary Biochemical Markers in Oral Squamous Cell Carcinoma. Diagnostics 2020, 10, 818. [Google Scholar] [CrossRef]
- Mukherjee, P.K.; Funchain, P.; Retuerto, M.; Jurevic, R.J.; Fowler, N.; Burkey, B.; Eng, C.; Ghannoum, M.A. Metabolomic analysis identifies differentially produced oral metabolites, including the oncometabolite 2-hydroxyglutarate, in patients with head and neck squamous cell carcinoma. BBA Clin. 2017, 7, 8–15. [Google Scholar] [CrossRef]
- Nguyen, T.T.H.; Sodnom-Ish, B.; Choi, S.W.; Jung, H.I.; Cho, J.; Hwang, I.; Kim, S.M. Salivary biomarkers in oral squamous cell carcinoma. J. Korean Assoc. Oral Maxillofac. Surg. 2020, 46, 301–312. [Google Scholar] [CrossRef]
- Takeda, I.; Stretch, C.; Barnaby, P.; Bhatnager, K.; Rankin, K.; Fu, H.; Weljie, A.; Jha, N.; Slupsky, C. Understanding the human salivary metabolome. NMR Biomed. 2009, 22, 577–584. [Google Scholar] [CrossRef] [PubMed]
- Kirwan, J.A.; Brennan, L.; Broadhurst, D.; Fiehn, O.; Cascante, M.; Dunn, W.B.; Schmidt, M.A.; Velagapudi, V. Preanalytical Processing and Biobanking Procedures of Biological Samples for Metabolomics Research: A White Paper, Community Perspective (for Precision Medicine and Pharmacometabolomics Task Group—The Metabolomics Society Initiative). Clin. Chem. 2018, 64, 1158–1182. [Google Scholar] [CrossRef]
- Liebsch, C.; Pitchika, V.; Pink, C.; Samietz, S.; Kastenmuller, G.; Artati, A.; Suhre, K.; Adamski, J.; Nauck, M.; Volzke, H.; et al. The Saliva Metabolome in Association to Oral Health Status. J. Dent. Res. 2019, 98, 642–651. [Google Scholar] [CrossRef]
- Gardner, A.; Parkes, H.G.; So, P.W.; Carpenter, G.H. Determining bacterial and host contributions to the human salivary metabolome. J. Oral Microbiol. 2019, 11, 1617014. [Google Scholar] [CrossRef]
- Vitorio, J.G.; Duarte-Andrade, F.F.; Dos Santos Fontes Pereira, T.; Fonseca, F.P.; Amorim, L.S.D.; Martins-Chaves, R.R.; Gomes, C.C.; Canuto, G.A.B.; Gomez, R.S. Metabolic landscape of oral squamous cell carcinoma. Metabolomics 2020, 16, 105. [Google Scholar] [CrossRef]
- Abati, S.; Bramati, C.; Bondi, S.; Lissoni, A.; Trimarchi, M. Oral Cancer and Precancer: A Narrative Review on the Relevance of Early Diagnosis. Int. J. Environ. Res. Public Health 2020, 17, 9160. [Google Scholar] [CrossRef] [PubMed]
- Baumann, E.; Koller, M.; Wiltfang, J.; Wenz, H.J.; Moller, B.; Hertrampf, K. Challenges of early detection of oral cancer: Raising awareness as a first step to successful campaigning. Health Educ. Res. 2016, 31, 136–145. [Google Scholar] [CrossRef][Green Version]
- Gao, W.; Guo, C.B. Factors related to delay in diagnosis of oral squamous cell carcinoma. J. Oral Maxillofac. Surg. 2009, 67, 1015–1020. [Google Scholar] [CrossRef] [PubMed]
- Thomas, A.; Manchella, S.; Koo, K.; Tiong, A.; Nastri, A.; Wiesenfeld, D. The impact of delayed diagnosis on the outcomes of oral cancer patients: A retrospective cohort study. Int. J. Oral Maxillofac. Surg. 2021, 50, 585–590. [Google Scholar] [CrossRef]
- Alam, M.M.; Lal, S.; FitzGerald, K.E.; Zhang, L. A holistic view of cancer bioenergetics: Mitochondrial function and respiration play fundamental roles in the development and progression of diverse tumors. Clin. Transl. Med. 2016, 5, 3. [Google Scholar] [CrossRef]
- Fernie, A.R.; Carrari, F.; Sweetlove, L.J. Respiratory metabolism: Glycolysis, the TCA cycle and mitochondrial electron transport. Curr. Opin. Plant. Biol. 2004, 7, 254–261. [Google Scholar] [CrossRef]
- Krebs, H.A. The citric acid cycle and the Szent-Gyorgyi cycle in pigeon breast muscle. Biochem. J. 1940, 34, 775–779. [Google Scholar] [CrossRef]
- Boyer, P.D.; Cross, R.L.; Momsen, W. A new concept for energy coupling in oxidative phosphorylation based on a molecular explanation of the oxygen exchange reactions. Proc. Natl. Acad. Sci. USA 1973, 70, 2837–2839. [Google Scholar] [CrossRef]
- Borst, P. The aerobic oxidation of reduced diphosphopyridine nucleotide formed by glycolysis in Ehrlich ascites-tumour cells. Biochim. Biophys. Acta 1962, 57, 270–282. [Google Scholar] [CrossRef]
- Borst, P. The malate-aspartate shuttle (Borst cycle): How it started and developed into a major metabolic pathway. IUBMB Life 2020, 72, 2241–2259. [Google Scholar] [CrossRef] [PubMed]
- Liu, J.; Li, J.; Shin, H.D.; Du, G.; Chen, J.; Liu, L. Biological production of L-malate: Recent advances and future prospects. World J. Microbiol. Biotechnol. 2017, 34, 6. [Google Scholar] [CrossRef] [PubMed]
- Liberti, M.V.; Locasale, J.W. The Warburg Effect: How Does it Benefit Cancer Cells? Trends Biochem. Sci. 2016, 41, 211–218. [Google Scholar] [CrossRef]
- Warburg, O. On the origin of cancer cells. Science 1956, 123, 309–314. [Google Scholar] [CrossRef] [PubMed]
- Potter, M.; Newport, E.; Morten, K.J. The Warburg effect: 80 years on. Biochem. Soc. Trans. 2016, 44, 1499–1505. [Google Scholar] [CrossRef]
- Vaupel, P.; Schmidberger, H.; Mayer, A. The Warburg effect: Essential part of metabolic reprogramming and central contributor to cancer progression. Int. J. Radiat. Biol. 2019, 95, 912–919. [Google Scholar] [CrossRef]
- Guppy, M.; Leedman, P.; Zu, X.; Russell, V. Contribution by different fuels and metabolic pathways to the total ATP turnover of proliferating MCF-7 breast cancer cells. Biochem. J. 2002, 364, 309–315. [Google Scholar] [CrossRef]
- Rodriguez-Enriquez, S.; Torres-Marquez, M.E.; Moreno-Sanchez, R. Substrate oxidation and ATP supply in AS-30D hepatoma cells. Arch. Biochem. Biophys. 2000, 375, 21–30. [Google Scholar] [CrossRef] [PubMed]
- Zu, X.L.; Guppy, M. Cancer metabolism: Facts, fantasy, and fiction. Biochem. Biophys. Res. Commun. 2004, 313, 459–465. [Google Scholar] [CrossRef]
- Caruso, J.; Charles, J.; Unruh, K.; Giebel, R.; Learmonth, L.; Potter, W. Ergogenic effects of beta-alanine and carnosine: Proposed future research to quantify their efficacy. Nutrients 2012, 4, 585–601. [Google Scholar] [CrossRef] [PubMed]
- Jordan, T.; Lukaszuk, J.; Misic, M.; Umoren, J. Effect of beta-alanine supplementation on the onset of blood lactate accumulation (OBLA) during treadmill running: Pre/post 2 treatment experimental design. J. Int. Soc. Sports Nutr. 2010, 7, 20. [Google Scholar] [CrossRef] [PubMed]
- Parthasarathy, A.; Savka, M.A.; Hudson, A.O. The Synthesis and Role of beta-Alanine in Plants. Front. Plant Sci. 2019, 10, 921. [Google Scholar] [CrossRef]
- Shetewy, A.; Shimada-Takaura, K.; Warner, D.; Jong, C.J.; Mehdi, A.B.; Alexeyev, M.; Takahashi, K.; Schaffer, S.W. Mitochondrial defects associated with beta-alanine toxicity: Relevance to hyper-beta-alaninemia. Mol. Cell. Biochem. 2016, 416, 11–22. [Google Scholar] [CrossRef] [PubMed]
- Tsuruoka, M.; Hara, J.; Hirayama, A.; Sugimoto, M.; Soga, T.; Shankle, W.R.; Tomita, M. Capillary electrophoresis-mass spectrometry-based metabolome analysis of serum and saliva from neurodegenerative dementia patients. Electrophoresis 2013, 34, 2865–2872. [Google Scholar] [CrossRef]
- Hutschenreuther, A.; Birkenmeier, G.; Bigl, M.; Krohn, K.; Birkemeyer, C. Glycerophosphoglycerol, Beta-alanine, and pantothenic Acid as metabolic companions of glycolytic activity and cell migration in breast cancer cell lines. Metabolites 2013, 3, 1084–1101. [Google Scholar] [CrossRef]
- Hickey, R.J.; Clelland, R.C.; Bowers, E.J. Essential hormones as carcinogenic hazards. J. Occup. Med. 1979, 21, 265–268. [Google Scholar] [PubMed]
- Liang, Q.; Wang, C.; Li, B. Metabolomic Analysis Using Liquid Chromatography/Mass Spectrometry for Gastric Cancer. Appl. Biochem. Biotechnol. 2015, 176, 2170–2184. [Google Scholar] [CrossRef] [PubMed]
- Akada, J.K.; Shirai, M.; Takeuchi, H.; Tsuda, M.; Nakazawa, T. Identification of the urease operon in Helicobacter pylori and its control by mRNA decay in response to pH. Mol. Microbiol. 2000, 36, 1071–1084. [Google Scholar] [CrossRef]
- Huang, S.H.; O’Sullivan, B. Overview of the 8th Edition TNM Classification for Head and Neck Cancer. Curr. Treat. Options Oncol. 2017, 18, 40. [Google Scholar] [CrossRef]
- Barnes, V.M.; Ciancio, S.G.; Shibly, O.; Xu, T.; Devizio, W.; Trivedi, H.M.; Guo, L.; Jonsson, T.J. Metabolomics reveals elevated macromolecular degradation in periodontal disease. J. Dent. Res. 2011, 90, 1293–1297. [Google Scholar] [CrossRef] [PubMed]
- Benjamini, Y.; Drai, D.; Elmer, G.; Kafkafi, N.; Golani, I. Controlling the false discovery rate in behavior genetics research. Behav. Brain Res. 2001, 125, 279–284. [Google Scholar] [CrossRef]
- Ma, H.; Bandos, A.I.; Gur, D. On the use of partial area under the ROC curve for comparison of two diagnostic tests. Biom. J. 2015, 57, 304–320. [Google Scholar] [CrossRef] [PubMed]


| Variable | OSCC 1 (n = 27) | CONTROL (n = 41) | p-Value * |
|---|---|---|---|
| Sex 2 | |||
| Female | 8 (29.6%) | 20 (49%) | 0.3326 |
| Male | 19 (70.4%) | 21 (51%) | 0.9131 |
| Age 3 | 57 ± 13.87 | 57.34 ± 11.66 | 0.9131 |
| (28–88) | (31–86) |
| TNM 1 | OSCC (n = 27) | Control (n = 41) |
|---|---|---|
| T (tumor) | ||
| T1 | 5 (19%) | |
| T2 | 7 (26%) | Not applicable |
| T3 | 6 (22%) | |
| T4 | 9 (33%) | |
| N (node) | ||
| N0 | 14 (52%) | |
| N1 | 4 (15%) | Not applicable |
| N2 | 8 (30%) | |
| N3 | 1 (4%) | |
| M (metastasis) | ||
| M0 | 27 (100%) | Not applicable |
| Stages | ||
| I | 4 (15%) | |
| II | 4 (15%) | Not applicable |
| III | 6 (22%) | |
| IV | 13 (48%) | |
| Smokers | 20 (74%) | 8 (20%) |
| Non smokers | 7 (26%) | 20 (49%) |
| Ex smokers | 0 (0%) | 13 (32%) |
| Racial ethnicity | ||
| Leucoderma | 24 (89%) | 32 (78%) |
| Melanoderm | 1 (4%) | 4 (10%) |
| Pheoderm | 2 (7%) | 4 (10%) |
| Xanthoderm | 0 (0%) | 1 (2%) |
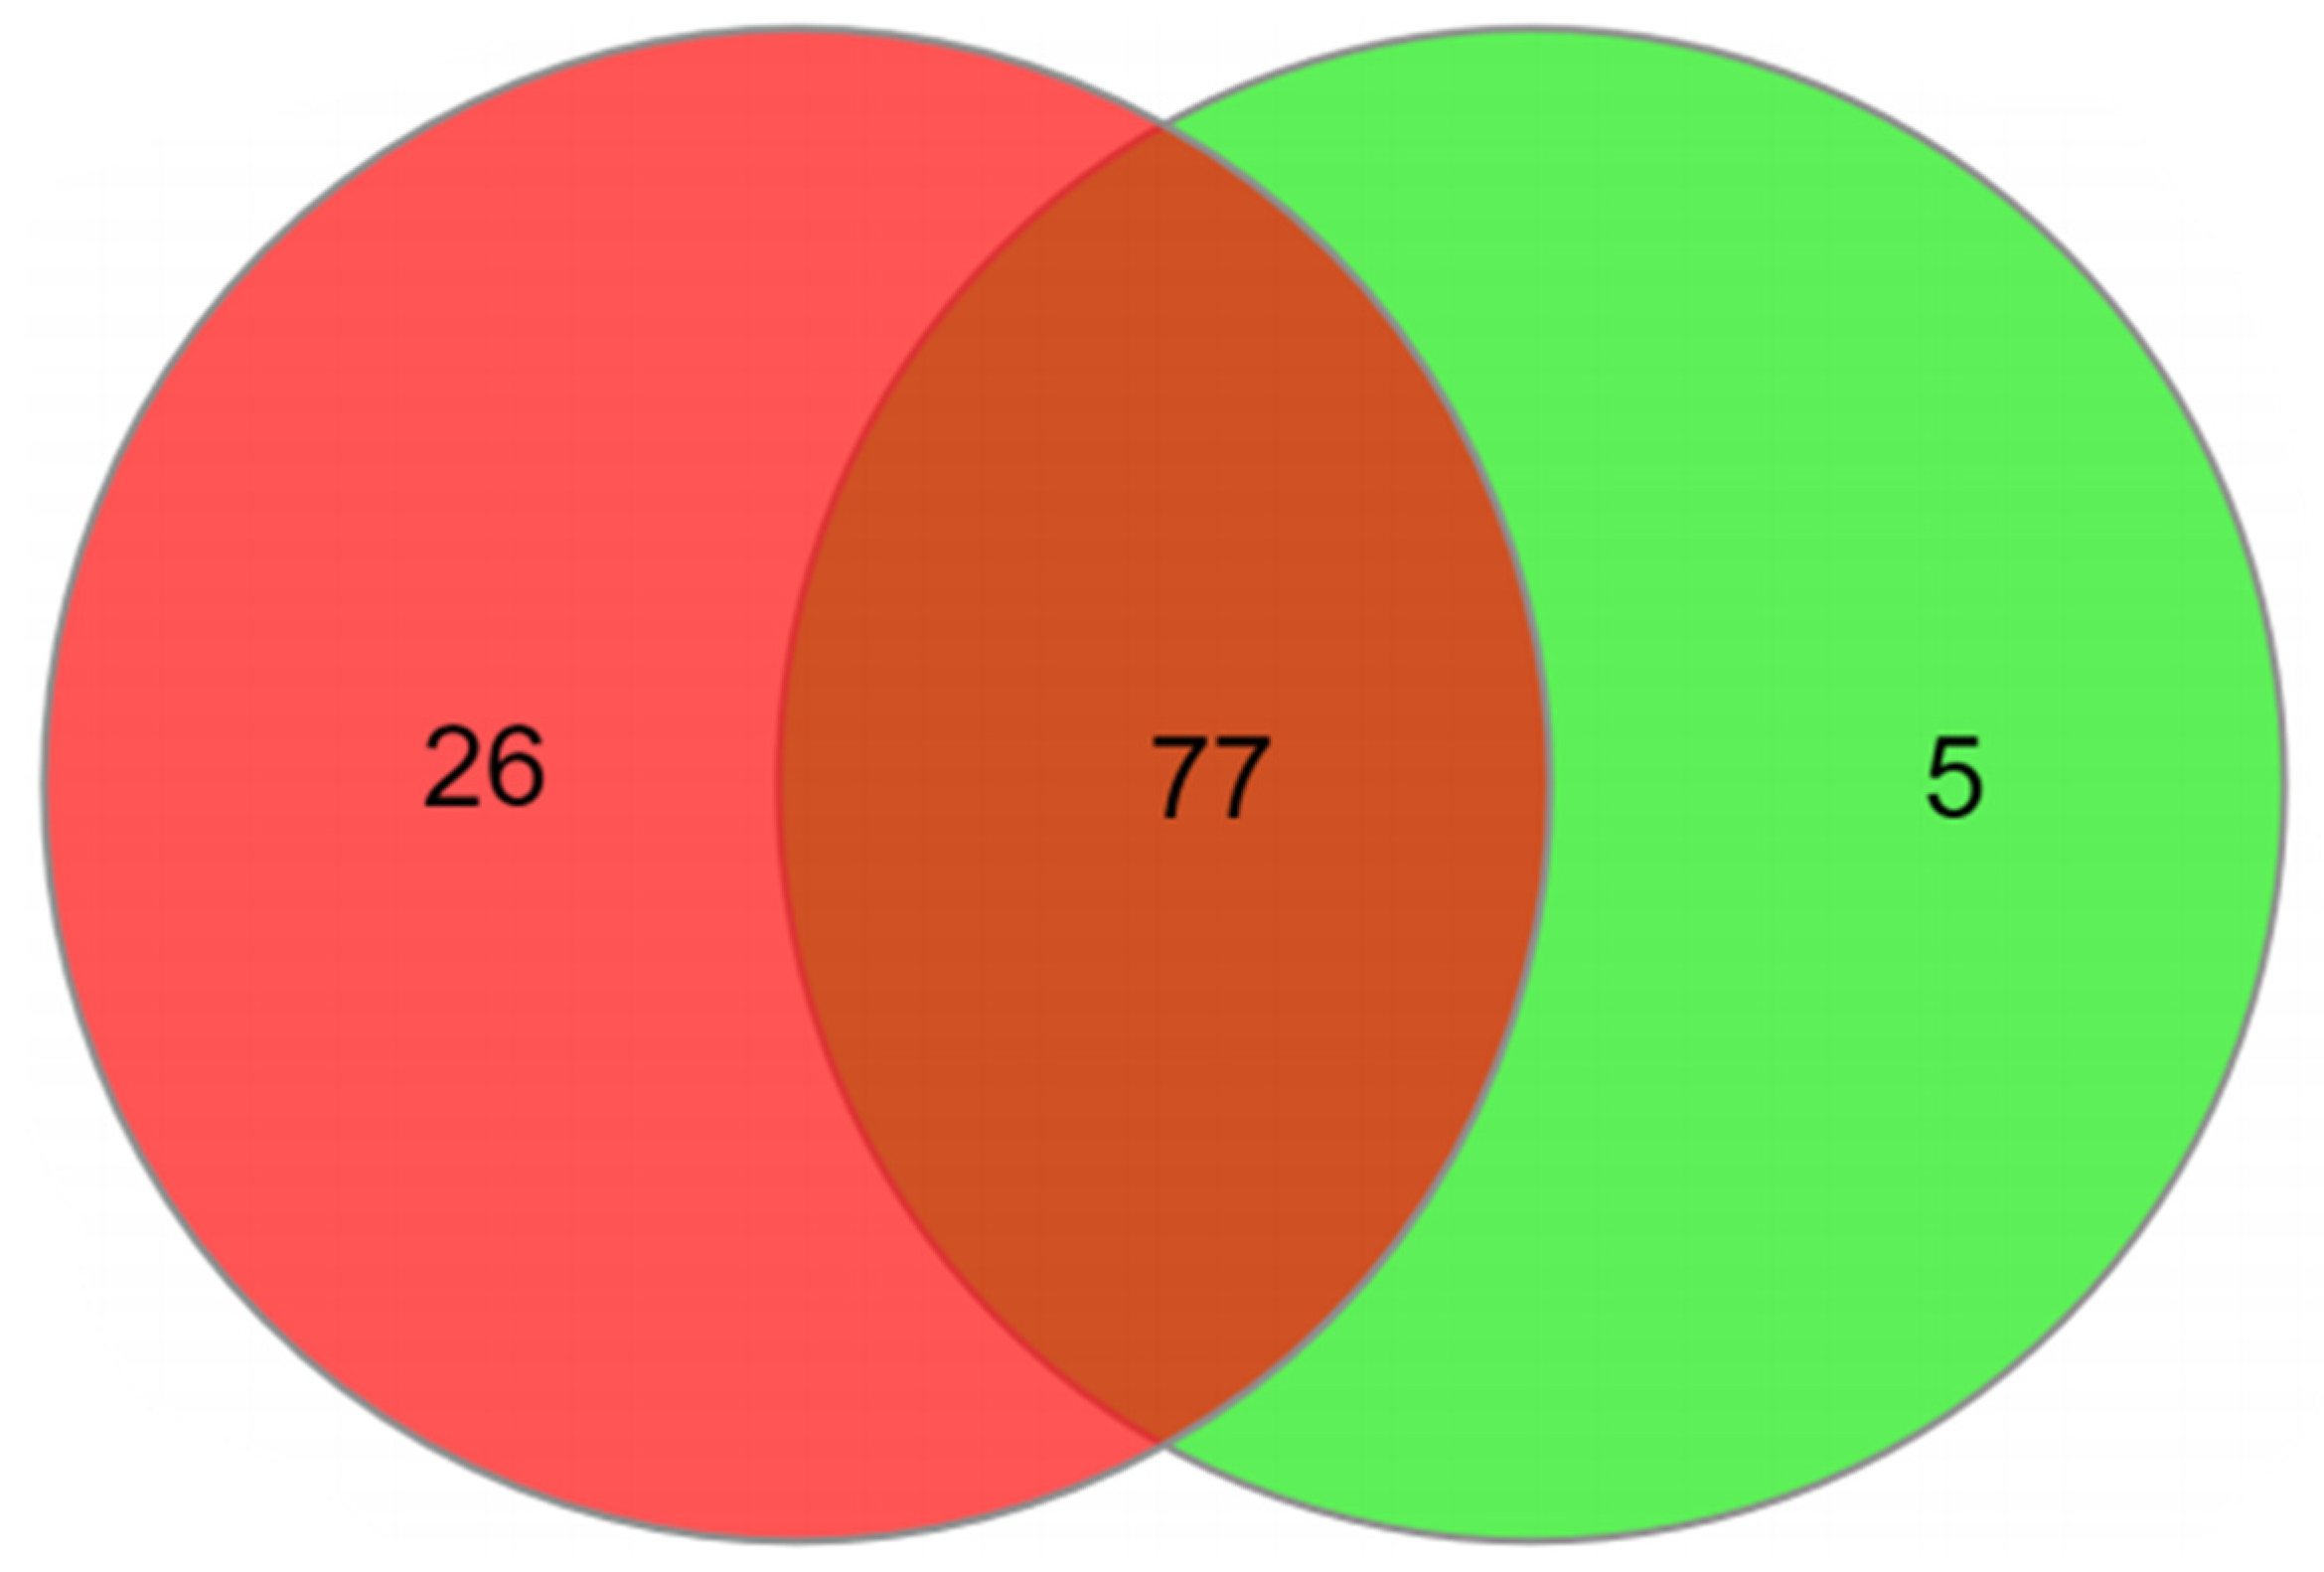
| OSCC | CONTROL | OSCC AND CONTROL |
|---|---|---|
| 2-Hydroxyglutaric acid | 2-Ketoadipic acid | 1,6-Anhydroglucose |
| 2-Ketoglutaric acid | Catechol | 1-Hexadecanol |
| 3-Hydroxypropionic acid | Lactose | 2-Aminoethanol |
| 4-Hydroxyphenyllactic acid | Leucine | 2-Deoxy-glucose |
| Cystamine | Urea | 2-Hydroxyisovaleric acid |
| Dihydroxyacetone phosphate | 3-Aminoglutaric acid | |
| Galacturonic acid | 3-Aminoisobutyric acid | |
| Gluconic acid | 3-Aminopropanoic acid | |
| Hippuric acid | 3-Hydroxyisovaleric acid | |
| Indol-3-acetic acid | 3-Phenyllactic acid | |
| Inosine | 4-Aminobutyric acid | |
| Isocitric acid | 5-Aminovaleric acid | |
| Lactitol | Acetoacetic acid | |
| Lyxose | Adenine | |
| Malic acid | Allose | |
| Maltose | Arabitol | |
| Methionine | Arachidonic acid | |
| O-Phospho-Serine | Arginine | |
| Pantothenic acid | Aspartic acid | |
| Protocatechuic acid | Batyl alcohol | |
| Ribose 5-phosphate | Cadaverine | |
| Sorbose | Caproic acid | |
| Spermidine | Citramalic acid | |
| Thymidine | Citric acid | |
| Uracil | Cysteine | |
| Ureidosuccinic acid | Dopamine | |
| Eicosapentaenoic acid | ||
| Elaidic acid | ||
| Fructose | ||
| Galactosamine | ||
| Galactose | ||
| Glucono-1,5-lactone | ||
| Glucosamine | ||
| Glucose | ||
| Glucuronic acid | ||
| Glutamic acid | ||
| Glycerol | ||
| Glycerol 2-phosphate |
| Metabolites | OSCC | Control | p-Value 1 | q-Value (FDR) 2 | FC | Volcano Plot 3 | ||
|---|---|---|---|---|---|---|---|---|
| Mean | Standard Deviation | Mean | Standard Deviation | |||||
| Lactose * | −1.090 | 0.492 | 0.718 | 0.673 | <0.0001 | 3.1755 × 10⁻¹⁶ | 0.015832 | Down |
| Malic acid ** | 0.917 | 0.622 | −0.604 | 0.444 | <0.0001 | 3.7012 × 10⁻¹⁶ | 40.712 | Up |
| Methionine ** | 1.088 | 0.939 | −0.717 | 0.367 | <0.0001 | 3.0633 × 10⁻¹⁵ | 311.66 | Up |
| Catechol * | −0.952 | 0.521 | 0.627 | 0.734 | <0.0001 | 7.1635 × 10⁻¹³ | 0.035587 | Down |
| 2-Keto adipic acid * | −0.925 | 0.522 | 0.609 | 0.768 | <0.0001 | 6.363 × 10⁻¹² | 0.029706 | Down |
| Maltose ** | 0.889 | 0.959 | −0.586 | 0.407 | <0.0001 | 2.0868 × 10⁻¹¹ | 325.18 | Up |
| Protocatechuic acid ** | 0.806 | 0.827 | −0.531 | 0.447 | <0.0001 | 2.7666 × 10⁻¹¹ | 35.723 | Up |
| Leucine * | −1.177 | 0.394 | 0.775 | 1.173 | <0.0001 | 8.7168 × 10⁻¹¹ | 8.2595 × 10⁻⁴ | Down |
| Inosine ** | 1.070 | 1.317 | −0.704 | 0.330 | <0.0001 | 9.7882 × 10⁻¹¹ | 2873.0 | Up |
| Pantothenic acid ** | 1.153 | 1.459 | −0.759 | 0.304 | <0.0001 | 1.4172 × 10⁻¹⁰ | 4271.4 | Up |
| Urea * | −0.861 | 0.530 | 0.567 | 0.810 | <0.0001 | 1.687 × 10⁻¹⁰ | 0.037894 | Down |
| Dihydroxyacetone phosphate ** | 0.793 | 0.895 | −0.522 | 0.439 | <0.0001 | 1.687 × 10⁻¹⁰ | 45.791 | Up |
| 4-hydroxyphenylactic acid ** | 1.092 | 1.403 | −0.719 | 0.318 | <0.0001 | 2.1476 × 10⁻¹⁰ | 2173.8 | Up |
| Galacturonic acid ** | 0.725 | 0.831 | −0.477 | 0.467 | <0.0001 | 8.9307 × 10⁻¹⁰ | 19.383 | Up |
| Indole-3-acetic acid ** | 0.906 | 1.242 | −0.597 | 0.365 | <0.0001 | 3.0805 × 10⁻⁹ | 341.04 | Up |
| Uracil ** | 0.644 | 0.817 | −0.424 | 0.491 | <0.0001 | 3.04 × 10⁻⁸ | 10.819 | Up |
| Isocitric acid ** | 0.665 | 0.885 | −0.438 | 0.472 | <0.0001 | 3.6657 × 10⁻⁸ | 20.802 | Up |
| Ribose-5-phosphate ** | 0.647 | 0.969 | −0.469 | 0.461 | <0.0001 | 3.1666 × 10⁻⁷ | 41.912 | Up |
| O-Phospho-Serina ** | 0.609 | 0.945 | −0.401 | 0.474 | <0.0001 | 9.548 × 10⁻⁷ | 17.64 | Up |
| Lactitol ** | 0.630 | 1.061 | −0.415 | 0.446 | <0.0001 | 2.1547 × 10⁻⁶ | 41.538 | Up |
| Gluconic acid ** | 0.609 | 1.101 | −0.401 | 0.443 | <0.0001 | 7.7433 × 10⁻⁶ | 183.99 | Up |
| 2-Ketoglutaric acid ** | 0.515 | 0.836 | −0.339 | 0.512 | <0.0001 | 1.3092 × 10⁻⁵ | 6.7421 | Up |
| Hipuric acid ** | 0.518 | 0.888 | −0.341 | 0.506 | <0.0001 | 1.4925 × 10⁻⁵ | 7.3906 | Up |
| Maleic acid | −0.664 | 1.049 | 0.437 | 0.817 | <0.0001 | 3.294 × 10⁻⁵ | 0. 8093 | Down |
| Palmitic acid | −0.430 | 0.657 | 0.283 | 0.551 | <0.0001 | 3.3213 × 10⁻⁵ | 0.38165 | Down |
| 3-hydroxypropionic acid ** | 0.608 | 1.265 | −0.400 | 0.411 | 0.0002 | 4.4319 × 10⁻⁵ | 202.32 | Up |
| Spermidine ** | 0.481 | 0.887 | −0.317 | 0.514 | 0.0001 | 5.3374 × 10⁻⁵ | 10.562 | Up |
| Ornithine | −0.614 | 1.197 | 0.405 | 0.986 | 0.0003 | 0.0010593 | 0.33872 | Down |
| Margaric acid | −0.453 | 1.055 | 0.298 | 0.648 | <0.0001 | 0.0018846 | 0.28057 | Down |
| Sucrose | −0.487 | 1.005 | 0.321 | 0.928 | 0.0002 | 0.0039383 | 0.25406 | Down |
| Octadecanol | −0.310 | 0.666 | 0.204 | 0.628 | 0.0010 | 0.0064518 | 0.56165 | Down |
| Threitol | −0.465 | 1.148 | 0.307 | 0.847 | 0.0012 | 0.0069549 | 0.37775 | Down |
| Acetoacetic acid | −0.373 | 0.732 | 0.246 | 0.826 | 0.0024 | 0.0074047 | 0.25319 | Down |
| Methionine sulfone | −0.306 | 0.767 | 0.202 | 0.582 | 0.0001 | 0.0085698 | 1.123 | Down |
| Phosphoric acid | −0.374 | 0.806 | 0.246 | 0.968 | 0.0103 | 0.022159 | 0.12317 | Down |
| Elaidic acid | −0.254 | 0.578 | 0.167 | 0.722 | 0.0134 | 0.038044 | 0.4826 | Down |
| Mannose | −0.398 | 1.309 | 0.262 | 0.881 | 0.0324 | 0.042273 | 0.51969 | Down |
| Sorbitol | −0.361 | 0.890 | 0.238 | 1.048 | 0.0173 | 0.046325 | 0.11612 | Down |
| Citric acid | −0.416 | 1.200 | 0.274 | 1.111 | 0.0369 | 0.046725 | 0.11946 | Down |
| 3-Aminopropanoic acid | −0.324 | 0.895 | 0.213 | 0.907 | 0.0004 | 0.048905 | 0.39703 | Down |
| Metabolite | AUC |
|---|---|
| Malic acid | 0.98103 |
| Lactose | 0.96387 |
| Catecol | 0.94670 |
| 2-ketoadipic acid | 0.94128 |
| Maltose | 0.93360 |
| Methionine | 0.92502 |
| Urea | 0.92502 |
| Leucine | 0.92322 |
| Inosine | 0.92186 |
| Protocatechuic acid | 0.91192 |
| Dihydroxyacetone phosphate | 0.89657 |
| Galacturonic acid | 0.88573 |
| Margaric acid | 0.86902 |
| Uracil | 0.86721 |
| Isocitric acid | 0.86585 |
| Ribose 5-phosphate | 0.84146 |
| O-Phospho-Serine | 0.82385 |
| Indole-3-acetic acid | 0.82204 |
| Palmitic acid | 0.82204 |
| 2-ketoglutaric acid | 0.81798 |
| Maleic acid | 0.81030 |
| Pantothenic acid | 0.80307 |
| Spermidine | 0.80217 |
| Possible Salivary Metabolic Biomarkers | Studied Population | Notes | References |
|---|---|---|---|
| Malic acid ↑, Lactose ↓, Catecol ↓, 2-Keto adipic acid ↓, Maltose ↑, Methionine ↑, Urea ↓, Leucine ↓, Inosine ↑, Protocatechuic acid ↑ and others metabolites present in Table 3 | South American | We compared OSCC patients with healthy control | This study |
| Lactic acid ↑, phenylalanine ↓, valine ↓ | Not mentioned in the study | They compared OSCC patients with healthy control and oral leukoplasia | [36] |
| L-phenylalanine ↓, L-leucine ↓, Propionylcholine ↑, Acetylphenylalanine ↓, sphinganine ↓, phytosphingosine ↓, S-carboxymethyl-L-cysteine ↓, Choline ↑, betaine ↑, pipecolinic acid ↑, L-carnitine ↓ | Chinese | They compared OSCC patients with healthy control | [32,33,34,35] |
| S-adenosylmethionine ↑, pipecolate ↑ | Not mentioned in the study | Two cases from the oral cancer group were oral melanoma | [28] |
| Ornithine ↓, o-hydroxybenzoate ↓, ribose-5-phosphate ↓ | Caucasian, African American, Hispanic, Asian | They compared OSCC patients and oral epithelial dysplasia patients with the healthy control | [29] |
| Alanine ↑, choline ↑, Leucine + isoleucine ↑, glutamic acid ↑, 120.0801 m/z ↑, phenylalanine ↑, alpha-aminobutyric acid ↑, serine ↑ | Caucasian, Asian, African-American, Hispanic | They compared OSCC patients with healthy control | [31] |
| Indole-3-acetate ↑, ethanolamine phosphate ↑ | Not mentioned in the study | They compared OSCC patients with control patients with oral lichen planus | [27] |
| They studied conductive polymer spray ionization mass spectrometry (CPSI-MS) associated with machine learning (ML) as a viable tool for the diagnosis of OSCC | Chinese | They compared OSCC patients with oral lichen planus and oral leukoplakia controls | [30] |
Publisher’s Note: MDPI stays neutral with regard to jurisdictional claims in published maps and institutional affiliations. |
© 2021 by the authors. Licensee MDPI, Basel, Switzerland. This article is an open access article distributed under the terms and conditions of the Creative Commons Attribution (CC BY) license (https://creativecommons.org/licenses/by/4.0/).
Share and Cite
de Sá Alves, M.; de Sá Rodrigues, N.; Bandeira, C.M.; Chagas, J.F.S.; Pascoal, M.B.N.; Nepomuceno, G.L.J.T.; da Silva Martinho, H.; Alves, M.G.O.; Mendes, M.A.; Dias, M.; et al. Identification of Possible Salivary Metabolic Biomarkers and Altered Metabolic Pathways in South American Patients Diagnosed with Oral Squamous Cell Carcinoma. Metabolites 2021, 11, 650. https://doi.org/10.3390/metabo11100650
de Sá Alves M, de Sá Rodrigues N, Bandeira CM, Chagas JFS, Pascoal MBN, Nepomuceno GLJT, da Silva Martinho H, Alves MGO, Mendes MA, Dias M, et al. Identification of Possible Salivary Metabolic Biomarkers and Altered Metabolic Pathways in South American Patients Diagnosed with Oral Squamous Cell Carcinoma. Metabolites. 2021; 11(10):650. https://doi.org/10.3390/metabo11100650
Chicago/Turabian Stylede Sá Alves, Mariana, Nayara de Sá Rodrigues, Celso Muller Bandeira, José Francisco Sales Chagas, Maria Beatriz Nogueira Pascoal, Gabrielle Luana Jimenez Teodoro Nepomuceno, Herculano da Silva Martinho, Mônica Ghislaine Oliveira Alves, Maria Anita Mendes, Meriellen Dias, and et al. 2021. "Identification of Possible Salivary Metabolic Biomarkers and Altered Metabolic Pathways in South American Patients Diagnosed with Oral Squamous Cell Carcinoma" Metabolites 11, no. 10: 650. https://doi.org/10.3390/metabo11100650
APA Stylede Sá Alves, M., de Sá Rodrigues, N., Bandeira, C. M., Chagas, J. F. S., Pascoal, M. B. N., Nepomuceno, G. L. J. T., da Silva Martinho, H., Alves, M. G. O., Mendes, M. A., Dias, M., Alves, L. A. C., & Almeida, J. D. (2021). Identification of Possible Salivary Metabolic Biomarkers and Altered Metabolic Pathways in South American Patients Diagnosed with Oral Squamous Cell Carcinoma. Metabolites, 11(10), 650. https://doi.org/10.3390/metabo11100650