Discovery of Urinary Biomarkers of Seaweed Intake Using Untargeted LC–MS Metabolomics in a Three-Way Cross-Over Human Study

 , , and
Abstract
:1. Introduction
2. Results
2.1. Data Analysis
2.1.1. Data Preprocessing
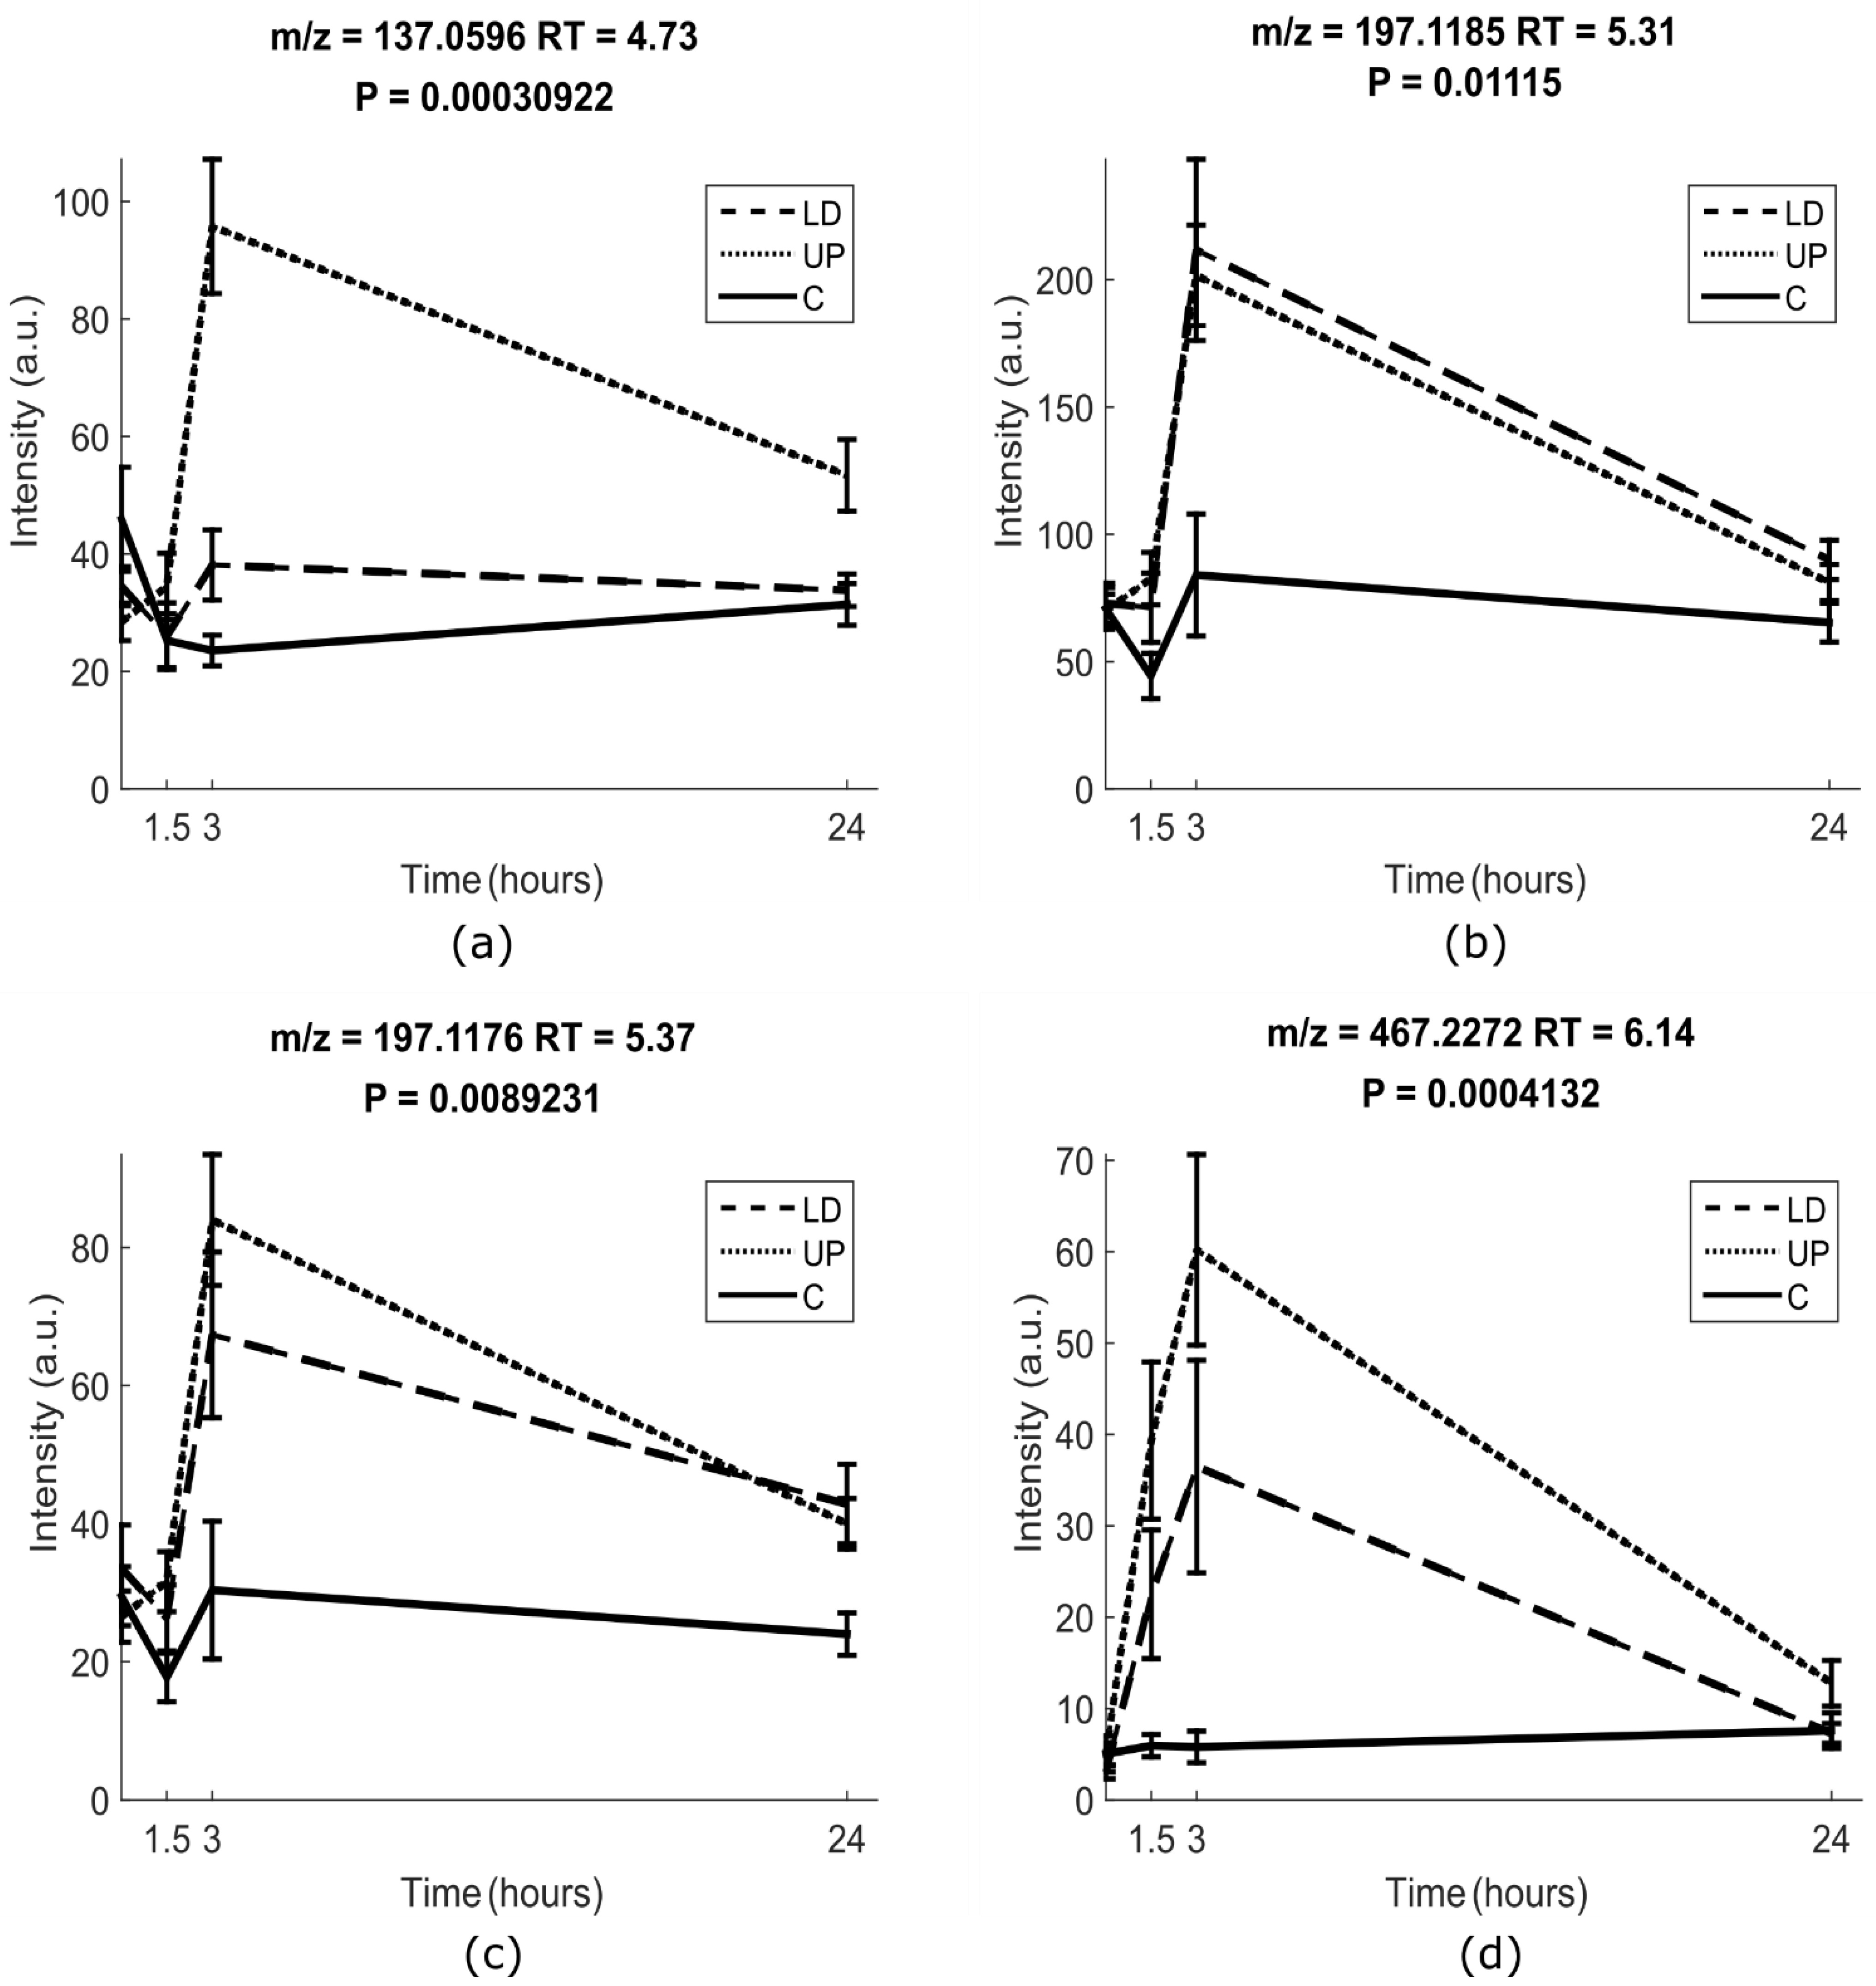
2.1.2. Univariate Analysis
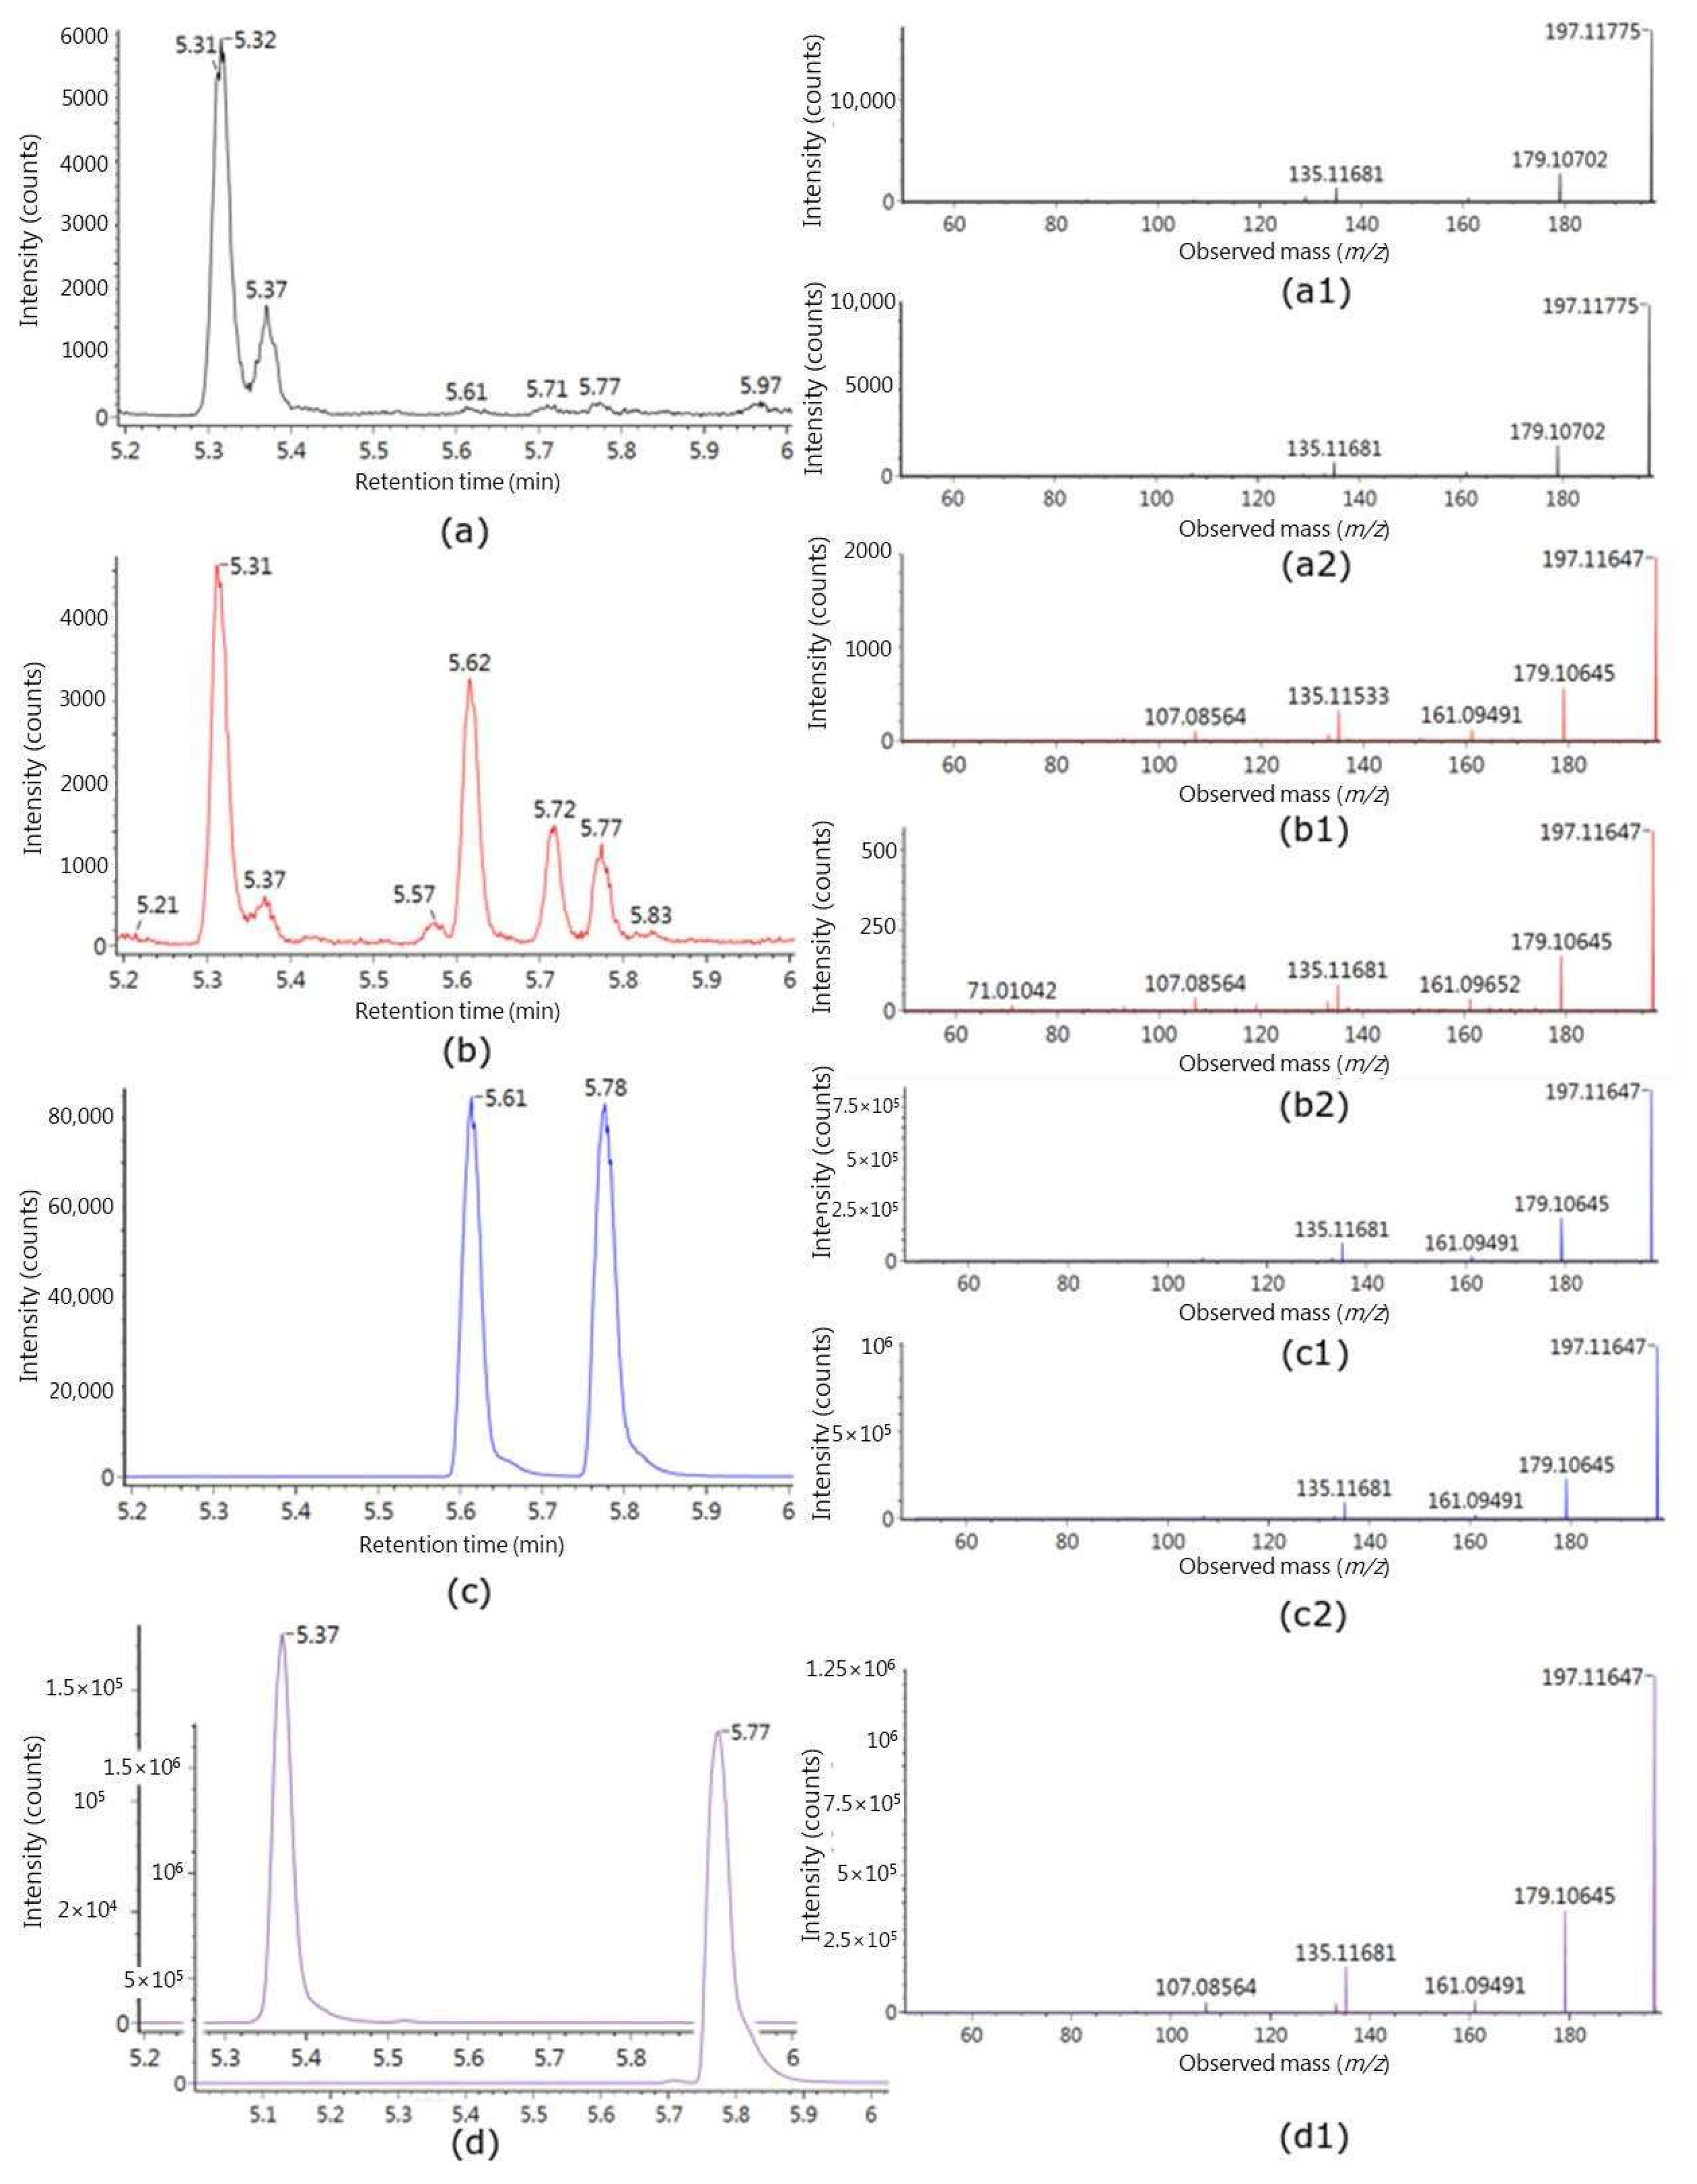
2.2. Identification of Putative Intake Biomarkers of Seaweed
3. Discussion
4. Materials and Methods
4.1. Subjects
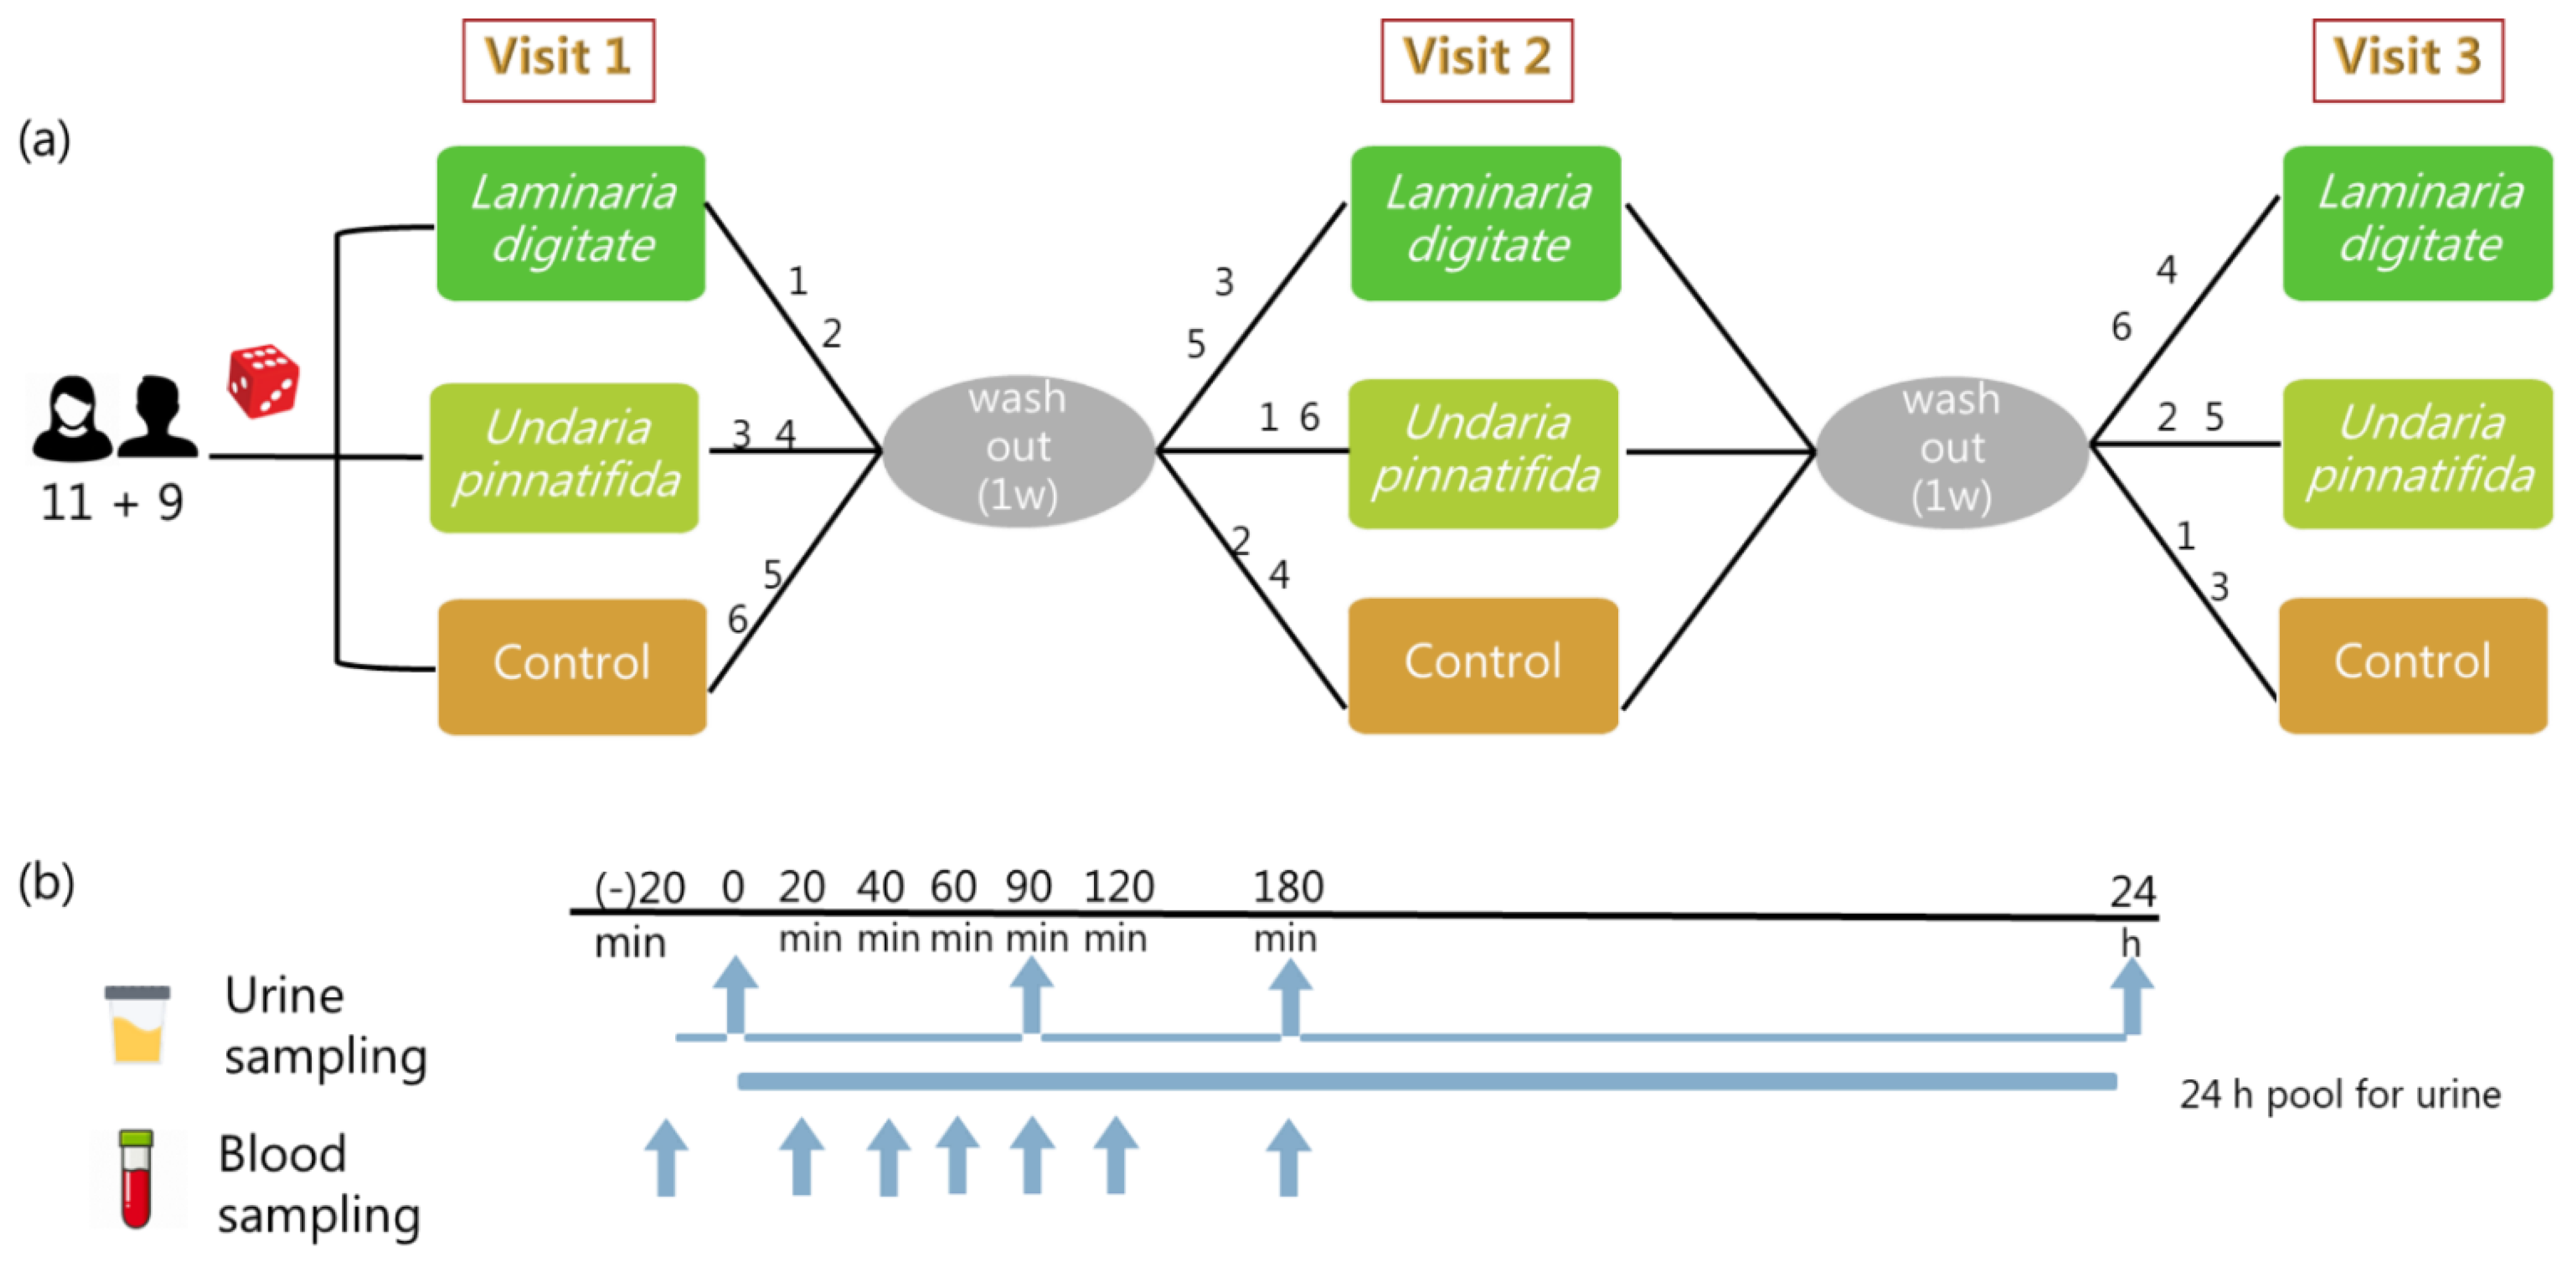
4.2. Study Design
4.3. Test Meals
4.4. Biological Sample Collection
4.5. UPLC-QTOF-MS Analysis
4.6. Seaweed Extraction and Analysis
4.7. Data Preprocessing
4.8. Data Analysis
4.9. Standards and Identification
4.9.1. Identification
4.9.2. Standard
4.10. Deconjugation of the Urine Sample
5. Conclusions
Supplementary Materials
Author Contributions
Funding
Institutional Review Board Statement
Informed Consent Statement
Conflicts of Interest
References
- Park, E.-J.; Pezzuto, J.M. Antioxidant Marine Products in Cancer Chemoprevention. Antioxid. Redox Signal. 2013, 19, 115–138. [Google Scholar] [CrossRef] [PubMed]
- Zaharudin, N.; Staerk, D.; Dragsted, L.O. Inhibition of α-glucosidase activity by selected edible seaweeds and fucoxanthin. Food Chem. 2019, 270, 481–486. [Google Scholar] [CrossRef] [PubMed]
- Brown, E.M.; Allsopp, P.J.; Magee, P.J.; Gill, C.I.; Nitecki, S.; Strain, C.R.; Mcsorley, E.M. Seaweed and human health. Nutr. Rev. 2014, 72, 205–216. [Google Scholar] [CrossRef] [PubMed]
- MacArtain, P.; Gill, C.I.R.; Brooks, M.; Campbell, R.; Rowland, I.R. Nutritional Value of Edible Seaweeds. Nutr. Rev. 2008, 65, 535–543. [Google Scholar] [CrossRef]
- Rajauria, G.; Foley, B.; Abu-Ghannam, N. Identification and characterization of phenolic antioxidant compounds from brown Irish seaweed Himanthalia elongata using LC-DAD–ESI-MS/MS. Innov. Food Sci. Emerg. Technol. 2016, 37, 261–268. [Google Scholar] [CrossRef]
- Wang, T.; Jónsdóttir, R.; Liu, H.; Gu, L.; Kristinsson, H.G.; Raghavan, S.; Ólafsdóttir, G. Antioxidant capacities of phlorotannins extracted from the brown algae Fucus vesiculosus. J. Agric. Food Chem. 2012, 60, 5874–5883. [Google Scholar] [CrossRef]
- Rushdi, M.I.; Abdel-Rahman, I.A.M.; Saber, H.; Attia, E.Z.; Abdelraheem, W.M.; Madkour, H.A.; Hassan, H.M.; Elmaidomy, A.H.; Abdelmohsen, U.R. Pharmacological and natural products diversity of the brown algae genus Sargassum. RSC Adv. 2020, 10, 24951–24972. [Google Scholar] [CrossRef]
- Silva, G.; Pereira, R.B.; Valentão, P.; Andrade, P.B.; Sousa, C. Distinct fatty acid profile of ten brown macroalgae. Braz. J. Pharmacogn. 2013, 23, 608–613. [Google Scholar] [CrossRef] [Green Version]
- D’Orazio, N.; Gemello, E.; Gammone, M.; De Girolamo, M.; Ficoneri, C.; Riccioni, G. Fucoxantin: A Treasure from the Sea. Mar. Drugs 2012, 10, 604–616. [Google Scholar] [CrossRef] [Green Version]
- Bocanegra, A.; Bastida, S.; Benedí, J.; Ródenas, S.; Sánchez-Muniz, F.J. Characteristics and Nutritional and Cardiovascular-Health Properties of Seaweeds. J. Med. Food 2009, 12, 236–258. [Google Scholar] [CrossRef]
- Fitzgerald, C.; Gallagher, E.; Tasdemir, D.; Hayes, M. Heart Health Peptides from Macroalgae and Their Potential Use in Functional Foods. J. Agric. Food Chem. 2011, 59, 6829–6836. [Google Scholar] [CrossRef] [PubMed]
- Kim, S.-K.; Wijesekara, I. Development and biological activities of marine-derived bioactive peptides: A review. J. Funct. Foods 2010, 2, 1–9. [Google Scholar] [CrossRef]
- Zava, T.T.; Zava, D.T. Assessment of Japanese iodine intake based on seaweed consumption in Japan: A literature-based analysis. Thyroid Res. 2011, 4, 14. [Google Scholar] [CrossRef] [PubMed] [Green Version]
- Penn, L.; Boeing, H.; Boushey, C.J.; Dragsted, L.O.; Kaput, J.; Scalbert, A.; Welch, A.A.; Mathers, J.C. Assessment of dietary intake: NuGO symposium report. Genes Nutr. 2010, 5, 205–213. [Google Scholar] [CrossRef] [PubMed] [Green Version]
- Kaaks, R.J. Biochemical markers as additional measurements in studies of the accuracy of dietary questionnaire measurements: Conceptual issues. Am. J. Clin. Nutr. 1997, 65, 1232S–1239S. [Google Scholar] [CrossRef] [Green Version]
- Bingham, S.A. Biomarkers in nutritional epidemiology. Public Health Nutr. 2002, 5, 821–827. [Google Scholar] [CrossRef] [Green Version]
- Brennan, L. Moving toward Objective Biomarkers of Dietary Intake. J. Nutr. 2018, 148, 821–822. [Google Scholar] [CrossRef]
- Mehmood, T.; Liland, K.H.; Snipen, L.; Sæbø, S. A review of variable selection methods in Partial Least Squares Regression. Chemom. Intell. Lab. Syst. 2012, 118, 62–69. [Google Scholar] [CrossRef]
- Roberfroid, M.B. The food metabolome: A window over dietary exposure. Am. J. Clin. Nutr. 2014, 99, 1286–1308. [Google Scholar]
- Andersen, M.B.S.; Rinnan, Å.; Manach, C.; Poulsen, S.K.; Pujos-Guillot, E.; Larsen, T.M.; Astrup, A.; Dragsted, L.O. Untargeted metabolomics as a screening tool for estimating compliance to a dietary pattern. J. Proteome Res. 2014, 13, 1405–1418. [Google Scholar] [CrossRef]
- Dragsted, L.O.; Gao, Q.; Scalbert, A.; Vergères, G.; Kolehmainen, M.; Manach, C.; Brennan, L.; Afman, L.A.; Wishart, D.S.; Andres Lacueva, C.; et al. Validation of biomarkers of food intake—Critical assessment of candidate biomarkers. Genes Nutr. 2018, 13, 14. [Google Scholar] [CrossRef] [PubMed] [Green Version]
- Zaharudin, N.; Tullin, M.; Pekmez, C.T.; Sloth, J.J.; Rasmussen, R.R.; Dragsted, L.O. Effects of brown seaweeds on postprandial glucose, insulin and appetite in humans—A randomized, 3-way, blinded, cross-over meal study. Clin. Nutr. 2020. [Google Scholar] [CrossRef] [PubMed]
- Schulz, K.F.; Altman, D.G.; Moher, D. CONSORT 2010 Statement: Updated guidelines for reporting parallel group randomised trials. BMJ 2010, 340, C332. [Google Scholar] [CrossRef] [PubMed]
- Dimairo, M.; Pallmann, P.; Wason, J.; Todd, S.; Jaki, T.; Julious, S.A.; Mander, A.P.; Weir, C.J.; Koenig, F.; Walton, M.K.; et al. The adaptive designs CONSORT extension (ACE) statement: A checklist with explanation and elaboration guideline for reporting randomised trials that use an adaptive design. Trials 2020, 21, 528. [Google Scholar] [CrossRef]
- Djoumbou Feunang, Y.; Eisner, R.; Knox, C.; Chepelev, L.; Hastings, J.; Owen, G.; Fahy, E.; Steinbeck, C.; Subramanian, S.; Bolton, E.; et al. ClassyFire: Automated chemical classification with a comprehensive, computable taxonomy. J. Cheminf. 2016, 8, 61. [Google Scholar] [CrossRef] [Green Version]
- Cissé, L.; Tine, A.; Kaboré, L.; Saba, A. Mass spectrometry study of coumarins: Correlation between charges of atoms and fragmentation processes. Spectrosc. Lett. 2009, 42, 95–99. [Google Scholar] [CrossRef] [Green Version]
- Pande, J.; Dhanki, A.; Padalia, H.; Chanda, S. Pharmacognostic characterization, phytochemical and physicochemical evaluation of Sargassum wightii and Padina gymnospora, two brown seaweeds from Gujarat coast. Pharma Innov. J. 2018, 7, 78–86. [Google Scholar]
- Hartmann, A.; Ganzera, M.; Karsten, U.; Skhirtladze, A.; Stuppner, H. Phytochemical and Analytical Characterization of Novel Sulfated Coumarins in the Marine Green Macroalga Dasycladus vermicularis (Scopoli) Krasser. Molecules 2018, 23, 2735. [Google Scholar] [CrossRef] [Green Version]
- Tephly, T.R.; Burchell, B. UDP-glucuronosyltransferases: A family of detoxifying enzymes. Trends Pharmacol. Sci. 1990, 11, 276–279. [Google Scholar] [CrossRef]
- Wang, M.; Carver, J.J.; Phelan, V.V.; Sanchez, L.M.; Garg, N.; Peng, Y.; Nguyen, D.D.; Watrous, J.; Kapono, C.A.; Luzzatto-Knaan, T.; et al. Sharing and community curation of mass spectrometry data with Global Natural Products Social Molecular Networking. Nat. Biotechnol. 2016, 34, 828–837. [Google Scholar] [CrossRef] [Green Version]
- Lu, H.; Xie, H.; Gong, Y.; Wang, Q.; Yang, Y. Secondary metabolites from the seaweed Gracilaria lemaneiformis and their allelopathic effects on Skeletonema costatum. Biochem. Syst. Ecol. 2011, 39, 397–400. [Google Scholar] [CrossRef]
- Kim, H.-S.; Wang, L.; Fernando, I.P.S.; Je, J.-G.; Ko, S.-C.; Kang, M.C.; Lee, J.M.; Yim, M.-J.; Jeon, Y.-J.; Lee, D.-S. Antioxidant efficacy of (−)-loliolide isolated from Sargassum horneri against AAPH-induced oxidative damage in Vero cells and zebrafish models in vivo. J. Appl. Phycol. 2020, 32, 3341–3348. [Google Scholar] [CrossRef]
- Kimura, J.; Maki, N. New Loliolide Derivatives from the Brown Alga Undaria pinnatifida. J. Nat. Prod. 2002, 65, 57–58. [Google Scholar] [CrossRef] [PubMed]
- Khan, A.M.; Noreen, S.; Imran, Z.P.; Atta-ur-Rahman; Choudhary, M.I. A new compound, jolynamine, from marine brown alga Jolyna laminarioides. Nat. Prod. Res. 2011, 25, 898–904. [Google Scholar] [CrossRef] [PubMed]
- Park, S.; Choi, E.; Kim, S.; Kim, D.; Kim, J.; Chang, S.; Choi, J.; Park, K.; Roh, K.-B.; Lee, J.; et al. Oxidative Stress-Protective and Anti-Melanogenic Effects of Loliolide and Ethanol Extract from Fresh Water Green Algae, Prasiola japonica. Int. J. Mol. Sci. 2018, 19, 2825. [Google Scholar] [CrossRef] [PubMed] [Green Version]
- Murata, M.; Nakai, Y.; Kawazu, K.; Ishizaka, M.; Kajiwara, H.; Ab, H.; Takeuchi, K.; Ichinose, Y.; Mitsuhara, I.; Mochizuki, A.; et al. Loliolide, a carotenoid metabolite, is a potential endogenous inducer of herbivore resistance. Plant Physiol. 2019, 179, 1822–1833. [Google Scholar] [CrossRef] [PubMed] [Green Version]
- Bedane, K.G.; Zühlke, S.; Spiteller, M. Bioactive constituents of Lobostemon fruticosus: Anti-inflammatory properties and quantitative analysis of samples from different places in South Africa. South Afr. J. Bot. 2020, 131, 174–180. [Google Scholar] [CrossRef]
- Gürdeniz, G.; Jensen, M.G.; Meier, S.; Bech, L.; Lund, E.; Dragsted, L.O. Detecting Beer Intake by Unique Metabolite Patterns. J. Proteome Res. 2016, 15, 4544–4556. [Google Scholar] [CrossRef] [Green Version]
- Gürdeniz, G.; Kristensen, M.; Skov, T.; Dragsted, L.O. The Effect of LC-MS Data Preprocessing Methods on the Selection of Plasma Biomarkers in Fed vs. Fasted Rats. Metabolites 2012, 2, 77–99. [Google Scholar] [CrossRef] [Green Version]
- Andersen, M.-B.S.; Reinbach, H.C.; Rinnan, Å.; Barri, T.; Mithril, C.; Dragsted, L.O. Discovery of exposure markers in urine for Brassica-containing meals served with different protein sources by UPLC-qTOF-MS untargeted metabolomics. Metabolomics 2013, 9, 984–997. [Google Scholar] [CrossRef]
- Cuparencu, C.S.; Andersen, M.B.S.; Gürdeniz, G.; Schou, S.S.; Mortensen, M.W.; Raben, A.; Astrup, A.; Dragsted, L.O. Identification of urinary biomarkers after consumption of sea buckthorn and strawberry, by untargeted LC–MS metabolomics: A meal study in adult men. Metabolomics 2016, 12, 1–20. [Google Scholar] [CrossRef]
- Barri, T.; Holmer-Jensen, J.; Hermansen, K.; Dragsted, L.O. Metabolic fingerprinting of high-fat plasma samples processed by centrifugation- and filtration-based protein precipitation delineates significant differences in metabolite information coverage. Anal. Chim. Acta 2012, 718, 47–57. [Google Scholar] [CrossRef] [PubMed]
- Pluskal, T.; Castillo, S.; Villar-Briones, A.; Orešič, M. MZmine 2: Modular framework for processing, visualizing, and analyzing mass spectrometry-based molecular profile data. BMC Bioinformatics 2010, 11, 395. [Google Scholar] [CrossRef] [PubMed] [Green Version]
- Cuparencu, C.; Rinnan, Å.; Dragsted, L.O. Combined Markers to Assess Meat Intake—Human Metabolomic Studies of Discovery and Validation. Mol. Nutr. Food Res. 2019, 63, 1900106. [Google Scholar] [CrossRef] [PubMed]
- Giacomoni, F.; Le Corguillé, G.; Monsoor, M.; Landi, M.; Pericard, P.; Pétéra, M.; Duperier, C.; Tremblay-Franco, M.; Martin, J.F.; Jacob, D.; et al. Workflow4Metabolomics: A collaborative research infrastructure for computational metabolomics. Bioinformatics 2015, 31, 1493–1495. [Google Scholar] [CrossRef] [PubMed] [Green Version]
- Ruth, M.M.; Dunn, O.J.; Clark, V.A. Applied Statistics, Analysis of Variance and Regression, 2nd ed; John Wiley & Sons: New York, NY, USA, 1974; ISBN 0-02-946132-4. [Google Scholar]
- Tamhane, Y.H.A.C. Multiple Comparison Procedures; Wiley Series in Probability and Statistics; Hochberg, Y., Tamhane, A.C., Eds.; John Wiley & Sons, Inc.: Hoboken, NJ, USA, 1987; ISBN 9780470316672. [Google Scholar]
- Ruxton, G.D.; Beauchamp, G. Time for some a priori thinking about post hoc testing. Behav. Ecol. 2008, 19, 690–693. [Google Scholar] [CrossRef] [Green Version]
- Wishart, D.S.; Feunang, Y.D.; Marcu, A.; Guo, A.C.; Liang, K.; Vázquez-Fresno, R.; Sajed, T.; Johnson, D.; Li, C.; Karu, N.; et al. HMDB 4.0: The human metabolome database for 2018. Nucleic Acids Res. 2017, 46, D608–D617. [Google Scholar] [CrossRef]
- FooDB. Available online: http://foodb.ca/ (accessed on 25 December 2020).
- Smith, C.A.; Maille, G.O.; Want, E.J.; Qin, C.; Trauger, S.A.; Brandon, T.R.; Custodio, D.E.; Abagyan, R.; Siuzdak, G. METLIN: A metabolite mass spectral database. Ther. Drug Monit. 2005, 27, 747–751. [Google Scholar] [CrossRef]
- Dührkop, K.; Fleischauer, M.; Ludwig, M.; Aksenov, A.A.; Melnik, A.V.; Meusel, M.; Dorrestein, P.C.; Rousu, J.; Böcker, S. SIRIUS 4: A rapid tool for turning tandem mass spectra into metabolite structure information. Nat. Methods 2019, 16, 299–302. [Google Scholar] [CrossRef] [Green Version]
- Williams, A.J. Chemspider: A Platform for Crowdsourced Collaboration to Curate Data Derived From Public Compound Databases. In Collaborative Computational Technologies for Biomedical Research; John Wiley & Sons, Inc.: Hoboken, NJ, USA, 2011; pp. 363–386. ISBN 9780470638033. [Google Scholar]
- Xi, M.; Dragsted, L.O. Biomarkers of seaweed intake. Genes Nutr. 2019, 14, 1–13. [Google Scholar] [CrossRef] [Green Version]
- Aron, A.T.; Gentry, E.C.; McPhail, K.L.; Nothias, L.-F.; Nothias-Esposito, M.; Bouslimani, A.; Petras, D.; Gauglitz, J.M.; Sikora, N.; Vargas, F.; et al. Reproducible molecular networking of untargeted mass spectrometry data using GNPS. Nat. Protoc. 2020, 15, 1954–1991. [Google Scholar] [CrossRef] [PubMed]
- Watrous, J.; Roach, P.; Alexandrov, T.; Heath, B.S.; Yang, J.Y.; Kersten, R.D.; Van Der Voort, M.; Pogliano, K.; Gross, H.; Raaijmakers, J.M.; et al. Mass spectral molecular networking of living microbial colonies. Proc. Natl. Acad. Sci. USA 2012, 109, E1743–E1752. [Google Scholar] [CrossRef] [PubMed] [Green Version]
- da Silva, R.R.; Wang, M.; Nothias, L.-F.; van der Hooft, J.J.J.; Caraballo-Rodríguez, A.M.; Fox, E.; Balunas, M.J.; Klassen, J.L.; Lopes, N.P.; Dorrestein, P.C. Propagating annotations of molecular networks using in silico fragmentation. PLoS Comput. Biol. 2018, 14, e1006089. [Google Scholar] [CrossRef] [PubMed]
- Van Der Hooft, J.J.J.; Wandy, J.; Barrett, M.P.; Burgess, K.E.V.; Rogers, S. Topic modeling for untargeted substructure exploration in metabolomics. Proc. Natl. Acad. Sci. USA 2016, 113, 13738–13743. [Google Scholar] [CrossRef] [Green Version]
- Ernst, M.; Kang, K.B.; Caraballo-Rodríguez, A.M.; Nothias, L.-F.; Wandy, J.; Chen, C.; Wang, M.; Rogers, S.; Medema, M.H.; Dorrestein, P.C.; et al. MolNetEnhancer: Enhanced Molecular Networks by Integrating Metabolome Mining and Annotation Tools. Metabolites 2019, 9, 144. [Google Scholar] [CrossRef] [Green Version]
- Schymanski, E.L.; Jeon, J.; Gulde, R.; Fenner, K.; Ruff, M.; Singer, H.P.; Hollender, J. Identifying Small Molecules via High Resolution Mass Spectrometry: Communicating Confidence. Environ. Sci. Technol. 2014, 48, 2097–2098. [Google Scholar] [CrossRef]


| No. | Polarity | Experimental m/z | Theoretical Monoisotopic Mass | RT | MS/MS | Molecular Formula | Annotation | Suggested Metabolite a |
|---|---|---|---|---|---|---|---|---|
| M1 | POS | 137.0596 | 136.0524 | 4.73 | 109.0645 81.06939 55.01729 | C8H8O2 | unknown fragment | hydroxyl-dihydrocoumarin-like III |
| M2 | POS | 197.1185 | 196.1099 | 5.31 | 179.1069 161.0959 135.1170 133.1009 107.0854 105.0699 93.0697 91.0544 | C11H16O3 | [M-glucuronic acid + H2O + H]+ | isololiolid glucuronide II |
| NEG | 371.1347 | 372.1419 | 5.31 | 177.089, 113.023, 85.028, 75.0076 | C17H24O9 | [M–H]- | ||
| M3 | POS | 197.1176 | 196.1099 | 5.37 | 179.1069 161.0959 135.1170 133.1009 107.0854 105.0699 93.0697 91.0544 | C11H16O3 | [M-glucuronic acid + H2O + H]+ | Loliolid glucuronide I |
| 373.1497 | 372.1419 | 5.37 | 197.1176179.1069 161.0959 135.1165 133.1010 107.0852 105.0697 93.0695 91.05389 84.04425 | C17H24O9 | [M + H]+ | |||
| NEG | 371.1346 | 372.1419 | 5.37 | 195.9997 177.0911 113.0232 85.02834 75.00761 | C17H24O9 | [M–H]- | ||
| M4 | NEG | 467.2272 | 468.2359 | 6.14 | 193.0345 113.0236 85.0287 75.0080 | C24H36O9 | [M–H]- | Glycoside IV |
Publisher’s Note: MDPI stays neutral with regard to jurisdictional claims in published maps and institutional affiliations. |
© 2020 by the authors. Licensee MDPI, Basel, Switzerland. This article is an open access article distributed under the terms and conditions of the Creative Commons Attribution (CC BY) license (http://creativecommons.org/licenses/by/4.0/).
Share and Cite
Xi, M.; Ove Dragsted, L.; Tullin, M.; Ernst, M.; Zaharudin, N.; La Barbera, G. Discovery of Urinary Biomarkers of Seaweed Intake Using Untargeted LC–MS Metabolomics in a Three-Way Cross-Over Human Study. Metabolites 2021, 11, 11. https://doi.org/10.3390/metabo11010011
Xi M, Ove Dragsted L, Tullin M, Ernst M, Zaharudin N, La Barbera G. Discovery of Urinary Biomarkers of Seaweed Intake Using Untargeted LC–MS Metabolomics in a Three-Way Cross-Over Human Study. Metabolites. 2021; 11(1):11. https://doi.org/10.3390/metabo11010011
Chicago/Turabian StyleXi, Muyao, Lars Ove Dragsted, Mikkel Tullin, Madeleine Ernst, Nazikussabah Zaharudin, and Giorgia La Barbera. 2021. "Discovery of Urinary Biomarkers of Seaweed Intake Using Untargeted LC–MS Metabolomics in a Three-Way Cross-Over Human Study" Metabolites 11, no. 1: 11. https://doi.org/10.3390/metabo11010011