Metabolic Profiling of a Porcine Combat Trauma-Injury Model Using NMR and Multi-Mode LC-MS Metabolomics—A Preliminary Study


Abstract
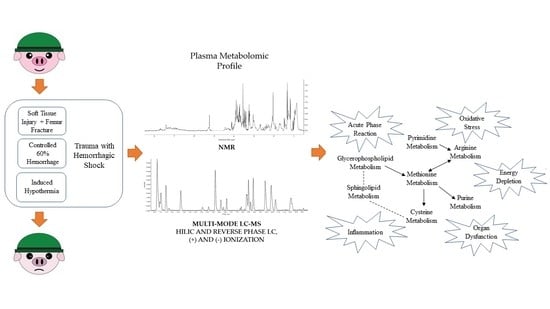
1. Introduction
2. Results
2.1. Mortality, Injury Severity, and Blood Chemistry
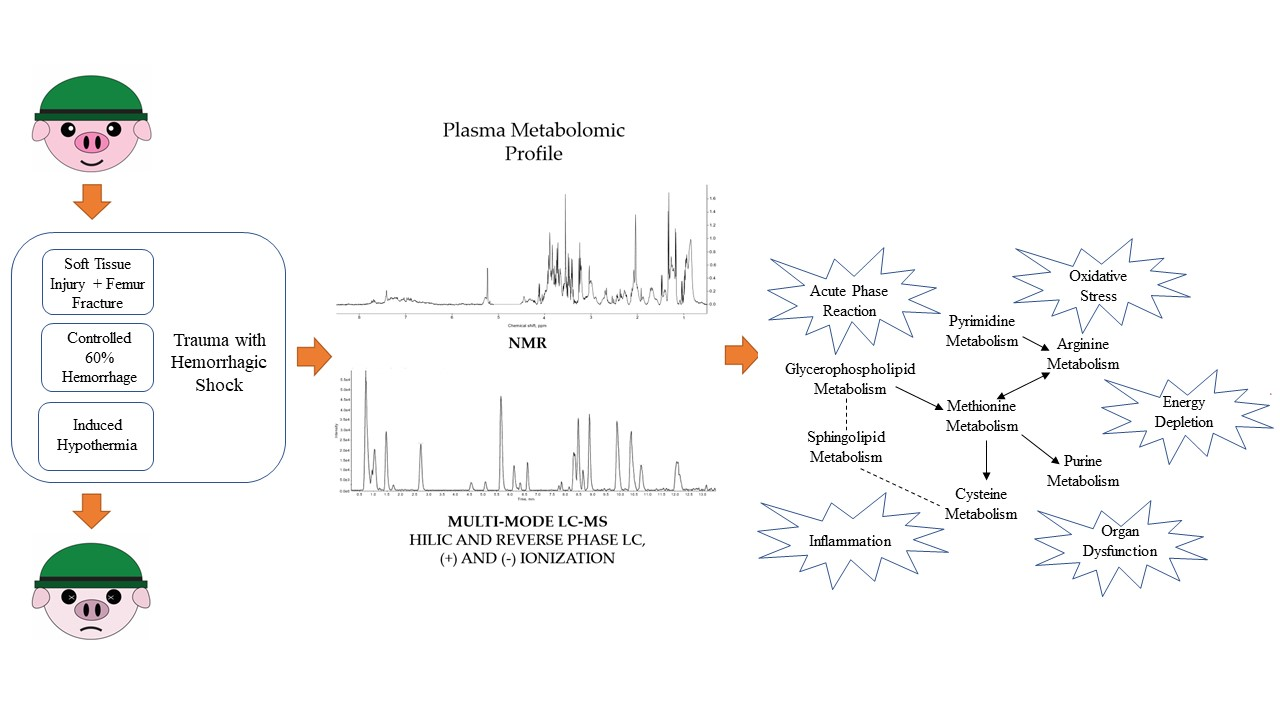
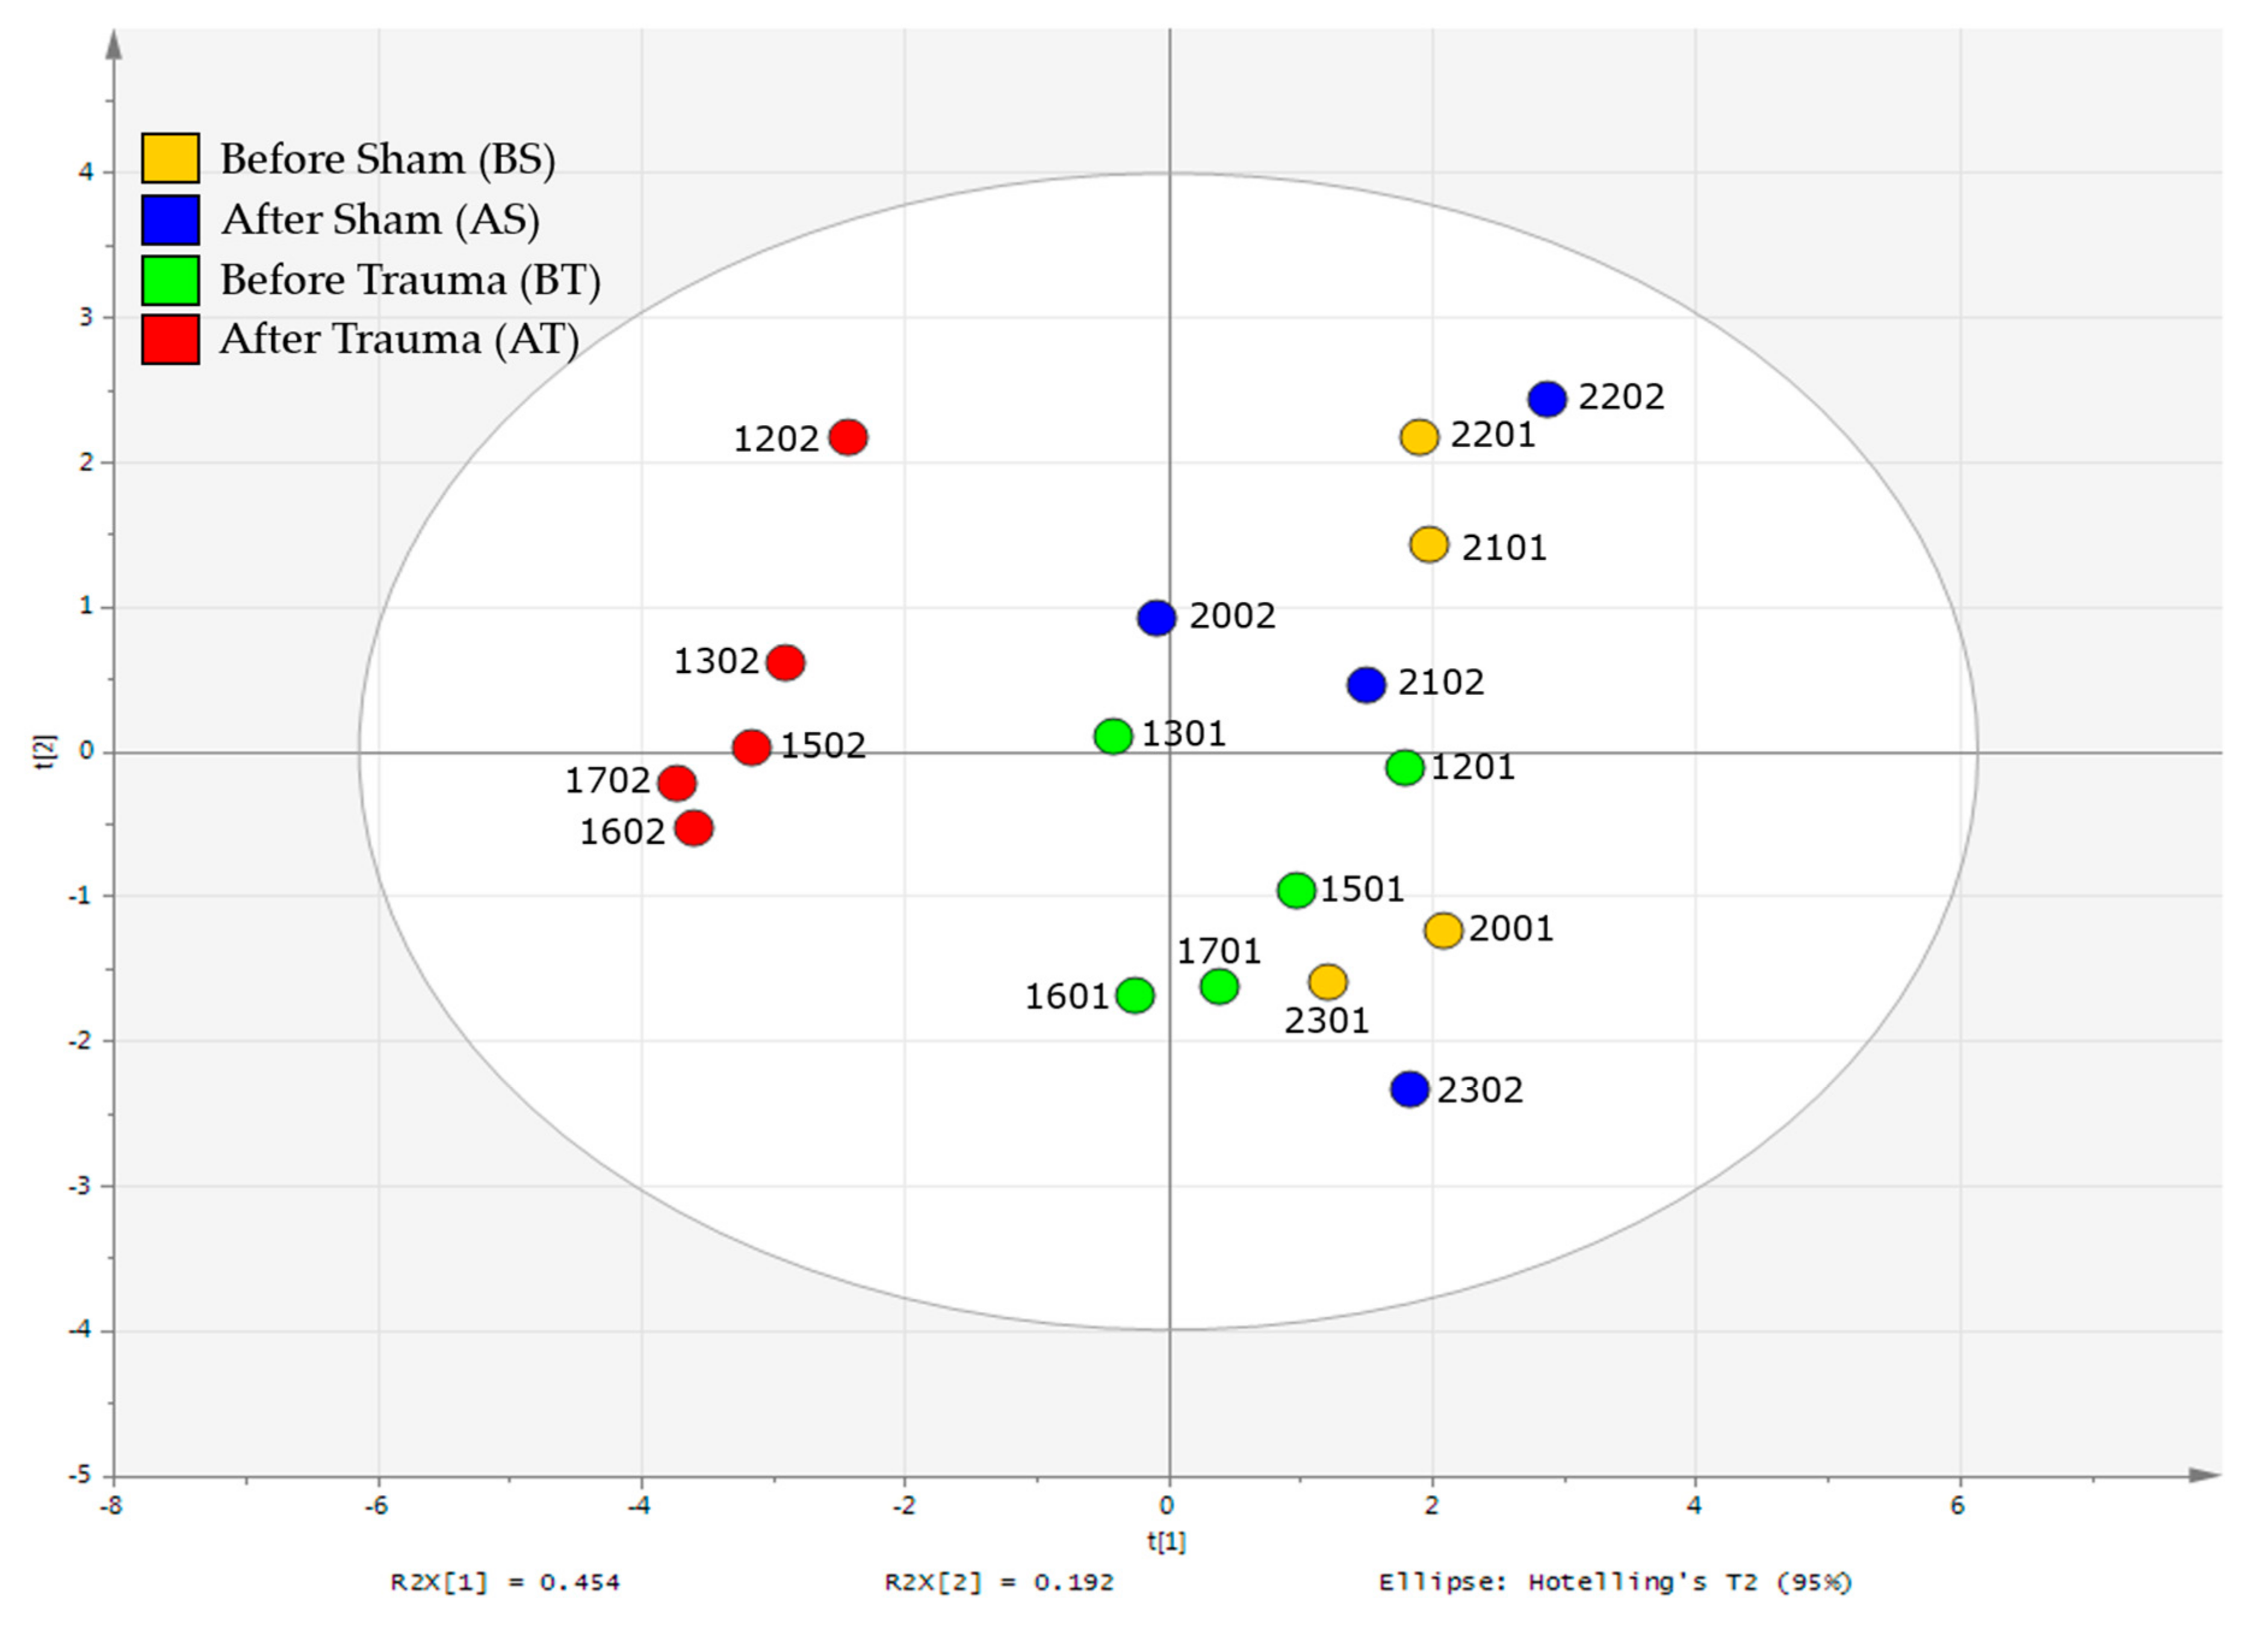
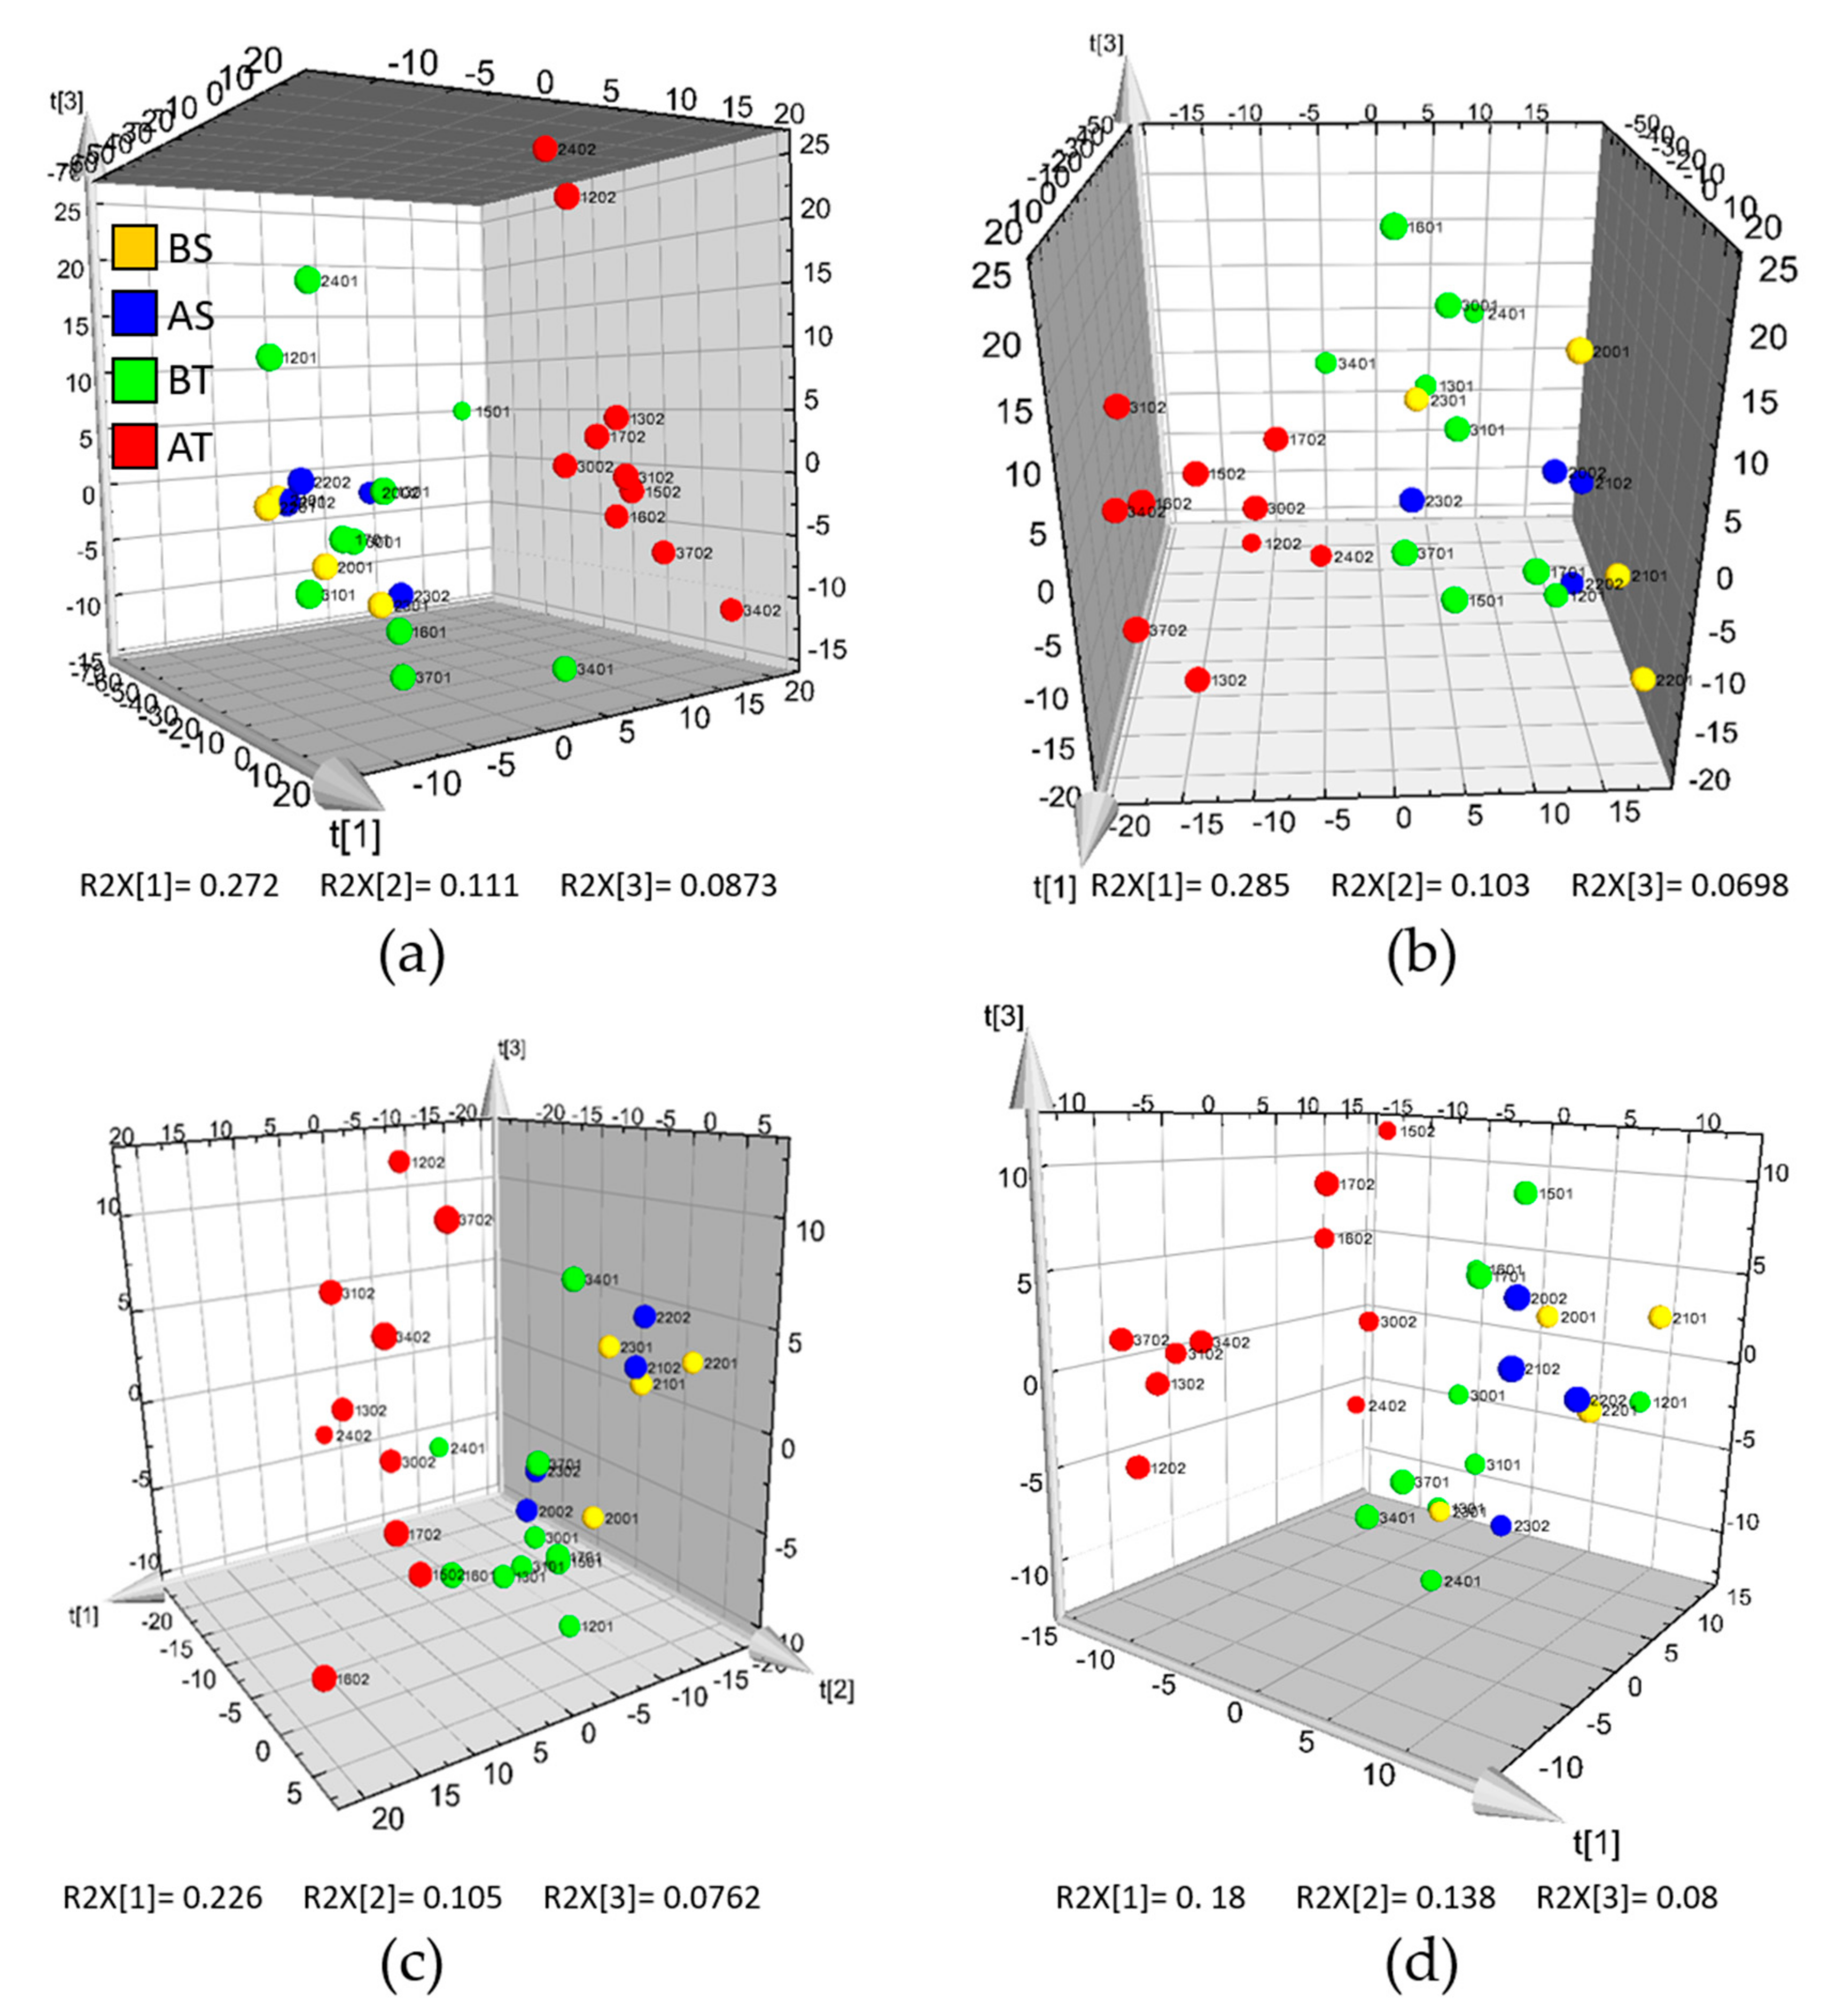
2.2. 1H-NMR Analysis
2.3. HILIC and RP-LC-MS Analysis
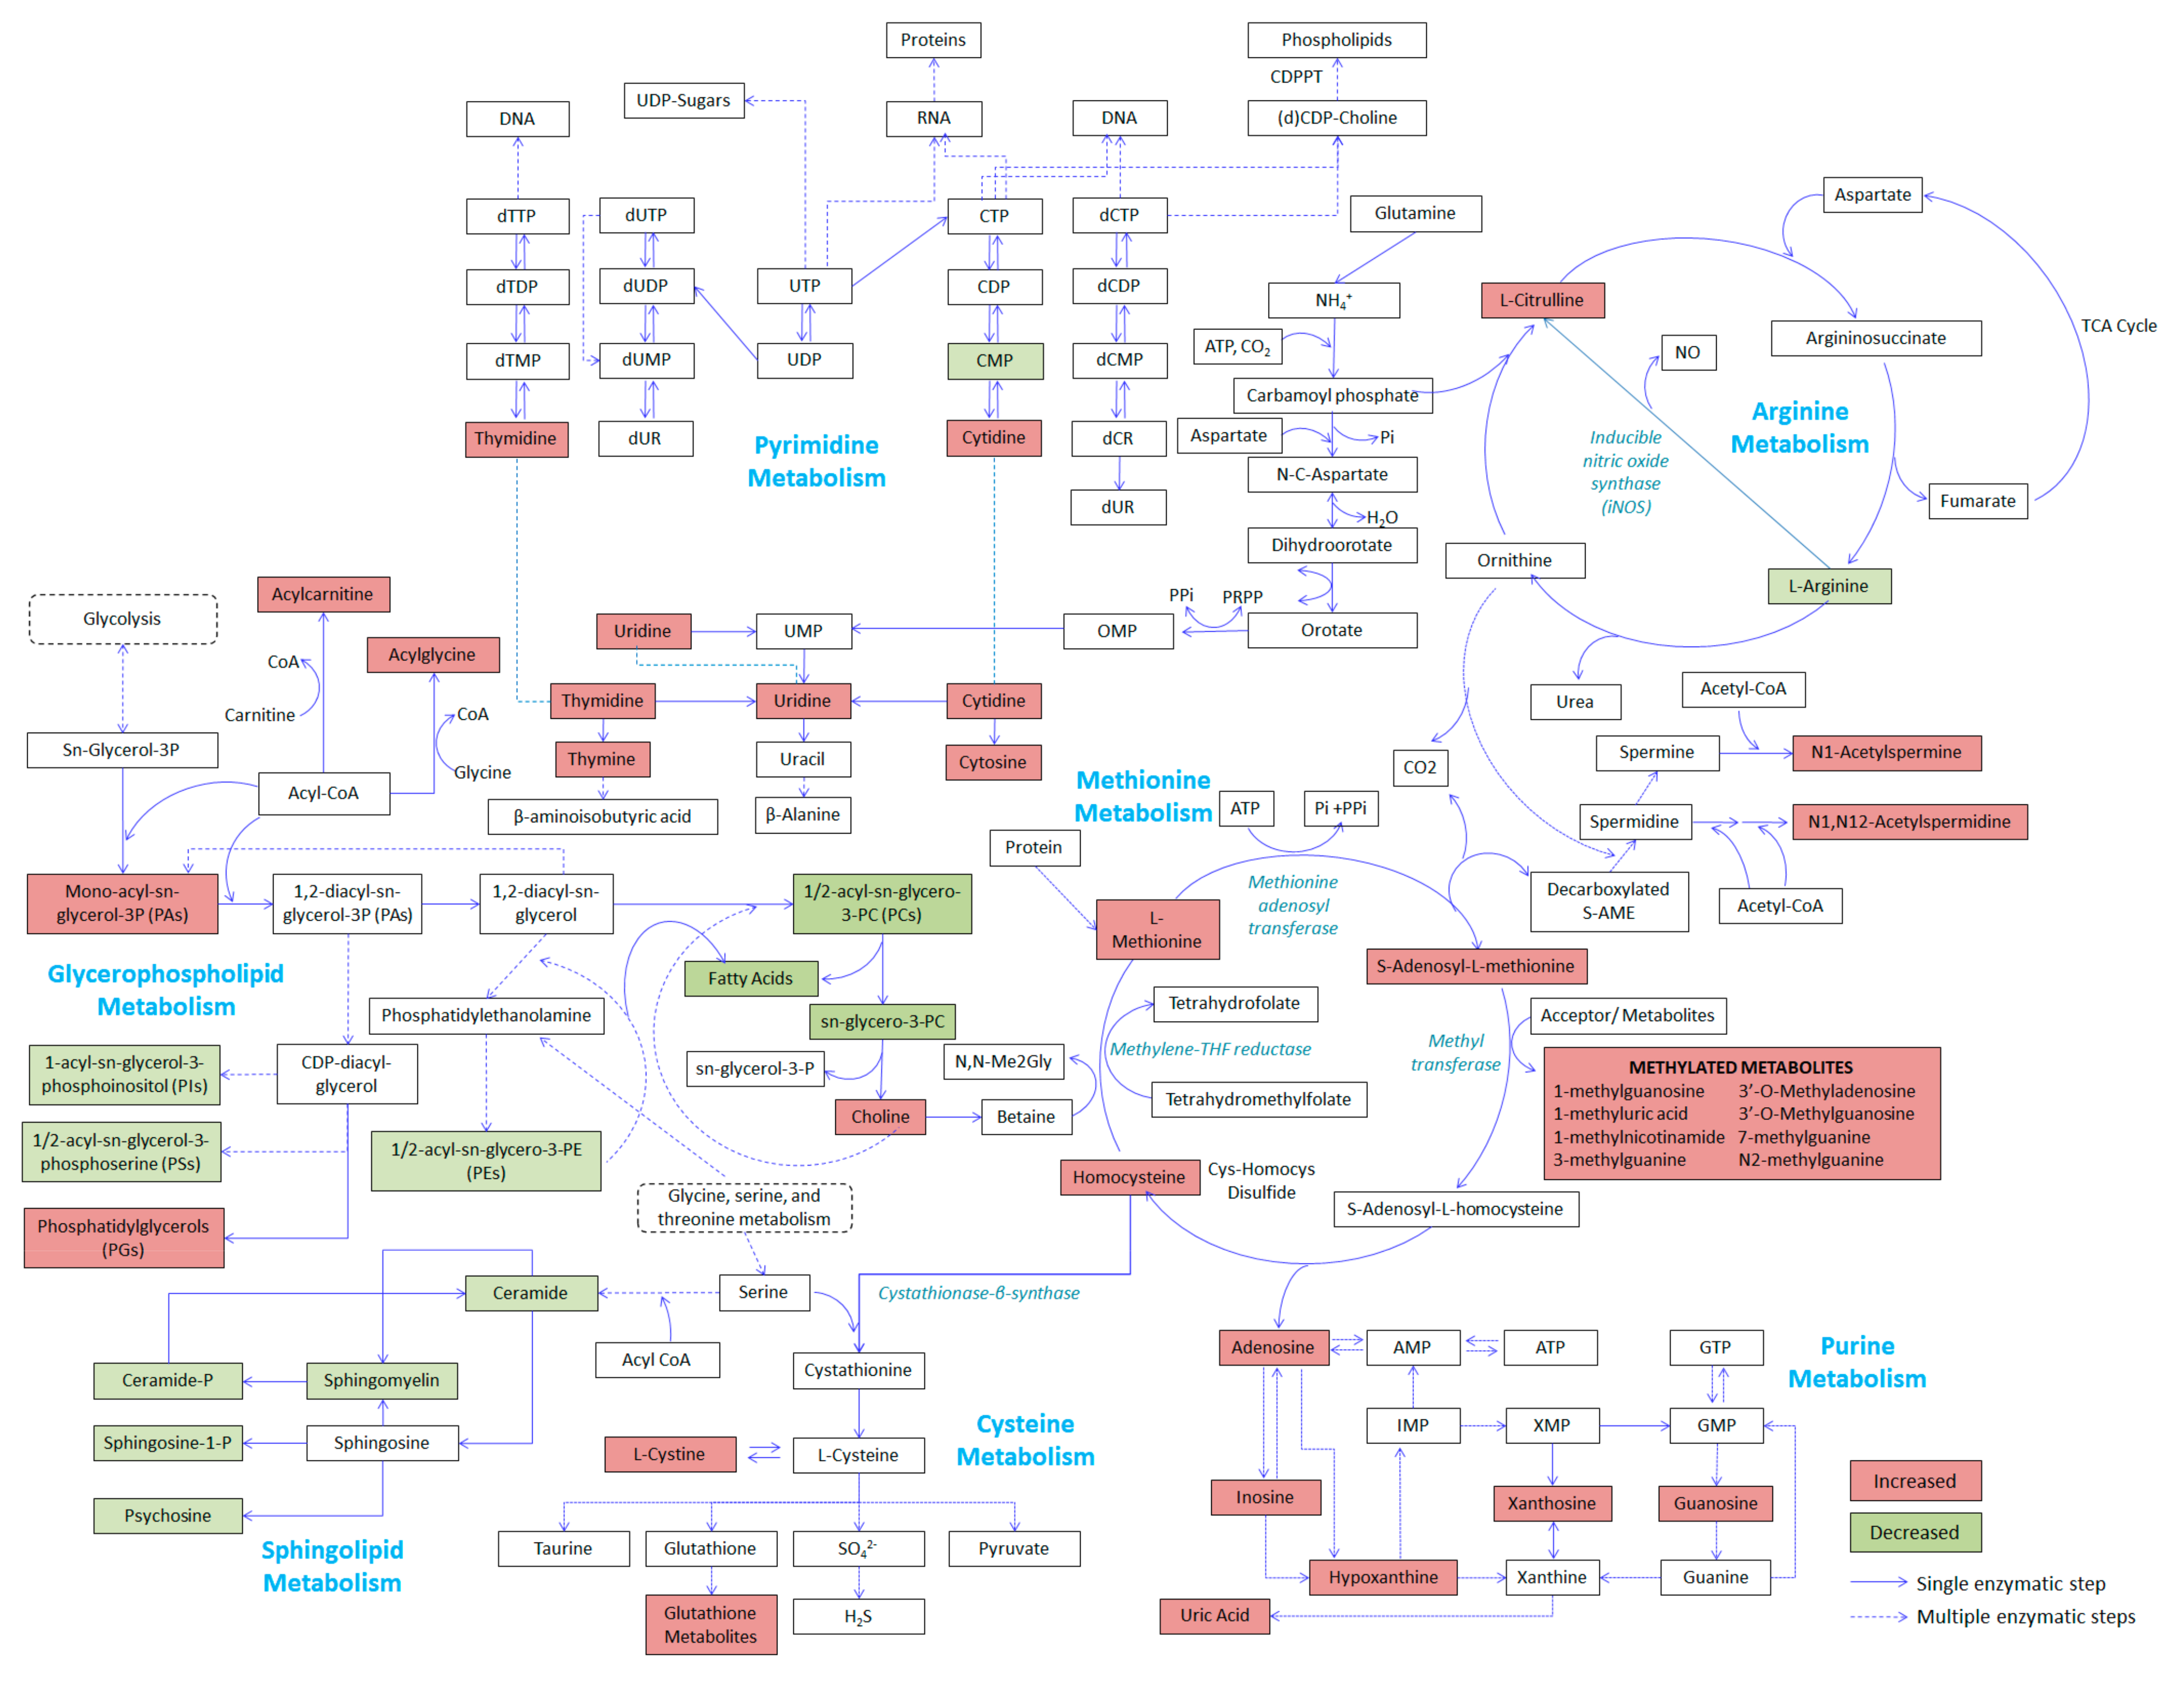
2.4. Relevant Metabolic Pathways
3. Discussion
4. Materials and Methods
4.1. Chemicals
4.2. Animal Preparation
4.2.1. Injury Phase
4.2.2. Blood Sampling
4.3. Sample Preparation
4.3.1. Sample Preparation for NMR Analysis
4.3.2. Sample Preparation for LC-MS Analysis
4.4. Instrumental Analysis
4.4.1. NMR Analysis
4.4.2. Liquid Chromatography
4.4.3. Mass Spectrometry
4.5. Data Processing and Analysis
4.5.1. Data Processing for NMR Data
4.5.2. Data Pre-Processing for LC-MS
4.5.3. Data Analysis
5. Conclusions
Supplementary Materials
Author Contributions
Funding
Acknowledgments
Conflicts of Interest
References
- Lozano, R.; Naghavi, M.; Foreman, K.; Lim, S.; Shibuya, K.; Aboyans, V.; Abraham, J.; Adair, T.; Aggarwal, R.; Ahn, S.Y.; et al. Global and regional mortality from 235 causes of death for 20 age groups in 1990 and 2010: A systematic analysis for the Global Burden of Disease Study 2010. Lancet 2012, 380, 2095–2128. [Google Scholar] [CrossRef]
- Belmont, P.J.; Goodman, G.P.; Zacchilli, M.; Posner, M.; Evans, C.; Owens, B.D. Incidence and Epidemiology of Combat Injuries Sustained During “The Surge” Portion of Operation Iraqi Freedom by a U.S. Army Brigade Combat Team. J. Trauma Inj. Infect. Crit. Care 2010, 68, 204–210. [Google Scholar] [CrossRef] [PubMed]
- Vuoncino, M.; Hoo, A.J.S.; Patel, J.A.; White, P.W.; Rasmussen, T.E.; White, J.M. Epidemiology of Upper Extremity Vascular Injury in Contemporary Combat. Ann. Vasc. Surg. 2020, 62, 98–103. [Google Scholar] [CrossRef] [PubMed]
- Angele, M.K.; Schneider, C.P.; Chaudry, I.H. Bench-to-bedside review: Latest results in hemorrhagic shock. Crit. Care 2008, 12, 218. [Google Scholar] [CrossRef] [PubMed]
- Fröhlich, M.; Lefering, R.; Probst, C.; Paffrath, T.; Schneider, M.M.; Maegele, M.; Sakka, S.G.; Bouillon, B.; Wafaisade, A. Epidemiology and risk factors of multiple-organ failure after multiple trauma. J. Trauma Acute Care Surg. 2014, 76, 921–928. [Google Scholar] [CrossRef]
- Sauaia, A.; Moore, E.E.; Johnson, J.L.; Chin, T.L.; Banerjee, A.; Sperry, J.L.; Maier, R.V.; Burlew, C.C. Temporal trends of postinjury multiple-organ failure. J. Trauma Acute Care Surg. 2014, 76, 582–593. [Google Scholar] [CrossRef]
- El Sayad, M.; Noureddine, H. Recent Advances of Hemorrhage Management in Severe Trauma. Emerg. Med. Int. 2014, 2014, 638956. [Google Scholar] [CrossRef]
- Mabry, R.; McManus, J.G. Prehospital advances in the management of severe penetrating trauma. Crit. Care Med. 2008, 36, S258–S266. [Google Scholar] [CrossRef]
- Fiehn, O. Metabolomics—The link between genotypes and phenotypes. Plant Mol. Biol. 2002, 48, 155–171. [Google Scholar] [CrossRef]
- Serkova, N.J.; Standiford, T.J.; Stringer, K.A. The Emerging Field of Quantitative Blood Metabolomics for Biomarker Discovery in Critical Illnesses. Am. J. Respir. Crit. Care Med. 2011, 184, 647–655. [Google Scholar] [CrossRef]
- Lexcen, D.R.; Lusczek, E.R.; Witowski, N.E.; Mulier, K.E.; Beilman, G.J. Metabolomics classifies phase of care and identifies risk for mortality in a porcine model of multiple injuries and hemorrhagic shock. J. Trauma Acute Care Surg. 2012, 73, S147–S155. [Google Scholar] [CrossRef] [PubMed]
- Lusczek, E.R.; Lexcen, D.R.; Witowski, N.E.; Mulier, K.E.; Beilman, G.; Beilman, G.J. Urinary metabolic network analysis in trauma, hemorrhagic shock, and resuscitation. Metabolomics 2012, 9, 223–235. [Google Scholar] [CrossRef]
- Lusczek, E.R.; Lexcen, D.R.; Witowski, N.E.; Determan, C.; Mulier, K.E.; Beilman, G.J. Prolonged Induced Hypothermia in Hemorrhagic Shock Is Associated with Decreased Muscle Metabolism. Shock 2014, 41, 79–84. [Google Scholar] [CrossRef] [PubMed]
- Bogren, L.K.; Murphy, C.J.; Johnston, E.L.; Sinha, N.; Serkova, N.J.; Drew, K.L. 1H–NMR Metabolomic Biomarkers of Poor Outcome after Hemorrhagic Shock are Absent in Hibernators. PLoS ONE 2014, 9, e107493. [Google Scholar] [CrossRef]
- Lusczek, E.R.; Muratore, S.L.; Dubick, M.A.; Beilman, G.J. Assessment of key plasma metabolites in combat casualties. J. Trauma Acute Care Surg. 2017, 82, 309–316. [Google Scholar] [CrossRef] [PubMed]
- D’alessandro, A.; Moore, H.B.; Moore, E.E.; Wither, M.J.; Nemkov, T.; Gonzalez, E.; Slaughter, A.; Fragoso, M.; Hansen, K.C.; Silliman, C.C.; et al. Early hemorrhage triggers metabolic responses that build up during prolonged shock. Am. J. Physiol. Integr. Comp. Physiol. 2015, 308, R1034–R1044. [Google Scholar] [CrossRef] [PubMed]
- Chouchani, E.T.; Pell, V.R.; Gaude, E.; Aksentijević, D.; Sundier, S.Y.; Robb, E.L.; Logan, A.; Nadtochiy, S.M.; Ord, E.N.; Smith, A.C.; et al. Ischaemic accumulation of succinate controls reperfusion injury through mitochondrial ROS. Nature 2014, 515, 431–435. [Google Scholar] [CrossRef]
- Slaughter, A.L.; Nunns, G.R.; D’alessandro, A.; Banerjee, A.; Hansen, K.C.; Moore, E.E.; Silliman, C.C.; Nemkov, T.; Moore, H.B.; Fragoso, M.; et al. The Metabolopathy of Tissue Injury, Hemorrhagic Shock, and Resuscitation in a Rat Model. Shock 2018, 49, 580–590. [Google Scholar] [CrossRef]
- Wong, Y.C.; Lai, Y.Y.; Tan, M.H.; Tan, C.S.; Wu, J.; Zeng, L.Z.J.; Lu, J.; Moochhala, S.M. Potential Biomarker Panel for Predicting Organ Dysfunction and Acute Coagulopathy in a Polytrauma Porcine Model. Shock 2015, 43, 157–165. [Google Scholar] [CrossRef]
- Nicholson, J.K.; Foxall, P.J.D.; Spraul, M.; Farrant, R.D.; Lindon, J.C. 750 MHz 1H and 1H-13C NMR Spectroscopy of Human Blood Plasma. Anal. Chem. 1995, 67, 793–811. [Google Scholar] [CrossRef]
- McGill, M.R.; Li, F.; Sharpe, M.R.; Williams, C.D.; Curry, S.C.; Ma, X.; Jaeschke, H. Circulating acylcarnitines as biomarkers of mitochondrial dysfunction after acetaminophen overdose in mice and humans. Arch. Toxicol. 2013, 88, 391–401. [Google Scholar] [CrossRef] [PubMed]
- Newgard, C.B. Interplay between lipids and branched-chain amino acids in development of insulin resistance. Cell Metab. 2012, 15, 606–614. [Google Scholar] [CrossRef] [PubMed]
- Tsukamoto, T.; Pape, H.C. Animal models for trauma research. Shock 2009, 31, 3–10. [Google Scholar] [CrossRef] [PubMed]
- Merrifield, C.A.; Lewis, M.C.; Claus, S.P.; Beckonert, O.P.; Dumas, M.-E.; Duncker, S.; Kochhar, S.; Rezzi, S.; Lindon, J.C.; Bailey, M.; et al. A metabolic system-wide characterisation of the pig: A model for human physiology. Mol. BioSyst. 2011, 7, 2577–2588. [Google Scholar] [CrossRef]
- Tremoleda, J.L.; Watts, S.A.; Reynolds, P.S.; Thiemermann, C.; Brohi, K. Modeling Acute Traumatic Hemorrhagic Shock Injury. Shock 2017, 48, 610–623. [Google Scholar] [CrossRef]
- Reisz, J.A.; Wither, M.J.; Moore, E.E.; Slaughter, A.L.; Moore, H.B.; Ghasabyan, A.; Chandler, J.; Schaub, L.J.; Fragoso, M.; Nunns, G.; et al. All animals are equal but some animals are more equal than others. J. Trauma Acute Care Surg. 2018, 84, 537–541. [Google Scholar] [CrossRef]
- Scribner, D.M.; Witowski, N.E.; Mulier, K.E.; Lusczek, E.R.; Wasiluk, K.R.; Beilman, G.J. Liver Metabolomic Changes Identify Biochemical Pathways in Hemorrhagic Shock. J. Surg. Res. 2010, 164, e131–e139. [Google Scholar] [CrossRef]
- Simsek, T.; Simsek, H.U.; Cantürk, N.Z. Response to trauma and metabolic changes: Posttraumatic metabolism. Turk. J. Surg. 2014, 30, 153–159. [Google Scholar] [CrossRef]
- Kumaraswamy, S.B.; Linder, A.; Åkesson, P.; Dahlbäck, B. Decreased plasma concentrations of apolipoprotein M in sepsis and systemic inflammatory response syndromes. Crit. Care 2012, 16, R60. [Google Scholar] [CrossRef]
- Manani, S.M.; Virzì, G.M.; Clementi, A.; Brocca, A.; De Cal, M.; Tantillo, I.; Ferrando, L.; Crepaldi, C.; Ronco, C. Pro-inflammatory cytokines: A possible relationship with dialytic adequacy and serum albumin in peritoneal dialysis patients. Clin. Kidney J. 2015, 9, 153–157. [Google Scholar] [CrossRef]
- Wang, Y.; Holmes, E.; Tang, H.; Lindon, J.C.; Sprenger, N.; Turini, M.E.; Bergonzelli, G.; Fay, L.B.; Kochhar, S.; Nicholson, J.K. Experimental Metabonomic Model of Dietary Variation and Stress Interactions. J. Proteome Res. 2006, 5, 1535–1542. [Google Scholar] [CrossRef] [PubMed]
- Preiser, J.-C.; Ichai, C.; Orban, J.-C.; Groeneveld, A.B.J. Metabolic response to the stress of critical illness. Br. J. Anaesth. 2014, 113, 945–954. [Google Scholar] [CrossRef]
- Liochev, S.I. Reactive oxygen species and the free radical theory of aging. Free. Radic. Boil. Med. 2013, 60, 1–4. [Google Scholar] [CrossRef]
- Yang, H.; Wang, H.; Chavan, S.S.; Andersson, U. High Mobility Group Box Protein 1 (HMGB1): The Prototypical Endogenous Danger Molecule. Mol. Med. 2015, 21, S6–S12. [Google Scholar] [CrossRef] [PubMed]
- Lee, J.S.; Wang, R.X.; Alexeev, E.E.; Lanis, J.M.; Battista, K.D.; Glover, L.; Colgan, S.P. Hypoxanthine is a checkpoint stress metabolite in colonic epithelial energy modulation and barrier function. J. Boil. Chem. 2018, 293, 6039–6051. [Google Scholar] [CrossRef] [PubMed]
- Bin, P.; Huang, R.; Zhou, X. Oxidation Resistance of the Sulfur Amino Acids: Methionine and Cysteine. BioMed Res. Int. 2017, 2017, 1–6. [Google Scholar] [CrossRef]
- Pfalzer, A.C.; Choi, S.-W.; Tammen, S.A.; Park, L.K.; Bottiglieri, T.; Parnell, L.D.; Lamon-Fava, S. S-adenosylmethionine mediates inhibition of inflammatory response and changes in DNA methylation in human macrophages. Physiol. Genom. 2014, 46, 617–623. [Google Scholar] [CrossRef] [PubMed]
- Wong, J.; Piceno, Y.M.; DeSantis, T.Z.; Pahl, M.; Andersen, G.L.; Vaziri, N.D. Expansion of urease- and uricase-containing, indole- and p-cresol-forming and contraction of short-chain fatty acid-producing intestinal microbiota in ESRD. Am. J. Nephrol. 2014, 39, 230–237. [Google Scholar] [CrossRef]
- Yamamoto, S.; Fukagawa, M. Uremic Toxicity and Bone in CKD. J. Nephrol. 2017, 30, 623–627. [Google Scholar] [CrossRef] [PubMed]
- Lisowska-Myjak, B. Uremic Toxins and Their Effects on Multiple Organ Systems. Nephron Clin. Pract. 2014, 128, 303–311. [Google Scholar] [CrossRef] [PubMed]
- Saito, H.; Yoshimura, M.; Saigo, C.; Komori, M.; Nomura, Y.; Yamamoto, Y.; Sagata, M.; Wakida, A.; Chuman, E.; Nishi, K.; et al. Hepatic Sulfotransferase as a Nephropreventing Target by Suppression of the Uremic Toxin Indoxyl Sulfate Accumulation in Ischemic Acute Kidney Injury. Toxicol. Sci. 2014, 141, 206–217. [Google Scholar] [CrossRef]
- Zarbock, A.; Gomez, H.; A Kellum, J. Sepsis-induced acute kidney injury revisited. Curr. Opin. Crit. Care 2014, 20, 588–595. [Google Scholar] [CrossRef] [PubMed]
- Liang, X.; Chen, Y.; Zhang, L.; Jiang, F.; Wang, W.; Ye, Z.; Liu, S.; Yu, C.; Shi, W. Necroptosis, a novel form of caspase-independent cell death, contributes to renal epithelial cell damage in an ATP-depleted renal ischemia model. Mol. Med. Rep. 2014, 10, 719–724. [Google Scholar] [CrossRef] [PubMed]
- Jackson, E.K.; Cheng, N.; Mi, Z.; Gillespie, D.G. Guanosine regulates adenosine levels in the kidney. Physiol. Rep. 2014, 2, 12028. [Google Scholar] [CrossRef]
- D’alessandro, A.; Moore, H.B.; Moore, E.E.; Reisz, J.A.; Wither, M.J.; Ghasasbyan, A.; Chandler, J.; Silliman, C.C.; Hansen, K.C.; Banerjee, A.; et al. Plasma succinate is a predictor of mortality in critically injured patients. J. Trauma Acute Care Surg. 2017, 83, 491–495. [Google Scholar] [CrossRef]
- D’alessandro, A.; Slaughter, A.L.; Peltz, E.D.; Moore, E.E.; Silliman, C.C.; Wither, M.J.; Nemkov, T.; Bacon, A.W.; Fragoso, M.; Banerjee, A.; et al. Trauma/hemorrhagic shock instigates aberrant metabolic flux through glycolytic pathways, as revealed by preliminary (13)C-glucose labeling metabolomics. J. Transl. Med. 2015, 13, 253. [Google Scholar] [CrossRef] [PubMed]
- Clendenen, N.; Nunns, G.R.; Moore, E.E.; Reisz, J.A.; Gonzalez, E.; Peltz, E.; Silliman, C.C.; Fragoso, M.; Nemkov, T.; Wither, M.J.; et al. Hemorrhagic shock and tissue injury drive distinct plasma metabolome derangements in swine. J. Trauma Acute Care Surg. 2017, 83, 635–642. [Google Scholar] [CrossRef]
- Sethuraman, K.N.; Marcolini, E.G.; McCunn, M.; Hansoti, B.; Vaca, F.E.; Napolitano, L.M. Gender-specific issues in traumatic injury and resuscitation: Consensus-based recommendations for future research. Acad. Emerg. Med. 2014, 21, 1386–1394. [Google Scholar] [CrossRef]
- Toubiana, J.; Courtine, E.; Pene, F.; Viallon, V.; Asfar, P.; Daubin, C.; Rousseau, C.; Chenot, C.; Ouaaz, F.; Grimaldi, D.; et al. IRAK1 functional genetic variant affects severity of septic shock. Crit. Care Med. 2010, 38, 2287–2294. [Google Scholar] [CrossRef]
- Arcaroli, J.; Silva, E.; Maloney, J.P.; He, Q.; Svetkauskaite, D.; Murphy, J.R.; Abraham, E. Variant IRAK-1 Haplotype Is Associated with Increased Nuclear Factor–κB Activation and Worse Outcomes in Sepsis. Am. J. Respir. Crit. Care Med. 2006, 173, 1335–1341. [Google Scholar] [CrossRef]
- Sperry, J.L.; Zolin, S.; Zuckerbraun, B.S.; Vodovotz, Y.; Namas, R.A.; Neal, M.D.; Ferrell, R.E.; Rosengart, M.R.; Peitzman, A.B.; Billiar, T.R. X Chromosome-Linked IRAK-1 Polymorphism Is a Strong Predictor of Multiple Organ Failure and Mortality Postinjury. Ann. Surg. 2014, 260, 698–705. [Google Scholar] [CrossRef] [PubMed]
- Witowski, N.; Lusczek, E.R.; Determan, C.; Lexcen, D.; Mulier, K.; Ostrowski, B.; Beilman, G.J. A Four-Compartment Metabolomics Analysis of the Liver, Muscle, Serum, and Urine Response to Polytrauma with Hemorrhagic Shock following Carbohydrate Prefeed. PLoS ONE 2015, 10, e0124467. [Google Scholar] [CrossRef] [PubMed]
- Cho, S.D.; Holcomb, J.B.; Tieu, B.H.; Englehart, M.S.; Morris, M.S.; Karahan, Z.A.; Underwood, S.A.; Muller, P.J.; Prince, M.D.; Medina, L.; et al. Reproducibility of an animal model simulating complex combat-related injury in a multiple-institution format. Shock 2009, 31, 87–96. [Google Scholar] [CrossRef] [PubMed]
- Beckonert, O.; Keun, H.C.; Ebbels, T.M.D.; Bundy, J.G.; Holmes, E.; Lindon, J.C.; Nicholson, J.K. Metabolic profiling, metabolomic and metabonomic procedures for NMR spectroscopy of urine, plasma, serum and tissue extracts. Nat. Protoc. 2007, 2, 2692–2703. [Google Scholar] [CrossRef] [PubMed]
- Chambers, M.C.; MacLean, B.; Burke, R.; Amodei, D.; Ruderman, D.L.; Neumann, S.; Gatto, L.; Fischer, B.; Pratt, B.; Egertson, J.; et al. A cross-platform toolkit for mass spectrometry and proteomics. Nat. Biotechnol. 2012, 30, 918–920. [Google Scholar] [CrossRef]
- Xia, J.; Mandal, R.; Sinelnikov, I.V.; Broadhurst, D.I.; Wishart, D.S. MetaboAnalyst 2.0--a comprehensive server for metabolomic data analysis. Nucleic Acids Res. 2012, 40, W127–W133. [Google Scholar] [CrossRef]
- Tautenhahn, R.; Cho, K.; Uritboonthai, W.; Zhu, Z.; Patti, G.J.; Siuzdak, G. An accelerated workflow for untargeted metabolomics using the METLIN database. Nat. Biotechnol. 2012, 30, 826–828. [Google Scholar] [CrossRef]
- Wishart, D.S.; Jewison, T.; Guo, A.C.; Wilson, M.; Knox, C.; Liu, Y.; Djoumbou, Y.; Mandal, R.; Aziat, F.; Dong, E.; et al. HMDB 3.0—The Human Metabolome Database in 2013. Nucleic Acids Res. 2012, 41, D801–D807. [Google Scholar] [CrossRef]
- Pence, H.E.; Williams, A.J. ChemSpider: An Online Chemical Information Resource. J. Chem. Educ. 2010, 87, 1123–1124. [Google Scholar] [CrossRef]
- Horai, H.; Arita, M.; Kanaya, S.; Nihei, Y.; Ikeda, T.; Suwa, K.; Ojima, Y.; Tanaka, K.; Tanaka, S.; Aoshima, K.; et al. MassBank: A public repository for sharing mass spectral data for life sciences. J. Mass Spectrom. 2010, 45, 703–714. [Google Scholar] [CrossRef]


| For NMR Profiling | Sham (n = 4) | Trauma (n = 5) | ||
|---|---|---|---|---|
| Survival, hours | 48.0 ± 0.0 | 19.1 ± 5.6 * | ||
| Baseline (Mean ± SD) | 30 min after Injury Phase (Mean ± SD) | |||
| Sham | Trauma | Sham | Trauma | |
| Mean arterial blood pressure, mmHg | 86.4 ± 10.0 | 81.0 ± 13.8 | 86.0 ± 8.9 | 26.7 ± 1.6 * |
| Core Temperature | 36.7 ± 0.3 | 36.8 ± 0.3 | 35.7 ± 0.2 | 32.3 ± 0.7 * |
| pH | 7.5 ± 0.1 | 7.5 ± 0.1 | 7.5 ± 0.0 | 7.4 ± 0.0 * |
| Hematocrit, %PCV | 28.3 ± 5.6 | 26.6 ± 3.4 | 29.8 ± 6.3 | 13.6 ± 3.0 * |
| Base excess, mg/dL | 10.8 ± 1.9 | 8.8 ± 4.1 | 10.3 ± 5.6 | −1.8 ± 4.4 * |
| pCO2, mmHg | 41.2 ± 4.2 | 47.6 ± 9.3 | 43.2 ± 2.7 | 40.4 ± 7.2 |
| Lactate, mmol/L | 1.5 ± 0.4 | 1.9 ± 0.4 | 1.6 ± 0.3 | 4.4 ± 1.4 * |
| Sodium, mmol/L | 139.5 ± 1.0 | 140.6 ± 1.1 | 139.0 ± 0.8 | 144.0 ± 2.6 * |
| Chloride, mEq/L | 101.5 ± 1.0 | 102.6 ± 2.5 | 101.0 ± 1.6 | 109.6 ± 3.0 * |
| For LC-MS Profiling | Sham (n = 4) | Trauma (n = 10) | ||
| Survival, hours | 48 ± 0.0 | 17.8 ± 5.1 * | ||
| Baseline (Mean ± SD) | 30 min after injury phase (Mean ± SD) | |||
| Sham | Trauma | Sham | Trauma | |
| Mean arterial blood pressure, mmHg | 86.4 ± 10.0 | 80.1 ± 12.3 | 86.0 ± 8.9 | 26.4 ± 1.6 * |
| Core Temperature | 36.7 ± 0.3 | 37.1 ± 0.4 | 35.7 ± 0.2 | 32.5 ± 1.2 * |
| pH | 7.5 ± 0.1 | 7.5 ± 0.1 | 7.5 ± 0.1 | 7.3 ± 0.1 * |
| Hematocrit, %PCV | 28.3 ± 5.6 | 26.7 ± 2.7 | 29.8 ± 6.3 | 15.0 ± 4.6 * |
| Base excess, mg/dL | 10.8 ± 1.9 | 10.1 ± 3.2 | 10.3 ± 5.6 | −0.8 ± 3.8 * |
| pCO2, mmHg | 41.2 ± 4.2 | 41.5 ± 9.2 | 43.2 ± 2.7 | 35.9 ± 7.7 |
| Lactate, mmol/L | 1.5 ± 0.4 | 1.7 ± 0.5 | 1.6 ± 0.3 | 3.3 ± 1.6 * |
| Sodium, mmol/L | 139.5 ± 1.0 | 139.8 ± 1.9 | 139 ± 0.8 | 143.3 ± 2.1 * |
| Chloride, mEq/L | 101.5 ± 1.0 | 102.7 ± 2.8 | 101 ± 1.6 | 109.7 ± 2.5 * |
| Metabolites | m/z/RT | Mode Detected | Other Modes a | Fold Change Sham Mean (SD) | Fold Change Trauma b Mean (SD) |
|---|---|---|---|---|---|
| Glycerophospholipids and related metabolites | |||||
| Choline | 104.108/13.5 | H(+) | 0.77 (0.17) | 1.41 (0.39) ** | |
| SN-Glycero-3-phosphocholine | 258.1111/23.56 | H(+) | 0.93 (0.19) | 0.40 (0.14) ** | |
| LPC(22:5) | 570.3558/10.2 | R(+) | R(−) | 1.09 (0.15) | 0.44 (0.14) ** |
| PA(18:4) | 431.096/13.22 | H(+) | 0.67 (0.33) | 2.51 (2.02) ** | |
| PC(16:0) | 496.3407/15.25 | H(+) | R(+) | 0.96 (0.08) | 0.58 (0.08) ** |
| PC(22:6) | 568.3386/14.95 | H(+) | R(+), R(−) | 1.06 (0.05) | 0.46 (0.13) ** |
| PE(20:4) | 502.2919/12.37 | H(+) | R(−) | 1.38 (0.16) | 0.67 (0.11) ** |
| PG(20:2) | 537.1672/11.2 | H(+) | 1.46 (0.91) | 4.73 (3.93) * | |
| PI(20:4) | 619.2847/12.81 | H(−) | 0.87 (0.20) | 0.38 (0.16) ** | |
| PS(19:0) | 538.3138/9.53 | R(−) | 1.01 (0.04) | 0.63 (0.19) ** | |
| Sphingolipids | |||||
| Cer(d18:0/16:0) | 540.3653/15.64 | H(+) | 1.28 (0.41) | 0.56 (0.17) ** | |
| C16 Sphingosine-1-phosphate | 350.1488/12.72 | H(−) | 0.66 (0.16) | 0.31 (0.11) ** | |
| Psychosine Sulfate | 540.33/10.42 | R(−) | 1.06 (0.21) | 0.55 (0.16) ** | |
| SM(d16:1/18:1) | 701.5579/14.48 | H(+) | 1.37 (0.84) | 0.66 (0.23) * | |
| Fatty acids | |||||
| Adrenic acid | 331.2628/14.04 | R(−) | 1.24 (0.33) | 0.60 (0.23) ** | |
| Eicosadienoic acid | 307.2626/14.44 | R(−) | 1.21 (0.56) | 0.45 (0.25) ** | |
| Acylcarnitines and acylglycines | |||||
| Glutarylcarnitine | 276.144/16.1 | H(+) | 0.87 (0.80) | 6.60 (4.27) ** | |
| N-butyrylglycine | 144.0663/2.91 | H(−) | 0.69 (0.22) | 2.48 (3.09) ** | |
| Phenylacetylgycine d | 192.0668/5.47 | R(−) | H(+) | 0.83 (0.15) | 2.09 (0.64) ** |
| Hippuric Acid (Benzoylglycine) c | 178.0513/4.29 | R(−) | R(+), H(+) | 0.75 (0.11) | 1.78 (0.44) ** |
| Amino acids and derivatives | |||||
| Citrulline | 176.1029/23.1 | H(+) | 1.07 (0.17) | 1.40 (0.30) * | |
| l-Methionine | 133.0316/14.92 | H(+) | 0.94 (0.06) | 1.34 (0.39) ** | |
| S-Adenosylmethionine | 399.1448/24.54 | H(+) | 0.98 (0.18) | 1.99 (0.71) ** | |
| Cysteine-Homocysteine disulfide | 253.0315/23.94 | H(−) | 0.95 (0.18) | 2.55 (0.93) ** | |
| l-Cysteinylglycine disulfide | 298.053/24.42 | H(+) | 0.93 (0.19) | 1.98 (0.95) ** | |
| l-Cystine | 241.0314/24.1 | H(+) | R(+) | 0.95 (0.11) | 1.60 (0.70) ** |
| N1,N12-Diacetylspermine | 287.2446/25.22 | H(+) | 1.10 (0.35) | 2.22 (0.86) ** | |
| N1-acetylspermidine | 188.1763/25.51 | H(+) | 1.09 (0.27) | 2.34 (1.23) ** | |
| Pantothenic Acid | 218.103/1.64 | R(−) | 0.87 (0.07) | 1.37 (0.27) ** | |
| Phenylethylamine c | 105.034/2.73 | H(+) | 0.72 (0.20) | 1.35 (0.42) ** | |
| 2,4-Diamino-butyric acid | 117.0199/1.01 | R(−) | 0.79 (0.20) | 2.70 (1.65) ** | |
| 2,6-Diamino-heptanedioic acid | 189.0404/0.96 | R(−) | 0.93 (0.17) | 1.67 (0.71) ** | |
| 4-(2-Aminophenyl)-2,4-dioxobutanoic acid | 206.0457/4.62 | R(−) | R(+), H(+) | 1.03 (0.25) | 2.13 (0.71) ** |
| Methylated metabolites | |||||
| 1-Methylguanosine c | 298.114/1.24 | R(+) | H(+) | 1.13 (0.09) | 1.54 (0.38) ** |
| 1-methyluric Acid | 181.0359/10.41 | H(−) | 0.99 (0.33) | 2.25 (0.67) ** | |
| 3’-O-Methyladenosine | 282.1196/17.53 | H(+) | 0.99 (0.23) | 1.46 (0.37) ** | |
| Purines | |||||
| Adenosine | 250.0928/1.94 | H(+) | 0.87 (0.32) | 2.71 (2.10) * | |
| Deoxyguanosine | 266.0878/12.32 | H(−) | 1.43 (0.67) | 6.43 (3.29) ** | |
| Guanosine | 282.0829/14.25 | H(−) | R(+), R(−) | 1.22 (0.50) | 3.73 (2.09) ** |
| Hypoxanthine c | 137.0462/11.17 | H(−) | H(+) | 1.00 (0.28) | 3.08 (1.99) ** |
| Inosine c | 269.0876/11.18 | H(+) | R(+), R(−) | 1.38 (0.62) | 3.77 (2.24) ** |
| Succinoadenosine | 382.0993/1.79 | R(−) | 1.03 (0.15) | 2.09 (0.61) ** | |
| Uric Acid c | 169.0348/14.69 | H(+) | R(−) | 0.72 (0.32) | 5.43 (4.78) ** |
| Xanthosine c | 285.0818/12.17 | H(+) | R(−) | 1.00 (0.35) | 2.65 (0.95) ** |
| Pyrimidines | |||||
| Cytosine | 112.0505/9.76 | H(+) | 0.61 (0.16) | 1.66 (0.52) ** | |
| Cytidine c | 226.0817/9.78 | H(+) | 0.94 (0.14) | 1.72 (0.49) ** | |
| Cytidine Monophosphate | 322.2006/1.33 | H(−) | 0.97 (0.16) | 0.54 (0.16) ** | |
| Thymidine | 241.0824/1.38 | R(−) | 1.00 (0.17) | 1.82 (0.43) ** | |
| Thymine c | 127.05/1.77 | H(+) | 1.10 (0.21) | 1.64 (0.34) * | |
| Uridine | 243.0618/0.92 | R(−) | 0.81 (0.19) | 2.07 (0.73) ** | |
| Glucuronides | |||||
| 3-indolecarboxylic acid glucuronide | 338.087/19 | H(+) | 0.80 (0.37) | 2.33 (1.21) ** | |
| p-Cresol glucuronide d | 283.0821/5.93 | R(−) | H(−), R(+) | 0.86 (0.23) | 2.22 (0.71) ** |
| Phenethylamine glucuronide d | 342.1186/1.07 | R(−) | 1.16 (0.14) | 3.59 (1.93) * |
© 2020 by the authors. Licensee MDPI, Basel, Switzerland. This article is an open access article distributed under the terms and conditions of the Creative Commons Attribution (CC BY) license (http://creativecommons.org/licenses/by/4.0/).
Share and Cite
Laserna, A.K.C.; Lai, Y.; Fang, G.; Ganapathy, R.; Atan, M.S.B.M.; Lu, J.; Wu, J.; Uttamchandani, M.; Moochhala, S.M.; Li, S.F.Y. Metabolic Profiling of a Porcine Combat Trauma-Injury Model Using NMR and Multi-Mode LC-MS Metabolomics—A Preliminary Study. Metabolites 2020, 10, 373. https://doi.org/10.3390/metabo10090373
Laserna AKC, Lai Y, Fang G, Ganapathy R, Atan MSBM, Lu J, Wu J, Uttamchandani M, Moochhala SM, Li SFY. Metabolic Profiling of a Porcine Combat Trauma-Injury Model Using NMR and Multi-Mode LC-MS Metabolomics—A Preliminary Study. Metabolites. 2020; 10(9):373. https://doi.org/10.3390/metabo10090373
Chicago/Turabian StyleLaserna, Anna Karen Carrasco, Yiyang Lai, Guihua Fang, Rajaseger Ganapathy, Mohamed Shirhan Bin Mohamed Atan, Jia Lu, Jian Wu, Mahesh Uttamchandani, Shabbir M. Moochhala, and Sam Fong Yau Li. 2020. "Metabolic Profiling of a Porcine Combat Trauma-Injury Model Using NMR and Multi-Mode LC-MS Metabolomics—A Preliminary Study" Metabolites 10, no. 9: 373. https://doi.org/10.3390/metabo10090373
APA StyleLaserna, A. K. C., Lai, Y., Fang, G., Ganapathy, R., Atan, M. S. B. M., Lu, J., Wu, J., Uttamchandani, M., Moochhala, S. M., & Li, S. F. Y. (2020). Metabolic Profiling of a Porcine Combat Trauma-Injury Model Using NMR and Multi-Mode LC-MS Metabolomics—A Preliminary Study. Metabolites, 10(9), 373. https://doi.org/10.3390/metabo10090373