Identification of Potential Biomarkers in the Cervicovaginal Fluid by Metabolic Profiling for Preterm Birth

 ,
,
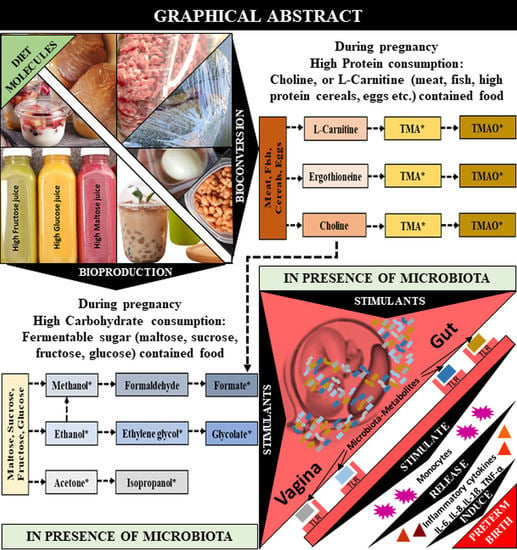
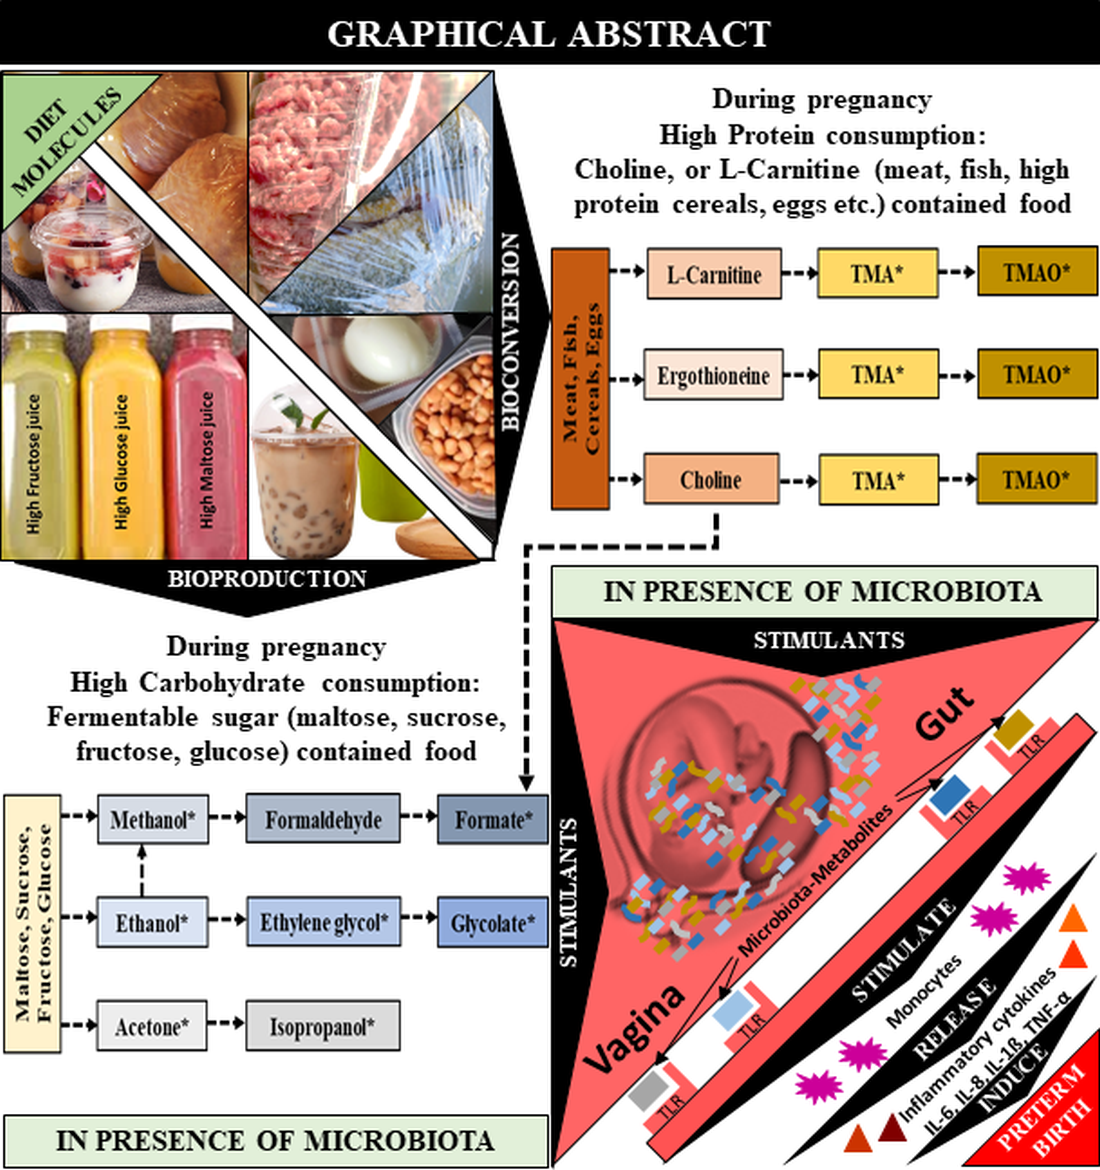
Abstract
1. Introduction
2. Results
2.1. Clinical Characteristics
2.2. Metabolite Analysis of CVF Samples
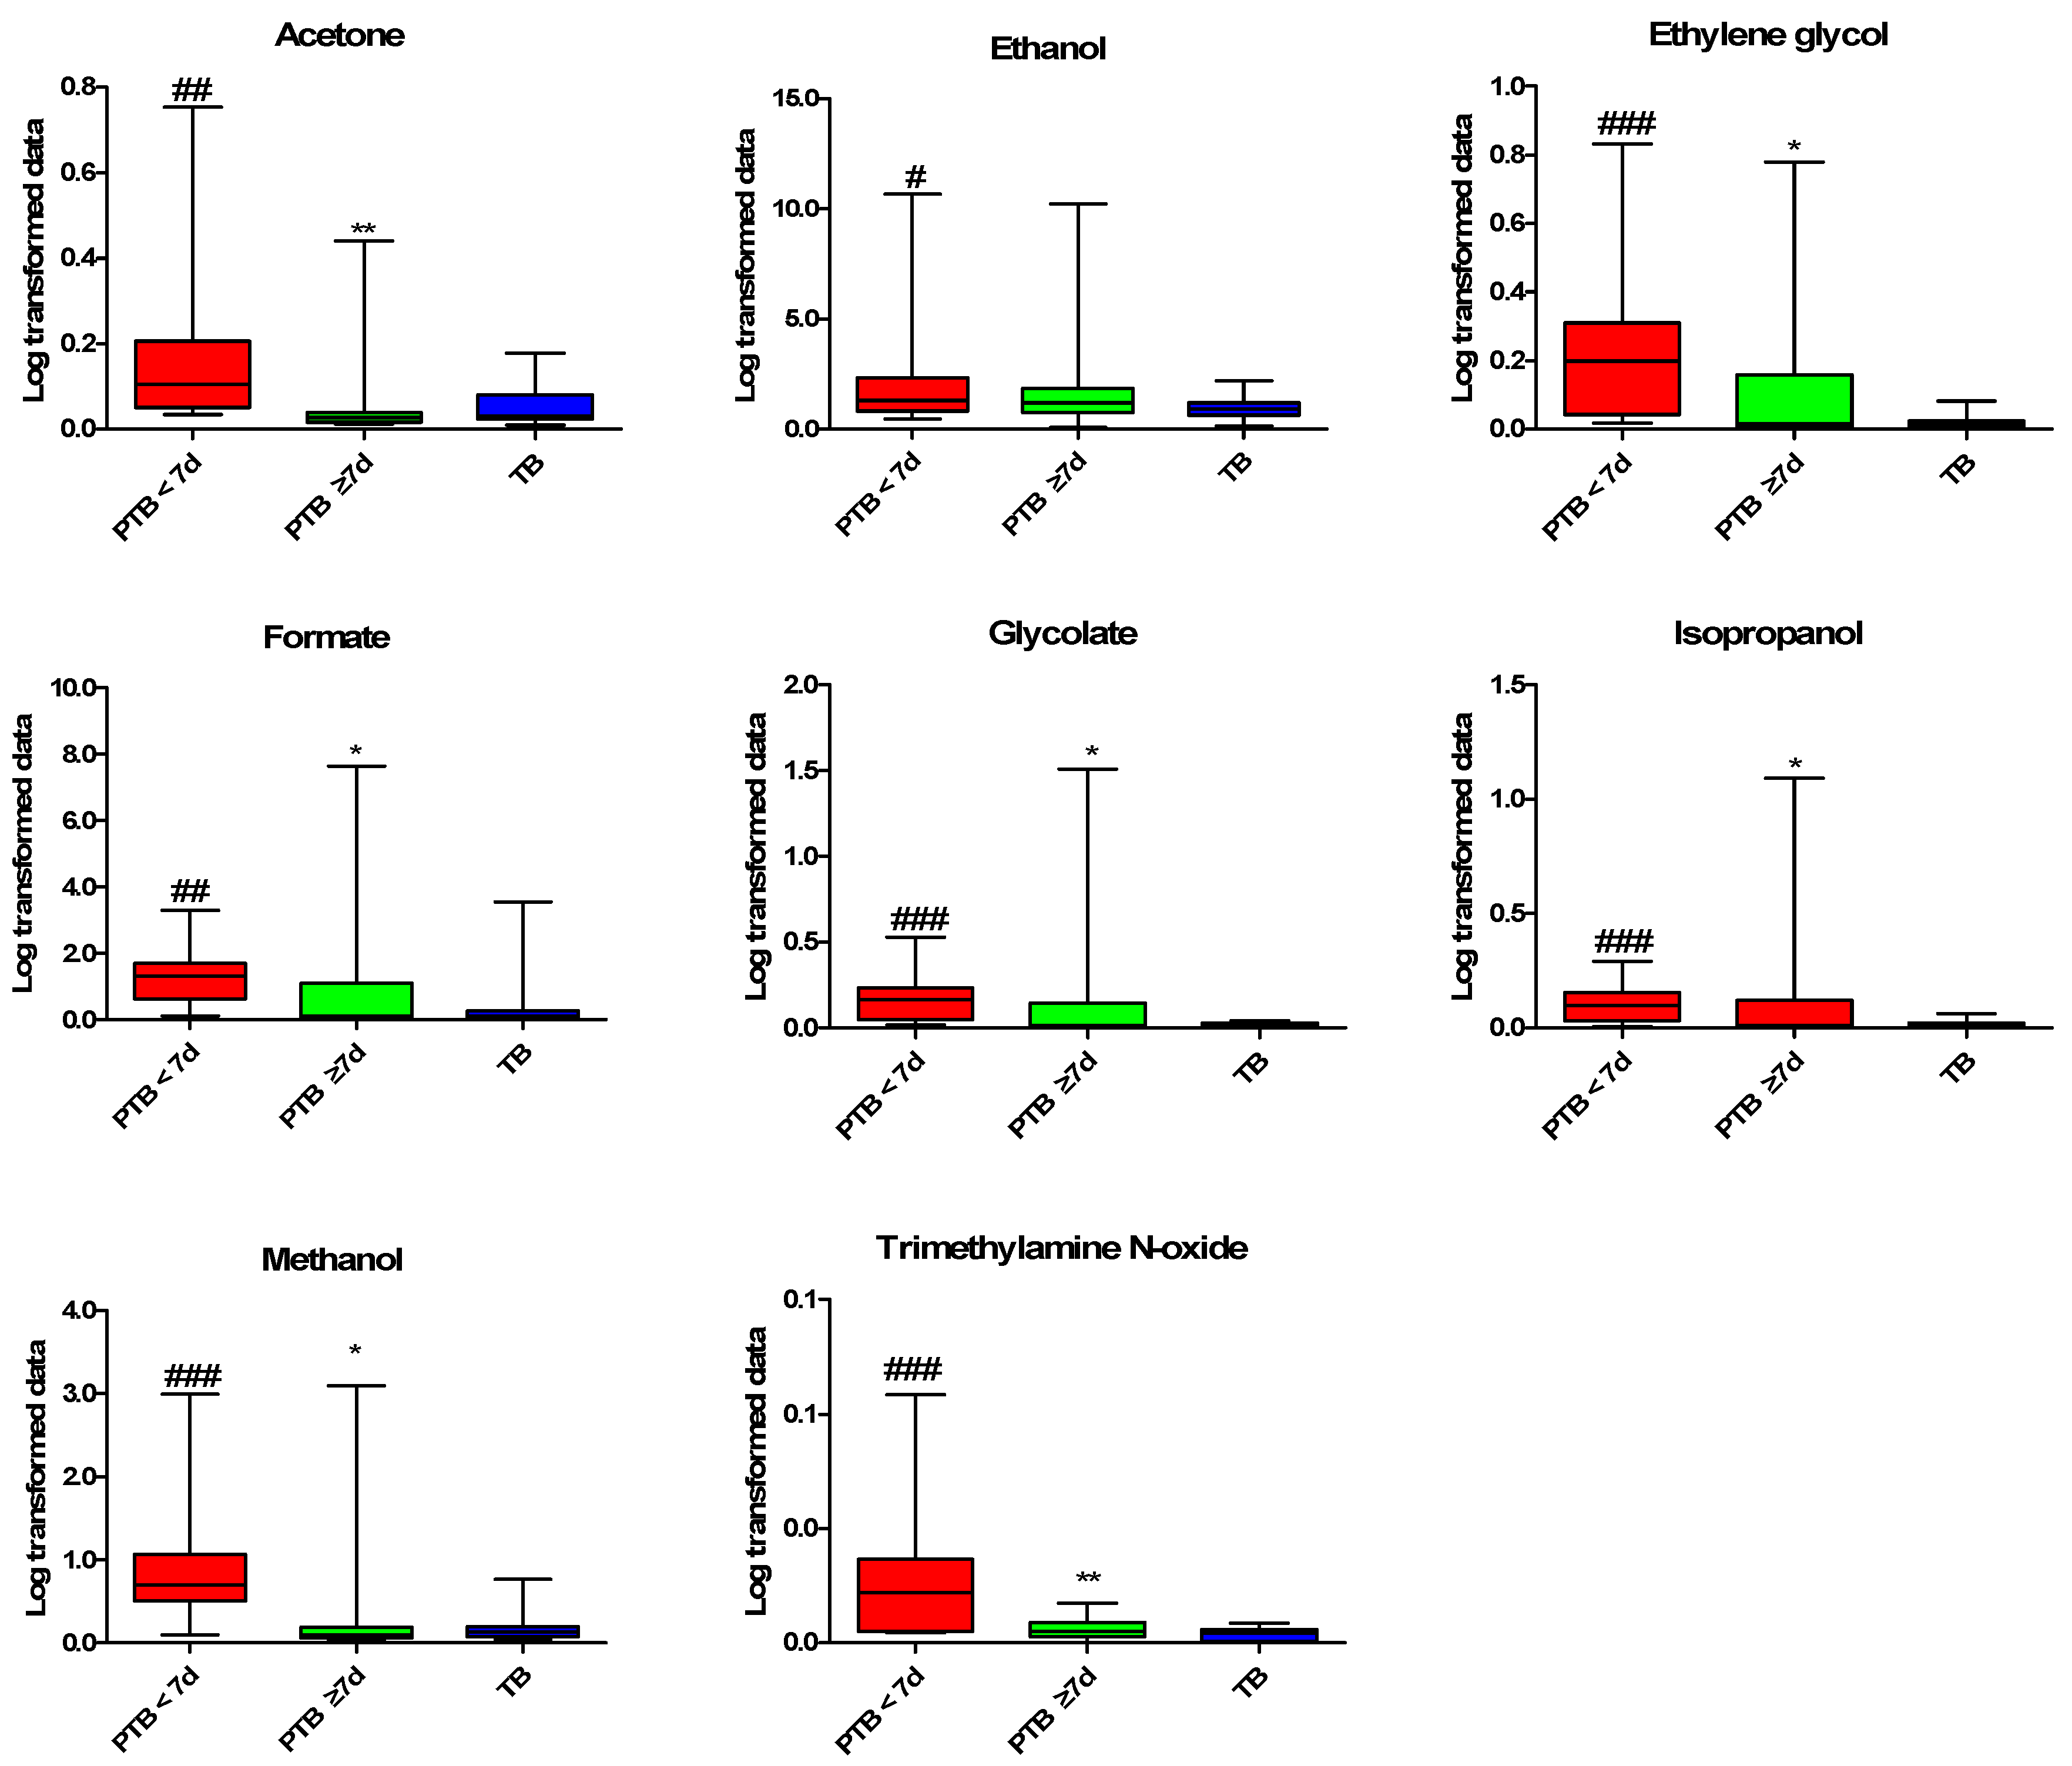
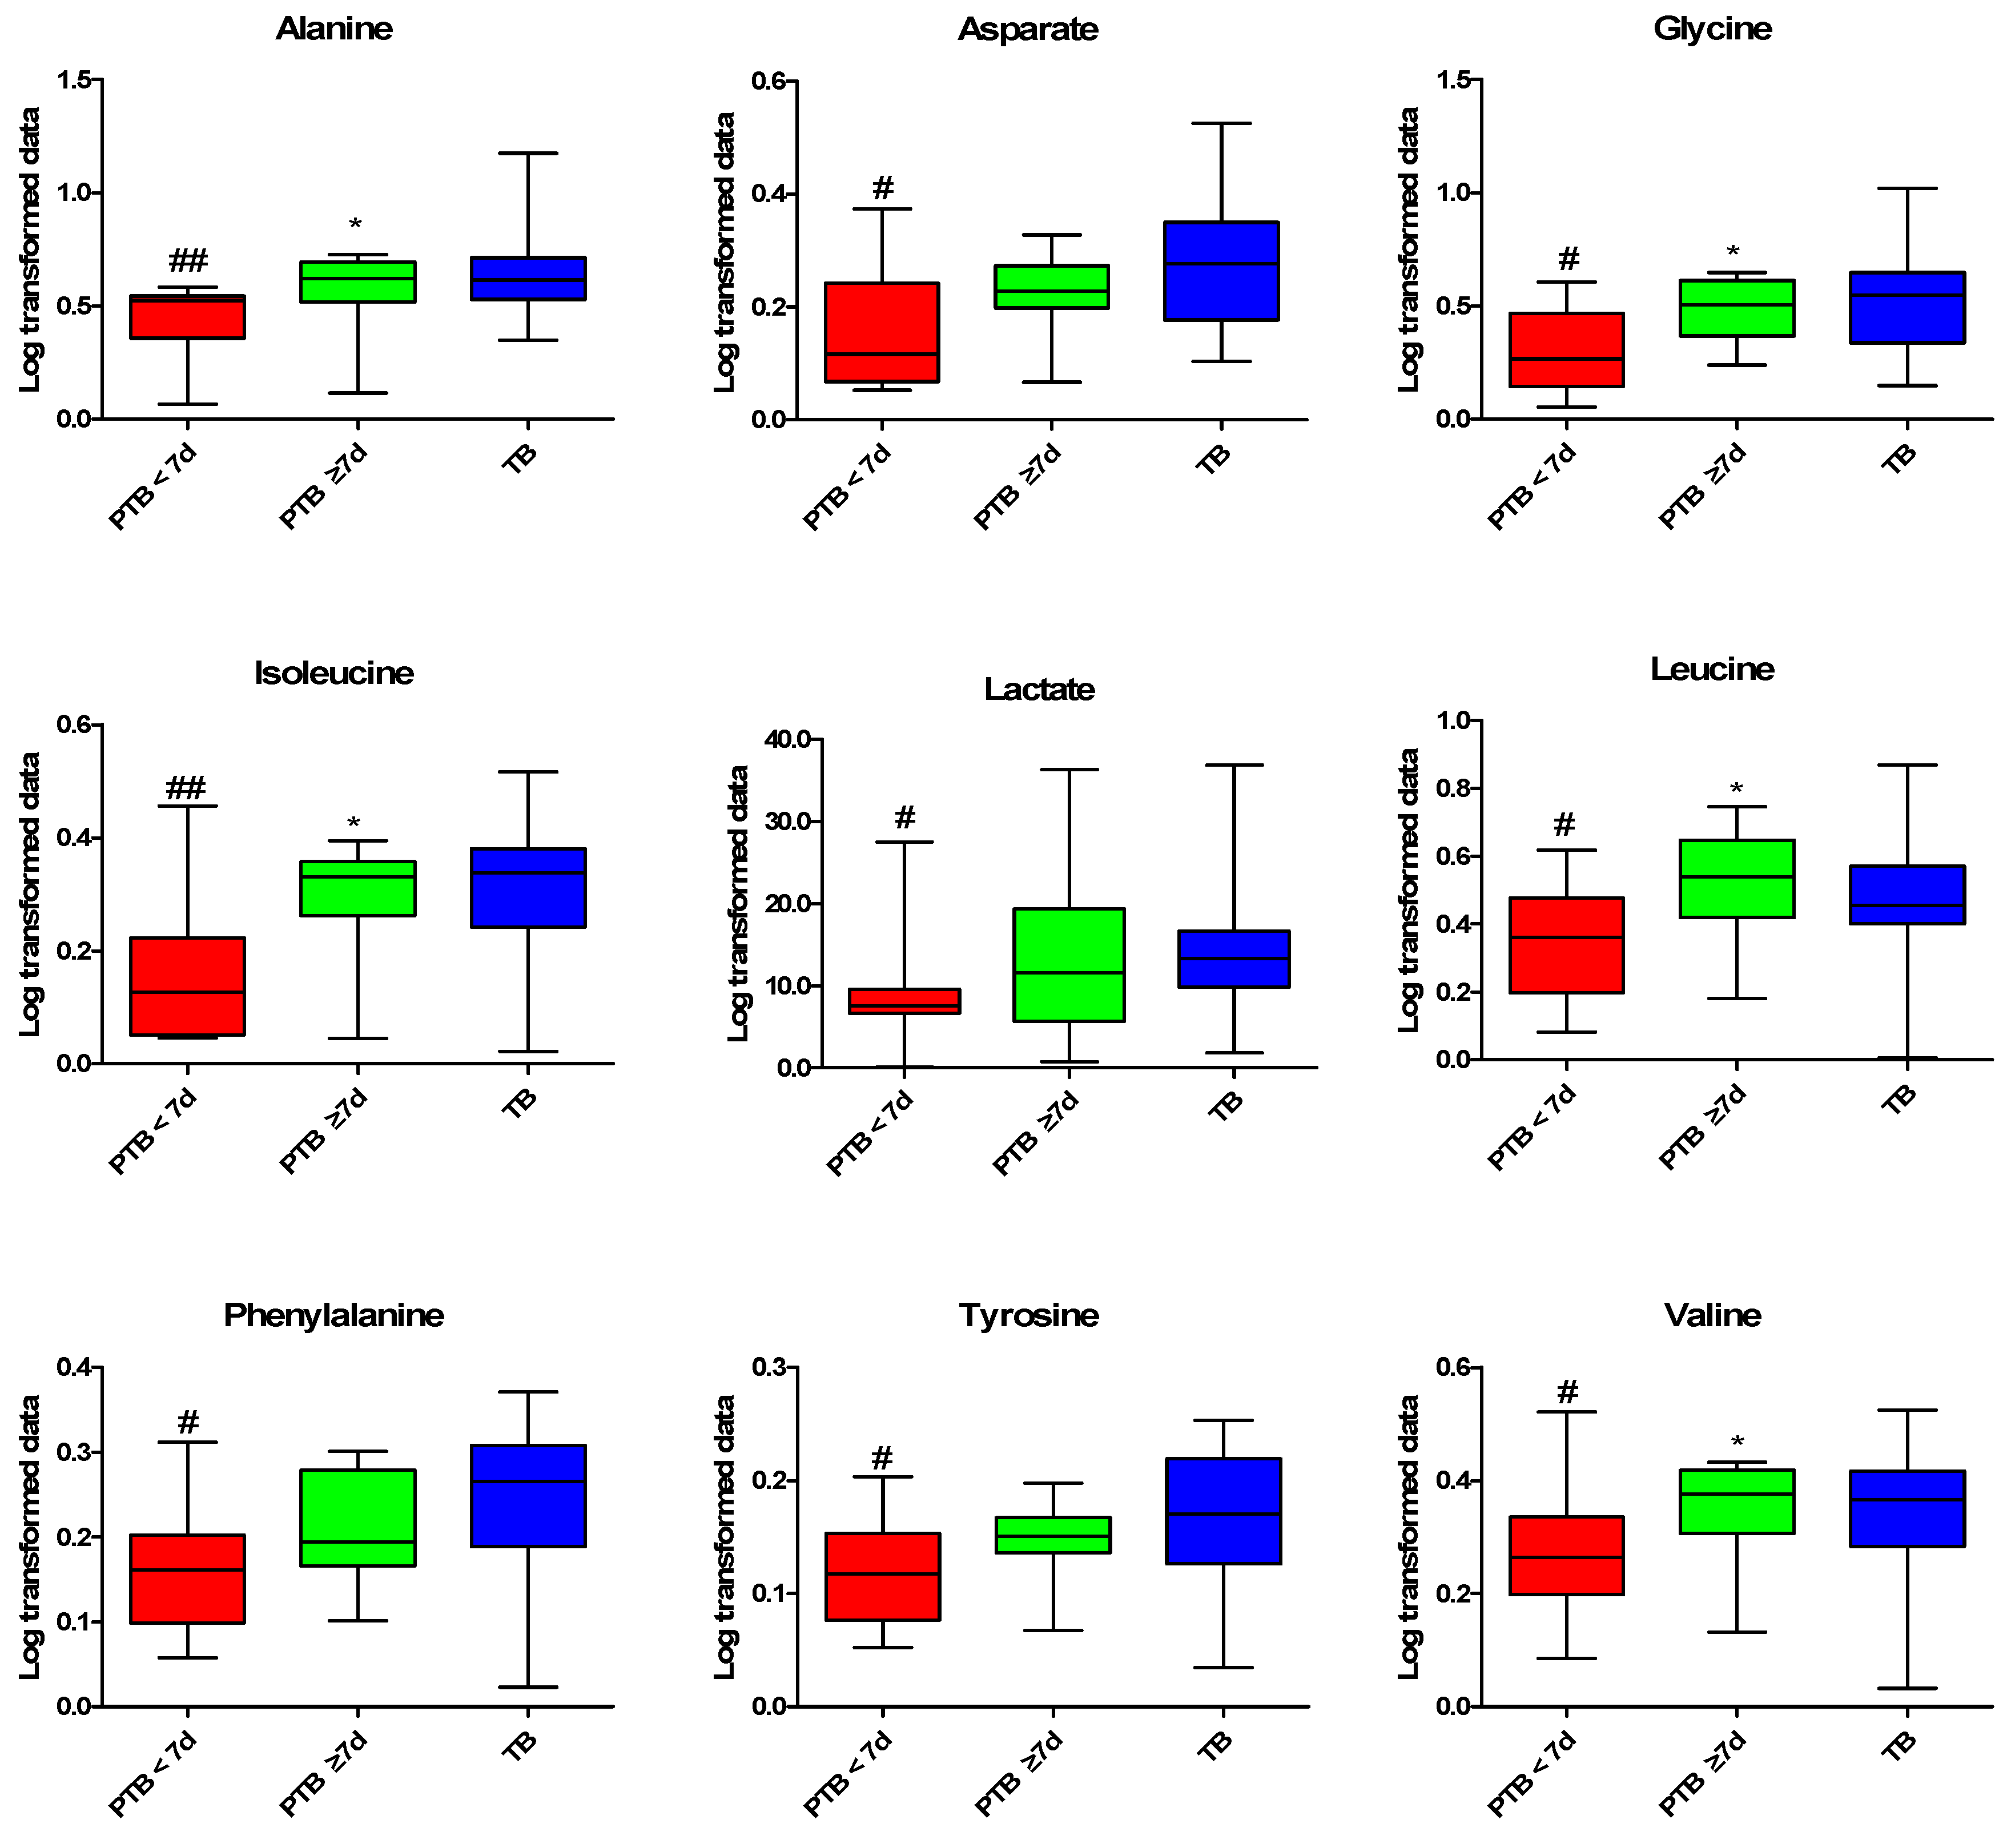
2.3. Quantitative Analysis of the CVF Metabolite
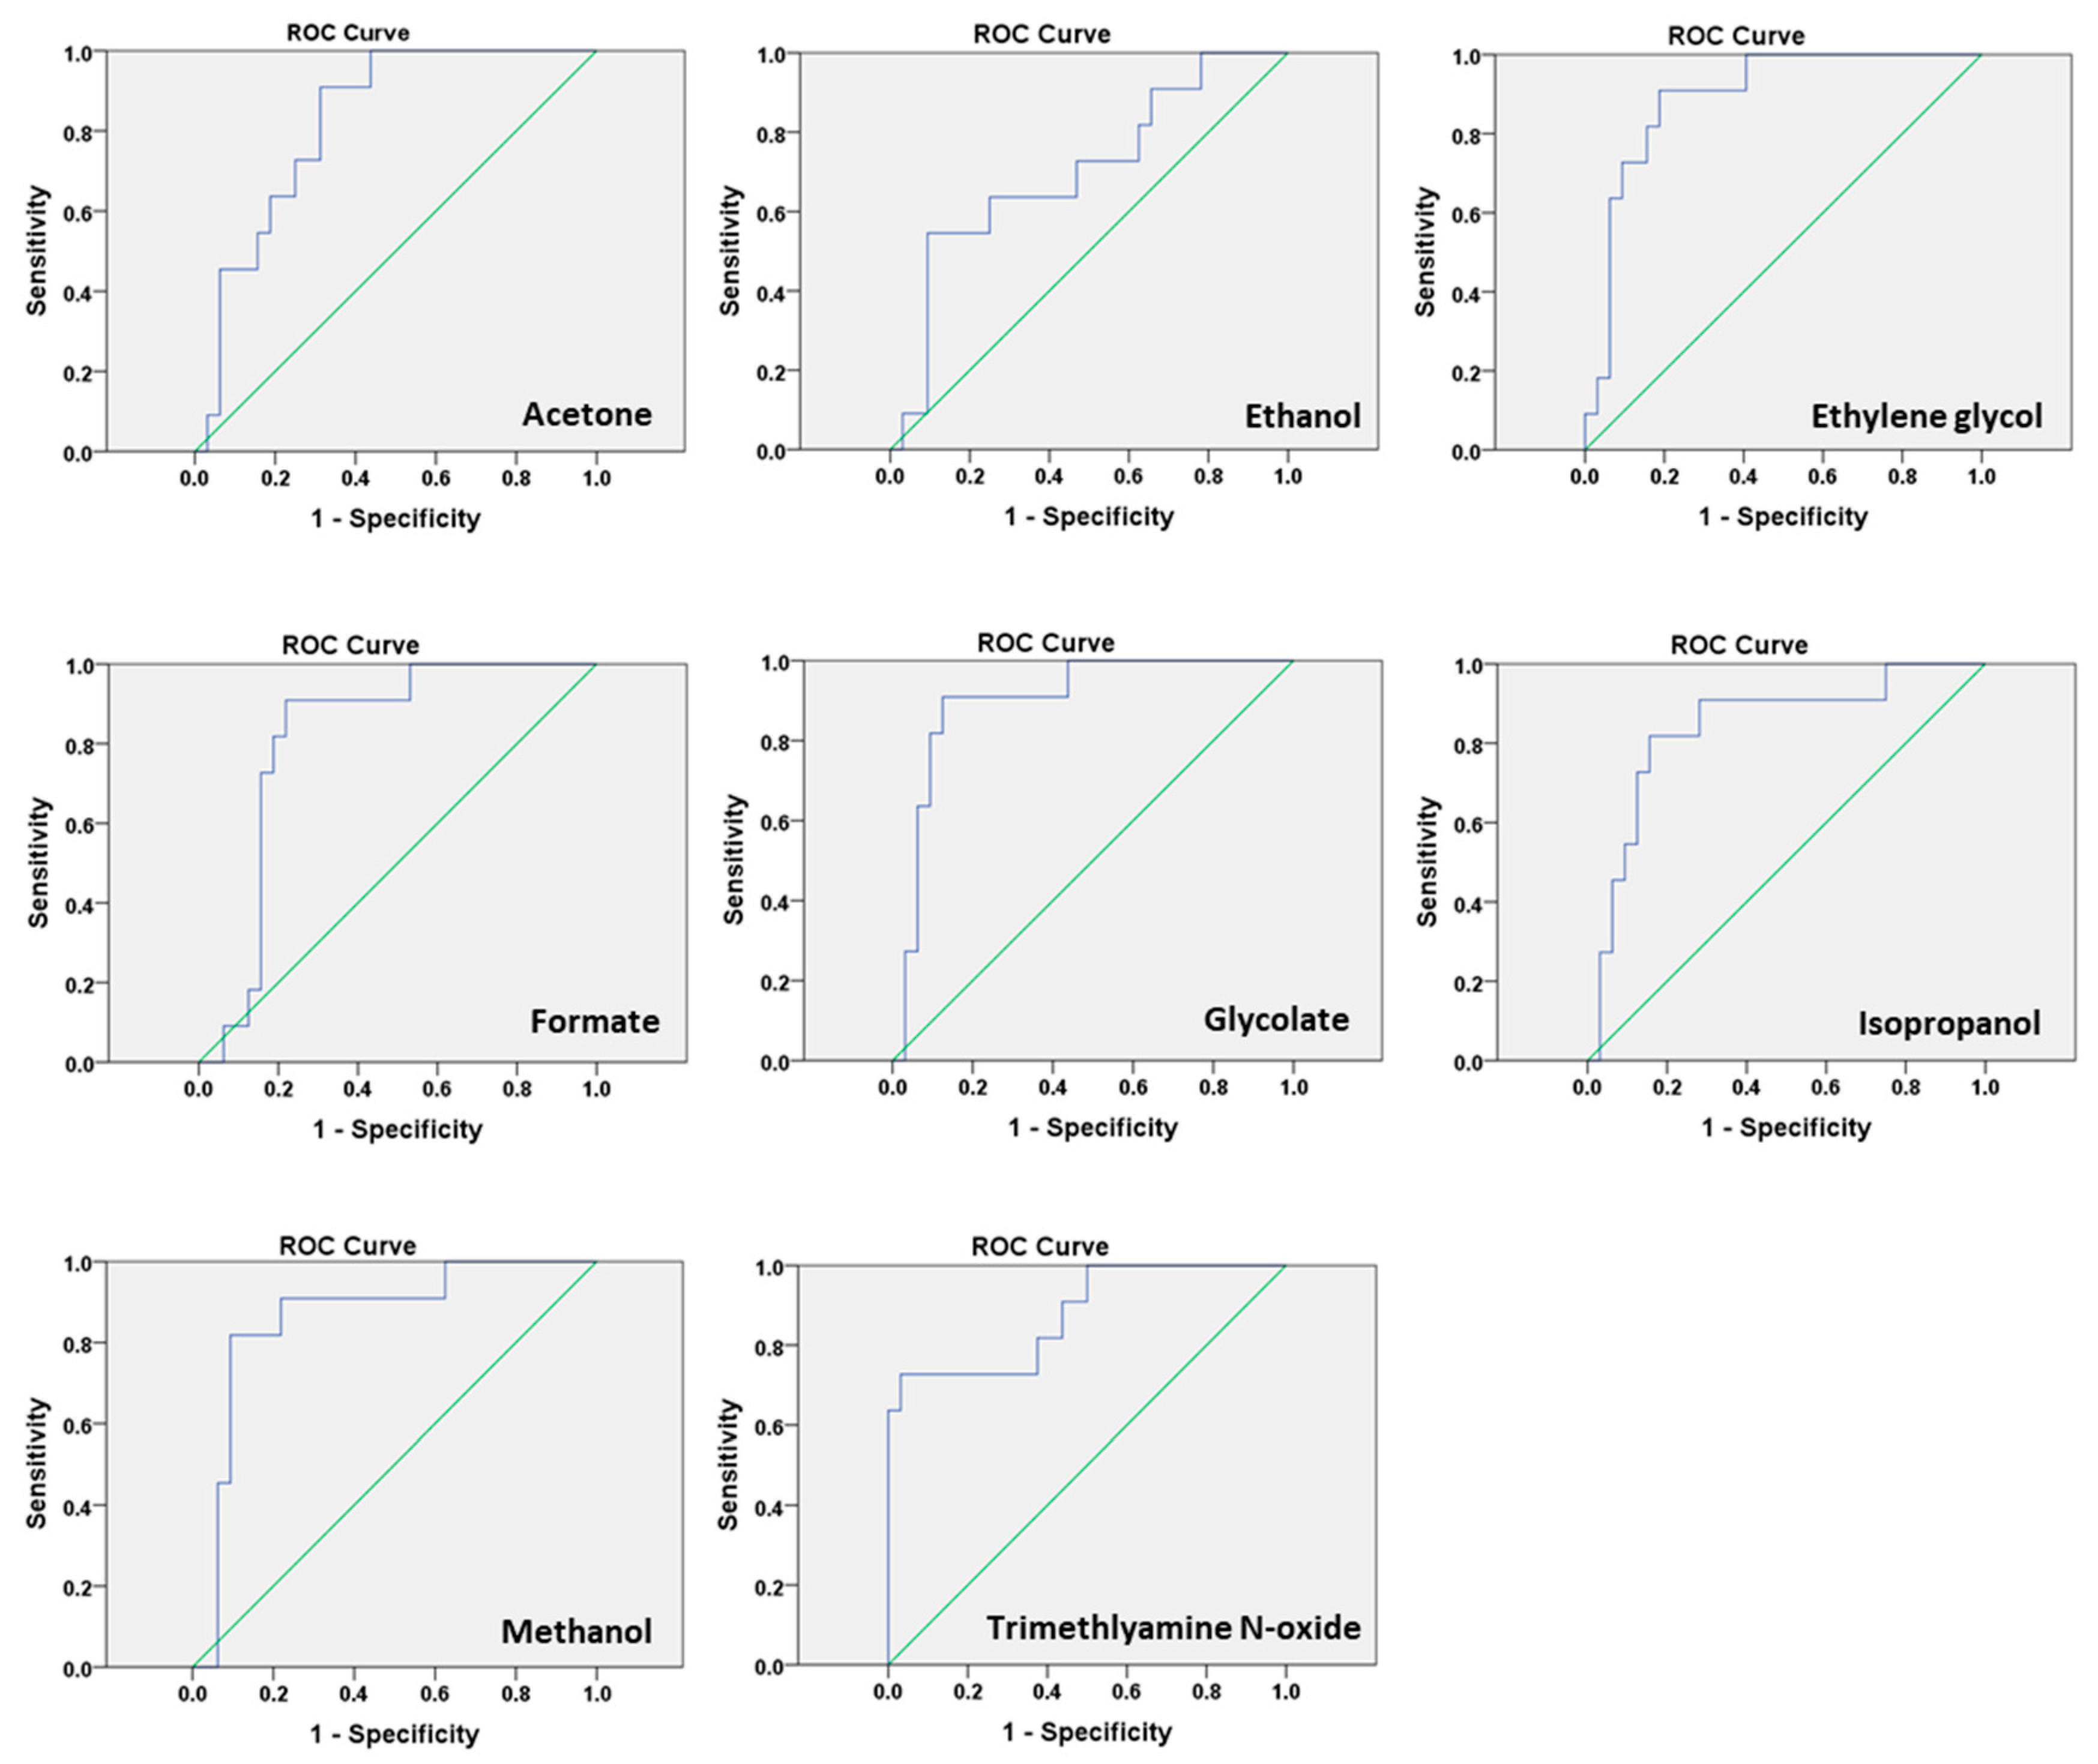
2.4. Predictive Performance and Correlation Analysis for PTB
3. Discussion
4. Materials and Methods
4.1. Study Subjects
4.2. CVF Sample Preparation for NMR Analysis
4.3. H-NMR Experiment
4.4. Data Processing of the 1H-NMR Spectra and Multivariate Analysis
4.5. Statistical Analysis
Supplementary Materials
Author Contributions
Funding
Acknowledgments
Conflicts of Interest
References
- Beck, S.; Wojdyla, D.; Say, L.; Betran, A.P.; Merialdi, M.; Requejo, J.H.; Rubens, C.; Menon, R.; Van Look, P.F.A. The worldwide incidence of preterm birth: A systematic review of maternal mortality and morbidity. Bull. World Health Organ. 2010, 88, 31–38. [Google Scholar] [CrossRef]
- Gordon, A.L.; English, M.; Tumaini Dzombo, J.; Karisa, M.; Newton, C.R.J. Neurological and developmental outcome of neonatal jaundice and sepsis in rural Kenya. Trop. Med. Int. Health 2005, 10, 1114–1120. [Google Scholar] [CrossRef] [PubMed]
- Lawn, J.E.; Cousens, S.; Zupan, J. 4 million neonatal deaths: When? Where? Why? Lancet 2005, 365, 891–900. [Google Scholar] [CrossRef]
- Pennefather, P.; Tin, W. Ocular abnormalities associated with cerebral palsy after preterm birth. Eye 2000, 14, 78–81. [Google Scholar] [CrossRef] [PubMed]
- Blencowe, H.; Cousens, S.; Chou, D.; Oestergaard, M.; Say, L.; Moller, A.-B.; Kinney, M.; Lawn, J. Born too soon: The global epidemiology of 15 million preterm births. Reprod. Health 2013, 10, S2. [Google Scholar] [CrossRef]
- Fettweis, J.M.; Serrano, M.G.; Brooks, J.P.; Edwards, D.J.; Girerd, P.H.; Parikh, H.I.; Huang, B.; Arodz, T.J.; Edupuganti, L.; Glascock, A.L.; et al. The vaginal microbiome and preterm birth. Nat. Med. 2019, 25, 1012–1021. [Google Scholar] [CrossRef]
- Hoyme, U.; Huebner, J. Prevention of preterm birth is possible by vaginal pH screening, early diagnosis of bacterial vaginosis or abnormal vaginal flora and treatment. Gynecol. Obstet. Investig. 2010, 70, 286–290. [Google Scholar] [CrossRef]
- Park, S.; You, Y.-A.; Yun, H.; Choi, S.-J.; Hwang, H.-S.; Choi, S.-K.; Lee, S.M.; Kim, Y.J. Cervicovaginal fluid cytokines as predictive markers of preterm birth in symptomatic women. Obstet. Gynecol. Sci. 2020, 63, 455–463. [Google Scholar] [CrossRef]
- Romero, R.; Hassan, S.S.; Gajer, P.; Tarca, A.L.; Fadrosh, D.W.; Nikita, L.; Galuppi, M.; Lamont, R.F.; Chaemsaithong, P.; Miranda, J.; et al. The composition and stability of the vaginal microbiota of normal pregnant women is different from that of non-pregnant women. Microbiome 2014, 2, 4. [Google Scholar] [CrossRef]
- Boris, S.; Barbés, C. Role played by lactobacilli in controlling the population of vaginal pathogens. Microbes Infect. 2000, 2, 543–546. [Google Scholar] [CrossRef]
- Borgdorff, H.; Gautam, R.; Armstrong, S.D.; Xia, D.; Ndayisaba, G.F.; van Teijlingen, N.H.; Geijtenbeek, T.B.; Wastling, J.M.; van de Wijgert, J.H. Cervicovaginal microbiome dysbiosis is associated with proteome changes related to alterations of the cervicovaginal mucosal barrier. Mucosal Immunol. 2016, 9, 621–633. [Google Scholar] [CrossRef] [PubMed]
- McDonald, H.; O’loughlin, J.; Jolley, P.; Vigneswaran, R.; McDonald, P.J. Vaginal infection and preterm labour. Br. J. Obstet. Gynaecol. 1991, 98, 427–435. [Google Scholar] [CrossRef] [PubMed]
- Freitas, A.C.; Bocking, A.; Hill, J.E.; Money, D.M. Increased richness and diversity of the vaginal microbiota and spontaneous preterm birth. Microbiome 2018, 6, 117. [Google Scholar] [CrossRef] [PubMed]
- You, Y.A.; Kwon, E.J.; Choi, S.J.; Hwang, H.S.; Choi, S.K.; Lee, S.M.; Kim, Y.J. Vaginal microbiome profiles of pregnant women in Korea using a 16S metagenomics approach. Am. J. Reprod. Immunol. 2019, 82, e13124. [Google Scholar] [CrossRef]
- Son, K.-A.; Kim, M.; Kim, Y.M.; Kim, S.H.; Choi, S.-J.; Oh, S.-Y.; Roh, C.-R.; Kim, J.-H. Prevalence of vaginal microorganisms among pregnant women according to trimester and association with preterm birth. Obstet. Gynecol. Sci. 2018, 61, 38–47. [Google Scholar] [CrossRef]
- Pflughoeft, K.J.; Versalovic, J. Human microbiome in health and disease. Annu. Rev. Pathol. 2012, 7, 99–122. [Google Scholar] [CrossRef]
- Li, L.; Kang, J.; Lei, W. Role of Toll-like receptor 4 in inflammation-induced preterm delivery. Mol. Hum. Reprod. 2010, 16, 267–272. [Google Scholar] [CrossRef]
- Mirmonsef, P.; Zariffard, M.R.; Gilbert, D.; Makinde, H.; Landay, A.L.; Spear, G.T. Short-chain fatty acids induce pro-inflammatory cytokine production alone and in combination with toll-like receptor ligands. Am. J. Reprod. Immunol. 2012, 67, 391–400. [Google Scholar] [CrossRef]
- Amabebe, E.; Reynolds, S.; Stern, V.L.; Parker, J.L.; Stafford, G.P.; Paley, M.N.; Anumba, D.O.C. Identifying metabolite markers for preterm birth in cervicovaginal fluid by magnetic resonance spectroscopy. Metabolomics 2016, 12, 67. [Google Scholar] [CrossRef]
- Stafford, G.P.; Parker, J.L.; Amabebe, E.; Kistler, J.; Reynolds, S.; Stern, V.; Paley, M.; Anumba, D.O.C. Spontaneous preterm birth is associated with differential expression of vaginal metabolites by lactobacilli-dominated microflora. Front. Physiol. 2017, 8, 615. [Google Scholar] [CrossRef]
- Horgan, R.; Clancy, O.; Myers, J.; Baker, P.N. An overview of proteomic and metabolomic technologies and their application to pregnancy research. BJOG Int. J. Obstet. Gynaecol. 2009, 116, 173–181. [Google Scholar] [CrossRef] [PubMed]
- DiGiulio, D.B.; Callahan, B.J.; McMurdie, P.J.; Costello, E.K.; Lyell, D.J.; Robaczewska, A.; Sun, C.L.; Goltsman, D.S.; Wong, R.J.; Shaw, G.; et al. Temporal and spatial variation of the human microbiota during pregnancy. Proc. Natl. Acad. Sci. USA 2015, 112, 11060–11065. [Google Scholar] [CrossRef] [PubMed]
- Macfarlane, S.; Macfarlane, G.T. Regulation of short-chain fatty acid production. Proc. Nutr. Soc. 2003, 62, 67–72. [Google Scholar] [CrossRef] [PubMed]
- Ratajczak, W.; Rył, A.; Mizerski, A.; Walczakiewicz, K.; Sipak, O.; Laszczyńska, M. Immunomodulatory potential of gut microbiome-derived short-chain fatty acids (SCFAs). Acta. Biochim. Pol. 2019, 66, 1–12. [Google Scholar] [CrossRef]
- Dominguez-Bello, M.G. Gestational shaping of the maternal vaginal microbiome. Nat. Med. 2019, 25, 882–883. [Google Scholar] [CrossRef] [PubMed]
- Yuan, J.; Chen, C.; Cui, J.; Lu, J.; Yan, C.; Wei, X.; Zhao, X.; Li, N.; Li, S.; Xue, G.; et al. Fatty liver disease caused by high-alcohol-producing Klebsiella pneumoniae. Cell Metab. 2019, 30, 675–688.e7. [Google Scholar] [CrossRef]
- Ren, L.; Men, L.; Zhang, Z.; Guan, F.; Tian, J.; Wang, B.; Wang, J.; Zhang, Y.; Zhang, W. Biodegradation of Polyethylene by Enterobacter sp. D1 from the Guts of Wax Moth Galleria mellonella. Int. J. Environ. Res. Public Health 2019, 16, 1941. [Google Scholar] [CrossRef]
- Mori, N.; Shirakawa, K.; Uzura, K.-S.; Kitamoto, Y.; Ichikawa, Y. Formation of ethylene glycol and trimethylamine from choline by Candida tropicalis. FEMS Microbiol. Lett. 1988, 51, 41–44. [Google Scholar] [CrossRef]
- Holzer, I.; Farr, A.; Kiss, H.; Hagmann, M.; Petricevic, L. The colonization with Candida species is more harmful in the second trimester of pregnancy. Arch. Gynecol. Obstet. 2017, 295, 891–895. [Google Scholar] [CrossRef]
- Kraut, J.A.; Kurtz, I. Toxic alcohol ingestions: Clinical features, diagnosis, and management. Clin. J. Am. Soc. Nephrol. 2008, 3, 208–225. [Google Scholar] [CrossRef]
- Iffland, R.; Staak, M. Methanol and isopropanol as markers of alcoholism. Beitr. Gerichtl. Med. 1990, 48, 173–177. [Google Scholar] [PubMed]
- Hovda, K.E.; Urdal, P.; Jacobsen, D. Increased serum formate in the diagnosis of methanol poisoning. J. Anal. Toxicol. 2005, 29, 586–588. [Google Scholar] [CrossRef] [PubMed]
- Murray, M.; Gayle Huelsmann, B. Labor and Delivery Nursing: Guide to Evidence-Based Practice; Springer Publishing Company: New York, NY, USA, 2008. [Google Scholar]
- Rowland, A.S.; Baird, D.D.; Shore, D.L.; Darden, B.; Wilcox, A.J. Ethylene oxide exposure may increase the risk of spontaneous abortion, preterm birth, and postterm birth. Epidemiology 1996, 7, 363–368. [Google Scholar] [CrossRef] [PubMed]
- Ghartey, J.; Bastek, J.A.; Brown, A.G.; Anglim, L.; Elovitz, M.A. Women with preterm birth have a distinct cervicovaginal metabolome. Am. J. Obstet. Gynecol. 2015, 212, 776.e1–776.e12. [Google Scholar] [CrossRef]
- Haas, D.M.; Morgan, A.M.; Deans, S.J.; Schubert, F.P. Ethanol for preventing preterm birth in threatened preterm labor. Cochrane Database Syst. Rev. 2015, 11. [Google Scholar] [CrossRef]
- Waring, R.; Harris, R.; Mitchell, S.C. Plastic contamination of the food chain: A threat to human health? Maturitas 2018, 115, 64–68. [Google Scholar] [CrossRef]
- Pandey, S.C. TLR4-MyD88 signalling: A molecular target for alcohol actions. Br. J. Pharmacol. 2012, 165, 1316–1318. [Google Scholar] [CrossRef]
- Qing, L.; Wang, T. Lactic acid bacteria prevent alcohol-induced steatohepatitis in rats by acting on the pathways of alcohol metabolism. Clin. Exp. Med. 2008, 8, 187. [Google Scholar] [CrossRef]
- Nosova, T.; Jokelainen, K.; Kaihovaara, P.; Jousimies-Somer, H.; Siitonen, A.; Heine, R.; Salaspuro, M.J.A. Aldehyde dehydrogenase activity and acetate production by aerobic bacteria representing the normal flora of human large intestine. Alcohol Alcohol. 1996, 31, 555–564. [Google Scholar] [CrossRef]
- Rasmussen, L.G.; Winning, H.; Savorani, F.; Toft, H.; Larsen, T.M.; Dragsted, L.O.; Astrup, A.; Engelsen, S.B. Assessment of the effect of high or low protein diet on the human urine metabolome as measured by NMR. Nutrients 2012, 4, 112–131. [Google Scholar] [CrossRef]
- Bergeron, N.; Williams, P.T.; Lamendella, R.; Faghihnia, N.; Grube, A.; Li, X.; Wang, Z.; Knight, R.; Jansson, J.K.; Hazen, S.L.; et al. Diets high in resistant starch increase plasma levels of trimethylamine-N-oxide, a gut microbiome metabolite associated with CVD risk. Br. J. Nutr. 2016, 116, 2020–2029. [Google Scholar] [CrossRef]
- Hollenbeck, C.B. An introduction to the nutrition and metabolism of choline. Cent. Nerv. Syst. Agents Med. Chem. 2012, 12, 100–113. [Google Scholar] [CrossRef]
- Rohrmann, S.; Linseisen, J.; Allenspach, M.; von Eckardstein, A.; Müller, D. Plasma concentrations of trimethylamine-N-oxide are directly associated with dairy food consumption and low-grade inflammation in a German adult population. J. Nutr. 2016, 146, 283–289. [Google Scholar] [CrossRef] [PubMed]
- Chen, K.; Zheng, X.; Feng, M.; Li, D.; Zhang, H. Gut microbiota-dependent metabolite trimethylamine N-oxide contributes to cardiac dysfunction in western diet-induced obese mice. Front. Physiol. 2017, 8, 139. [Google Scholar] [CrossRef] [PubMed]
- Spector, R. New insight into the dietary cause of atherosclerosis: Implications for pharmacology. J. Pharmacol. Exp. Ther. 2016, 358, 103–108. [Google Scholar] [CrossRef] [PubMed]
- Tripolt, N.J.; Leber, B.; Triebl, A.; Köfeler, H.; Stadlbauer, V.; Sourij, H. Effect of Lactobacillus casei Shirota supplementation on trimethylamine-N-oxide levels in patients with metabolic syndrome: An open-label, randomized study. Atherosclerosis 2015, 242, 141–144. [Google Scholar] [CrossRef] [PubMed]
- Tan, J.; McKenzie, C.; Potamitis, M.; Thorburn, A.N.; Mackay, C.R.; Macia, L. The role of short-chain fatty acids in health and disease. Adv. Immunol. 2014, 121, 91–119. [Google Scholar]
- Martinez, K.B.; Leone, V.; Chang, E.B. Microbial metabolites in health and disease: Navigating the unknown in search of function. J. Biol. Chem. 2017, 292, 8553–8559. [Google Scholar] [CrossRef]
- Mautner, E.; Greimel, E.; Trutnovsky, G.; Daghofer, F.; Egger, J.W.; Lang, U. Quality of life outcomes in pregnancy and postpartum complicated by hypertensive disorders, gestational diabetes, and preterm birth. J. Psychosom. Obst. Gyn. 2009, 30, 231–237. [Google Scholar] [CrossRef]
- Blumfield, M.L.; Collins, C.E. High-protein diets during pregnancy: Healthful or harmful for offspring? Am. J. Clin. Nutr. 2014, 100, 993–995. [Google Scholar] [CrossRef]
- Desai, M.; Jellyman, J.K.; Han, G.; Beall, M.; Lane, R.H.; Ross, M.G. Maternal obesity and high-fat diet program offspring metabolic syndrome. Am. J. Obstet. Gynecol. 2014, 211, 237.e1–237.e13. [Google Scholar] [CrossRef] [PubMed]
- Jung, Y.-S.; Hyeon, J.-S.; Hwang, G.-S. Software-assisted serum metabolite quantification using NMR. Anal. Chim. Acta 2016, 934, 194–202. [Google Scholar] [CrossRef] [PubMed]
- McKnight, T.R.; Yoshihara, H.A.; Sitole, L.J.; Martin, J.N.; Steffens, F.; Meyer, D. A combined chemometric and quantitative NMR analysis of HIV/AIDS serum discloses metabolic alterations associated with disease status. Mol. Biosyst. 2014, 10, 2889–2897. [Google Scholar] [CrossRef] [PubMed]
- MacIntyre, D.A.; Jimenez, B.; Lewintre, E.J.; Martín, C.R.; Schäfer, H.; Ballesteros, C.G.; Pineda-Lucena, A. Serum metabolome analysis by 1 H-NMR reveals differences between chronic lymphocytic leukaemia molecular subgroups. Leukemia 2010, 24, 788–797. [Google Scholar] [CrossRef] [PubMed]
- Dieterle, F.; Ross, A.; Schlotterbeck, G.; Senn, H. Probabilistic Quotient Normalization as Robust Method to Account for Dilution of Complex Biological Mixtures. Application in 1H NMR Metabonomics. Anal. Chem. 2006, 78, 4281–4290. [Google Scholar] [CrossRef] [PubMed]


| Individuals | Characteristics | PTB < 7 Days (n = 11) | PTB ≥ 7 Days (n = 11) | TB (n = 21) |
|---|---|---|---|---|
| Mother | Age (years) | 33.3 ± 3 | 30.8 ± 5 | 33.5 ± 4 |
| Pre-pregnancy-BMI (kg/m3) | 21.5 ± 2.7 | 20.4 ± 3 | 21.5 ± 2.3 | |
| GAS (weeks) | 26.3 ± 5.2 | 25.4 ± 5.4 | 23.5 ± 3.4 | |
| GAB (weeks) | 26.6 ± 5.2 a,b | 33.4 ± 3 a,c | 39.3 ± 0.8 b,c | |
| CL (mm) | 9.5 ± 13.8 a,b | 16.5 ± 13.5 a,c | 29.7 ± 4.9 b,c | |
| WBC (1 × 10³/µL) | 11.5 ± 4.2 | 10.6 ± 2.6 | 9.3 ± 1.7 | |
| CRP (mg/dL) | 1 ± 1.7 | 0.4 ± 0.4 | 0.3 ± 0.2 | |
| Infant | Birth weight (g) | 1089.2 ± 596.8 a,b | 2078.6 ± 672.3 a,c | 3282.4 ± 221.2 b,c |
| APGAR 1 (min) | 5 ± 2.8 b | 6.6 ± 2.8 c | 9.8 ± 0.6 b,c | |
| APGAR 5 (min) | 7.1 ± 1.9 a,b | 8.7 ± 1.3 a,c | 10 ± 0.2 b,c |
| Metabolites | AUC. | SEN. | SPE. | PPV. | NPV. | 95% CI. | p-Value |
|---|---|---|---|---|---|---|---|
| Acetone | 0.82 | 90.91% | 68.75% | 50.00% | 95.65% | 0.70–0.95 | 0.0015 |
| Ethanol | 0.71 | 54.55% | 90.62% | 66.67% | 85.29% | 0.52–0.89 | 0.0481 |
| Ethylene glycol | 0.89 | 90.91% | 81.25% | 62.50% | 96.30% | 0.79–0.99 | 0.0001 |
| Formate | 0.81 | 90.91% | 78.12% | 58.82% | 96.15% | 0.68–0.95 | 0.0022 |
| Glycolate | 0.90 | 90.91% | 87.50% | 71.43% | 96.55% | 0.80–1.00 | 0.0001 |
| Isopropanol | 0.84 | 81.82% | 84.38% | 64.29% | 93.10% | 0.70–0.98 | 0.0008 |
| Methanol | 0.86 | 81.82% | 90.62% | 75.00% | 93.55% | 0.73–0.99 | 0.0004 |
| Trimethylamine N-oxide | 0.88 | 72.73% | 96.88% | 88.89% | 91.18% | 0.75–1.00 | 0.0002 |
| Metabolites | Pre-BMI | GAB | CL | WBC | CRP |
|---|---|---|---|---|---|
| Ethylene glycol | −0.208 | −0.584 *** | −0.505 *** | 0.134 | 0.187 |
| Formate | −0.030 | −0.243 | −0.316 * | −0.021 | 0.103 |
| Glycolate | −0.290 | −0.345 * | −0.305 * | 0.226 | 0.181 |
| Isopropanol | −0.048 | −0.283 | −0.302 * | −0.095 | 0.059 |
| Methanol | −0.125 | −0.352 * | −0.337 * | −0.021 | 0.093 |
| Trimethylamine N-oxide | −0.062 | −0.682 *** | −0.400 ** | 0.044 | 0.167 |
© 2020 by the authors. Licensee MDPI, Basel, Switzerland. This article is an open access article distributed under the terms and conditions of the Creative Commons Attribution (CC BY) license (http://creativecommons.org/licenses/by/4.0/).
Share and Cite
Ansari, A.; Lee, H.; You, Y.-A.; Jung, Y.; Park, S.; Kim, S.M.; Hwang, G.-S.; Kim, Y.J. Identification of Potential Biomarkers in the Cervicovaginal Fluid by Metabolic Profiling for Preterm Birth. Metabolites 2020, 10, 349. https://doi.org/10.3390/metabo10090349
Ansari A, Lee H, You Y-A, Jung Y, Park S, Kim SM, Hwang G-S, Kim YJ. Identification of Potential Biomarkers in the Cervicovaginal Fluid by Metabolic Profiling for Preterm Birth. Metabolites. 2020; 10(9):349. https://doi.org/10.3390/metabo10090349
Chicago/Turabian StyleAnsari, AbuZar, Heeyeon Lee, Young-Ah You, Youngae Jung, Sunwha Park, Soo Min Kim, Geum-Sook Hwang, and Young Ju Kim. 2020. "Identification of Potential Biomarkers in the Cervicovaginal Fluid by Metabolic Profiling for Preterm Birth" Metabolites 10, no. 9: 349. https://doi.org/10.3390/metabo10090349
APA StyleAnsari, A., Lee, H., You, Y.-A., Jung, Y., Park, S., Kim, S. M., Hwang, G.-S., & Kim, Y. J. (2020). Identification of Potential Biomarkers in the Cervicovaginal Fluid by Metabolic Profiling for Preterm Birth. Metabolites, 10(9), 349. https://doi.org/10.3390/metabo10090349