Metabolic Profiles of Whole, Parotid and Submandibular/Sublingual Saliva


 , ,
, , 
 ,
, 
Abstract
1. Introduction
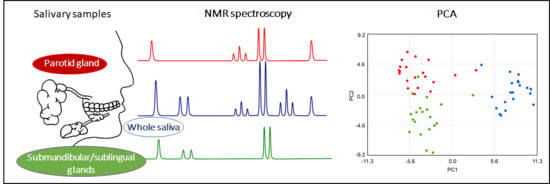
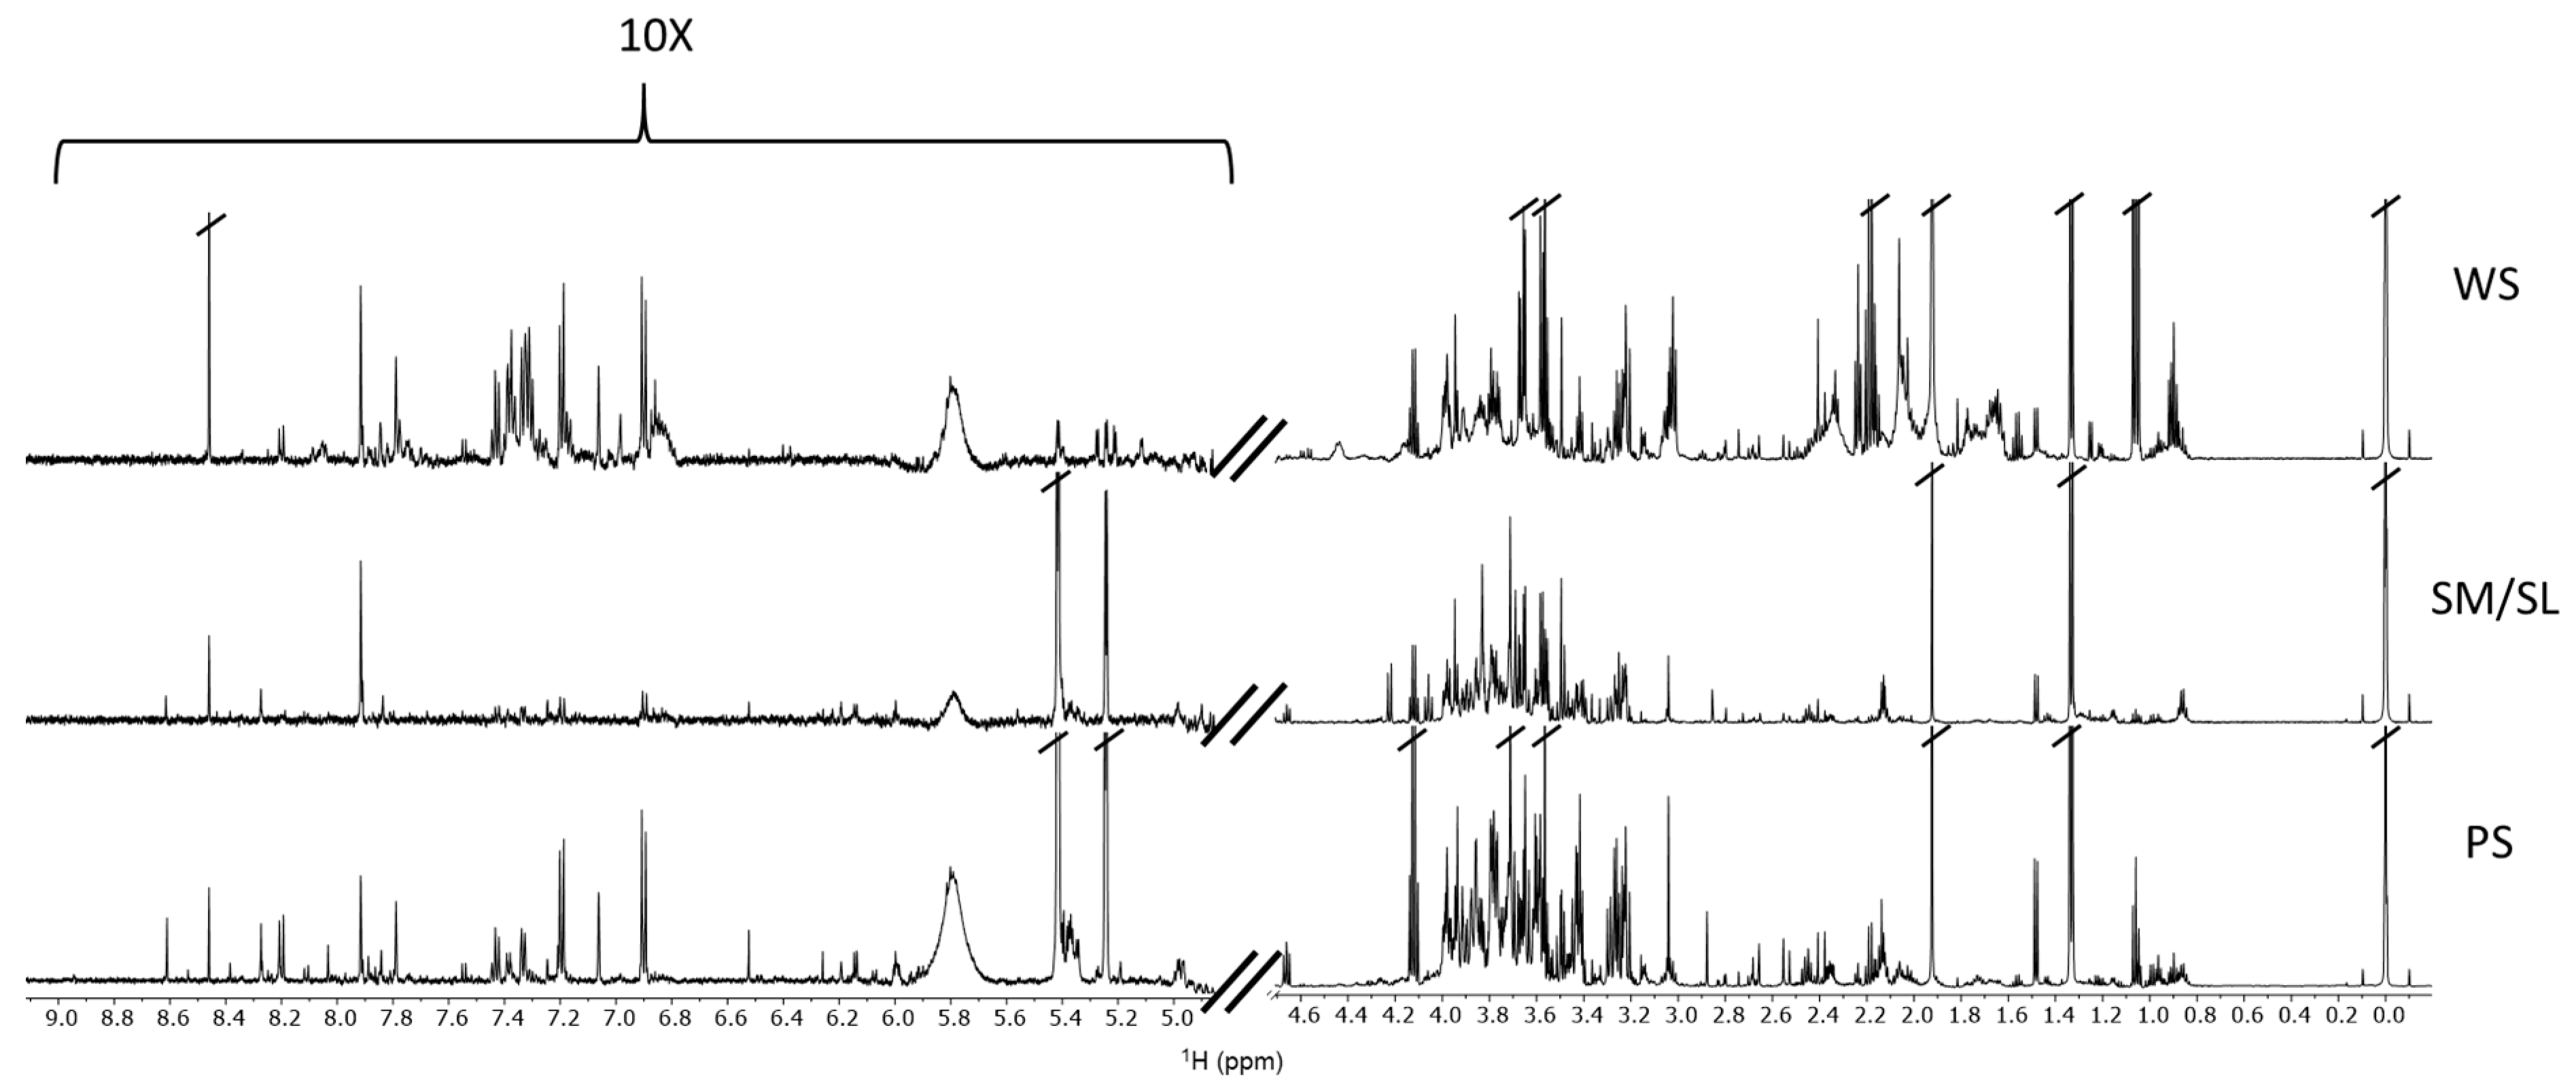
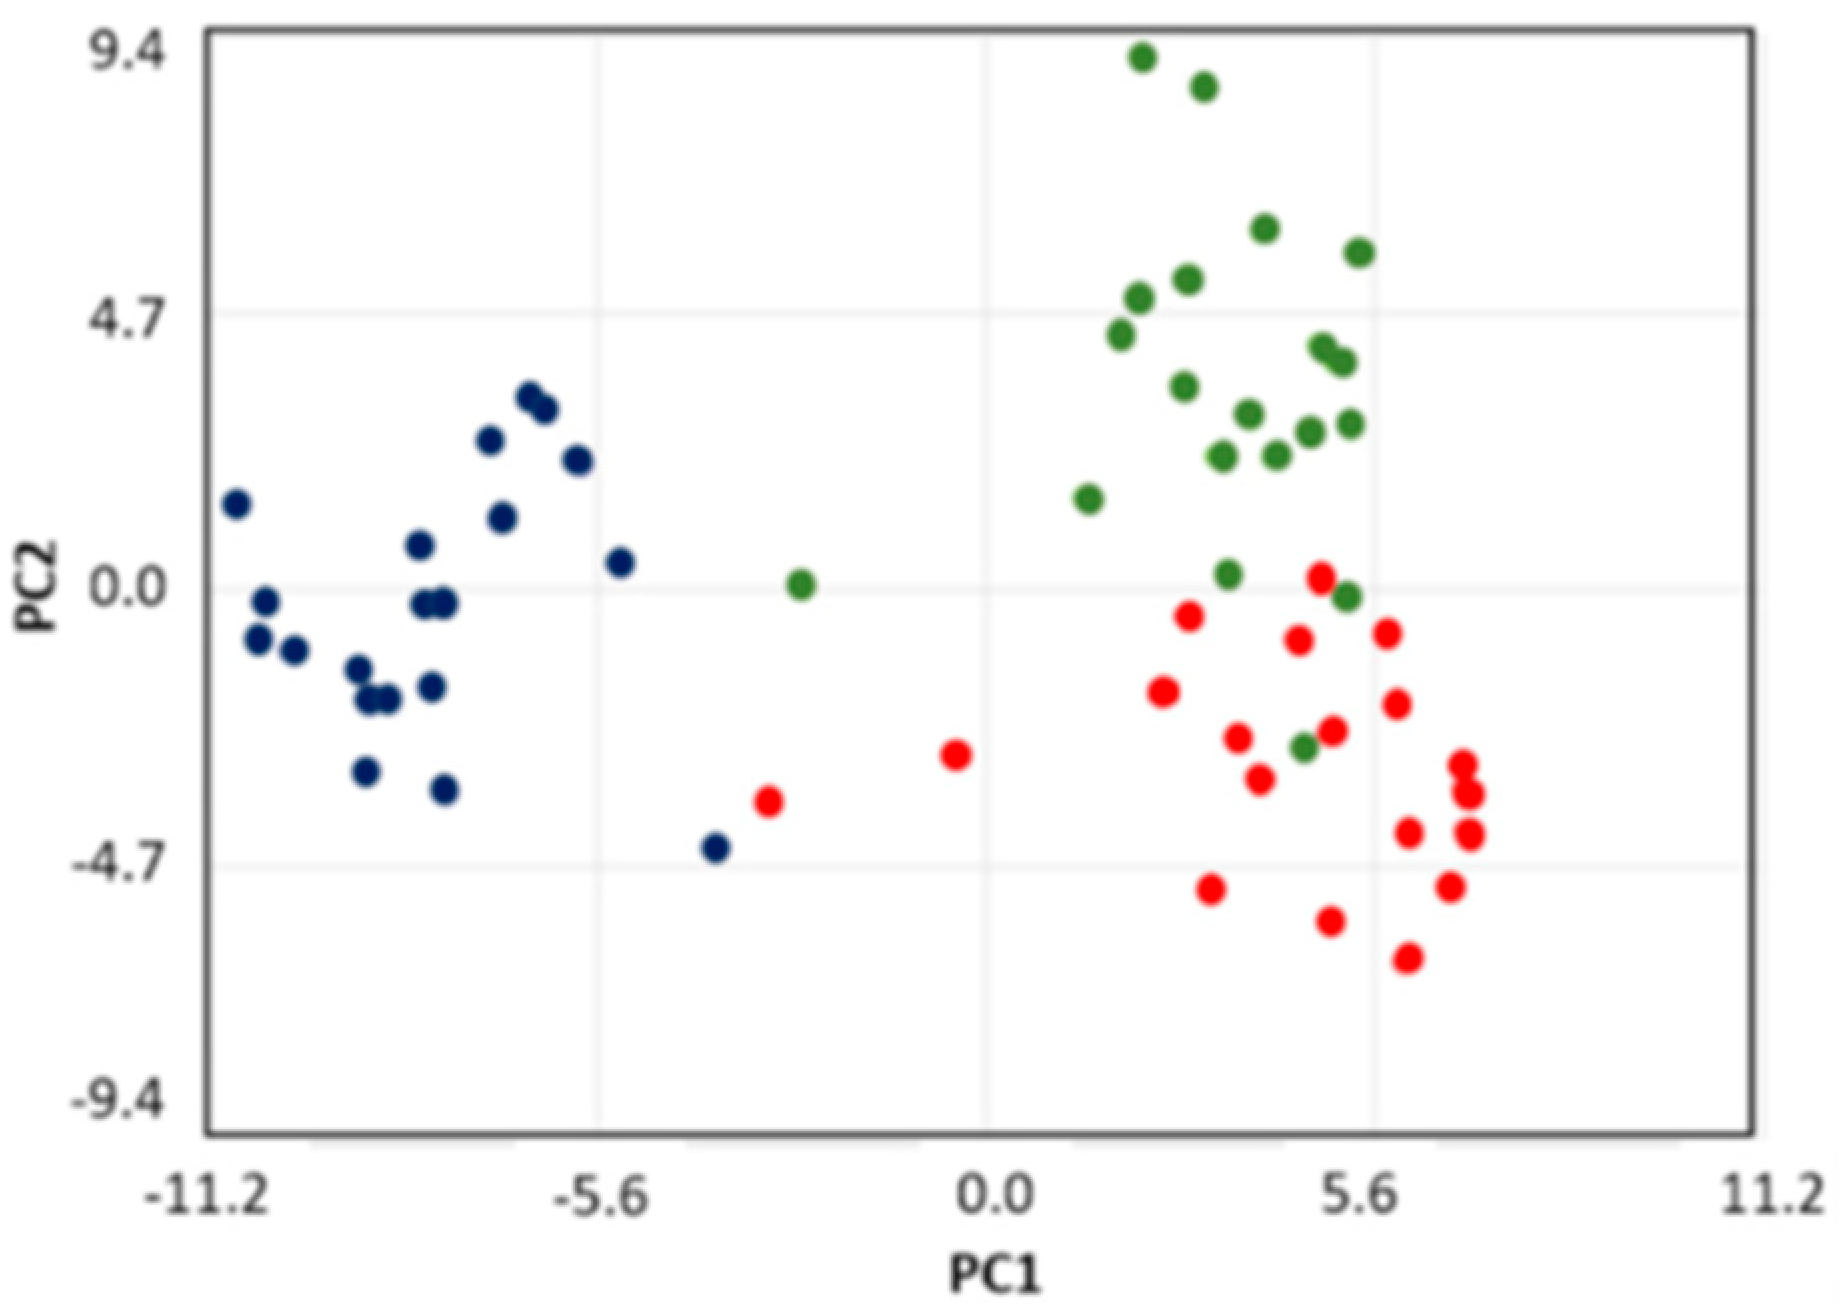
2. Results
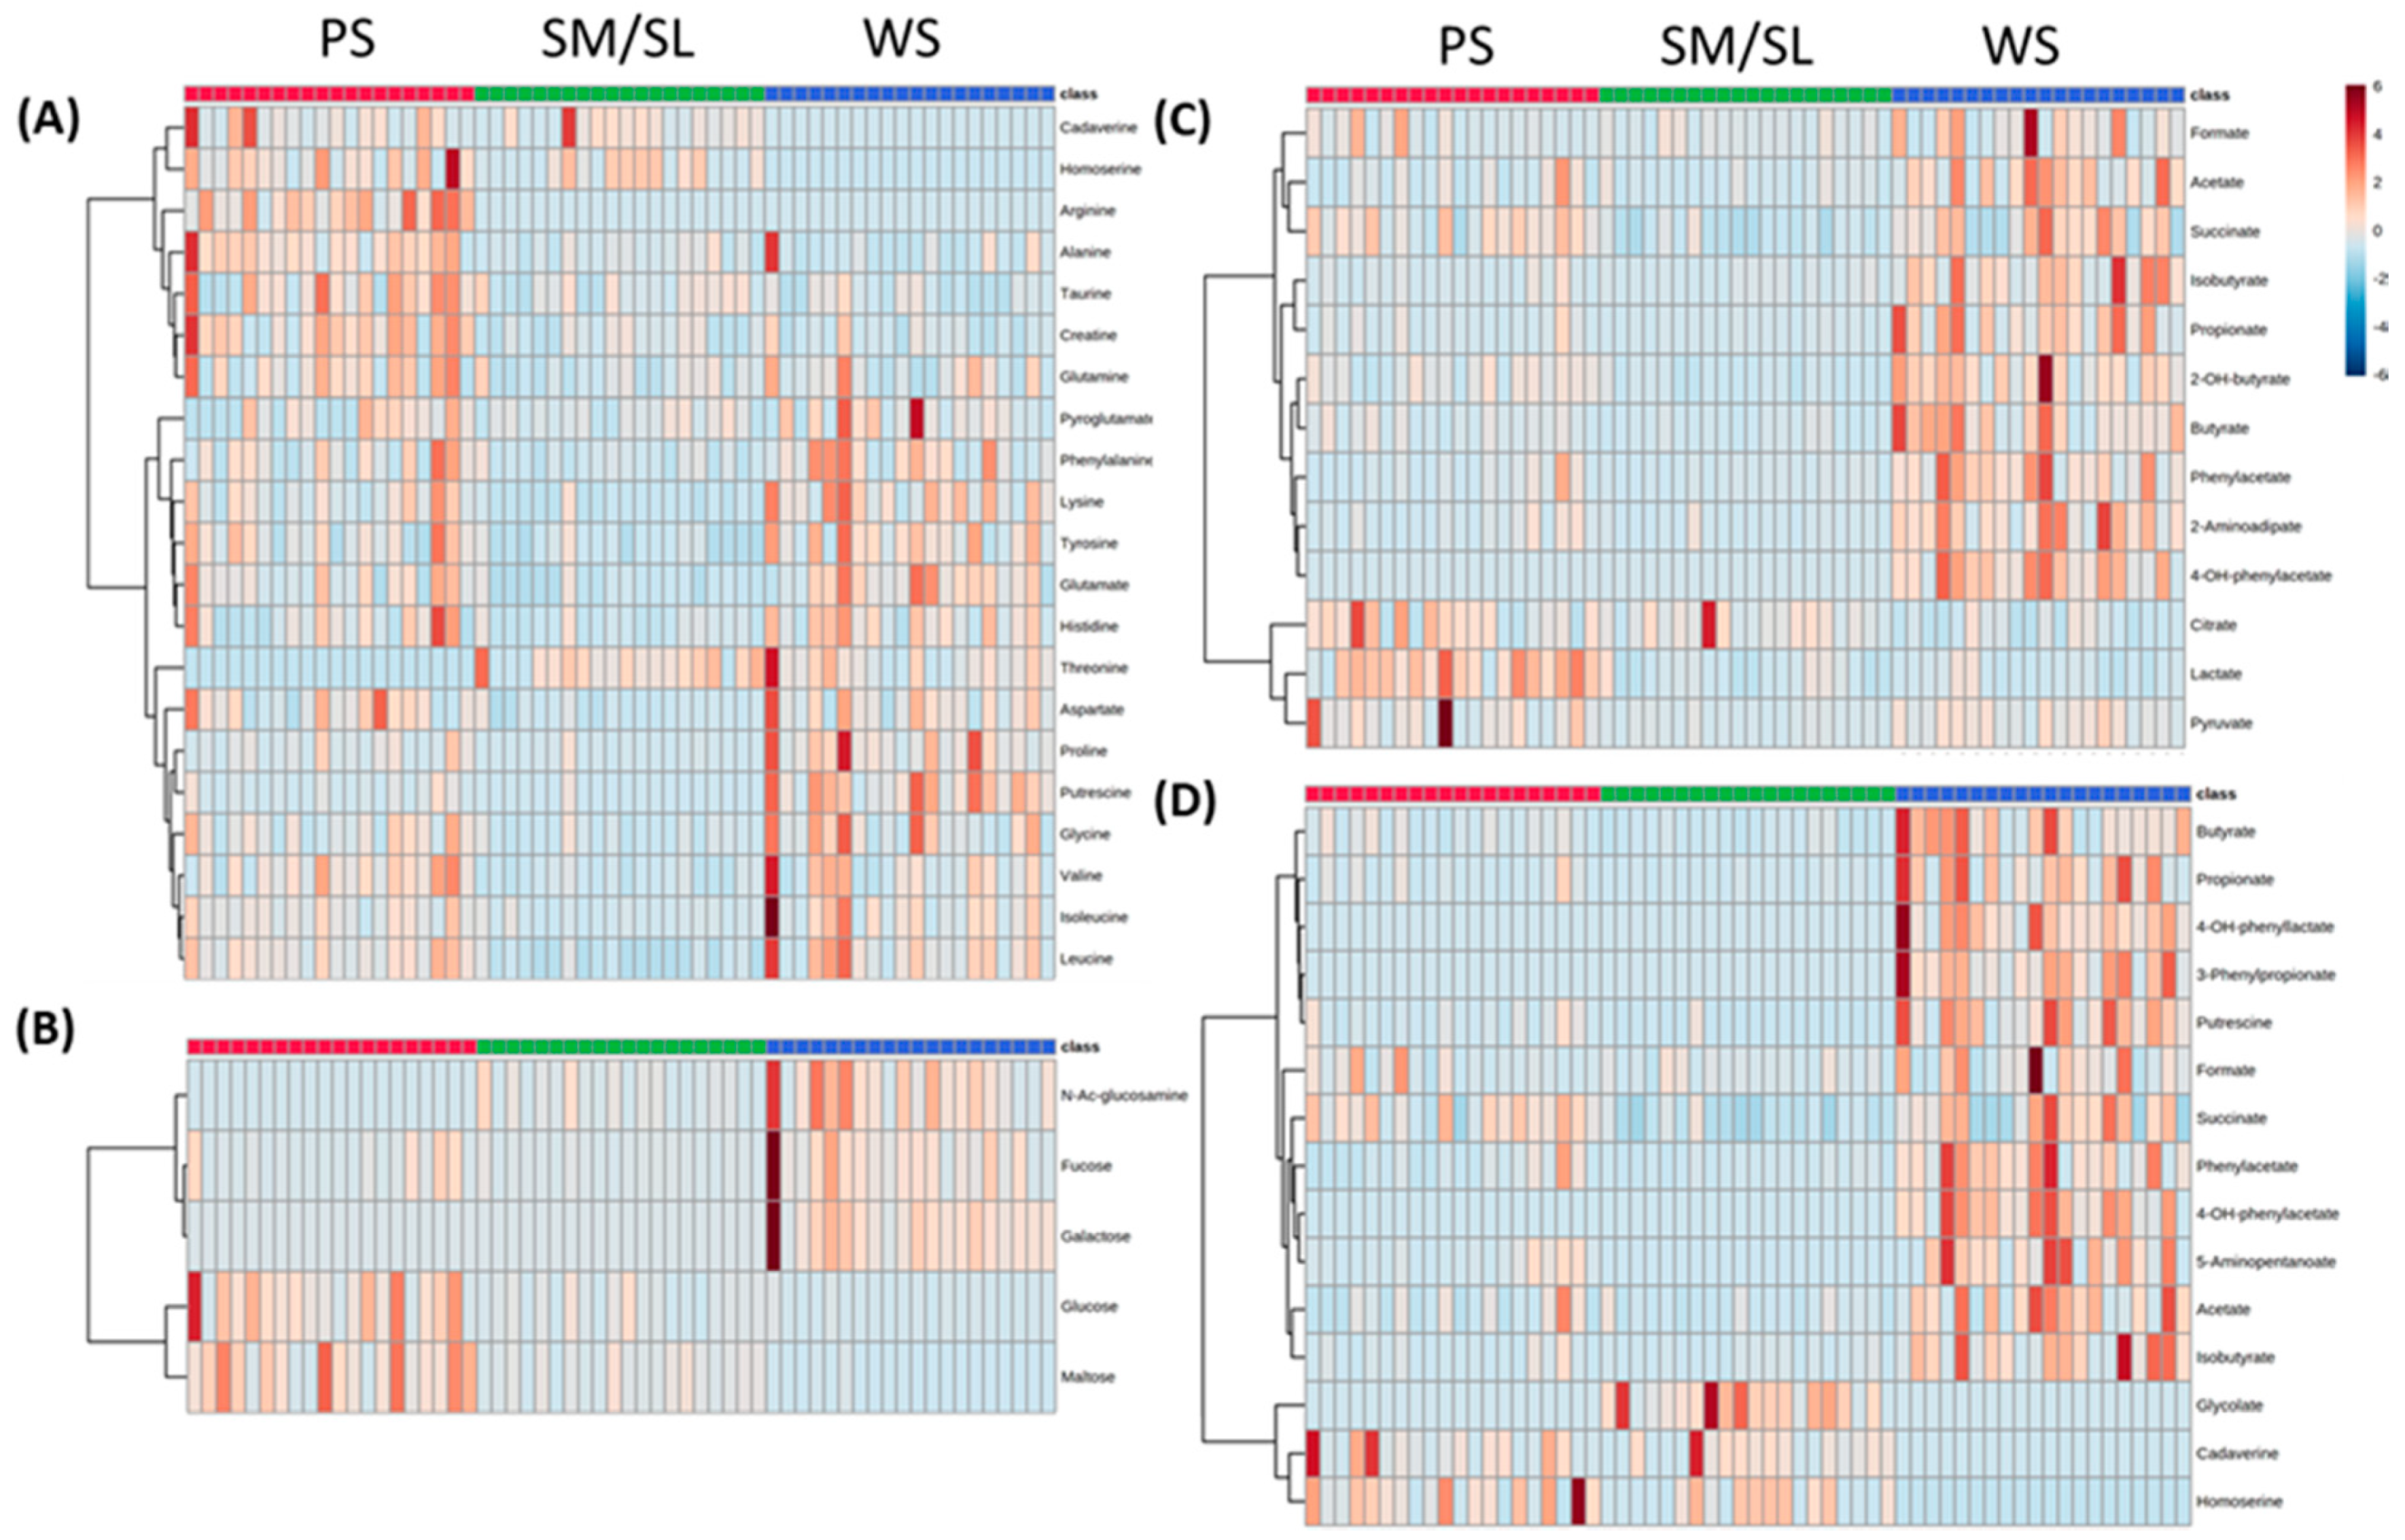
2.1. Metabolite Content of Saliva Subtypes: Emerging Differences
2.2. Salivary Metabolites
2.3. Classes of Metabolites
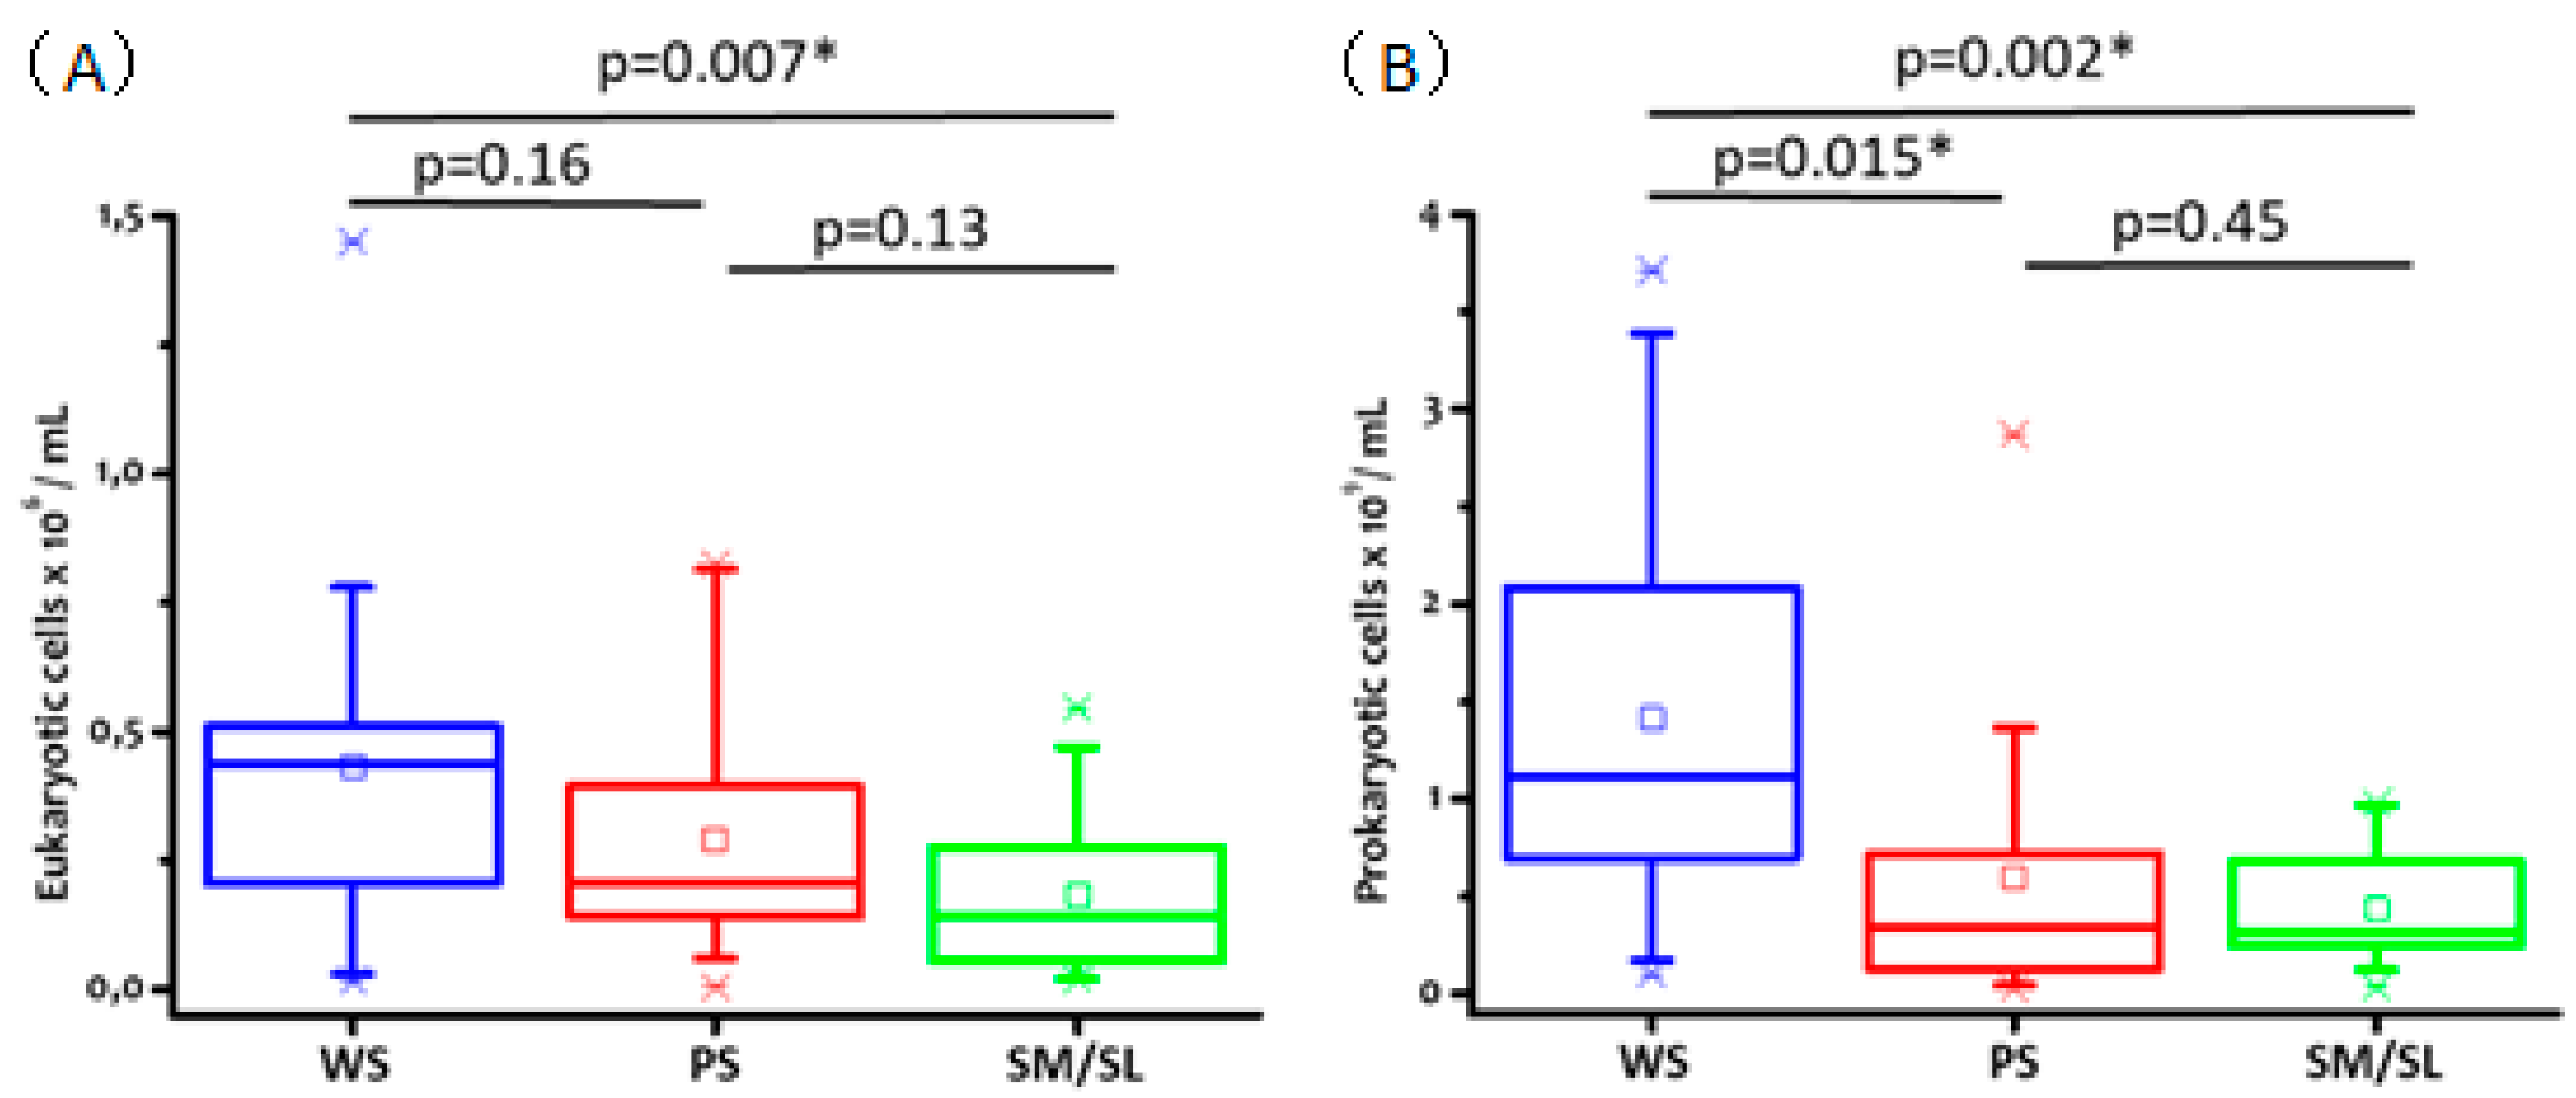
2.4. Salivary Cell Count
3. Discussion
4. Materials and Methods
4.1. Subjects of the Study
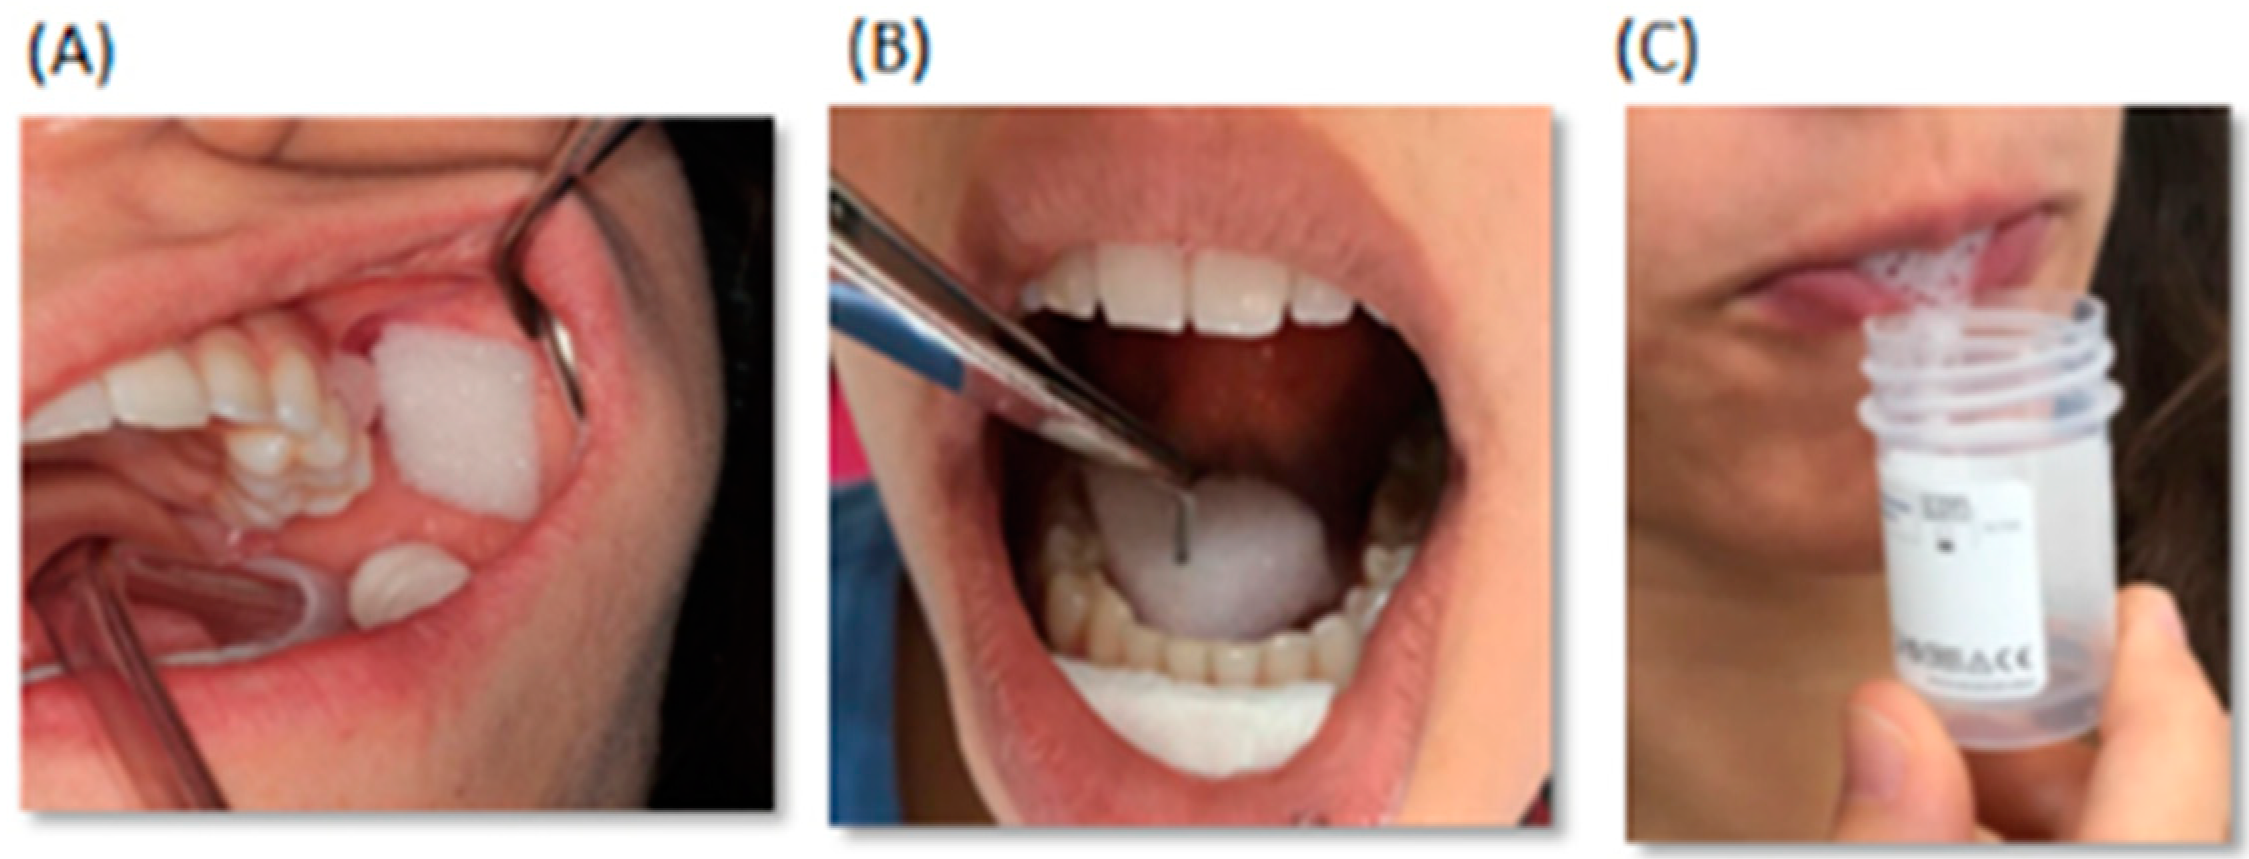
4.2. Saliva Collection
4.3. Sample Preparation and 1H-NMR Spectra Collection and Analysis
4.4. Cell Counting
4.5. Statistical Analysis
Author Contributions
Funding
Acknowledgments
Conflicts of Interest
References
- De Almeida, P.D.V.; Grégio, A.M.; Machado, M.A.; de Lima, A.A.; Azevedo, L.R. Saliva composition and functions: A comprehensive review. J. Contemp. Dent. Pract. 2008, 9, 72–80. [Google Scholar]
- Wallner-Liebmann, S.; Tenori, L.; Mazzoleni, A.; Dieber-Rothenederm, M.; Konrad, M.; Hofmann, P.; Luchinat, C.; Turano, P.; Zatloukal, K. Individual Human Metabolic Phenotype Analyzed by 1H NMR of Saliva Samples. J. Proteom. Res. 2016, 15, 1787–1793. [Google Scholar] [CrossRef] [PubMed]
- Setti, G.; Pezzi, M.E.; Viani, M.V.; Pertinhez, T.A.; Cassi, D.; Magnoni, C.; Bellini, P.; Musolino, A.; Vescovi, P.; Meleti, M. Salivary MicroRNA for Diagnosis of Cancer and Systemic Diseases: A Systematic Review. Int. J. Mol. Sci. 2020, 21, 907. [Google Scholar] [CrossRef] [PubMed]
- Slavish, D.C.; Graham-Engeland, J.E.; Smyth, J.M.; Engeland, C.G. Salivary markers of inflammation in response to acute stress. Brain Behav. Immun. 2015, 44, 253–269. [Google Scholar] [CrossRef] [PubMed]
- Figueira, J.; Gouveia-Figueira, S.; Öhman, C.; Lif Holgerson, P.; Nording, M.L.; Öhman, A. Metabolite quantification by NMR and LC-MS/MS reveals differences between unstimulated; stimulated; and pure parotid saliva. J. Pharm. Biomed. Anal. 2017, 140, 295–300. [Google Scholar] [CrossRef] [PubMed]
- Fábián, T.K.; Fejérdy, P.; Csermely, P. Salivary genomics, transcriptomics and proteomics: The emerging concept of the oral ecosystem and their use in the early diagnosis of cancer and other diseases. Curr. Genom. 2008, 9, 11–21. [Google Scholar] [CrossRef] [PubMed]
- Schipper, R.G.; Silletti, E.; Vingerhoeds, M.H. Saliva as research material: Biochemical, physicochemical and practical aspects. Arch. Oral Biol. 2007, 52, 1114–1135. [Google Scholar] [CrossRef] [PubMed]
- Gardner, A.; Parkes, H.G.; So, P.W.; Carpenter, G.H. Determining bacterial and host contributions to the human salivary metabolome. J. Oral Microb. 2019, 11, 1617014. [Google Scholar] [CrossRef]
- Pereira, J.L.; Duarte, D.; Carneiro, T.J.; Ferreira, S.; Cunha, B.; Solares, D.; Cosa, A.L.; Gil, A.M. Saliva NMR metabolomics: Analytical issues in pediatric oral health research. Oral Dis. 2019, 25, 1545–1554. [Google Scholar] [CrossRef]
- Dame, Z.T.; Aziat, F.; Mandal, R.; Krishnamurthy, R.; Bouatra, S.; Borzouie, S.; Guo, A.C.; Sajed, T.; Deng, L.; Lin, H.; et al. The human saliva metabolome. Metabolomics 2015, 11, 1864–1883. [Google Scholar] [CrossRef]
- Gardner, A.; Carpenter, G.; So, P.W. Salivary Metabolomics: From Diagnostic Biomarker Discovery to Investigating Biological Function. Metabolites 2020, 10, 47. [Google Scholar] [CrossRef] [PubMed]
- Yamada-Nosaka, A.; Fukutomi, S.; Uemura, S.; Hashida, T.; Fujishita, M.; Kobayashi, Y.; Kyogoku, Y. Preliminary nuclear magnetic resonance studies on human saliva. Arch. Oral Biol. 1991, 36, 697–701. [Google Scholar] [CrossRef]
- Lohavanichbutr, P.; Zhang, Y.; Wang, P.; Gu, H.; Nagana Gowda, G.A.; Djukovic, D.; Buas, M.F.; Raftery, D.; Che, C. Salivary metabolite profiling distinguishes patients with oral cavity squamous cell carcinoma from normal controls. PLoS ONE 2018, 13, e0204249. [Google Scholar] [CrossRef] [PubMed]
- Mikkonen, J.J.W.; Singh, S.P.; Akhi, R.; Salo, T.; Lappalainen, R.; González-Arriagada, W.A.; Lopes, M.A.; Kullaa, A.M.; Myllymaa, S. Potential role of nuclear magnetic resonance spectroscopy to identify salivary metabolite alterations in patients with head and neck cancer. Oncol. Lett. 2018, 16, 6795–6800. [Google Scholar] [CrossRef] [PubMed]
- Kumari, S.; Goyal, V.; Kumaran, S.S.; Dwivedi, S.N.; Srivastava, A.; Jagannathan, N.R. Quantitative metabolomics of saliva using proton NMR spectroscopy in patients with Parkinson’s disease and healthy controls. Neurol. Sci. 2020, 41, 1201–1210. [Google Scholar] [CrossRef] [PubMed]
- Meleti, M.; Cassi, D.; Vescovi, P.; Setti, G.; Pertinhez, T.A.; Pezzi, M.E. Salivary biomarkers for diagnosis of systemic diseases and malignant tumors. A systematic review. Med. Oral Patol. Oral Cir. Bucal 2020, 25, e299–e310. [Google Scholar] [CrossRef]
- Pitti, E.; Petrella, G.; Di Marino, S.; Summa, V.; Perrone, M.; D’Ottavio, S.; Bernardini, A.; Cicero, D.O. Salivary metabolome and soccer match: Challenges for understanding exercise induced changes. Metabolites 2019, 9, 141. [Google Scholar] [CrossRef]
- Cicero, D.O.; Di Marino, S.; Dinallo, V.; Pero, M.; Summa, V.; Desideri, A.; Bernardini, A.; Perondi, S.; D’Ottavio, S. A small sided game session affects salivary metabolite levels in young soccer players. Biomed. Spectrosc. Imaging 2016, 5, 55–70. [Google Scholar] [CrossRef]
- Percival, R.S.; Challacombe, S.j.; Marshi, P.D. Flow rates of resting whole and stimulated parotid saliva in relation to age and gender. J. Dent. Res. 1994, 73, 1416–1420. [Google Scholar] [CrossRef]
- Ship, J.A.; Nolan, N.E.; Puckett, S.A. Longitudinal analysis of parotid and submandibular salivary flow rates in healthy, different-aged adults. J. Gerontol. A Biol. Sci. Med. Sci. 1995, 50, M285–M289. [Google Scholar] [CrossRef]
- Smith, E.A.; Macfarlane, G.T. Formation of phenolic and indolic compounds by anaerobic bacteria in the human large intestine. Microb. Ecol. 1997, 33, 180–188. [Google Scholar] [CrossRef] [PubMed]
- Sender, R.; Fuchs, S.; Milo, R. Revised estimates for the number of human and bacteria cells in the body. PLoS Biol. 2016, 14, e1002533. [Google Scholar] [CrossRef] [PubMed]
- Thomadaki, K.; Helmerhorst, E.J.; Tian, N.; Sun, X.; Siqueira, W.L.; Walt, D.R.; Oppenheim, F.G. Whole-saliva proteolysis and its impact on salivary diagnostics. J. Dent. Res. 2011, 90, 1325–1330. [Google Scholar] [CrossRef] [PubMed]
- Takahashi, N. Oral microbiome metabolism: From "who are they?" to "what are they doing?". J. Dent. Res. 2015, 94, 1628–1637. [Google Scholar] [CrossRef] [PubMed]
- Levine, M. Susceptibility to dental caries and the salivary proline-rich proteins. Int. J. Dent. 2011, 953412. [Google Scholar] [CrossRef]
- Zalewska, A.; Zwierz, K.; Zółkowski, K.; Gindzieński, A. Structure and biosynthesis of human salivary mucins. Acta Biochim. Pol. 2000, 47, 1067–1079. [Google Scholar] [CrossRef]
- Cooke, M.; Leeves, N.; White, C. Time profile of putrescine; cadaverine; indole and skatole in human saliva. Arch. Oral Biol. 2003, 48, 323–327. [Google Scholar] [CrossRef]
- Van Wuyckhuyse, B.C.; Perinpanayagam, H.E.; Bevacqua, D.; Raubertas, R.F.; Billings, R.J.; Bowen, W.H.; Tabak, L.A. Association of free arginine and lysine concentrations in human parotid saliva with caries experience. J. Dent. Res. 1995, 74, 686–690. [Google Scholar] [CrossRef]
- Reyes, E.; Martin, J.; Moncada, G.; Neira, M.; Palma, P.; Gordan, V.; Oyarzo, J.F.; Yevenes, I. Caries-free subjects have high levels of urease and arginine deiminase activity. J. Appl. Oral Sci. 2014, 22, 235–240. [Google Scholar] [CrossRef]
- Revenga-Parra, M.; Martínez-Periñán, E.; Moreno, B.; Pariente, F.; Lorenzo, E. Rapid taurine and lactate biomarkers determination with disposable electrochemical detectors. Electrochim. Acta 2017, 240, 506–513. [Google Scholar] [CrossRef]
- Mozaffari, M.S.; Borke, J.L. Taurine in submandibular gland of the rat: Effect of muscarinic drugs. J. Histochem. Cytochem. 2002, 50, 527–532. [Google Scholar] [CrossRef] [PubMed]
- Gupta, S.; Nayak, M.T.; Sunitha, J.D.; Dawar, G.; Sinha, N.; Rallan, N.S. Correlation of salivary glucose level with blood glucose level in diabetes mellitus. J. Oral Maxillofac. Pathol. 2017, 21, 334–339. [Google Scholar] [PubMed]
- Wang, B.; Du, J.; Zhu, Z.; Ma, Z.; Wang, S.; Shan, Z. Evaluation of parotid salivary glucose level for clinical diagnosis and monitoring type 2 diabetes mellitus patients. Biomed. Res. Int. 2017, 2569707. [Google Scholar] [CrossRef] [PubMed]
- Kejriwal, S.; Bhandary, R.; Thomas, B.; Kumari, S. Estimation of levels of salivary mucin, amylase and total protein in gingivitis and chronic periodontitis patients. J. Clin. Diagn. Res. 2014, 8, ZC56–ZC60. [Google Scholar] [CrossRef] [PubMed]
- Nikitkova, A.E.; Haase, E.M.; Scannapieco, F.A. Taking the starch out of oral biofilm formation: Molecular basis and functional significance of salivary α-amylase binding to oral streptococci. Appl. Environ. Microbiol. 2013, 79, 416–423. [Google Scholar] [CrossRef] [PubMed]
- Takahashi, N. Microbial ecosystem in the oral cavity: Metabolic diversity in an ecological niche and its relationship with oral diseases. Int. Congr. Ser. 2005, 1284, 103–112. [Google Scholar] [CrossRef]
- Nagler, R.M.; Lischinsky, S.; Diamond, E.; Klein, I.; Reznick, A.Z. New insights into salivary lactate dehydrogenase of human subjects. J. Lab. Clin. Med. 2001, 137, 363–369. [Google Scholar] [CrossRef]
- Albandar, J.M.; Kingman, A. Gingival recession, gingival bleeding, and dental calculus in adults 30 years of age and older in the United States, 1988-1994. J. Periodontol. 1999, 70, 30–43. [Google Scholar] [CrossRef]
- Gomes, P.D.; Juodzbalys, G.; Fernandes, M.H.; Guobis, Z. Diagnostic approaches to sjögren’s syndrome: A literature review and own clinical experience. J. Oral Maxillofac. Res. 2012, 3, e3. [Google Scholar] [CrossRef]
- Gardner, A.; Parkes, H.G.; Carpenter, G.H.; So, P.W. Developing and standardizing a protocol for quantitative proton nuclear magnetic resonance (1H NMR) spectroscopy of saliva. J. Proteom. Res. 2018, 17, 1521–1531. [Google Scholar] [CrossRef]
- Pertinhez, T.A.; Casali, E.; Lindner, L.; Spisni, A.; Baricchi, R.; Berni, P. Biochemical assessment of red blood cells during storage by 1H nuclear magnetic resonance spectroscopy. Identification of a biomarker of their level of protection against oxidative stress. Blood Transfus. 2014, 12, 548–556. [Google Scholar] [PubMed]
- Chong, J.; Wishart, D.S.; Xia, J. Using MetaboAnalyst 4.0 for comprehensive and integrative metabolomics data analysis. Curr. Protoc. Bioinform. 2019, 68, e86. [Google Scholar] [CrossRef] [PubMed]


| METABOLITE a | WS (μM) | PS (μM) | SM/SL (μM) |
|---|---|---|---|
| SECTION A: STANDARD AND NON–PROTEINOGENIC AMINO ACIDS | |||
| Alanine | 27.4 (9.4–212.6) | 69.1 (41.5–219.1) ° § | 20.7 (8.1–74.9) |
| Arginine | ND | 24.2 (5.9–56.3) | ND |
| Aspartate | 19.4 (9.8–76.7) | 25.7 (7.9–64.0) § | 7.3 (1.8–18.7) |
| Cadaverine b | ND | 3.2 (0.7–17.6) | 2.5 (0–16.6) |
| Creatine | 10.8 (6.7–49.4) | 48.9 (23.7–116.7) ° § | 16.6 (6.4–48.1) |
| Glutamate | 108.1 (30.6–250.1) § | 57.5 (27.7–224.0) | 19.4 (8.6– 71.2) |
| Glutamine | 28.4 (6.6–134.6) | 63.3 (9.1–151.4) ° § | 21.6 (2.3–70.6) |
| Glycine | 82.5 (12.1–306.6) § | 66.6 (3.6–192.3) | 14.4 (4.5–76.5) |
| Histidine | 20.1 (4.1–49.9) § | 17.6 (7.8–70.7) | 5.2 (2.9–21.1) |
| Homoserine b | ND | 36.4 (0–158.4) | 32.4 (3.2–57.9) |
| Isoleucine | 5.0 (0.9–44.3) § | 3.8 (2.0–13.4) | 1.2 (0.7–4.1) |
| Leucine | 13.2 (3.5–56.9) § | 12.0 (6.3–30.7) | 4.8 (2.1–9.5) |
| Lysine | 66.7 (17.6–164.8) * § | 19.4 (10.1–97.5) | 6.2 (2.2–37.9) |
| Phenylalanine | 16.8 (6.4–48.6) § * | 10.9 (5.0–41.1) | 4.6 (2.0–12.7) |
| Proline | 64.1 (24.8–446.8) * § | 41.1 (10.8–156.0) | 7.2 (2.8–74.4) |
| Putrescineb | 38.6 (8.5–96.4) * § | 5.1 (0.6–27.3) | 0.9 (0.5–17.7) |
| Pyroglutamate | 12.9 (2.9–70.5) § | 9.4 (0–32.3) | 7.6 (3.3–14.7) |
| Taurine | 46.2 (2.8–132.0) | 121.4 (0–342.2) ° § | 60.2 (3.3–146.9) |
| Threonine | 4.6 (2.4–31.4) | ND | 7.3 (2.9–22.3) |
| Tyrosine | 34.9 (10.5–93.5) § | 28.2 (14.38–90.9) | 10.1 (3.0–30.8) |
| Valine | 9.3 (2.9–59.2) | 12.4 (3.0–38.0) § | 4.7 (1.1–13.1) |
| SECTION B: SIMPLE CARBOHYDRATES | |||
| Fucose | 34.8 (11.5–275.8) * § | 5.6 (0.9–57.9) | 4.8 (2.4–16.3) |
| Galactose | 18.9 (6.3–173.9) | ND | ND |
| Glucose | 11.8 (6.8–137.8) | 204.6 (81.8–697.8) ° § | 46.8 (7.6–211.8) |
| Maltose | 1.3 (0.2–52.8) | 296.9 (103.5–1587.9) ° § | 76.5 (16.4–420.4) |
| N-acetylglucosamine | 26.3 (2.2–141.5) § | ND | 10.5 (1.4–40.8) |
| SECTION C: ORGANIC ACIDS | |||
| 2-Aminoadipate | 186.0 (77.2–530.3) * § | 25.0 (2.4–117.3) | 11.6 (2.0–92.8) |
| 2-Hydroxybutyrate | 13.6 (1.4–53.1) * § | 7.6 (4.3–12.8) | 2.5 (0.9–6.5) |
| 3-Phenylpropionate b | 10.0 (2.0–38.1) | ND | ND |
| 4-hydroxyphenylacetate b | 8.6 (1.9–19.0) | ND | ND |
| 4-hydroxyphenyllactate b | 4.4 (0.7–23.9) | ND | ND |
| 5-Aminopentanoate b | 100.5 (0–386.3) * | 12.1 (0–82.2) | ND |
| Acetate b | 2277.9 (734.1–4322.8) * § | 470.7 (81.8–3145.0) | 237.4 (54.0–1370.4) |
| Butyrate b | 20.9 (3.2–77.3) * § | 5.1 (0.8–14.8) | 4.0 (1.1–18.6) |
| Citrate | 12.7 (0.7–33.0) | 35.3 (16.0–125.8) ° § | 20.4 (5.9–146.9) |
| Formate b | 37.7 (8.7–234.0) * § | 15.1 (6.8–106.7) | 17.2 (6.5–97.9) |
| Glycolate b | ND | ND | 7.8 (1.8–55.4) |
| Isobutyrate b | 18.6 (3.76–47.6) * § | 1.3 (0.2–9.9) | 1.7 (0.3–5.2) |
| Lactate | 123.1 (23.7–517.5) | 714.8 (408.8–1683.9) ° § | 162.7 (84.0–444.5) |
| Phenylacetate b | 15.9 (4.2–46.2) * § | 1.3 (0–25.7) | 1.6 (0.3–3.3) |
| Propionate b | 261.8 (64.7–627.9) * § | 31.2 (4.4–200.8) | 17.5 (4.3–151.7) |
| Pyruvate | 18.8 (4.0–52.8) § | 12.1 (1.4–232.0) | 5.1 (2.1–14.2) |
| Succinate b | 16.1 (9.9–39.2) * § | 12.1 (3.8–23.3) | 5.1 (2.2–11.8) |
© 2020 by the authors. Licensee MDPI, Basel, Switzerland. This article is an open access article distributed under the terms and conditions of the Creative Commons Attribution (CC BY) license (http://creativecommons.org/licenses/by/4.0/).
Share and Cite
Meleti, M.; Quartieri, E.; Antonelli, R.; Pezzi, M.E.; Ghezzi, B.; Viani, M.V.; Setti, G.; Casali, E.; Ferrari, E.; Ciociola, T.; et al. Metabolic Profiles of Whole, Parotid and Submandibular/Sublingual Saliva. Metabolites 2020, 10, 318. https://doi.org/10.3390/metabo10080318
Meleti M, Quartieri E, Antonelli R, Pezzi ME, Ghezzi B, Viani MV, Setti G, Casali E, Ferrari E, Ciociola T, et al. Metabolic Profiles of Whole, Parotid and Submandibular/Sublingual Saliva. Metabolites. 2020; 10(8):318. https://doi.org/10.3390/metabo10080318
Chicago/Turabian StyleMeleti, Marco, Eleonora Quartieri, Rita Antonelli, Margherita E. Pezzi, Benedetta Ghezzi, Maria Vittoria Viani, Giacomo Setti, Emanuela Casali, Elena Ferrari, Tecla Ciociola, and et al. 2020. "Metabolic Profiles of Whole, Parotid and Submandibular/Sublingual Saliva" Metabolites 10, no. 8: 318. https://doi.org/10.3390/metabo10080318
APA StyleMeleti, M., Quartieri, E., Antonelli, R., Pezzi, M. E., Ghezzi, B., Viani, M. V., Setti, G., Casali, E., Ferrari, E., Ciociola, T., Spisni, A., & Pertinhez, T. A. (2020). Metabolic Profiles of Whole, Parotid and Submandibular/Sublingual Saliva. Metabolites, 10(8), 318. https://doi.org/10.3390/metabo10080318