1. Introduction
High-frequency (HF)
1H NMR analysis has been successfully developed to be applied in untargeted metabolomics investigations, through decades of successive optimisations with a wide range of biological media [
1]. Metabolomics comprises both quantitative and qualitative analyses of whole metabolomes, which arise from a complex series of metabolic interactions and processes occurring within cells, tissues or organs. The overall purpose of metabolomics investigations is to detect, quantify and interpret variations in the concentrations of metabolites responsible for biological behaviour; the detection of perturbations or imbalances in metabolic pathways can reveal defects in the function or activities of selected enzymes therein, which may be characteristic of particular disease processes [
2]. The detection of such defects may therefore lead to the identification of potential biomarkers, or the development of targeted diagnostic test systems for the diagnosis and prognosis of diseases, processes which also give rise to improved understandings of their pathologies. This, in turn, may also lead to the identification of suitable drug targets [
3].
Moreover, in addition to pathologies, such approaches may also provide a complete and systematic profiling of metabolites and their temporal changes caused by factors such as diet, lifestyle, environment and administered drugs. This is possible through the multicomponent analysis of body fluids and/or extracts of tissue biopsy samples, coupled with a statistical interpretational strategy known as multivariate analysis [
4]. In view of its multicomponent analytical advantages, HF NMR analysis serves as a powerful tool for the simultaneous and rapid identification and quantification of large numbers of biomolecules present in biofluids or tissue sample extracts. Hence, it is ideal for probing the metabolic profiles of complex samples collected from living systems, for diagnostic or prognostic purposes [
5,
6].
HF NMR spectroscopy has long been employed to conduct metabolomics studies, and offers many further significant bioanalytical advantages for such applications. Indeed, the technique is virtually non-destructive, and requires a short analysis time, and for biofluids, usually requires very little sample preparation [
7]. However, HF NMR analysis also presents a number of disadvantages, such as cost, size, and transportation limitations, and often the requirement for specialist technical staff for instrumental operation. Moreover, the size of such high-resolution NMR facilities limits their accessibility to many researchers, and therefore precludes regular use outside of university-based NMR-dedicated laboratories, along with those in large industrial centres.
Low-frequency (LF) applications of NMR have previously been explored in some detail [
8,
9,
10], and the future of NMR-based metabolomics has also been recently discussed, with an emphasis on this approach providing a convincing solution for metabolic fingerprinting at ‘point-of-care’ sites or prospectively, even for personal use [
11,
12,
13]. Moreover, LF
1H NMR applications have recently been shown to distinguish between control and type 2 diabetic (T2D) participants, with potential use for point-of-care applications in a metabolomics study using a near-portable benchtop NMR spectrometer as a novel bioanalytical tool [
11]. The advantages of this technique included fast acquisition time, ease-of-use and low limits of detection [
11]. Moreover, LF benchtop NMR facilities do not require expensive cryogens, nor a Gauss safety line for the magnetic field, and much less power is required for operation, achieving desirable low running costs for potential applications in clinical chemistry. However, although acceptable correlations between urinary metabolite calibration standard concentrations, and selected prominent metabolites detectable in urine itself, particularly those of glucose, were found between the LF and HF analyses conducted, the overall metabolomics results obtained in this study at an operating frequency of 60 MHz were not directly validated by comparisons with those arising from the application of a corresponding HF NMR facility. f especial interest is an evaluation of whether the nature of detectable metabolites, and the number of these found as discriminant markers in the 60 MHz study, were comparable to those found using HF NMR analysis. Furthermore, disadvantages of the one-dimensional (1D) approach included a lack of resolution, or more specifically a range of resonance overlap and crowding problems encountered in LF analysis. Indeed, it was not possible to resolve the β-glucose anomeric proton signal from the residual water resonance. However, the use of such 1D LF techniques for many qualitative analyses, as well as the development of appropriate and robust automated computational tools for real-time analysis, have the potential to impact on a myriad of additional applications.
In this pilot study, we first investigate LF and HF datasets robustly, in order to compare the accuracies and precision of statistical tools via the acquisition of urinary spectra at both operating frequencies. We also present results regarding improvements in spectral resolution, which are achievable via the acquisition of 2D NMR urinary profiles through LF
1H-
1H correlation (COSY) spectra. This paper complements the preliminary metabolomics results reported by Percival et al. [
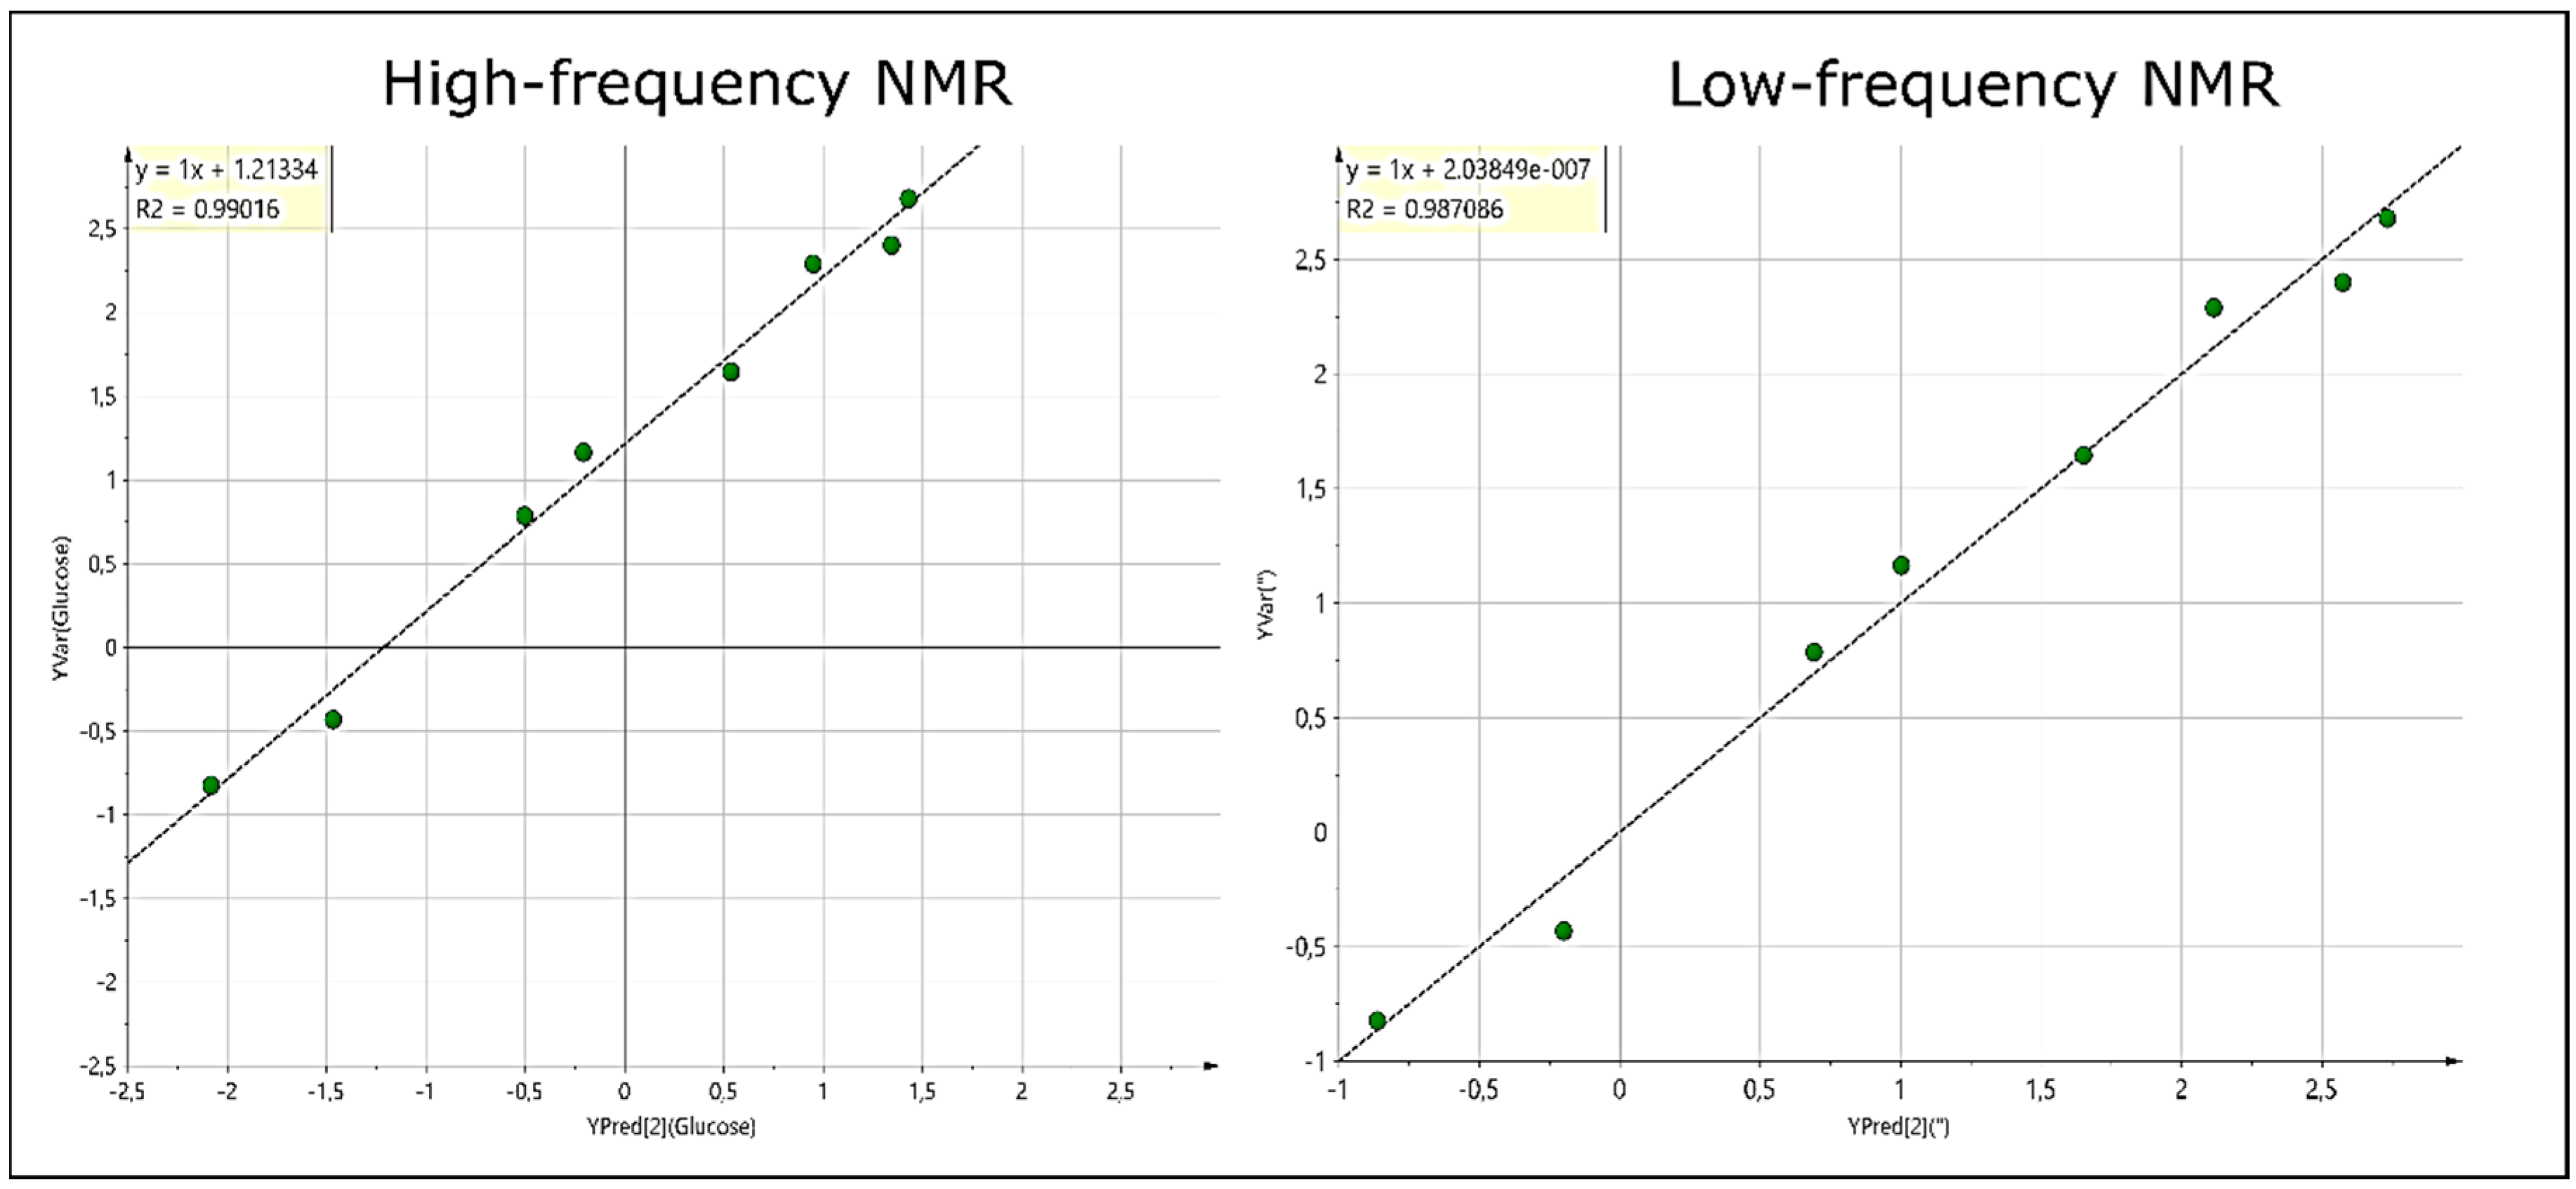
11], and describes for the first time the fully assigned 2D spectra acquired at LF, in addition to a robust comparison between metabolomics studies performed at both operating frequencies. Results presented in this manuscript are therefore sub-divided into three sections. The first phase of the study investigates the capabilities and analytical advantages of 2D NMR spectra acquired at low-field, whilst the second phase compares the results of metabolomics analyses performed at both LF and HF NMR operating frequencies. The final phase is based on the results obtained from Phase 2, and, partial least square (PLS)-regression analysis, is conducted in order to determine the relationship between glucose concentrations detectable in the urinary
1H NMR profiles of T2D patients, and also modifications in the urinary excretion of other metabolites.
3. Discussion
Metabolomics is a powerful approach which, in the space of a few decades, has developed considerably, and HF NMR analysis is one of the most commonly applied techniques to perform metabolomics studies. However, despite adoption in several domains, the application of LF spectrometers for this purpose remains limited [
8,
11,
13]. Here, we have reported metabolomics analysis comparisons between the
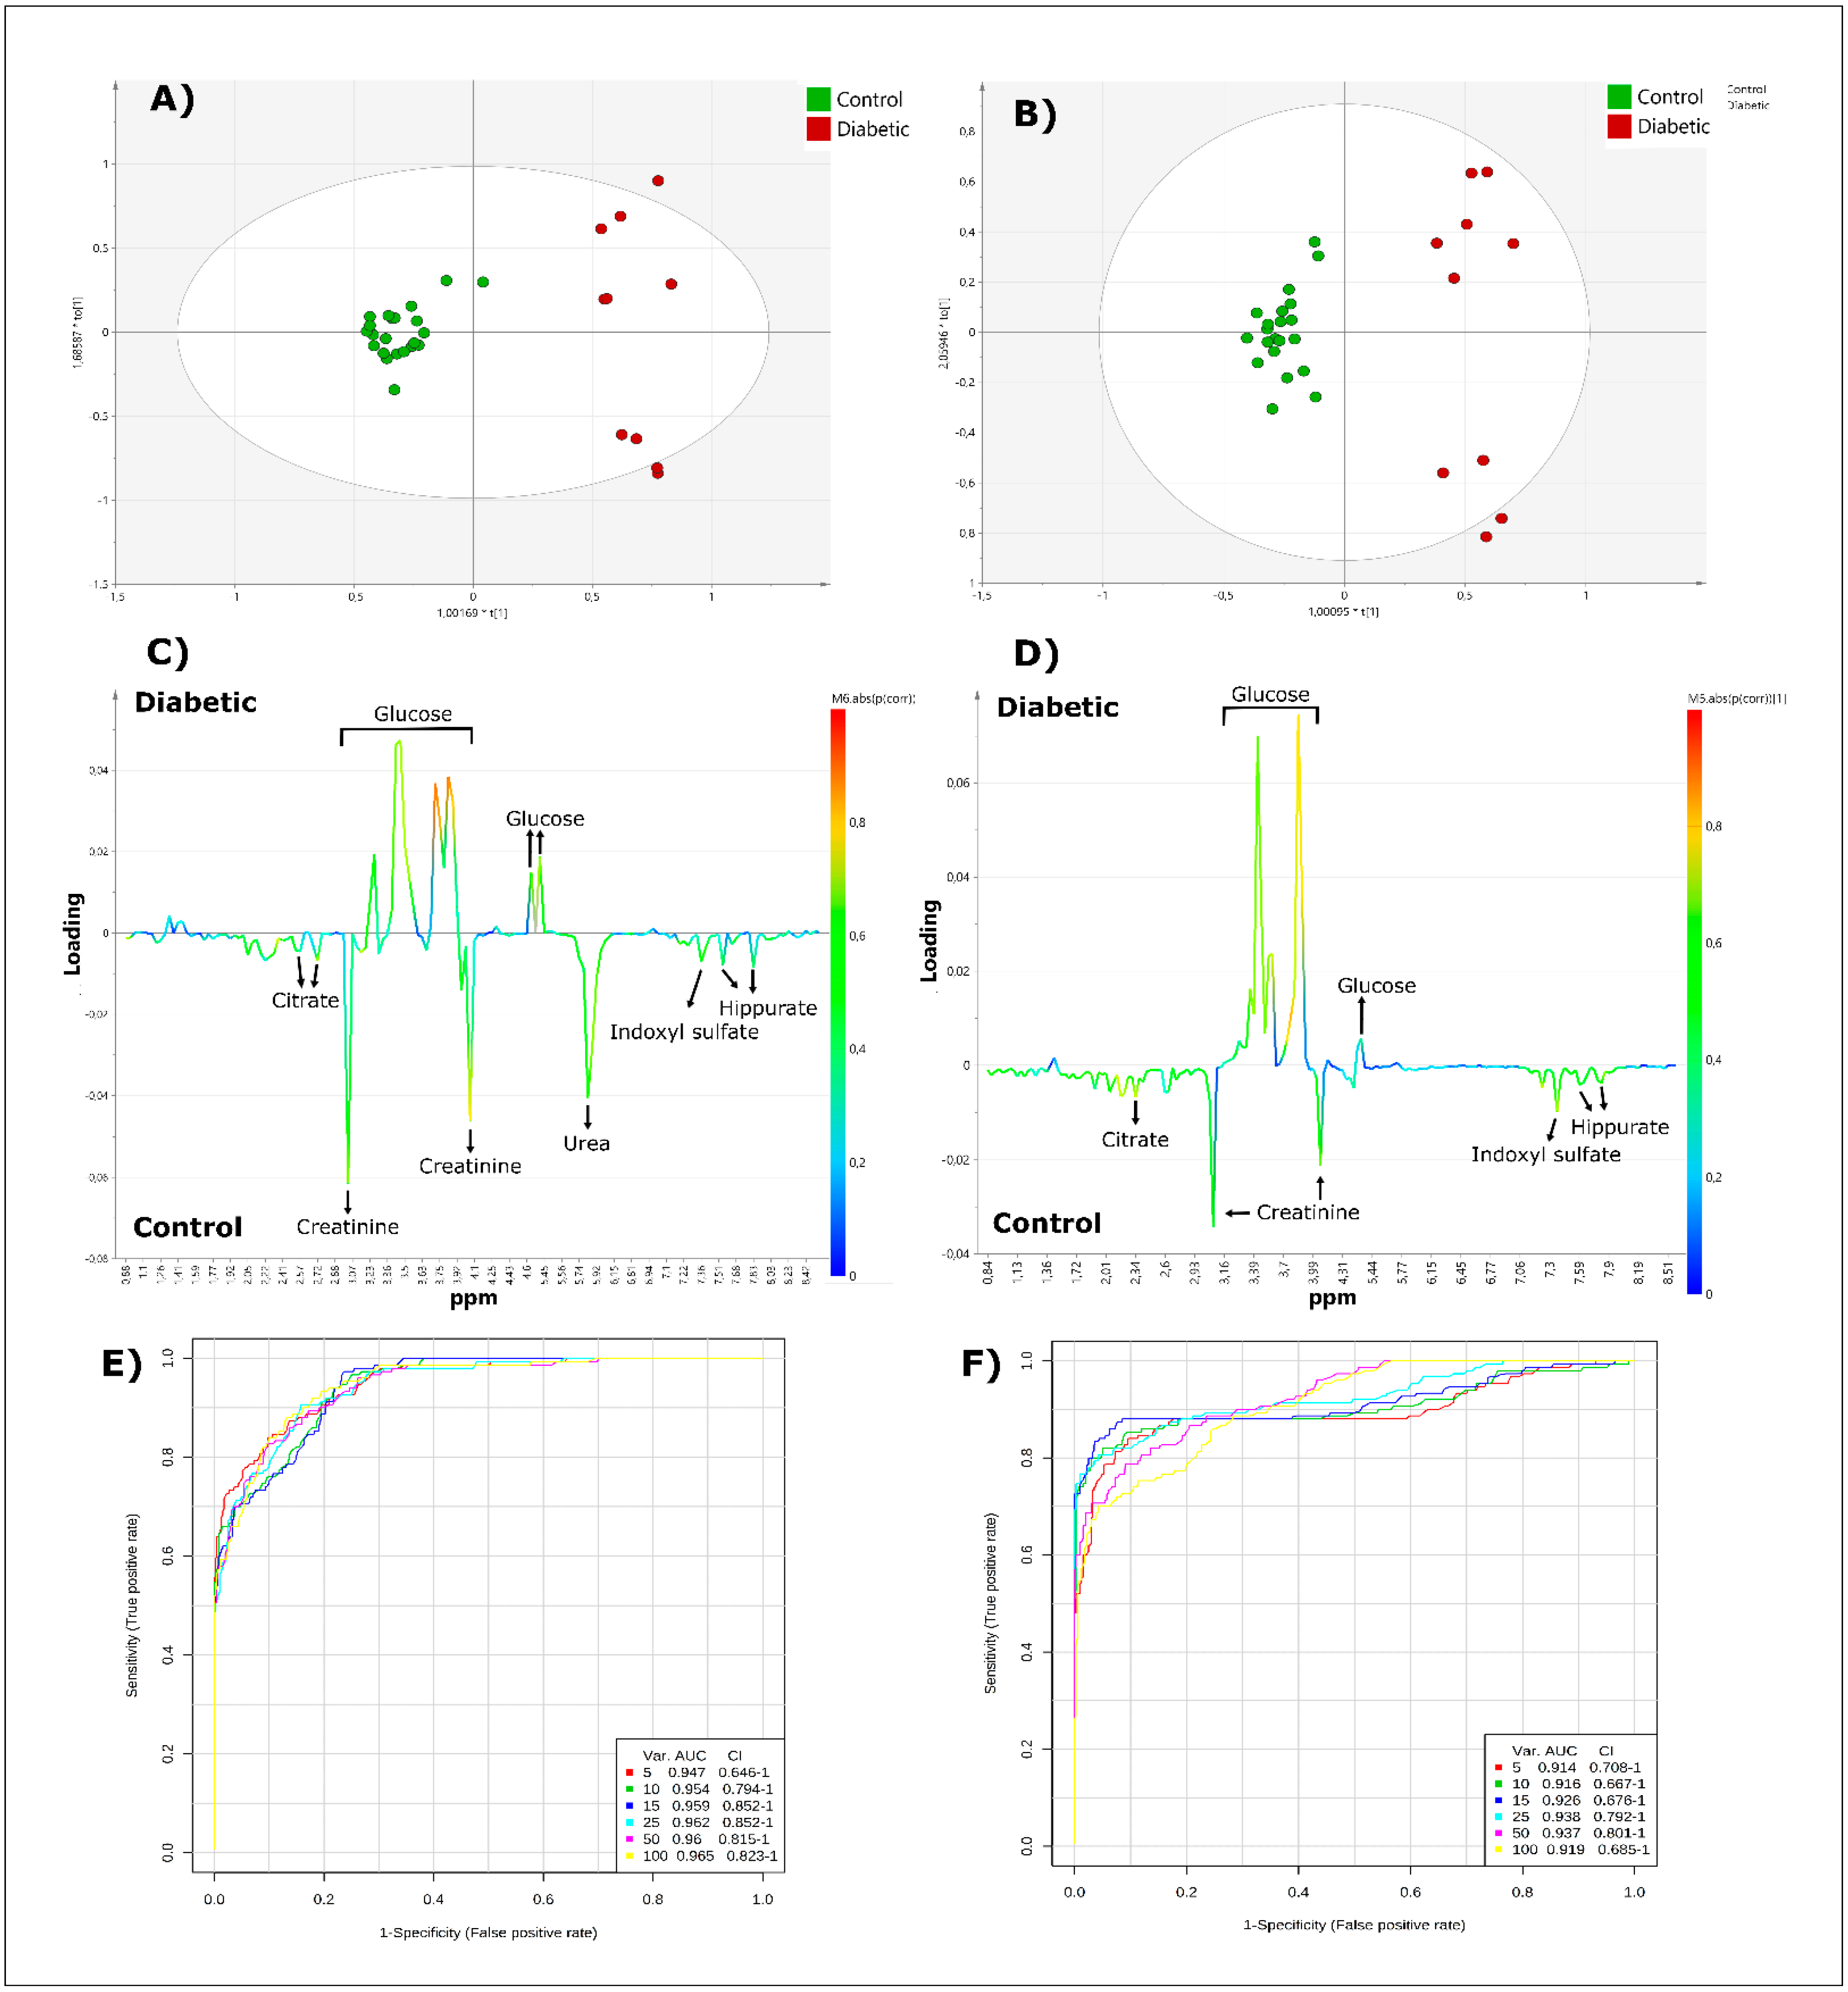
1H NMR profiles of T2D and control participant urine samples acquired by both high- and low-frequency NMR techniques. In our chemometrics analysis, T2D urine samples are readily distinguishable from those of healthy controls, and several metabolites are linked to this separation. Indeed, while glucose levels are higher in T2D patients, those of hippurate and indoxyl sulfate are lower in these participants. These results are observable in both HF and LF spectra, with OPLS-DA scores plots presenting highly similar spatial localizations of each sample at both operating frequencies, as well as corresponding discriminatory metabolites, with the exception of urea. Hence, under the same bucketing and normalisation conditions, it is possible to attain comparable results at both high and low operating frequencies. However, several limitations of this study should be considered, primarily, a probable insufficient sample size was involved, and the high levels of glucose present in some of the T2D urine specimens renders a facile multivariate metabolomics separation between the two conditions. The robustness of this approach still requires further testing on a large number of samples, and in a study investigating more non-glucose-based metabolic changes. Nevertheless, this challenges the paradigm of HF NMR applied in metabolomics, and also provides potential scope and insight for the development of new metabolomics strategies employing faster, cheaper and easier to use NMR techniques.
Poorly controlled diabetic patients regularly suffer from nocturia and polyuria, the former a condition in which patients awaken at least once during the night to void urine [
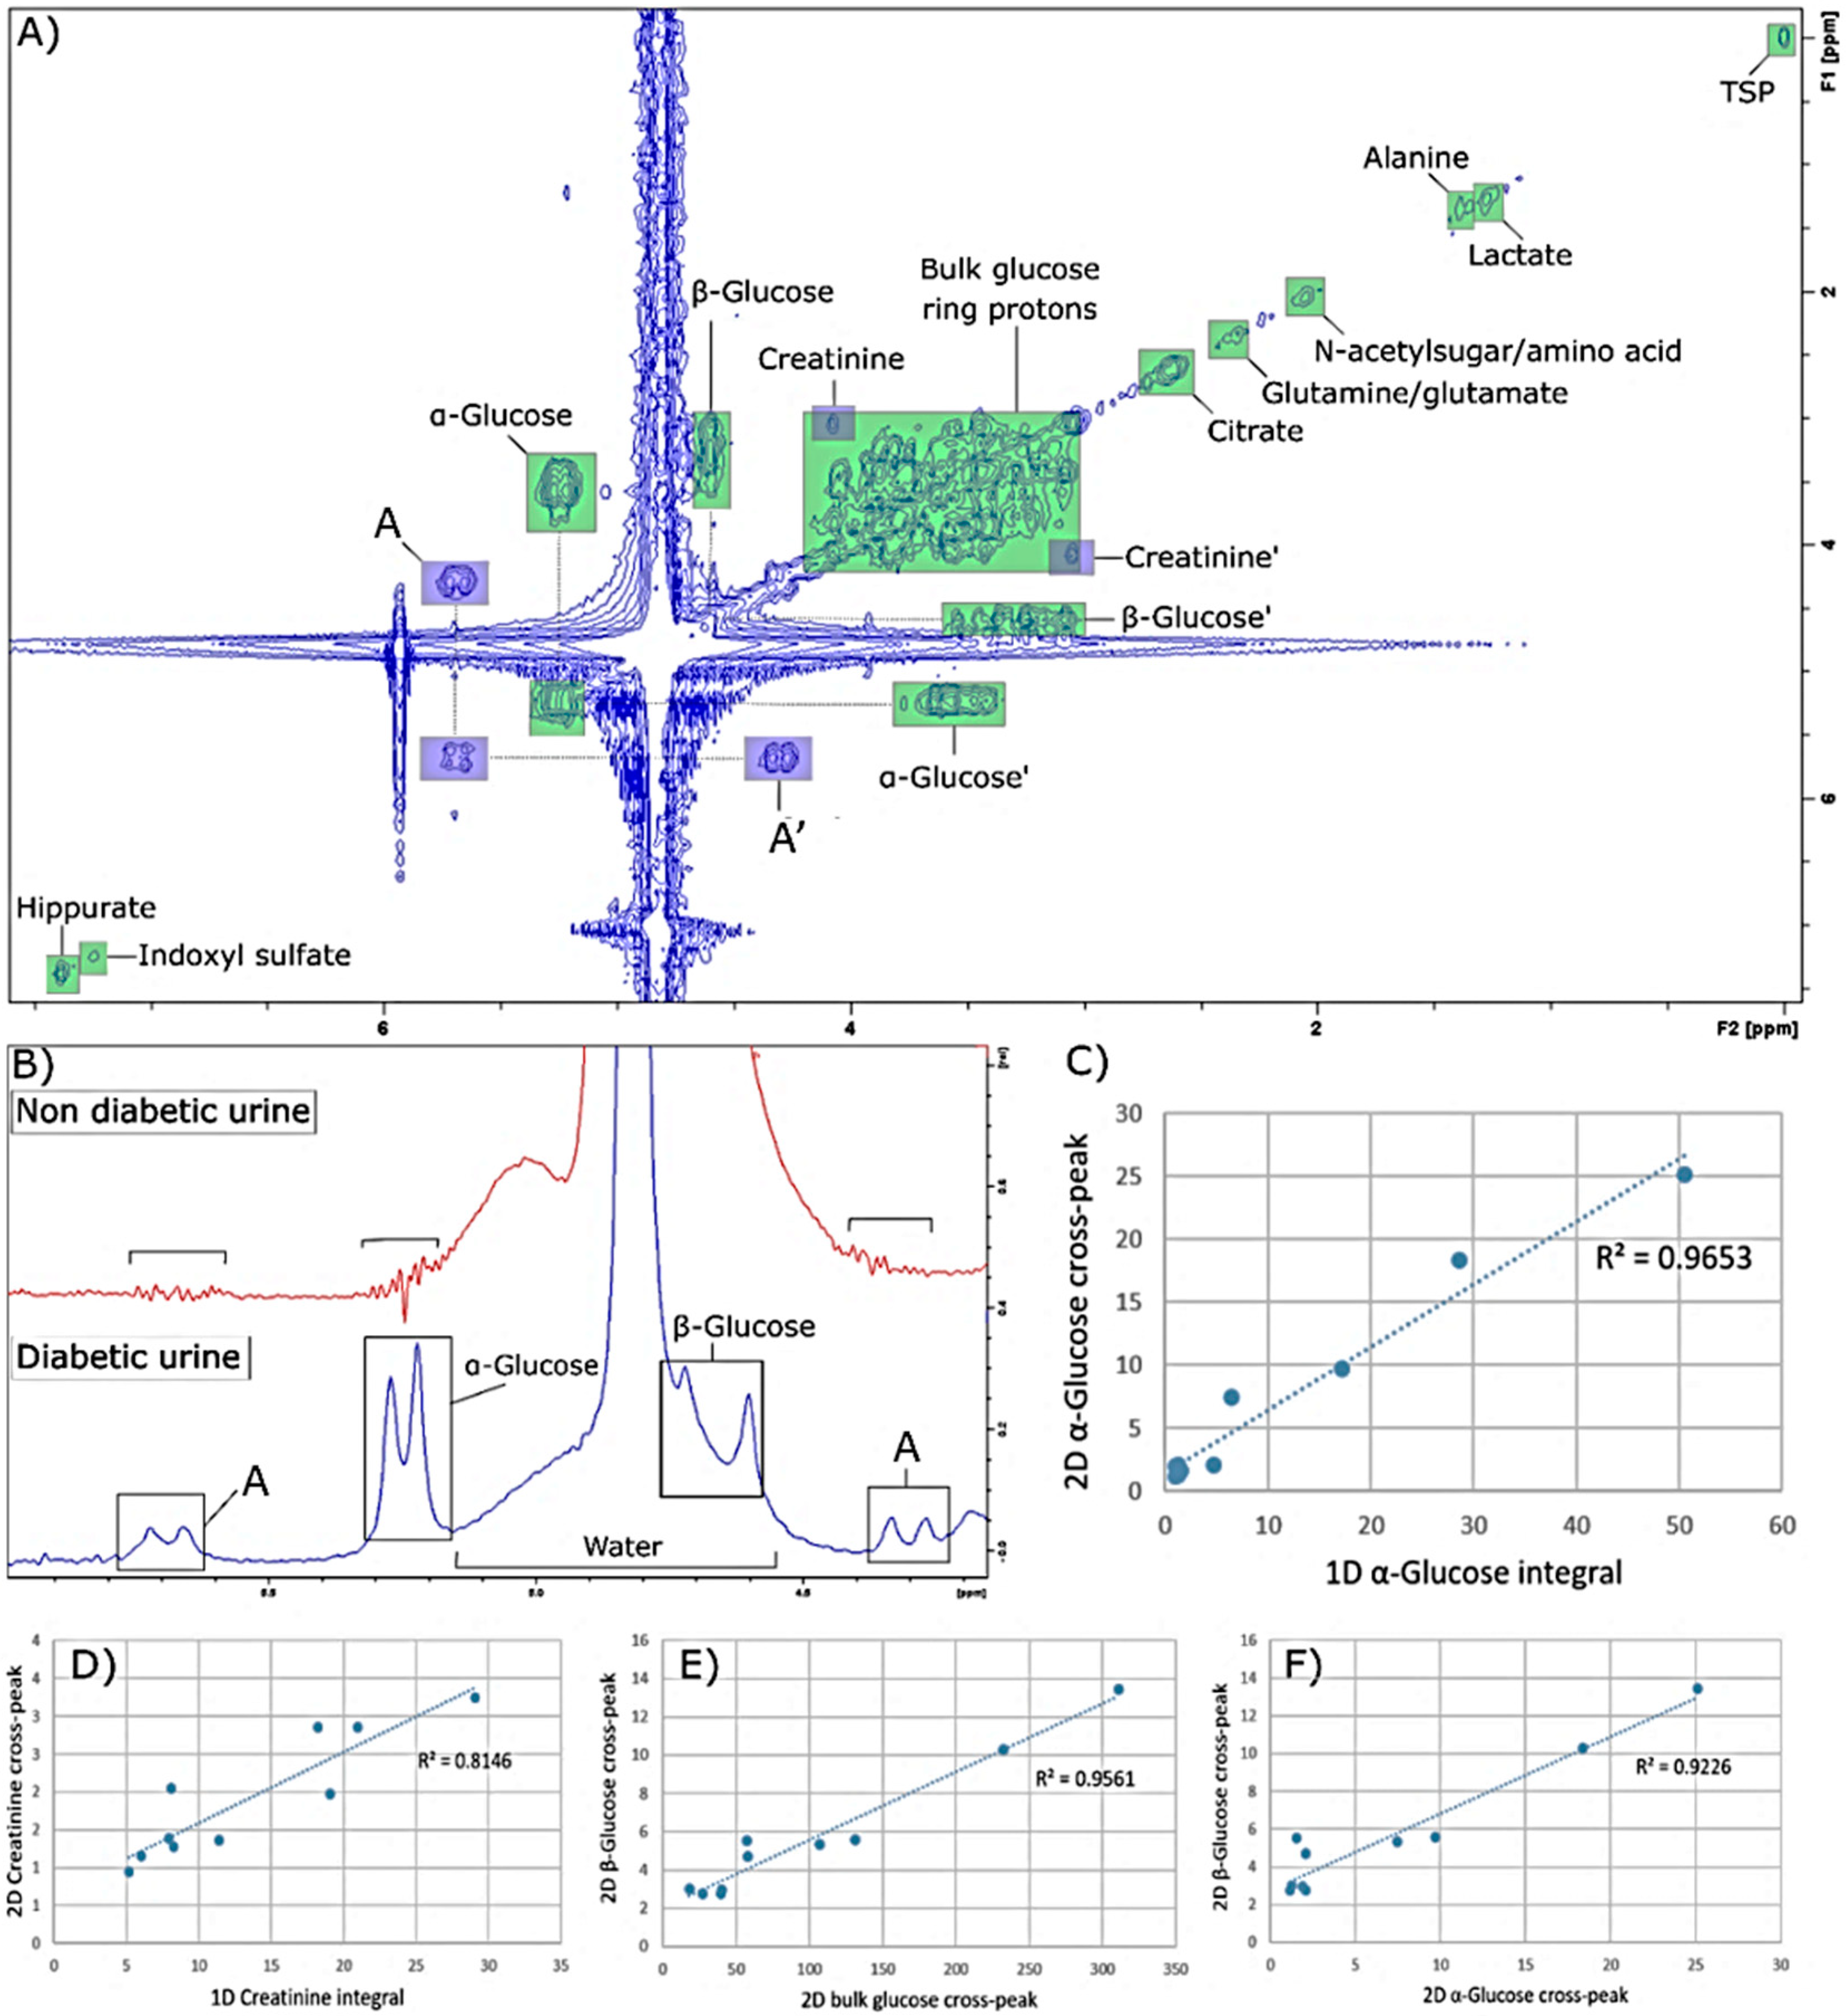
14]. These lead to decreases in the concentrations of many urinary metabolites, together with wide ’between-participant’ variations in urinary excretion volumes. This may explain why T2D group downregulations in hippurate and indoxyl sulfate are also responsible for the ‘between-disease class’ distinction observed here, with significantly higher concentrations observed in the healthy control group. One approach to adjust for this would be to normalize the dataset using creatinine levels, which are usually excreted steadily in the urine. However, this was not possible in our study for the spectra acquired by LF NMR analysis, since the two buckets corresponding to this biomolecule’s resonances at δ = 3.06 and 4.06 ppm were subject to several overlap instances with other metabolites, i.e., those with resonance frequencies close to those of these signals. This is highlighted by the linear correlation observed between the integrals of the 1D versus 2D cross-peaks for creatinine, since the resulting correlation coefficient value is lower when compared to other corresponding plots obtained. This can be rationalised by considering several closely located metabolites signals, such as creatine and glucose, that are also likely integrated within the creatinine signal chemical shift region in 1D analysis, whilst integration of the 2D cross-peak signal serves to limit the superposition of resonances related to other metabolites. Furthermore, approximately 25% of diabetic patients suffer from kidney dysfunction [
15], which is known to affect creatinine clearance [
16], a phenomenon further hindering any creatinine normalisation strategies in metabolomics studies involving diabetic patients.
In the present study, urinary glucose levels were positively correlated with the non-glucose urinary metabolome of T2D samples. In particular, the abundance of several metabolites was downregulated based on glucose levels excreted in patient urine samples. High levels of glucose in the urine serve as commonly employed markers of poorly-controlled diabetes. These metabolites could correspond to the excretion of biomarkers of cellular or tissular dysfunctions, or defects linked to diabetes management. Further studies with larger sample sizes are therefore required to confirm the significant discriminatory metabolites identified in this case, since they may constitute valuable biomarkers for mechanistic studies, and the clinical monitoring of patients with type 2 diabetes. Furthermore, as noted above, multivariate correlation studies reveal that T2D patients presenting with lower levels of glucose display increased levels of hippurate, indoxyl sulfate, citrate and lactate, when compared to those with high glucose values. In our metabolomics analysis, OPLS loadings revealed that these urinary metabolites are at higher levels in the healthy control group, when compared with T2D participants. Therefore, this observation may suggest that glycaemically-controlled T2D patients with higher levels of these metabolites (and correspondingly lower urinary glucose levels) display a metabolomics profile more closely related to that of healthy control patients, and hence potentially reveals a better managed or controlled disease status.
The linear correlation analysis performed between the 1D and 2D intensities of glucose, bulk ring glucose and creatinine resonances showed strong correlations, except for that observed with creatinine, as noted above, which attests to the validity of 2D spectra acquired with the sequence “POWER COSY”. In addition, the acquisition of 2D
1H-
1H NMR profiles clearly gives rise to an improvement in the resolution of the signals observed, and in particular allowed for the integration of the cross-peak signal of β-glucose, which was not possible in 1D spectra in view of overlap of its δ = 4.63 ppm anomeric proton signal with that of the residual water resonance in this spectral region. It should also be noted that apart from creatinine and glucose, the cross-peaks of other metabolites present at lower concentrations are not observable in the 2D spectra acquired. The sensitivity of the 2D spectra is lower than that of the 1D approach [
17], and this is presumably why only the cross-peaks of the metabolites present in large quantities are observable. However, these spectra were acquired with only eight scans in only 30 min., and therefore increasing the number of scans may permit the observation of cross-peaks of several other metabolites. In addition, a metabolomics analysis of 2D COSY spectra acquired by HF has previously been developed [
18,
19], and these strategies could, in principle, also be applied to LF spectra, which could conceivably assist researchers in the context of overcoming the overlapping resonance issue encountered in 1D LF spectra, and also possibly increase the number of discriminatory metabolites discovered in such LF metabolomics investigations.
Problems encountered with the 1H NMR detection of urea at LF are explicable by the presence of unassigned doublet resonances detectable at this operating frequency. Hence, the removal of this signal may render urea analysis in such T2D urine samples possible. Since these signals are located close to the residual water signal, they may also be related to the solvent suppression sequence employed, and therefore further investigations are required to evaluate these effects. Unfortunately, such errors constitute a bias that must be considered when confirming the identities of 1H NMR signals and/or metabolomics investigations.
Finally, our results suggest that LF spectrometers could provide excellent, easy-to-use, compact and inexpensive tools to perform preliminary diagnostic analyses, either in laboratories or at external locations. Moreover, the quality of 2D spectra obtained within only a few minutes would broaden the horizon of its potential applications, such as drug analysis [
20], or applications in the environmental [
21] or nutrition fields [
13]. As demonstrated here, 2D NMR spectral analysis could also contribute to personalised medicine and translational metabolomics in the areas of healthcare or dentistry. However, there remain a number of major drawbacks that limit their application in routine metabolomics analysis, such as low biomarker sensitivities and
J-couplings which are spread over a much wider range of the total spectral width (for example, as much as 0.20 ppm for a triplet resonance with a
J value of 6 Hz), phenomena which limit the number of detectable metabolites in a single sample. Therefore, these major issues must be addressed in the near future, in order to allow LF NMR diagnostic technologies to gain momentum in clinical applications.


