Food Targeting: Determination of the Cocoa Shell Content (Theobroma cacao L.) in Cocoa Products by LC-QqQ-MS/MS

Abstract
1. Introduction
1.1. Reasons for Cocoa Shell Detection
1.2. Legal Basis for the Cocoa Shell Content
1.3. History of the Cocoa Shell Determination
2. Results and Discussion
2.1. Extraction Solvent Optimization
2.2. Validation
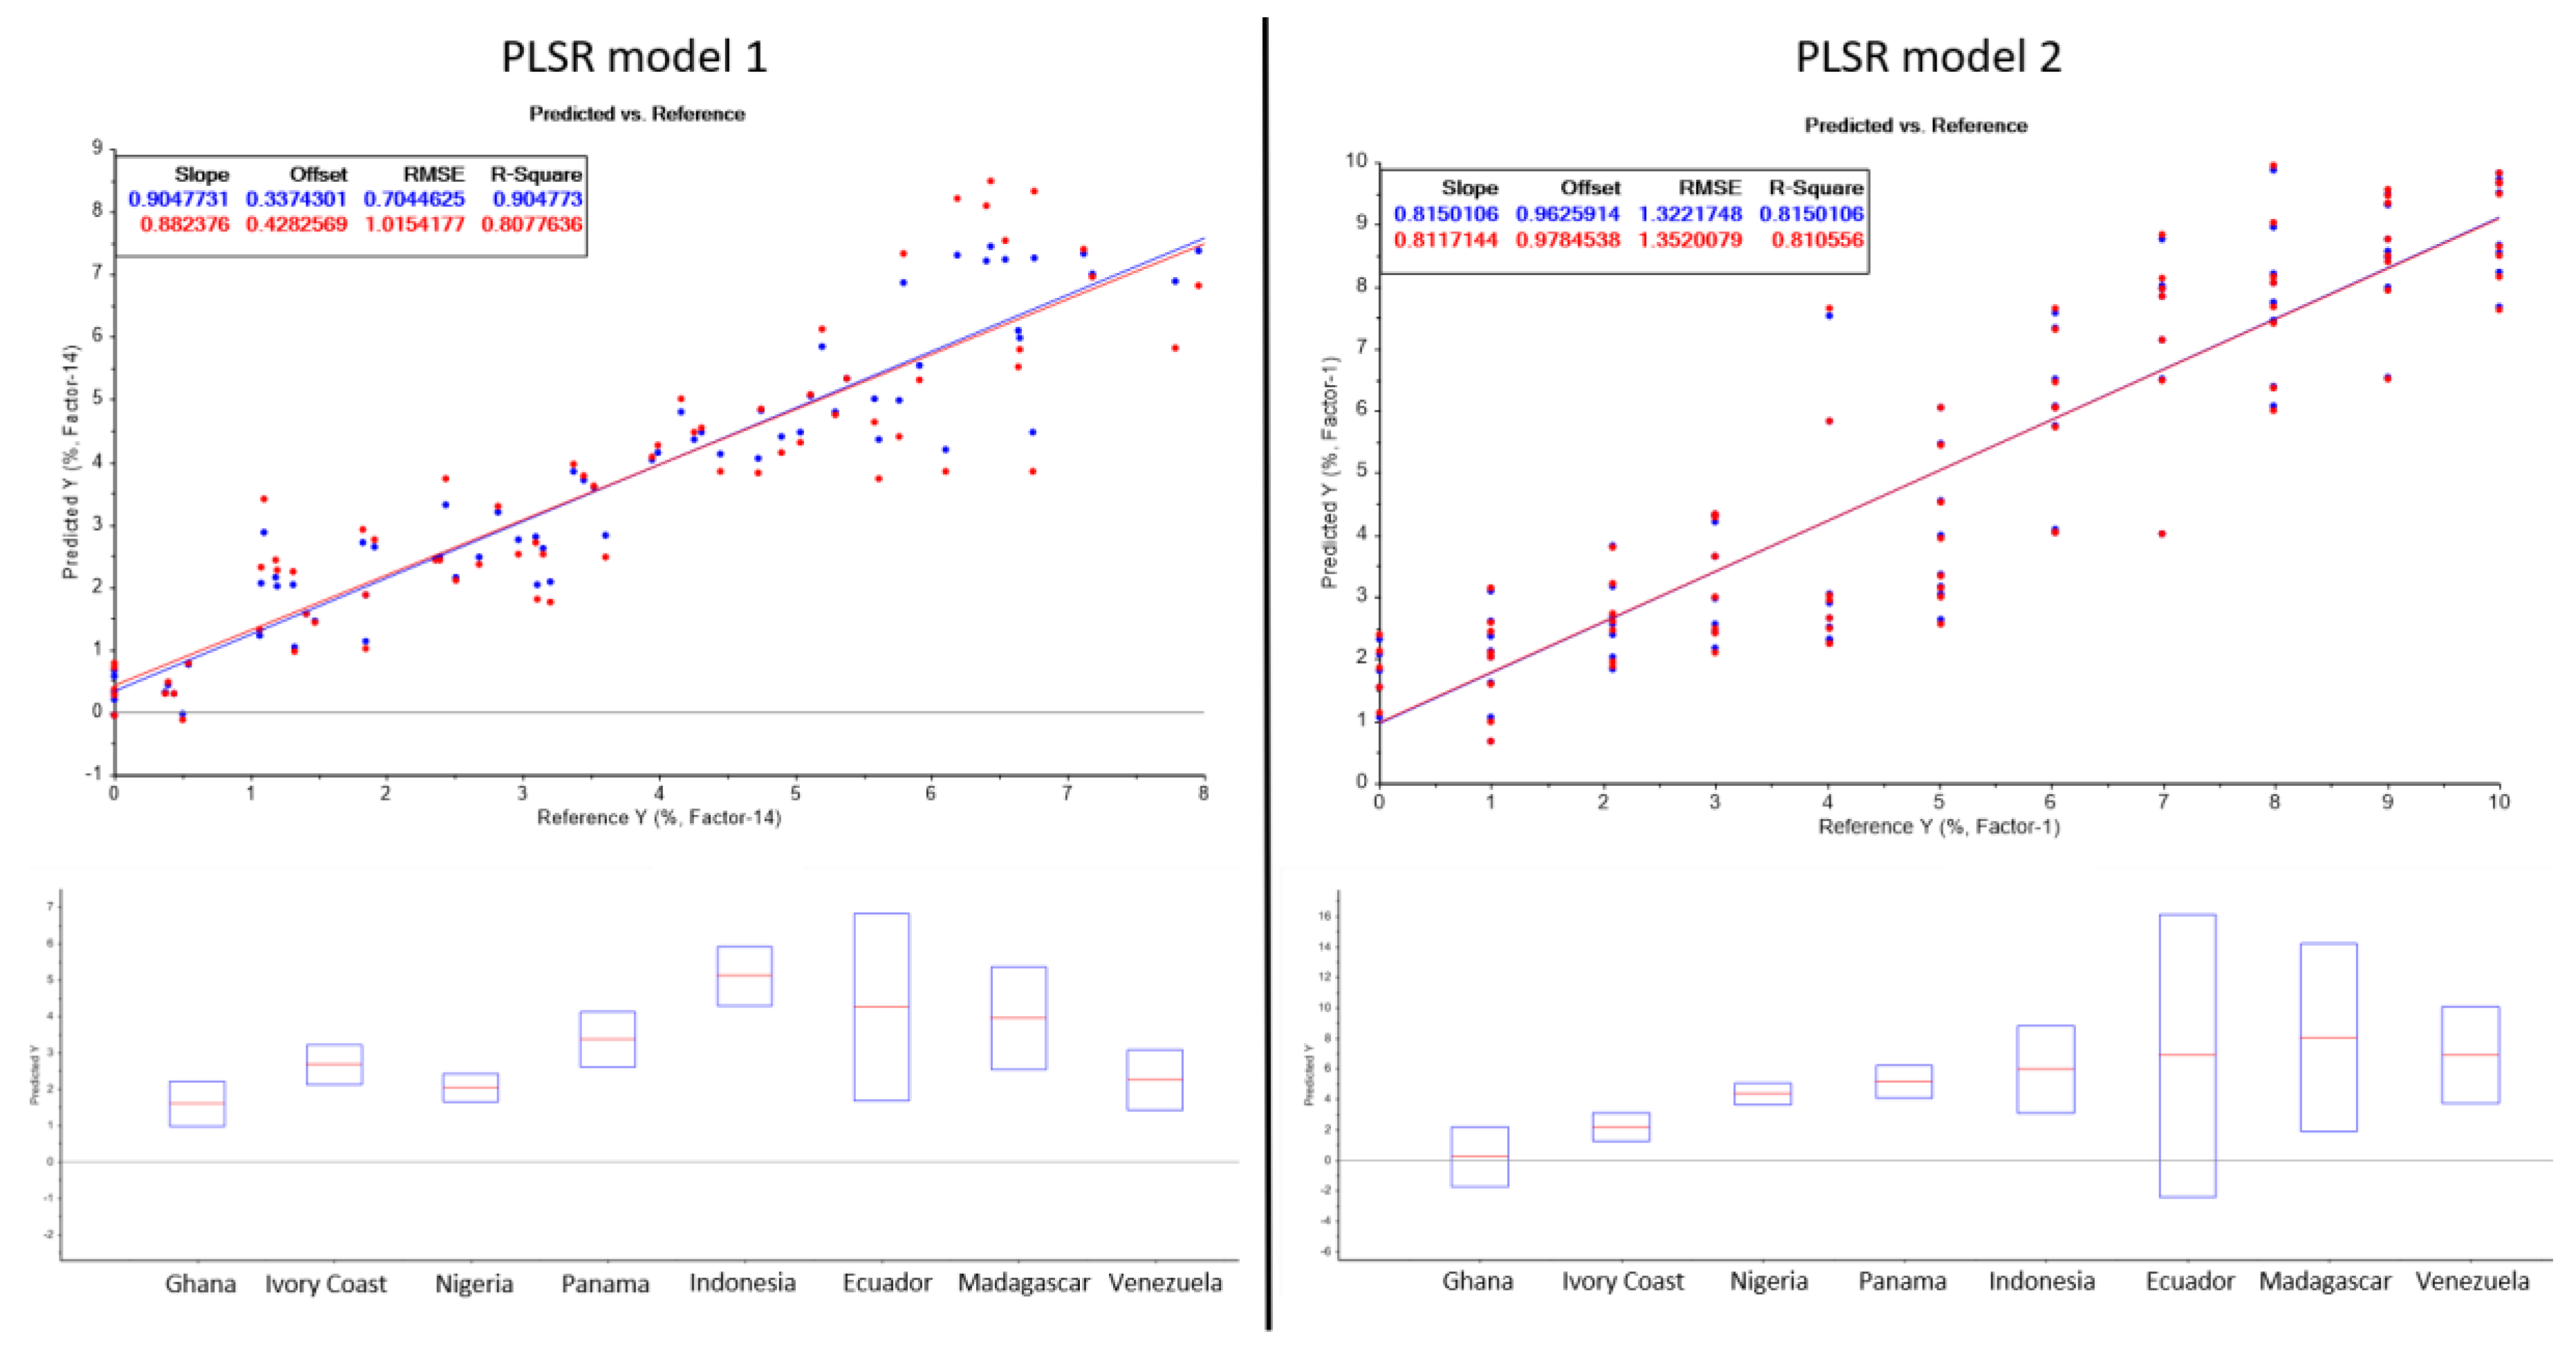
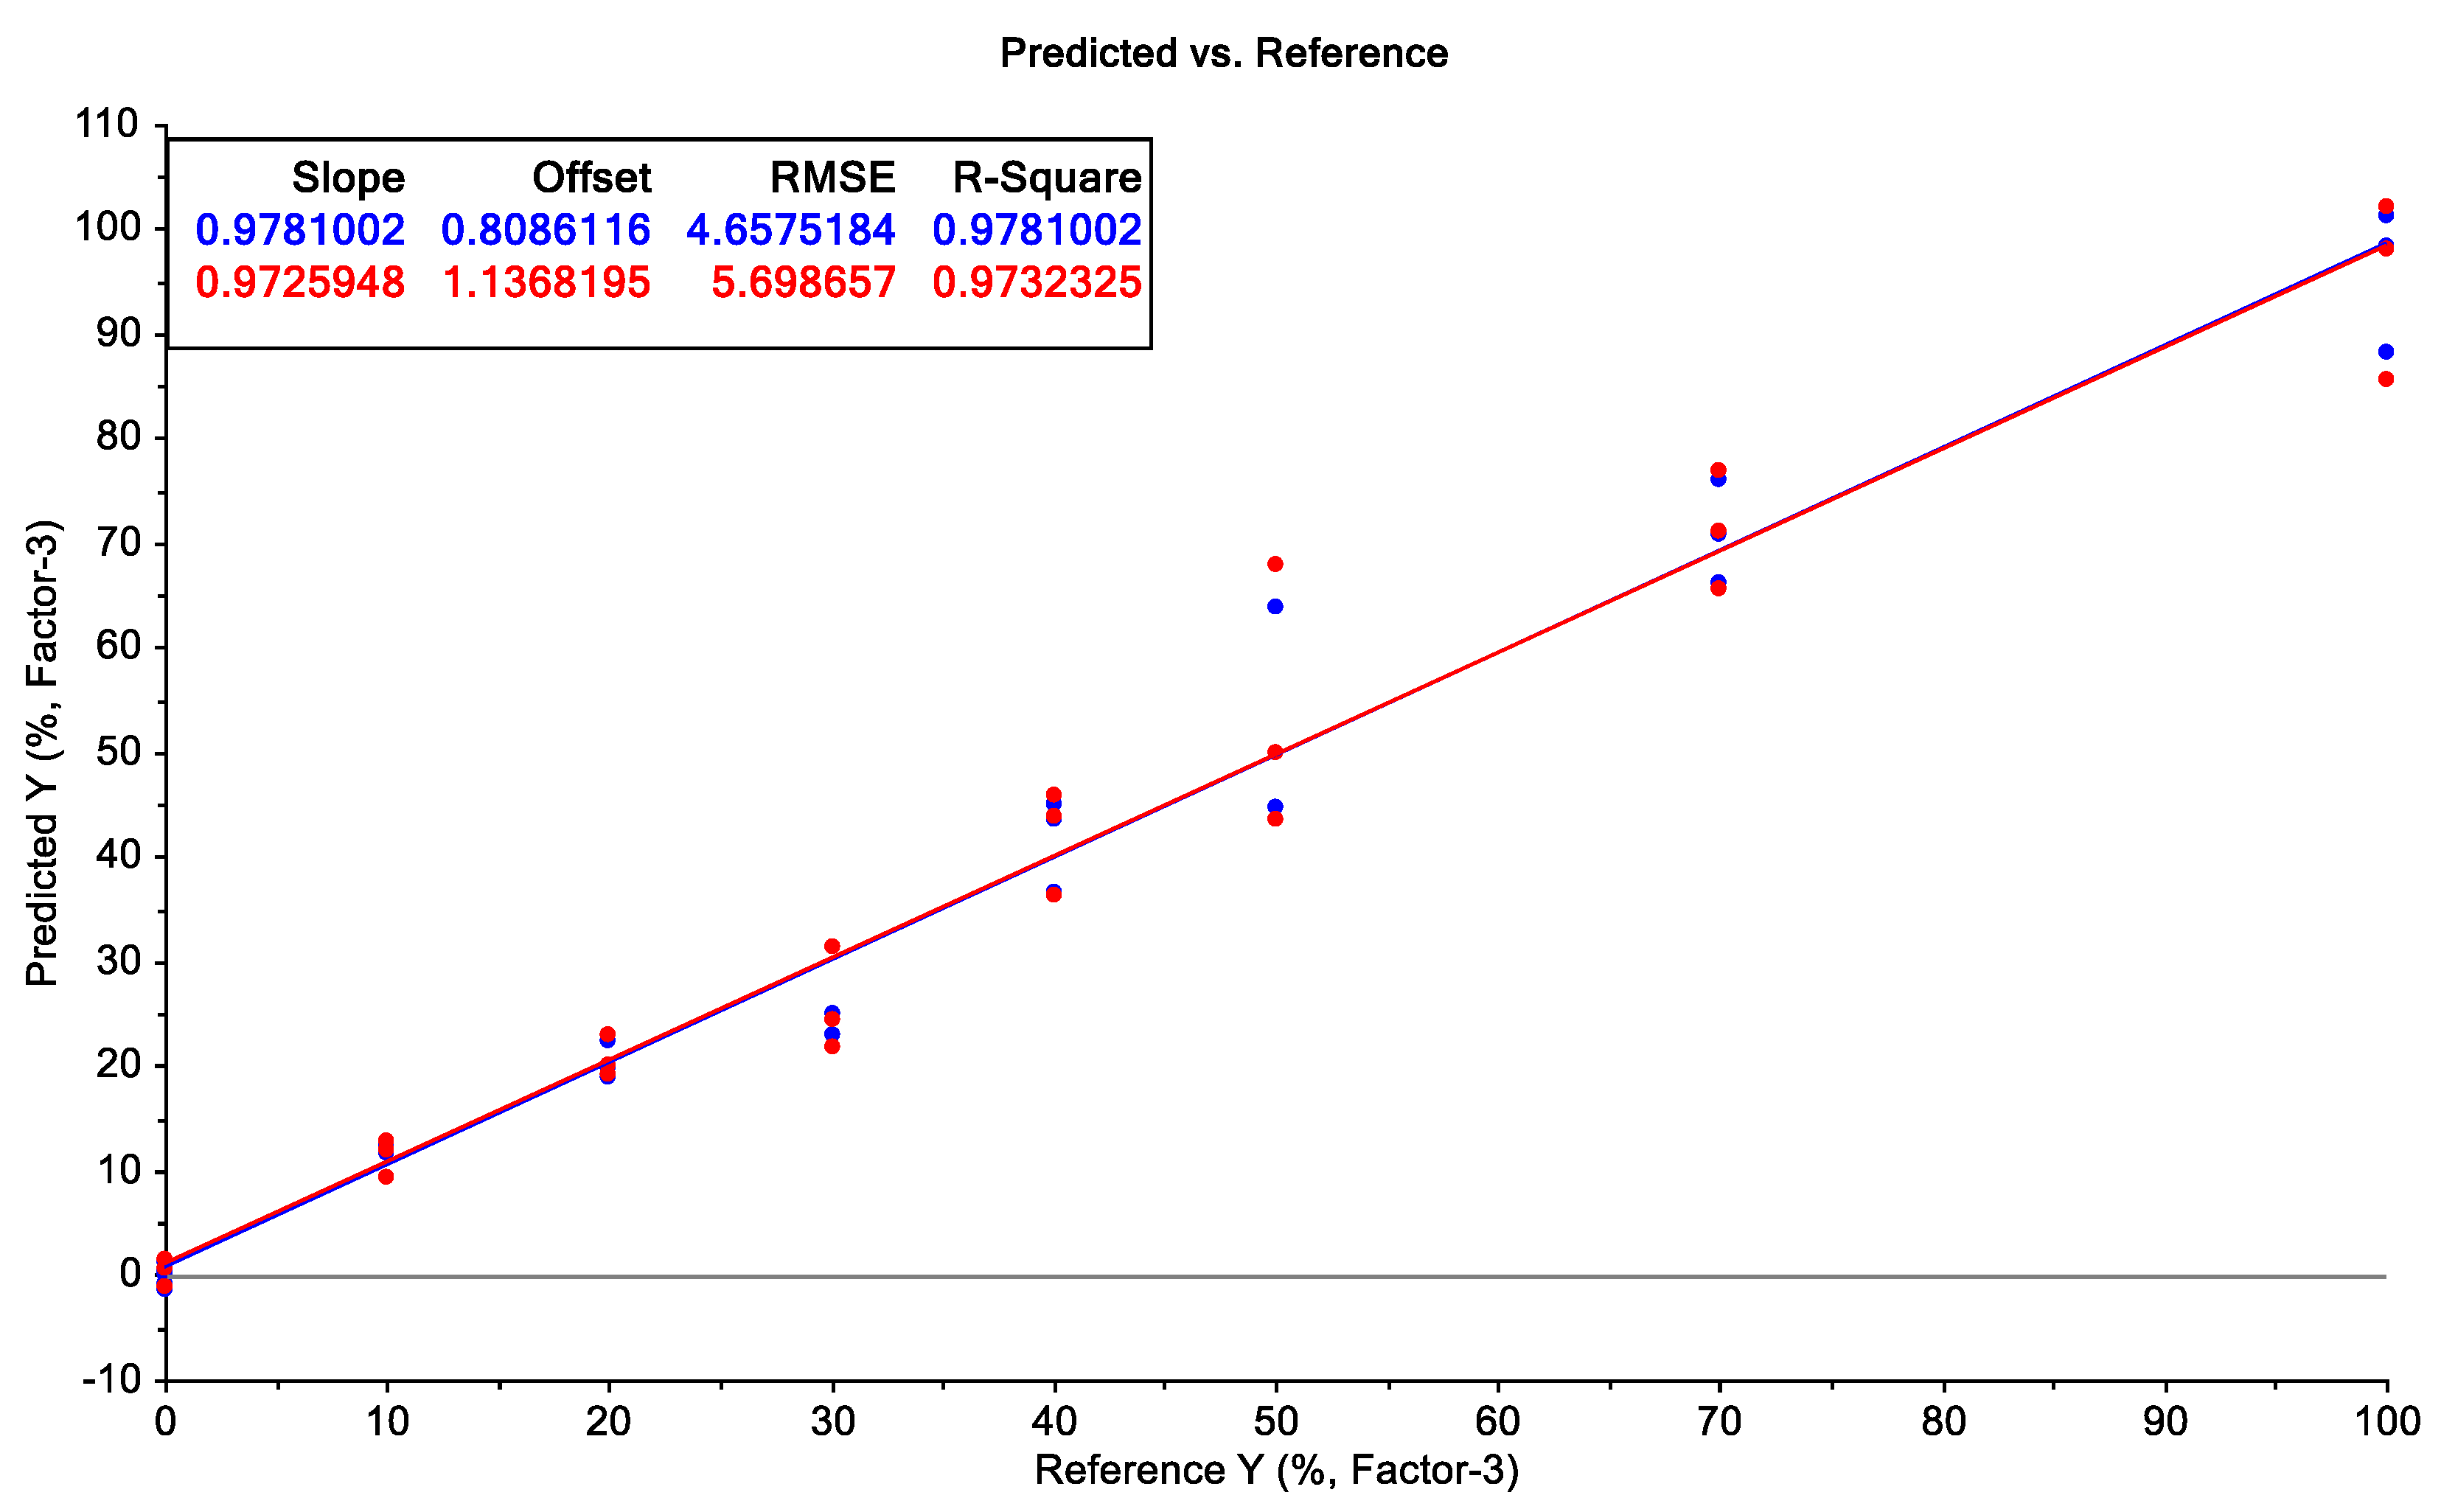
2.3. Prediction Model
3. Material and Methods
3.1. Reagent and Chemicals
3.2. Cacao Samples
3.3. Sample Treatment
3.4. HPLC-ESI-QqQ-MS/MS Data Acquisition
3.5. Data Processing and Chemometrics
3.6. Method Validation
3.7. Extraction Solvent Optimization
Supplementary Materials
Author Contributions
Funding
Acknowledgments
Conflicts of Interest
Abbreviations Used
References
- Statistisches Bundesamt. Statistisches Bundesamt: Erntemenge Von Kakaobohnen Weltweit in Den Jahren 1980/81 Bis 2017/18 (in 1.000 Tonnen). Available online: https://de.statista.com/statistik/daten/studie/6097/umfrage/entwicklung-der-erntemengen-von-kakao-seit-1980/ (accessed on 11 March 2019).
- Guehi, T.S.; Dadie, A.T.; Koffi, K.P.B.; Dabonne, S.; Ban-Koffi, L.; Kedjebo, K.D.; Nemlin, G.J. Performance of Different Fermentation Methods and the Effect of Their Duration on the Quality of Raw Cocoa Beans. Int. J. Food Sci. Technol. 2010, 45, 2508–2514. [Google Scholar] [CrossRef]
- Schwan, R.F.; Wheals, A.E. The Microbiology of Cocoa Fermentation and Its Role in Chocolate Quality. Crit. Rev. Food Sci. Nutr. 2004, 44, 205–221. [Google Scholar] [CrossRef] [PubMed]
- Jinap, S.; Thien, J.; Yap, T.N. Effect of Drying on Acidity and Volatile Fatty Acids Content of Cocoa Beans. J. Sci. Food Agric. 1994, 65, 67–75. [Google Scholar] [CrossRef]
- ICCO. Quarterly Bulletin of Cocoa Statistics Grindings of Cocoa Beans. Available online: https://www.icco.org/about-us/international-cocoa-agreements/cat_view/30-related-documents/48-statistics-grindings.html (accessed on 8 August 2018).
- Ramli, N.; Hassan, O.; Said, M.; Samsudin, W.; Idris, N.A. Influence of Roasting Conditions on Volatile Flavor of Roasted Malaysian Cocoa Beans. J. Food Process. Preserv. 2006, 30, 280–298. [Google Scholar] [CrossRef]
- Lange, H.; Fincke, A. Kakao Und Schokolade. In Alkaloidhaltige Genussmittel, Gewürze, Kochsalz; Springer: Berlin/Heidelberg, Germany, 1970; pp. 210–309. [Google Scholar]
- Kattenberg, H.R.; Kemmink, A. Flavor of Cocoa in Relation to the Origin and Processing of the Cocoa Beans. Dev. Food Sci. 1993, 32, 1–22. [Google Scholar]
- Jinap, S.; Rosli, W.I.W.; Russly, A.R.; Nordin, L.M. Effect of Roasting Time and Temperature on Volatile Component Profiles during Nib Roasting of Cocoa Beans (Theobroma Cacao). J. Sci. Food Agric. 1998, 77, 441–448. [Google Scholar] [CrossRef]
- Okiyama, D.C.G.; Navarro, S.L.B.; Rodrigues, C.E.C. Cocoa Shell and Its Compounds: Applications in the Food Industry. Trends Food Sci. Technol. 2017, 63, 103–112. [Google Scholar] [CrossRef]
- Copetti, M.V.; Iamanaka, B.T.; Nester, M.A.; Efraim, P.; Taniwaki, M.H. Occurrence of Ochratoxin a in Cocoa by-Products and Determination of Its Reduction during Chocolate Manufacture. Food Chem. 2013, 136, 100–104. [Google Scholar] [CrossRef]
- Belitz, H.-D.; Grosch, W.; Schieberle, P. Lehrbuch Der Lebensmittelchemie; Springer: Berlin/Heidelberg, Germany, 2008. [Google Scholar]
- Manda, P.; Dano, D.S.; Kouadio, J.H.; Diakite, A.; Sangare-Tigori, B.; Ezoulin, M.J.M.; Soumahoro, A.; Dembele, A.; Fourny, G. Impact of Industrial Treatments on Ochratoxin a Content in Artificially Contaminated Cocoa Beans. Food Addit. Contam. 2009, 26, 1081–1088. [Google Scholar] [CrossRef]
- Mounicou, S.; Szpunar, J.; Andrey, D.; Blake, C.; Lobinski, R. Concentrations and Bioavailability of Cadmium and Lead in Cocoa Powder and Related Products. Food Addit. Contam. 2003, 20, 343–352. [Google Scholar] [CrossRef]
- Beckett, S.T. The Science of Chocolate; Royal Society of Chemistry: London, UK, 2015. [Google Scholar]
- Kamphuis, H.J. Production and Quality Standards of Cocoa Mass, Cocoa Butter and Cocoa Powder. Ind. Choc. Manuf. Use 2009, 121–140. [Google Scholar] [CrossRef]
- The Royal Society of Chemistry. Cocoa Powder Order. Analyst 1918, 43, 248–249. [Google Scholar] [CrossRef]
- Codex Alimentarius Commission. Standard for Cocoa (Cacao) Mass (Cocoa/Chocolate Liquor) and Cocoa Cake Codex Stan 141-1983; 2014; Available online: http://www.fao.org/input/download/standards/69/CXS_141e.pdf (accessed on 1 March 2020).
- Filsinger, F. Zur Untersuchung Der Kakaofabrikate Auf Gehalt an Kakaoschalen. Z. Fur Öffentliche Chem. 1899, 5, 27. [Google Scholar]
- Plücker, W.; Steinruck, A.; Starck, F. Mikroskopischen Bestimmung Des Schalengehaltes in Kakaowaren. Z. Für Unters. Der Lebensm. 1925, 50, 307–315. [Google Scholar]
- Griebel, C.; Sonntag, F. Zur Mikroskopischen Bestimmung Des Schalengehaltes in Kakaowaren. Z. Für Unters. Der Lebensm. 1926, 51, 185–198. [Google Scholar] [CrossRef]
- Grünhut, L.; Beythien, A.; Pannwitz, P.; Filsinger, F.; Drawe, P.; Franke, H.; Ulrich, C.; Welmans, P.; Grosse-Bohle, H.; Häussler, E.P. Nachweis Von Kakaoschalen Im Kakao, Mit Allgemeinen Angaben Über Rohfaser-Und Pentosanbestimmung. Fresenius J. Anal. Chem. 1917, 56, 332–363. [Google Scholar] [CrossRef]
- Galanos, S. Beiträge Zur Kakaountersuchung. Z. Für Lebensm. Und-Forsch. A 1924, 48, 207–211. [Google Scholar] [CrossRef]
- Fincke, A.; Sacher, H. Investigations into Testing the Purity of Cocoa Butter and Chocolate Fats. Part 6: Quantitative Evaluation of the Colour Reaction with P-Dimethylaminobenzaldehyde for Evidence of Cocoa Shell Fat. Süsswaren 1963, 7, 428–431. [Google Scholar]
- The International Office of Cocoa, Chocolate and Sugar Confectionery (IOCCC) Analytical Method No 108. 1988. Available online: http://www.gomc.com/firstpage/200103068.pdf (accessed on 1 March 2020).
- Janßen, K.; Matissek, R. Fatty Acid Tryptamides as Shell Indicators for Cocoa Products and as Quality Parameters for Cocoa Butter. Eur. Food Res. Technol. 2002, 214, 259–264. [Google Scholar] [CrossRef]
- Münch, M.; Schieberle, P. A Sensitive and Selective Method for the Quantitative Determination of Fatty Acid Tryptamides as Shell Indicators in Cocoa Products. Z. Für Lebensm. Und-Forsch. A 1999, 208, 39–46. [Google Scholar]
- Quelal-Vásconez, M.A.; Lerma-García, M.J.; Pérez-Esteve, É.; Arnau-Bonachera, A.; Barat, J.M.; Talens, P. Fast Detection of Cocoa Shell in Cocoa Powders by near Infrared Spectroscopy and Multivariate Analysis. Food Control 2019, 99, 68–72. [Google Scholar] [CrossRef]
- Cain, N.; Alka, O.; Segelke, T.; von Wuthenau, K.; Kohlbacher, O.; Fischer, M. Food Fingerprinting: Mass Spectrometric Determination of the Cocoa Shell Content (Theobroma Cacao L.) in Cocoa Products by Hplc-Qtof-Ms. Food Chem. 2019, 298, 125013. [Google Scholar] [CrossRef]
- Wurziger, J.; Harms, U. Über Carbonsäurehydroxy-Tryptamide in Ölhaltigen Samen. Fette Seifen Anstrichm. 1973, 75, 121–126. [Google Scholar] [CrossRef]
- Pellegrino, R.M.; di Veroli, A.; Valeri, A.; Goracci, L.; Cruciani, G. Lc/Ms Lipid Profiling from Human Serum: A New Method for Global Lipid Extraction. Anal. Bioanal. Chem. 2014, 406, 7937–7948. [Google Scholar] [CrossRef] [PubMed]
- Chambers, E.; Wagrowski-Diehl, D.M.; Lu, Z.; Mazzeo, J.R. Systematic and Comprehensive Strategy for Reducing Matrix Effects in Lc/Ms/Ms Analyses. J. Chromatogr. 2007, 852, 22–34. [Google Scholar] [CrossRef] [PubMed]
- Downey, G.; Briandet, R.; Wilson, R.H.; Kemsley, E.K. Near-and Mid-Infrared Spectroscopies in Food Authentication: Coffee Varietal Identification. J. Agric. Food Chem. 1997, 45, 4357–4361. [Google Scholar] [CrossRef]
- Kemsley, E.K.; Holland, J.K.; Defernez, M.; Wilson, R.H. Detection of Adulteration of Raspberry Purees Using Infrared Spectroscopy and Chemometrics. J. Agric. Food Chem. 1996, 44, 3864–3870. [Google Scholar] [CrossRef]
- Miedaner, T. Schokolade–Speise Der Götter. In Genusspflanzen; Springer: Berlin/Heidelberg, Germany, 2018; pp. 179–201. [Google Scholar]
- FDA. Guidance for Industry: Bioanalytical Method Validation. In Food and Drug Administration, Center for Drug Evaluation and Research (CDER), Center for Veterinary Medicine (CV); US Department of Health and Human Services: Rockville, MD, USA, 2018. [Google Scholar]
- Deutsches Institut für Normung (DIN). Chemical Analysis—Decision Limit, Detection Limit and Determination Limit under Repeatability Conditions—Terms, Methods, Evaluation; DIN: Berlin, Germany, 2008. [Google Scholar]
- Mandel, J. The Statistical Analysis of Experimental Data; John Wiley & Sons: Washington, DC, USA, 1964. [Google Scholar]
- Regulation (EC) No 1272/2008 of the European Parliament and the Council of 16 December 2008 on Classification, Labelling and Packaging of Substances and Mixtures, Amending and Repealing Directives 67/548/EEC and 1999/45/EC, and Amending Regulation (EC) No 1907/2006. Available online: https://eur-lex.europa.eu/eli/reg/2008/1272/oj (accessed on 1 March 2020).


| Reference Standard | Base Calibration | Matrix Calibration | ||||||
|---|---|---|---|---|---|---|---|---|
| Regression Equation | R2 | Linear Range (µM) | LOD (nM) | Regression Equation | R2 | Linear Range (µM) | LOD (nM) | |
| Arachidonic acid serotonin | y = 248220.2 · x + 1533.5 | 0.999 | 0.001–1 | 0.09 | y = 278210.6 · x − 986.1 | 0.999 | 0.002–0.8 | 0.08 |
| Docosanoic acid tryptamide | y = 12455742.5 · x + 543249.3 | 0.992 | 0.06–1 | 0.82 | y = 14596705.2 · x + 9745880.4 | 0.996 | 0.008–0.8 | 0.70 |
| Dihydroceramide (d18:0/16:0) | y = 1773104.3 · x + 13728.51 | 0.998 | 0.0002–1 | 0.14 | y = 1977769.7 · x − 39526.9 | 0.999 | 0.0004–0.8 | 0.12 |
| 16:0(2S-OH) Ceramide | y = 1782136.1 · x + 1191.2 | 0.999 | 0.001–1 | 0.31 | y = 3298578.8 · x + 15185.9 | 0.999 | 0.002–0.8 | 0.17 |
| α-Tocopheryl palmitate | y = 16762174.8 · x + 5161.2 | 0.998 | 0.0002–0.01 | 0.04 | y = 352568.9 · x + 14953.1 | 0.992 | 0.008–0.8 | 1.87 |
| Reference Standard | Calibration Level | Base Calibration | Matrix Calibration | ||
|---|---|---|---|---|---|
| Accuracy (%) | Precision (%) | Accuracy (%) | Precision (%) | ||
| Arachidonic acid serotonin | 0.001 µM | 12.85 | 11.65 | 8.72 | 8.83 |
| 0.04 µM | 9.42 | 3.78 | 6.67 | 4.68 | |
| 1 µM | 0.45 | 2.14 | 1.34 | 14.11 | |
| Docosanoic acid tryptamide | 0.06 µM | 2.77 | 7.09 | 10.21 | 3.40 |
| 0.2 µM | 9.00 | 3.75 | 5.10 | 2.33 | |
| 1 µM | 3.19 | 2.71 | 2.77 | 3.54 | |
| Dihydroceramide (d18:0/16:0) | 0.0002 µM | 5.66 | 11.31 | 6.58 | 4.67 |
| 0.01 µM | 8.75 | 8.91 | 4.78 | 5.43 | |
| 1 µM | 1.11 | 3.39 | 2.26 | 4.31 | |
| 16:0(2S-OH) Ceramide | 0.001 µM | 12.49 | 15.35 | 6.61 | 6.71 |
| 0.01 µM | 7.29 | 7.41 | 3.05 | 4.65 | |
| 1 µM | 2.78 | 5.98 | 2.05 | 0.73 | |
| α-Tocopheryl palmitate | 0.0002 µM | 14.42 | 5.20 | 17.34 | 5.16 |
| 0.001 µM | 2.34 | 5.31 | 11.08 | 8.14 | |
| 0.01 µM | 13.70 | 6.60 | 5.53 | 5.93 | |
| Key Metabolite | Calculated Cocoa Shell Content Ecuador Sample (%) | Calculated Cocoa Shell Content Ivory Coast Sample (%) |
|---|---|---|
| α-Tocomonoenol | 9.0 | 1.7 |
| Heneicosylic acid serotonin | 0.9 | 2.0 |
| Docosanoic acid serotonin | 1.4 | 1.8 |
| Lignoceric acid serotonin | 4.1 | 1.0 |
| Pentacosanoic acid serotonin | 4.0 | 0.2 |
| Hexacosanic acid serotonin | 11 | −0.8 |
| Behenic acid tryptamide | 4.5 | 1.7 |
| Heneicosylic acid tryptamide | 3.6 | 1.7 |
| Tricosanoic acid tryptamide | 6.1 | 1.8 |
| Pentacosanoic acid tryptamide | 14 | 1.0 |
| Hexacosanic acid tryptamide | 22 | 0.1 |
| Dihydroceramide (d18:0/16:0) | 5.5 | 5.2 |
| Cer(d25:0(OH)/18:0(3OH)) | 5.1 | 2.4 |
| α-Tocopherolpalmitat | 4.3 | 0.0 |
| Lignoceric acid tryptamide | 8.7 | 1.2 |
| Ø Average | 6.9 | 1.4 |
| Actual value | 6.1 | 2.0 |
| Sample | Shell Content (%) | Predicted Shell Content (Prediction Model 1) (%) | Predicted Shell Content (Prediction Model 2) (%) | Variance (Prediction Model 1) (%) | Variance (Prediction Model 2) (%) |
|---|---|---|---|---|---|
| Ghana | 1.08 | 1.58 | 0.22 | 0.50 | 0.86 |
| Ivory Coast | 2.01 | 2.67 | 2.16 | 0.66 | 0.15 |
| Nigeria | 2.98 | 2.02 | 4.35 | 0.96 | 1.37 |
| Panama | 4.10 | 3.36 | 5.14 | 0.74 | 1.04 |
| Indonesia | 5.02 | 5.10 | 5.94 | 0.08 | 0.92 |
| Ecuador | 6.06 | 4.24 | 6.83 | 1.82 | 0.77 |
| Madagascar | 7.26 | 3.94 | 8.04 | 3.32 | 0.78 |
| Venezuela | 7.32 | 2.24 | 6.87 | 5.08 | 0.45 |
| Sample | Predicted Shell Content (%) | Percentage of Cocoa (%) | Calculated Shell Content in Utilized Cocoa (%) |
|---|---|---|---|
| Milk chocolate | 2.01 | ~30 | 6.70 |
| White chocolate | 2.78 | ~30 | 9.27 |
| White chocolate | 2.22 | ~30 | 7.40 |
| Dark chocolate | 4.12 | 55 | 7.49 |
| Dark chocolate | 4.75 | 50 | 9.50 |
| Extra dark chocolate | 5.36 | 73 | 7.34 |
| chocolate (1) | 4.13 | 33 | 12.52 |
| chocolate (1) | 4.23 | 55 | 7.69 |
| chocolate (1) | 5.35 | 66 | 8.11 |
| chocolate (1) | 6.70 | 88 | 7.61 |
| chocolate (2) | 2.37 | 50 | 4.74 |
| chocolate (2) | 3.01 | 70 | 4.30 |
| chocolate (2) | 5.74 | 85 | 6.75 |
| chocolate (2) | 5.00 | 99 | 5.05 |
| Cocoa butters | 6.79 | 100 | 6.79 |
© 2020 by the authors. Licensee MDPI, Basel, Switzerland. This article is an open access article distributed under the terms and conditions of the Creative Commons Attribution (CC BY) license (http://creativecommons.org/licenses/by/4.0/).
Share and Cite
Cain, N.; Marji, C.; von Wuthenau, K.; Segelke, T.; Fischer, M. Food Targeting: Determination of the Cocoa Shell Content (Theobroma cacao L.) in Cocoa Products by LC-QqQ-MS/MS. Metabolites 2020, 10, 91. https://doi.org/10.3390/metabo10030091
Cain N, Marji C, von Wuthenau K, Segelke T, Fischer M. Food Targeting: Determination of the Cocoa Shell Content (Theobroma cacao L.) in Cocoa Products by LC-QqQ-MS/MS. Metabolites. 2020; 10(3):91. https://doi.org/10.3390/metabo10030091
Chicago/Turabian StyleCain, Nicolas, Christian Marji, Kristian von Wuthenau, Torben Segelke, and Markus Fischer. 2020. "Food Targeting: Determination of the Cocoa Shell Content (Theobroma cacao L.) in Cocoa Products by LC-QqQ-MS/MS" Metabolites 10, no. 3: 91. https://doi.org/10.3390/metabo10030091
APA StyleCain, N., Marji, C., von Wuthenau, K., Segelke, T., & Fischer, M. (2020). Food Targeting: Determination of the Cocoa Shell Content (Theobroma cacao L.) in Cocoa Products by LC-QqQ-MS/MS. Metabolites, 10(3), 91. https://doi.org/10.3390/metabo10030091