Abstract
The Ketogenic Diet (KD) is a high-fat, low-carbohydrate diet that has been utilized as the first line treatment for contrasting intractable epilepsy. It is responsible for the presence of ketone bodies in blood, whose neuroprotective effect has been widely shown in recent years but remains unclear. Since glutathione (GSH) is implicated in oxidation-reduction reactions, our aim was to monitor the effects of KD on GSH brain levels by means of magnetic resonance spectroscopy (MRS). MRS was acquired from 16 KD patients and seven age-matched Healthy Controls (HC). We estimated metabolite concentrations with linear combination model (LCModel), assessing differences between KD and HC with t-test. Pearson was used to investigate GHS correlations with blood serum 3-B-Hydroxybutyrate (3HB) concentrations and with number of weekly epileptic seizures. The results have shown higher levels of brain GSH for KD patients (2.5 ± 0.5 mM) compared to HC (2.0 ± 0.5 mM). Both blood serum 3HB and number of seizures did not correlate with GSH concentration. The present study showed a significant increase in GSH in the brain of epileptic children treated with KD, reproducing for the first time in humans what was previously observed in animal studies. Our results may suggest a pivotal role of GSH in the antioxidant neuroprotective effect of KD in the human brain.
1. Introduction
Ketogenic Diet (KD) is a high-fat, low-carbohydrate diet that has been utilized as an adjuvant treatment for epilepsy for over 90 years [1] KD mimics the effect of fasting, causing the body to maintain a prolonged state of ketosis. The first event occurring during KD is the blood level increase of three ‘ketone bodies’, namely Acetoacetate (AcAc), 3-B-Hydroxybutyrate (3HB) and Acetone. AcAc accumulates during enhanced fatty acid metabolism under low carbohydrate conditions, while 3HB is formed from the reduction in AcAc within the mitochondria. These two predominant ketone bodies are energy-enriched compounds that transport energy from the liver to other tissues. Over the years, KD has become an elective indication for contrasting intractable epilepsy. Brain tissue is vulnerable to oxidative damage because of its high oxygen consumption, with consequent generation of high levels of reactive oxygen species (ROS). ROS have been associated with damage to cerebral tissue in several neurological diseases, such as epilepsy itself. Ketosis induced by KD elevates the anti-oxidative capacity of the central nervous system in animal models [2] and improves patient conditions [3]. The mechanism of action of KD is heterogeneous, including the shifting of glycolysis products towards lipid metabolism, and the regulation of mitochondrial metabolism. Moreover, KD may regulate neuronal activity and transmission through different mechanisms, influencing neurotransmitter balance and gene expression [4,5]. The neuroprotective effect of ketone bodies has been widely shown in recent years [2,6,7,8,9,10,11], but the mechanism underlying the influence of KD on mitochondrial redox status has yet to be fully understood. Furthermore, very little is known of the in vivo metabolic dynamics of KD and how antioxidant activity might be triggered by a high level of ketone bodies in humans. Glutathione (GSH) is a tripeptide thiol found virtually in all cells. Among its many roles, it is implicated in oxidation-reduction reactions, acts as an enzyme cofactor, and protects against ROS [11,12,13]. Remarkably, a previous study has shown that epileptic seizures lead to a depletion of mitochondrial GSH [14], supporting the idea of a link between epilepsy and oxidative stress, with possible beneficial effects of KD in this condition. Few animal studies demonstrated that GSH or GSH-related enzymes increase during KD, thus suggesting a possible role for GSH as a ‘biomarker’ of good redox status [2,15]. Nevertheless, no evidence of such an increase has been observed in vivo in the human brain to date. Our aim is to estimate brain GSH levels in patients undergoing KD adjuvant therapy by magnetic resonance spectroscopy (MRS) to investigate whether GSH increases are detectable compared to healthy controls (HC), in a similar way to animal studies.
2. Results
Voxels were located in the ganglio-capsular region of the right hemisphere (Figure 1). For each patient, GSH absolute concentrations and GSH concentration relative to creatine/phosphocreatine (GSH/Cr) are reported in Table 1, along with CRLB, n-acetylaspartate (NAA)-to-creatine ratio (NAA/Cr), linewidth and Signal to noise ratio. The quality of spectra was good for most of the study subjects, with only one patient excluded from the statistical analysis as due to incorrect water suppression. Figure 2 reported the composite spectrum from the ganglio-capsular VOI with the LC Model fit overlaid for a control (Figure 2A) and a KD patient (Figure 2B). Mean concentrations of GSH (KD: 2.5 ± 0.5 mM, HC: 2.0 ± 0.5 mM) show a 15% GSH increase in the KD group compared to HC (p < 0.04). Pearson analysis revealed no correlation between GSH and blood serum 3HB concentrations. Similarly, no correlation was observed between GSH and number of seizures.
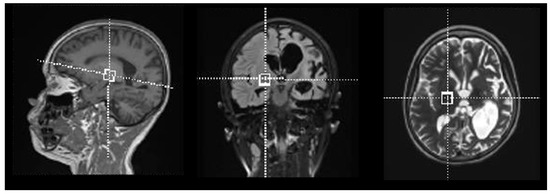
Figure 1.
Voxel positioning within right ganglio-capsular region.

Table 1.
Clinical data of KD patients. Abbreviations: GSH/Cr + PCr = Glutathione to creatine/phosphocreatine ratio; NAA/Cr + PCr = N-acetylaspartate to creatine/phosphocreatine ratio; FWHM = Full width at half maximum; S/N = Signal to noise ratio; DNM1L ME = Dynamin-1-like Protein Mitochondrial Encephalopathy; PDH = Pyruvate dehydrogenase deficiency; GLUT-1 = Glucose transporter -1; GCK-HI: Congenital Hyperinsulinism caused by Glucokinase mutations; NKH = Non-ketotic hyperglycinemia; unknown EE = unknown epileptic encephalopathy; ATP1A3 = sodium-potassium ATPase catalytic subunit alpha-3; KCNT1 = potassium sodium-activated channel subfamily T member 1; PRRT2 = Proline-rich transmembrane protein 2.
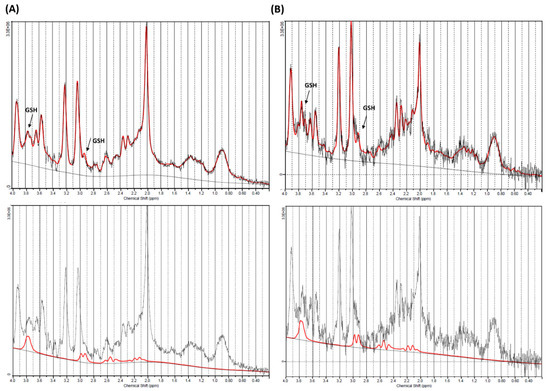
Figure 2.
Magnetic resonance (MR)-spectrum obtained within ganglio-capsular volume of interest (VOI) for a control (A) and a Ketogenic Diet (KD) patient (B). Composite spectrum (above) presents glutathione (GSH) peaks of approximately 2.95 and and 3.75 ppm (black arrow), that are more visible on the GSH fitting spectra (below).
3. Discussion
The present study employs in vivo MRS to monitor KD effects on brain metabolism. In particular, we focused on GSH to investigate concentration changes in this important metabolite following KD therapy. According to our results, patients undergoing KD showed higher levels of brain GSH compared to HC. Jarret et al. reported higher GSH concentration levels in the hippocampal mitochondria of rats under KD compared to controls by using High Performance Liquid Chromatography [15]. Although the evidence of high GSH levels was reported in the hippocampus alone, such a result is quite in line with our findings suggesting that KD might stimulate de novo GSH synthesis and improve the redox status of the brain. It is indeed well established that GSH plays a neuroprotective role against oxidative stress, with several diseases originating from its dysregulation [16,17,18]. GSH is a product of glycolysis, able to modulate glutamate receptors and calcium influx [19]. A GSH increase was also demonstrated in a Parkinson’s disease animal model. The authors reported elevated GSH levels in KD-fed rats compared to controls [20], validating the idea that ketone bodies may influence GSH concentration. The mechanism underlying GSH increase during KD may involve the upregulation of nuclear factor erythroid 2-related factor 2 (NRF2) transcription factor, a primary responder to cellular stress which promotes GSH biosynthesis, as demonstrated in rats [4]. The upregulation of Nrf2 may depends on the mild oxidative and electrophilic stress initially induced by the KD, leading to chronic cellular adaptation, induction of protective proteins, and stable improvement in redox state [4]. All known brain antioxidants, directly or indirectly, depend on NADPH production, and 3HB is implicated in elevating the levels of NADH producing AcAc [21]. Moreover, among all ketone bodies, 3HB seems to be involved in decreasing the NADP+/NADPH ratio through a variety of mechanisms such as decreasing the glycolytic flux [22,23,24,25] or increasing the concentration of mitochondrial acetyl-CoA [22]. There is also a tight link between NADH and NADPH, as the latter is synthetized via nicotinamide nucleotide transhydrogenase by transferring hydride ions from NADH to NADP+ [23,25]. High levels of NADPH translate into an increase in several antioxidants [26]: GSH is surely one of them, since it participates in the chemical equation
where GSSG is glutathione disulfide, the oxidized form of glutathione [13]. Moreover, 3HB is also an endogenous inhibitor of class I histone deacetylases (HDACs), which are epigenome modifiers that act on chromatin by removing acetyl groups from histone tails. This process is known to impact cells’ oxidative balance by inducing protector genes such as Foxo3 and Mt2 [27,28]. In conflict with our results, an in vitro study showed that ketone bodies may reduce reactive oxygen species without GSH increase [8]. This discrepancy might depend on GSH homeostasis impairment due to the particular experimental setting for the in vitro study. On the other hand, no correlation was observed between blood 3HB and GSH levels in our study. The reason for this might rely on differences in medications, lifestyle and age among our patients, which may influence GSH levels. Even though a study on epileptic patients showed a reduction in GSH as due to the effect of seizures [14], our study failed to observe a correlation between GSH and number of seizures. Multiple factors can affect patient response to KD, leading to a GSH level misbalance in cases of epileptic seizure [29]. Furthermore, patient response may vary on a genetic basis [29].
Our study has an intrinsic limitation due to the small number of patients included. However, KD is a very specific adjuvant treatment reserved for few rare clinical conditions, so large populations are difficult to recruit. In addition, there is no clear evidence about the possible effects of other medications on GSH levels. Anesthesia might be a further possible confound for the present study, as it could modify the GSH brain [30]. However, sevoflurane was the only anesthetic employed in the study, which has been shown to reduce GSH levels rather than increase them [30]. Consequently, we can hypothesize the anesthesia-confounding effect as being negligible. From a methodological perspective, GSH is often quantified using a J-edited MEGAPRESS sequence with a longer echo time (TE), which demonstrated reliable estimation of GSH concentrations [31], as well as a better performance with time domain fitting methods [32]. Due to time constraints related to the clinical practice, our protocol was rather based on a short echo time PRESS sequence. Such a protocol has been widely used in a variety of disorders to quantify GSH [33,34,35,36,37,38,39,40] and was validated several times with phantom studies [33,34], by assessing reproducibility [39] and by comparing the results with 7T quantification [38]. Further studies are needed to exploit MEGA-PRESS clinical applications, including the effects of extended and closed GSH forms in the brain under KD, similarly to what is performed in Alzheimer disease [41]. Future investigation on ketone bodies’ concentration before and during KD will further develop our understanding of the effects of this therapy, especially if compared to epileptic patients with different treatments.
4. Materials and Methods
4.1. Standard Protocol Approvals, Registrations, and Patient Consents
The study has been approved by our IRB with waiver of informed consent due to retrospective design. Specific informed consent for the execution of MR examinations was obtained from every patient/next of kin. The study was carried out in agreement with the principles of the Helsinki declaration. This research was approved by the ethical committee of Bambino Gesù Children's Hospital (protocol number 1867/2019).
4.2. Subjects
We identified 31 patients treated with classic KD. Each patient followed a diet with a specific KD ratio (ratio of lipids to combined fat and protein), depending on clinical course and seizure response. Out of 31 subjects, 17 KD patients (mean age = 7.3 y, range = 0.4−16 y, 50% female) underwent MRS during their treatment, producing 17 spectra. Additionally, a group of seven age-matched Healthy Controls (HC) (mean age = 9.8, range = 6−17 y, 43% female) was included in the study for comparison. A steady 3HB concentration was assured before and during fasting, soon before and soon after the end of the procedure. Clinical data on patient age, diagnosis, medications, diet duration and seizure occurrence (mean number of seizures per week computed over a period of 4 weeks) were reported in Table 1.
4.3. Data Acquisition
Brain MRI and MRS were acquired on a 3T scanner (Siemens Magnetom Skyra, Siemens Medical Systems, Erlangen, Germany) equipped with a 32-channel head-coil. Each participant received a single voxel point resolved MRS sequence PRESS (TR: 1980 ms, TE: 30 ms, FA: 90 degrees, Number of averages: 120), with different sizes of VOI (ranging from 3 to 8 cm3, depending on brain dimensions) located in the ganglio-capsular region of the right hemisphere (Figure 1). The area was chosen based upon optimal shimming with similar concentrations as in cortex and for its reproducibility [40]. All examinations were performed under sedation via Sevorane. All the acquisitions were performed after an automatic second order shimming on the volume of interest, and a visual inspection on the inline display was used to check for data quality. Water suppression was also applied as implemented in the Siemens platform to avoid baseline distortion. A further unsuppressed water spectrum with only 16 averages was acquired for reference purposes.
4.4. Data Processing
Metabolite concentrations were estimated using linear combination model (LCModel) [42]. An appropriate basis-dataset was used and water signal served as internal standard for absolute quantification. The reliability of metabolite quantification was judged upon Cramer Rao lower bounds (CRLB) as well as spectra linewidth. The standard recommended quality criterion of CRLB < 20% was applied to exclude GSH concentration values which were not reliable for the following analysis. Signal to Noise Ratio was also included as a factor for quality control.
4.5. Statistical Analysis
Heteroscedastic T-test was used to assess metabolite concentrations differences between KD and HC, setting the significance at 0.05. Correlations between GSH and blood serum 3HB concentrations, as well as between GSH and number of weekly epileptic seizures (see Table 1), were also investigated using Pearson’s correlation coefficient. All analyses were performed in Matlab (Matlab R2017a, The Mathworks, Inc., Natik, MA, USA).
5. Conclusions
The present study reproduced, for the first time in vivo and in children, what has previously been observed in animal models. Further studies are needed to verify our results, extend our findings, and clarify whether GSH changes are specific for some brain areas. However, if confirmed by further investigations, our results may suggest a protective role for KD in the brain by influencing the redox balance.
Author Contributions
Literature research, A.N., D.L., L.P., M.C.R.-E., G.L. and A.M.; data acquisition, A.N., D.L., M.C.R.-E., G.L., A.M., D.E., P.D.L., C.D.-V. and R.C.; data analysis, A.N. and M.L.; data interpretation, A.N., D.L., L.P., M.C.R.-E., G.L., A.M., C.D.-V. and R.C.; manuscript writing, A.N.; manuscript editing, all authors. All authors have read and agreed to the published version of the manuscript.
Funding
Grant OPBG2019/04 for the project: “Imaging analysis and spectroscopy” at Bambino Gesù Children’s Hospital, Rome (PI: Pasquini Luca; Sponsor: Swedish Orphan Biovitrum—SOBI).
Conflicts of Interest
The authors declare no conflict of interest.
References
- Verrotti, A.; Iapadre, G.; Pisano, S.; Coppola, G. Ketogenic diet and childhood neurological disorders other than epilepsy: An overview. Expert Rev. Neurother. 2017, 17, 461–473. [Google Scholar] [CrossRef] [PubMed]
- Ziegler, D.R.; Ribeiro, L.C.; Hagenn, M.; Siqueira, I.R.; Araujo, E.; Torres, I.L.; Gottfried, C.; Netto, C.A.; Goncalves, C.A. Ketogenic diet increases glutathione peroxidase activity in rat hippocampus. Neurochem. Res. 2003, 28, 1793–1797. [Google Scholar] [CrossRef] [PubMed]
- Coppola, G.; Veggiotti, P.; Cusmai, R.; Bertoli, S.; Cardinali, S.; Dionisi-Vici, C.; Elia, M.; Lispi, M.L.; Sarnelli, C.; Tagliabue, A.; et al. The ketogenic diet in children, adolescents and young adults with refractory epilepsy: An Italian multicentric experience. Epilepsy Res. 2002, 48, 221–227. [Google Scholar] [CrossRef]
- Milder, J.B.; Liang, L.P.; Patel, M. Acute oxidative stress and systemic Nrf2 activation by the ketogenic diet. Neurobiol. Dis. 2010, 40, 238–244. [Google Scholar] [CrossRef]
- Longo, R.; Peri, C.; Cricri, D.; Coppi, L.; Caruso, D.; Mitro, N.; De Fabiani, E.; Crestani, M. Ketogenic Diet: A New Light Shining on Old but Gold Biochemistry. Nutrients 2019, 11, 2497. [Google Scholar] [CrossRef]
- Suzuki, M.; Kitamura, Y.; Mori, S.; Sato, K.; Dohi, S.; Sato, T.; Matsuura, A.; Hiraide, A. Beta-hydroxybutyrate, a cerebral function improving agent, protects rat brain against ischemic damage caused by permanent and transient focal cerebral ischemia. Jpn. J. Pharmacol. 2002, 89, 36–43. [Google Scholar] [CrossRef]
- Suzuki, M.; Sato, K.; Dohi, S.; Sato, T.; Matsuura, A.; Hiraide, A. Effect of beta-hydroxybutyrate, a cerebral function improving agent, on cerebral hypoxia, anoxia and ischemia in mice and rats. Jpn. J. Pharmacol. 2001, 87, 143–150. [Google Scholar] [CrossRef]
- Maalouf, M.; Sullivan, P.G.; Davis, L.; Kim, D.Y.; Rho, J.M. Ketones inhibit mitochondrial production of reactive oxygen species production following glutamate excitotoxicity by increasing NADH oxidation. Neuroscience 2007, 145, 256–264. [Google Scholar] [CrossRef]
- Sullivan, P.G.; Dube, C.; Dorenbos, K.; Steward, O.; Baram, T.Z. Mitochondrial uncoupling protein-2 protects the immature brain from excitotoxic neuronal death. Ann. Neurol. 2003, 53, 711–717. [Google Scholar] [CrossRef]
- Bough, K.J.; Wetherington, J.; Hassel, B.; Pare, J.F.; Gawryluk, J.W.; Greene, J.G.; Shaw, R.; Smith, Y.; Geiger, J.D.; Dingledine, R.J. Mitochondrial biogenesis in the anticonvulsant mechanism of the ketogenic diet. Ann. Neurol. 2006, 60, 223–235. [Google Scholar] [CrossRef]
- Nazarewicz, R.R.; Ziolkowski, W.; Vaccaro, P.S.; Ghafourifar, P. Effect of short-term ketogenic diet on redox status of human blood. Rejuvenation Res. 2007, 10, 435–440. [Google Scholar] [CrossRef] [PubMed]
- Wu, G.; Fang, Y.Z.; Yang, S.; Lupton, J.R.; Turner, N.D. Glutathione metabolism and its implications for health. J. Nutr. 2004, 134, 489–492. [Google Scholar] [CrossRef] [PubMed]
- Rae, C.D.; Williams, S.R. Glutathione in the human brain: Review of its roles and measurement by magnetic resonance spectroscopy. Anal. Biochem. 2017, 529, 127–143. [Google Scholar] [CrossRef] [PubMed]
- Mueller, S.G.; Trabesinger, A.H.; Boesiger, P.; Wieser, H.G. Brain glutathione levels in patients with epilepsy measured by in vivo (1)H-MRS. Neurology 2001, 57, 1422–1427. [Google Scholar] [CrossRef]
- Jarrett, S.G.; Milder, J.B.; Liang, L.P.; Patel, M. The ketogenic diet increases mitochondrial glutathione levels. J. Neurochem. 2008, 106, 1044–1051. [Google Scholar] [CrossRef]
- Choi, I.Y.; Lee, S.P.; Denney, D.R.; Lynch, S.G. Lower levels of glutathione in the brains of secondary progressive multiple sclerosis patients measured by 1H magnetic resonance chemical shift imaging at 3 T. Mult. Scler. J. 2011, 17, 289–296. [Google Scholar] [CrossRef]
- Weiduschat, N.; Mao, X.; Hupf, J.; Armstrong, N.; Kang, G.; Lange, D.J.; Mitsumoto, H.; Shungu, D.C. Motor cortex glutathione deficit in ALS measured in vivo with the J-editing technique. Neurosci. Lett. 2014, 570, 102–107. [Google Scholar] [CrossRef]
- Srinivasan, R.; Ratiney, H.; Hammond-Rosenbluth, K.E.; Pelletier, D.; Nelson, S.J. MR spectroscopic imaging of glutathione in the white and gray matter at 7 T with an application to multiple sclerosis. Magn. Reson. Imaging 2010, 28, 163–170. [Google Scholar] [CrossRef]
- Goncalves, C.A.; Rodrigues, L.; Bobermin, L.D.; Zanotto, C.; Vizuete, A.; Quincozes-Santos, A.; Souza, D.O.; Leite, M.C. Glycolysis-Derived Compounds From Astrocytes That Modulate Synaptic Communication. Front. Neurosci. 2018, 12, 1035. [Google Scholar] [CrossRef]
- Cheng, B.; Yang, X.; An, L.; Gao, B.; Liu, X.; Liu, S. Ketogenic diet protects dopaminergic neurons against 6-OHDA neurotoxicity via up-regulating glutathione in a rat model of Parkinson’s disease. Brain Res. 2009, 1286, 25–31. [Google Scholar] [CrossRef] [PubMed]
- Achanta, L.B.; Rae, C.D. 𝛽-Hydroxybutyrate in the Brain: One Molecule, Multiple Mechanisms. Neurochem. Res. 2017, 42, 35–49. [Google Scholar] [CrossRef] [PubMed]
- Sato, K.; Kashiwaya, Y.; Keon, C.A.; Tsuchiya, N.; King, M.T.; Radda, G.K.; Chance, B.; Clarke, K.; Veech, R.L. Insulin, ketone bodies, and mitochondrial energy transduction. FASEB J. 1995, 9, 651–658. [Google Scholar] [CrossRef] [PubMed]
- Agledal, L.; Niere, M.; Ziegler, M. The phosphate makes a difference: Cellular functions of NADP. Redox Rep. Commun. Free Radic. Res. 2010, 15, 2–10. [Google Scholar] [CrossRef] [PubMed]
- Veech, R.L.; Bradshaw, P.C.; Clarke, K.; Curtis, W.; Pawlosky, R.; King, M.T. Ketone bodies mimic the life span extending properties of caloric restriction. IUBMB Life 2017, 69, 305–314. [Google Scholar] [CrossRef]
- Blacker, T.S.; Duchen, M.R. Investigating mitochondrial redox state using NADH and NADPH autofluorescence. Free Radic. Biol. Med. 2016, 100, 53–65. [Google Scholar] [CrossRef]
- Norwitz, N.G.; Hu, M.T.; Clarke, K. The Mechanisms by Which the Ketone Body D-beta-Hydroxybutyrate May Improve the Multiple Cellular Pathologies of Parkinson’s Disease. Front. Nutr. 2019, 6, 63. [Google Scholar] [CrossRef]
- Kops, G.J.; Dansen, T.B.; Polderman, P.E.; Saarloos, I.; Wirtz, K.W.; Coffer, P.J.; Huang, T.T.; Bos, J.L.; Medema, R.H.; Burgering, B.M. Forkhead transcription factor FOXO3a protects quiescent cells from oxidative stress. Nature 2002, 419, 316–321. [Google Scholar] [CrossRef]
- Ruttkay-Nedecky, B.; Kudr, J.; Nejdl, L.; Maskova, D.; Kizek, R.; Adam, V. G-quadruplexes as sensing probes. Molecules 2013, 18, 14760–14779. [Google Scholar] [CrossRef]
- Schoeler, N.E.; Leu, C.; Balestrini, S.; Mudge, J.M.; Steward, C.A.; Frankish, A.; Leung, M.A.; Mackay, M.; Scheffer, I.; Williams, R.; et al. Genome-wide association study: Exploring the genetic basis for responsiveness to ketogenic dietary therapies for drug-resistant epilepsy. Epilepsia 2018, 59, 1557–1566. [Google Scholar] [CrossRef]
- Cinnella, G.; Vendemiale, G.; Dambrosio, M.; Serviddio, G.; Pugliese, P.L.; Aspromonte, G.; Altomare, E. Effect of Propofol, Sevoflurane and Desflurane on systemic redox balance. Int. J. Immunopathol. Pharmacol. 2007, 20, 585–593. [Google Scholar] [CrossRef]
- Terpstra, M.; Henry, P.G.; Gruetter, R. Measurement of reduced glutathione (GSH) in human brain using LCModel analysis of difference-edited spectra. Magn. Reson. Med. 2003, 50, 19–23. [Google Scholar] [CrossRef] [PubMed]
- Sanaei Nezhad, F.; Anton, A.; Parkes, L.M.; Deakin, B.; Williams, S.R. Quantification of glutathione in the human brain by MR spectroscopy at 3 Tesla: Comparison of PRESS and MEGA-PRESS. Magn. Reson. Med. 2017, 78, 1257–1266. [Google Scholar] [CrossRef]
- Duffy, S.L.; Lagopoulos, J.; Hickie, I.B.; Diamond, K.; Graeber, M.B.; Lewis, S.J.G.; Naismith, S.L. Glutathione relates to neuropsychological functioning in mild cognitive impairment. Alzheimers Dement. 2014, 10, 67–75. [Google Scholar] [CrossRef] [PubMed]
- Lagopoulos, J.; Hermens, D.F.; Tobias-Webb, J.; Duffy, S.; Naismith, S.L.; White, D.; Scott, E.; Hickie, I.B. In vivo glutathione levels in young persons with bipolar disorder: A magnetic resonance spectroscopy study. J. Psychiatr. Res. 2013, 47, 412–417. [Google Scholar] [CrossRef] [PubMed]
- Barbagallo, G.; Morelli, M.; Quattrone, A.; Chiriaco, C.; Vaccaro, M.G.; Gulla, D.; Rocca, F.; Caracciolo, M.; Novellino, F.; Sarica, A.; et al. In vivo evidence for decreased scyllo-inositol levels in the supplementary motor area of patients with Progressive Supranuclear Palsy: A proton MR spectroscopy study. Parkinsonism Relat. Disord. 2019, 62, 185–191. [Google Scholar] [CrossRef]
- Moss, H.G.; Brown, T.R.; Wiest, D.B.; Jenkins, D.D. N-Acetylcysteine rapidly replenishes central nervous system glutathione measured via magnetic resonance spectroscopy in human neonates with hypoxic-ischemic encephalopathy. J. Cereb. Blood Flow Metab. 2018, 38, 950–958. [Google Scholar] [CrossRef]
- Morley, K.C.; Lagopoulos, J.; Logge, W.; Chitty, K.; Baillie, A.; Haber, P.S. Neurometabolite Levels in Alcohol Use Disorder Patients During Baclofen Treatment and Prediction of Relapse to Heavy Drinking. Front. Psychiatry 2018, 9, 412. [Google Scholar] [CrossRef]
- Coles, L.D.; Tuite, P.J.; Oz, G.; Mishra, U.R.; Kartha, R.V.; Sullivan, K.M.; Cloyd, J.C.; Terpstra, M. Repeated-Dose Oral N-Acetylcysteine in Parkinson’s Disease: Pharmacokinetics and Effect on Brain Glutathione and Oxidative Stress. J. Clin. Pharmacol. 2018, 58, 158–167. [Google Scholar] [CrossRef]
- Wijtenburg, S.A.; Near, J.; Korenic, S.A.; Gaston, F.E.; Chen, H.; Mikkelsen, M.; Chen, S.; Kochunov, P.; Hong, L.E.; Rowland, L.M. Comparing the reproducibility of commonly used magnetic resonance spectroscopy techniques to quantify cerebral glutathione. JMRI 2019, 49, 176–183. [Google Scholar] [CrossRef]
- Durieux, A.M.S.; Horder, J.; Mendez, M.A.; Egerton, A.; Williams, S.C.R.; Wilson, C.E.; Spain, D.; Murphy, C.; Robertson, D.; Barker, G.J.; et al. Cortical and subcortical glutathione levels in adults with autism spectrum disorder. Autism Res. Off. J. Int. Soc. Autism Res. 2016, 9, 429–435. [Google Scholar] [CrossRef]
- Shukla, D.; Mandal, P.K.; Ersland, L.; Gruner, E.R.; Tripathi, M.; Raghunathan, P.; Sharma, A.; Chaithya, G.R.; Punjabi, K.; Splaine, C. A Multi-Center Study on Human Brain Glutathione Conformation using Magnetic Resonance Spectroscopy. J. Alzheimers Dis. 2018, 66, 517–532. [Google Scholar] [CrossRef] [PubMed]
- Provencher, S.W. Automatic quantitation of localized in vivo 1H spectra with LCModel. NMR Biomed. 2001, 14, 260–264. [Google Scholar] [CrossRef] [PubMed]
Publisher’s Note: MDPI stays neutral with regard to jurisdictional claims in published maps and institutional affiliations. |
© 2020 by the authors. Licensee MDPI, Basel, Switzerland. This article is an open access article distributed under the terms and conditions of the Creative Commons Attribution (CC BY) license (http://creativecommons.org/licenses/by/4.0/).