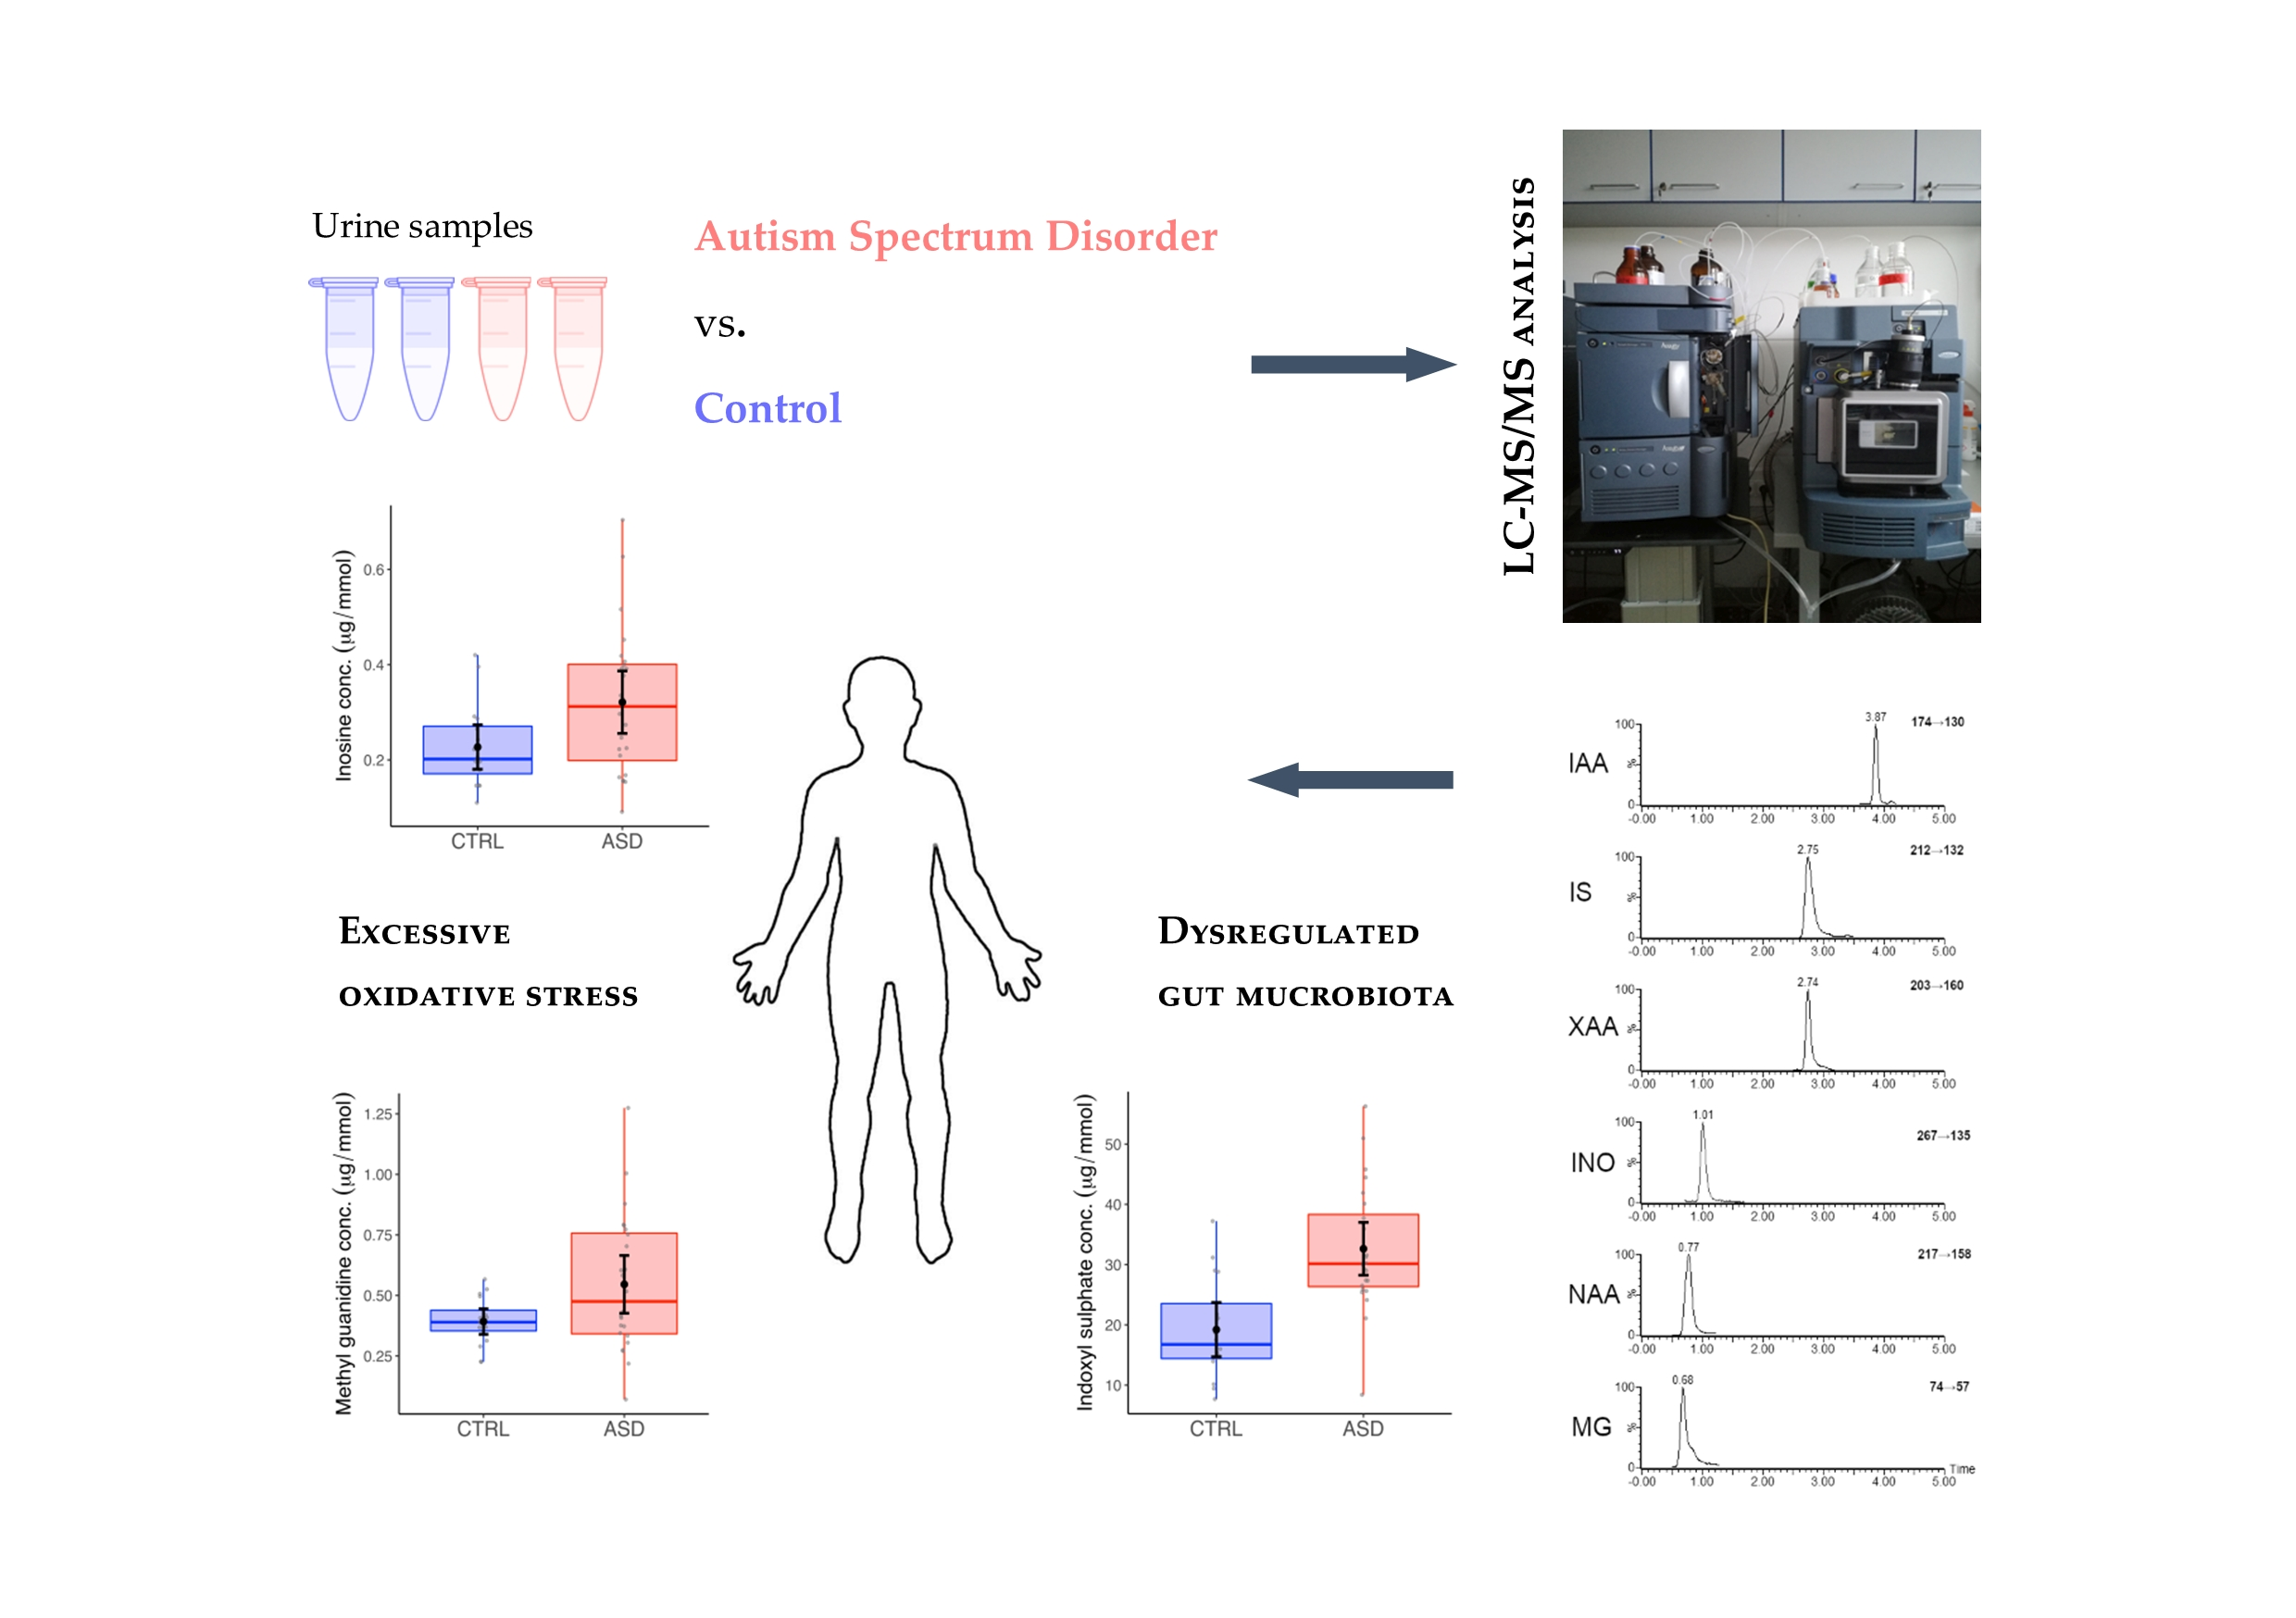
A Novel UHPLC-MS Method Targeting Urinary Metabolomic Markers for Autism Spectrum Disorder

 , ,
, ,  , and
, and 
Abstract

1. Introduction
2. Results and discussion
2.1. Method Development
2.2. Method Validation
2.3. Analysis of Urine Samples
3. Materials and Methods
3.1. Study Participants
3.2. Chemicals and Materials
3.3. Preparation of Standards
3.4. Mass Spectrometric Conditions
3.5. Chromatographic Conditions
3.6. Sample Preparation
3.7. Method Validation
3.8. Data Processing and Statistical Analysis
4. Conclusions
Supplementary Materials
Author Contributions
Funding
Conflicts of Interest
References
- Muhle, R.A.; Reed, H.E.; Stratigos, K.A.; Veenstra-VanderWeele, J. The Emerging Clinical Neuroscience of Autism Spectrum Disorder. JAMA Psychiatry 2018, 75, 514–523. [Google Scholar] [CrossRef] [PubMed]
- Fakhoury, M. Autistic spectrum disorders: A review of clinical features, theories and diagnosis. Int. J. Dev. Neurosci. 2015, 43, 70–77. [Google Scholar] [CrossRef] [PubMed]
- Fombonne, E. Epidemiological controversies in autism. Swiss. Arch. Neurol. Psychiatry Psychother. 2020, 171, 3–5. [Google Scholar] [CrossRef]
- Perryman, T.; Watson, L.R.; Chumney, F. Predictors of the age of autism spectrum disorder diagnosis: A North Carolina Cohort. Autism Dev. Lang. Impair. 2018, 3, 1–10. [Google Scholar] [CrossRef]
- Shen, L.-M.; Liu, X.; Zhang, H.; Lin, J.; Feng, C.; Iqbal, J. Biomarkers in autism spectrum disorders: Current progress. Clin. Chim. Acta 2020, 502, 41–54. [Google Scholar] [CrossRef]
- Want, E.J.; Wilson, I.D.; Gika, H.G.; Theodoridis, G.; Plumb, R.S.; Shockcor, J.P.; Holmes, E.; Nicholson, J.K. Global metabolic profiling procedures for urine using UPLC–MS. Nat. Protoc. 2010, 5, 1005–1018. [Google Scholar] [CrossRef]
- Ruggeri, B.; Sarkans, U.; Schumann, G.; Persico, A.M. Biomarkers in autism spectrum disorder: The old and the new. Psychopharmacology 2014, 231, 1201–1216. [Google Scholar] [CrossRef]
- Yan, M.; Xu, G. Current and future perspectives of functional metabolomics in disease studies–A review. Anal. Chim. Acta 2018, 1037, 41–54. [Google Scholar] [CrossRef]
- Diémé, B.; Mavel, S.; Blasco, H.; Tripi, G.; Bonnet-Brilhault, F.; Malvy, J.; Bocca, C.; Andres, C.R.; Nadal-Desbarats, L.; Emond, P. Metabolomics Study of Urine in Autism Spectrum Disorders Using a Multiplatform Analytical Methodology. J. Proteome Res. 2015, 14, 5273–5282. [Google Scholar] [CrossRef]
- Frye, R.E.; Slattery, J. The potential role of nitrous oxide in the etiology of autism spectrum disorder. Transl. Psychiatry 2016, 6, e812. [Google Scholar] [CrossRef]
- Yap, I.K.S.; Angley, M.; Veselkov, K.A.; Holmes, E.; Lindon, J.C.; Nicholson, J.K. Urinary Metabolic Phenotyping Differentiates Children with Autism from Their Unaffected Siblings and Age-Matched Controls. J. Proteome Res. 2010, 9, 2996–3004. [Google Scholar] [CrossRef] [PubMed]
- Ming, X.; Stein, T.P.; Barnes, V.; Rhodes, N.; Guo, L. Metabolic Perturbance in Autism Spectrum Disorders: A Metabolomics Study. J. Proteome Res. 2012, 11, 5856–5862. [Google Scholar] [CrossRef] [PubMed]
- Emond, P.; Mavel, S.; Aïdoud, N.; Nadal-Desbarats, L.; Montigny, F.; Bonnet-Brilhault, F.; Barthélémy, C.; Merten, M.; Sarda, P.; Laumonnier, F.; et al. GC-MS-based urine metabolic profiling of autism spectrum disorders. Anal. Bioanal. Chem. 2013, 405, 5291–5300. [Google Scholar] [CrossRef] [PubMed]
- Gevi, F.; Zolla, L.; Gabriele, S.; Persico, A.M. Urinary metabolomics of young Italian autistic children supports abnormal tryptophan and purine metabolism. Mol. Autism 2016, 7, 1–11. [Google Scholar] [CrossRef]
- Bitar, T.; Mavel, S.; Emond, P.; Nadal-Desbarats, L.; Lefèvre, A.; Mattar, H.; Soufia, M.; Blasco, H.; Vourc’H, P.; Hleihel, W.; et al. Identification of metabolic pathway disturbances using multimodal metabolomics in autistic disorders in a Middle Eastern population. J. Pharm. Biomed. Anal. 2018, 152, 57–65. [Google Scholar] [CrossRef]
- Xiong, X.; Liu, D.; He, W.; Sheng, X.; Zhou, W.; Xie, N.; Liang, H.; Zeng, T.; Li, T.; Wang, Y. Identification of gender-related metabolic disturbances in autism spectrum disorders using urinary metabolomics. Int. J. Biochem. Cell Biol. 2019, 115, 105594. [Google Scholar] [CrossRef]
- Tachikawa, M.; Hosoya, K.-I. Transport characteristics of guanidino compounds at the blood-brain barrier and blood-cerebrospinal fluid barrier: Relevance to neural disorders. Fluids Barriers CNS 2011, 8, 13. [Google Scholar] [CrossRef]
- Yao, J.K.; Dougherty, G.G., Jr.; Reddy, R.D.; Keshavan, M.S.; Montrose, D.M.; Matson, W.R.; McEvoy, J.; Kaddurah-Daouk, R. Homeostatic Imbalance of Purine Catabolism in First-Episode Neuroleptic-Naïve Patients with Schizophrenia. PLoS ONE 2010, 5, e9508. [Google Scholar] [CrossRef]
- Damodaran, L.P.M.; Arumugam, G. Urinary oxidative stress markers in children with autism. Redox Rep. 2011, 16, 216–222. [Google Scholar] [CrossRef]
- Bent, S.; Lawton, B.; Warren, T.; Widjaja, F.; Dang, K.; Fahey, J.W.; Cornblatt, B.; Kinchen, J.M.; Delucchi, K.; Hendren, R.L. Identification of urinary metabolites that correlate with clinical improvements in children with autism treated with sulforaphane from broccoli. Mol. Autism 2018, 9, 35. [Google Scholar] [CrossRef]
- Anderson, G.M. Autism Biomarkers: Challenges, Pitfalls and Possibilities. J. Autism Dev. Disord. 2015, 45, 1103–1113. [Google Scholar] [CrossRef]
- Ghanizadeh, A.; Akhondzadeh, S.; Hormozi, M.; Makarem, A.; Abotorabi-Zarchi, M.; Firoozabadi, A. Glutathione-Related Factors and Oxidative Stress in Autism, A Review. Curr. Med. Chem. 2012, 19, 4000–4005. [Google Scholar] [CrossRef] [PubMed]
- Chauhan, A.; Chauhan, V. Oxidative stress in autism. Pathophysiology 2006, 13, 171–181. [Google Scholar] [CrossRef]
- Bjørklund, G.; Meguid, N.A.; El-Bana, M.A.; Tinkov, A.A.; Saad, K.; Dadar, M.; Hemimi, M.; Skalny, A.V.; Hosnedlová, B.; Kizek, R.; et al. Oxidative Stress in Autism Spectrum Disorder. Mol. Neurobiol. 2020, 57, 2314–2332. [Google Scholar] [CrossRef]
- McElhanon, B.O.; McCracken, C.; Karpen, S.; Sharp, W.G. Gastrointestinal Symptoms in Autism Spectrum Disorder: A Meta-analysis. Pediatrics 2014, 133, 872–883. [Google Scholar] [CrossRef]
- Felice, V.D.; O’Mahony, S.M. The microbiome and disorders of the central nervous system. Pharmacol. Biochem. Behav. 2017, 160, 1–13. [Google Scholar] [CrossRef]
- Li, Q.; Zhou, J.-M. The microbiota–gut–brain axis and its potential therapeutic role in autism spectrum disorder. Neurosciences 2016, 324, 131–139. [Google Scholar] [CrossRef]
- Strati, F.; Cavalieri, D.; Albanese, D.; De Felice, C.; Donati, C.; Hayek, J.; Jousson, O.; Leoncini, S.; Renzi, D.; Calabrò, A.; et al. New evidences on the altered gut microbiota in autism spectrum disorders. Microbiome 2017, 5, 1–11. [Google Scholar] [CrossRef]
- Watanabe, K.; Watanabe, T.; Nakayama, M. Cerebro-renal interactions: Impact of uremic toxins on cognitive function. NeuroToxicology 2014, 44, 184–193. [Google Scholar] [CrossRef] [PubMed]
- Lord, C.; Risi, S.; Lambrecht, L.; Cook, E.H., Jr.; Leventhal, B.; DiLavore, P.C.; Pickles, A.; Rutter, M. The Autism Diagnostic Observation Schedule—Generic: A Standard Measure of Social and Communication Deficits Associated with the Spectrum of Autism. J. Autism Dev. Disord. 2000, 30, 205–223. [Google Scholar] [CrossRef]
- Lord, C.; Rutter, M.; Le Couteur, A. Autism Diagnostic Interview-Revised: A revised version of a diagnostic interview for caregivers of individuals with possible pervasive developmental disorders. J. Autism Dev. Disord. 1994, 24, 659–685. [Google Scholar] [CrossRef] [PubMed]
- R Core Team. A Language and Environment for Statistical Computing; R Foundation for Statistical Computing: Vienna, Austria, 2020. [Google Scholar]
- Wilcox, R. Introduction to Robust Estimation and Hypothesis Testin, 3rd ed.; Academic Press: Cambridge, MA, USA, 2011; ISBN 9780123870155. [Google Scholar]
- Welch, B.L. The generalization of ‘student’s’ problem when several different population varlances are involved. Biometrics 1947, 34, 28–35. [Google Scholar] [CrossRef] [PubMed]


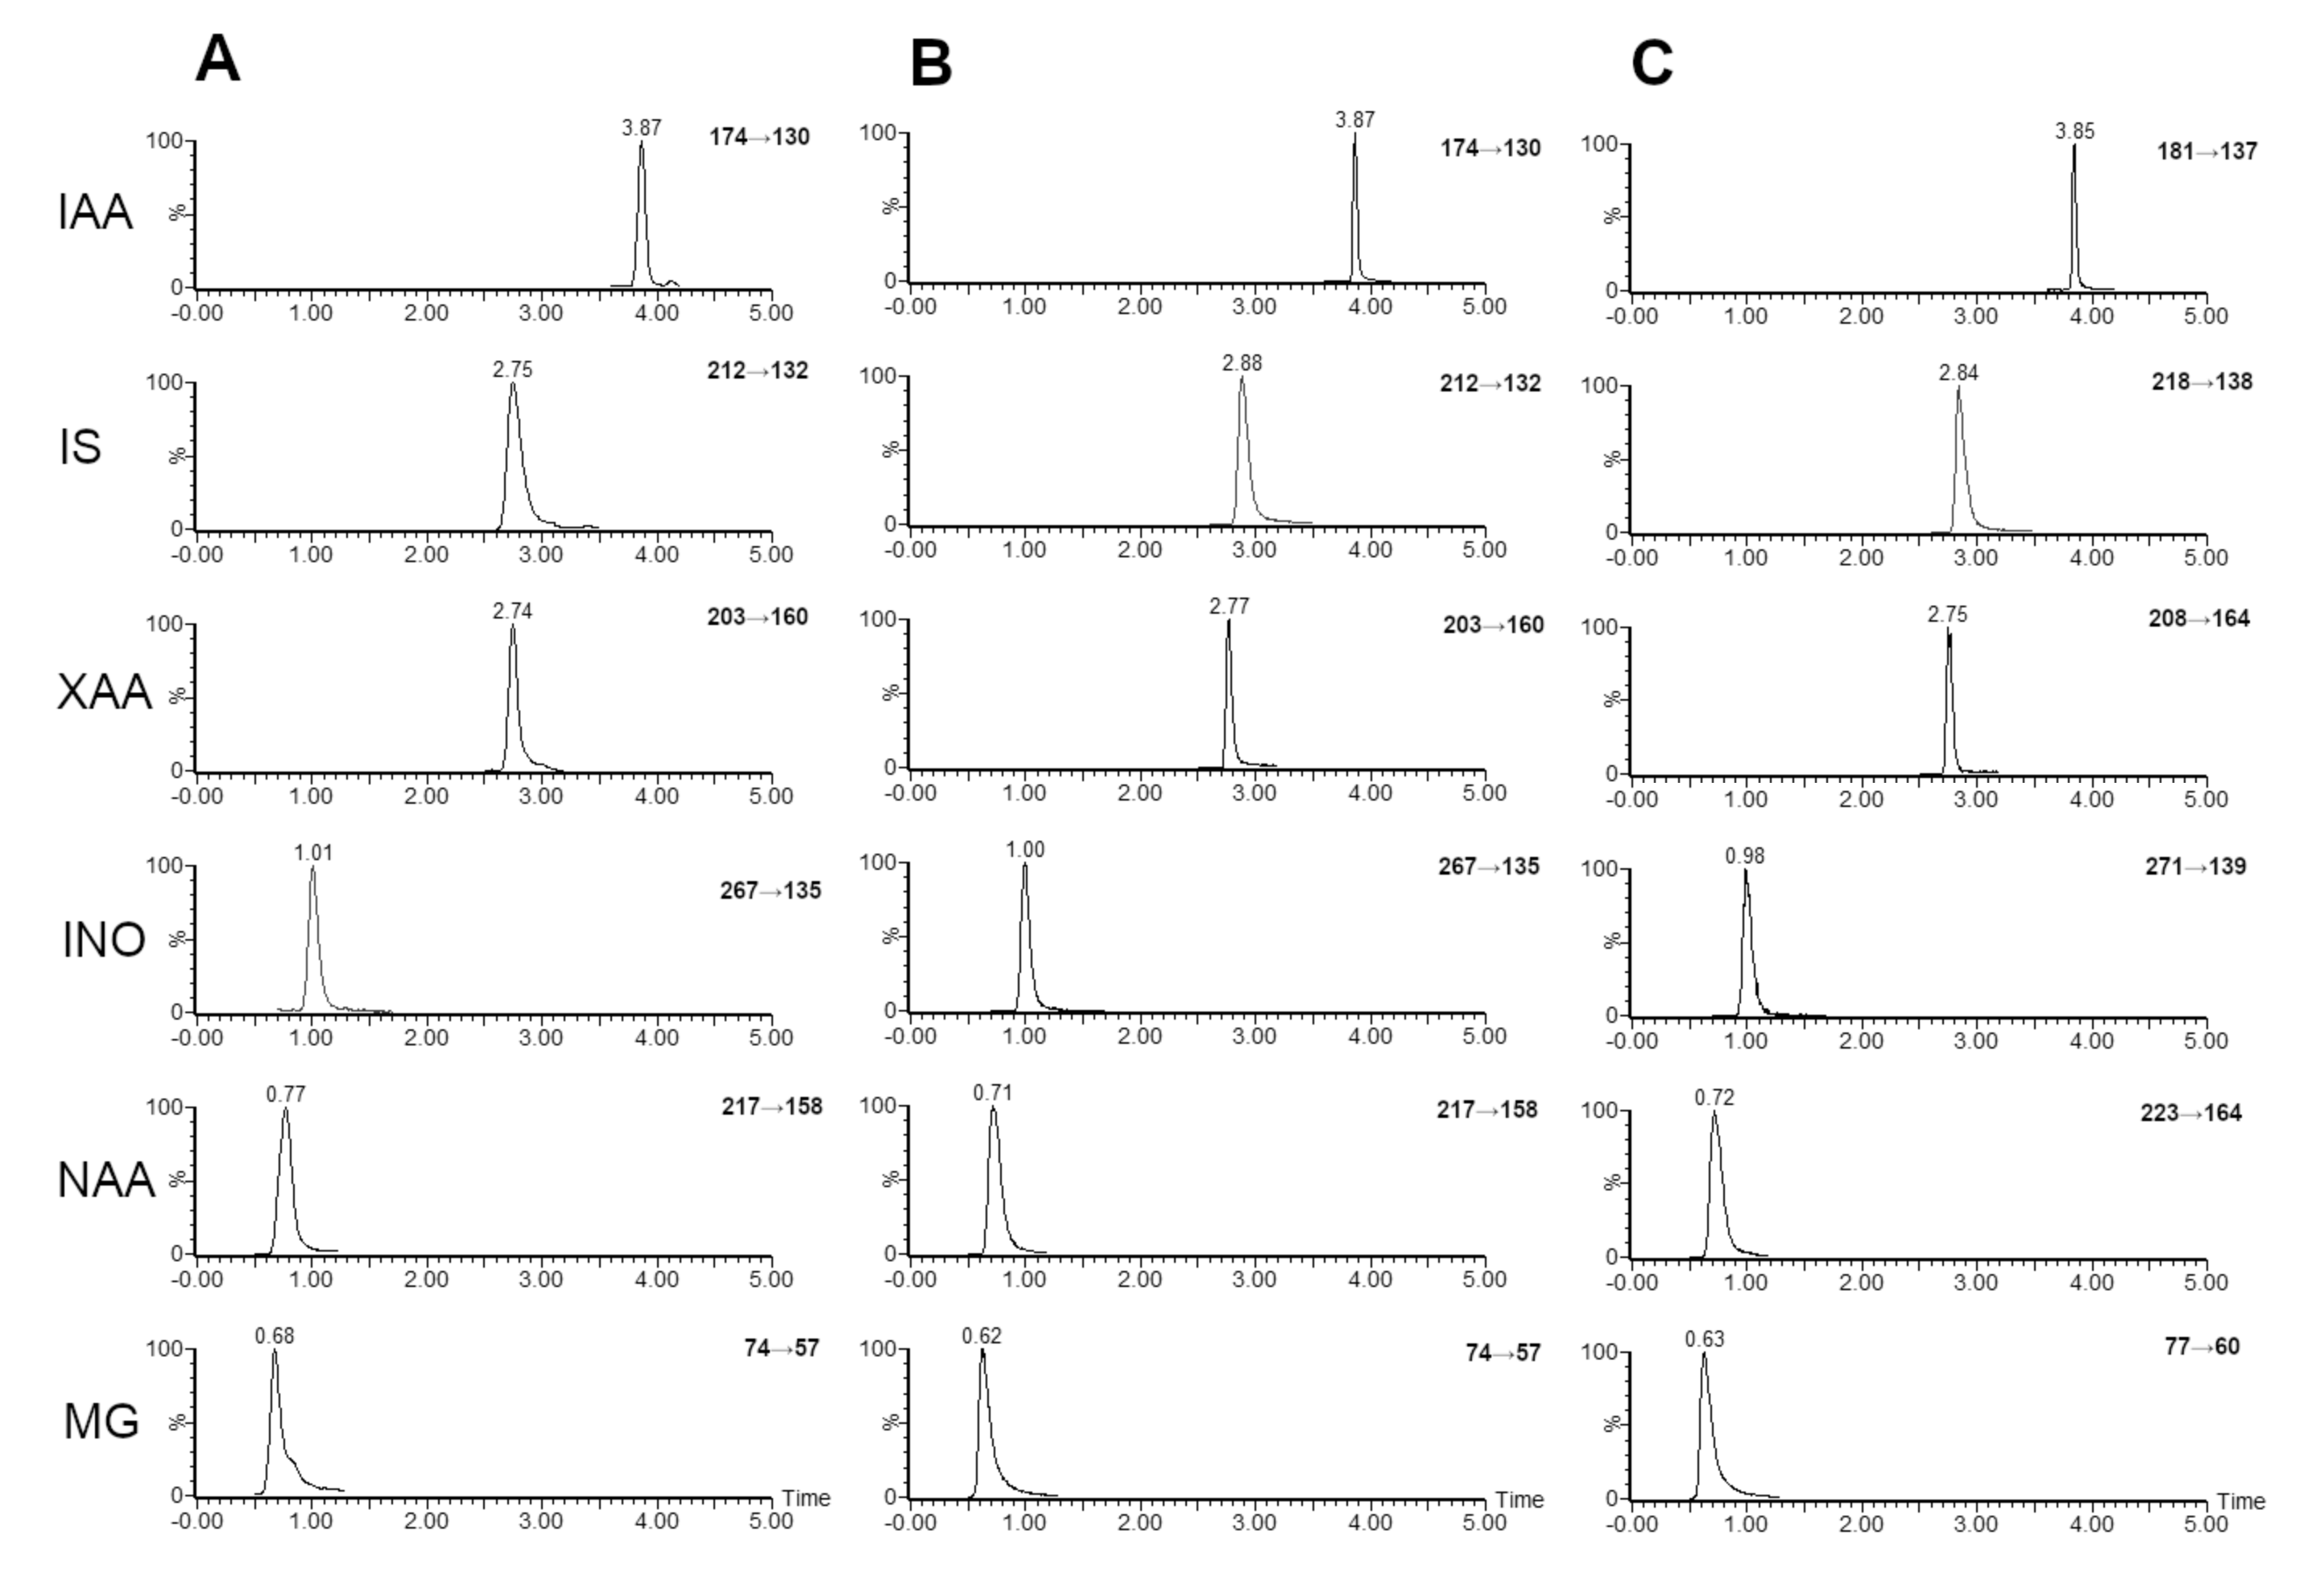
| Compound Name | Ion Mode | Parent Ion (m/z) | Daughter Ion (m/z) | Cone Voltage (V) | Collision Energy (eV) |
|---|---|---|---|---|---|
| Methylguanidine | + | 74.15 | 57.11 | 20 | 10 |
| Methylguanidine-D3 | + | 76.90 | 60.10 | 25 | 15 |
| N-acetylarginine | + | 217.05 | 158.02 | 30 | 20 |
| N-acetylarginine-D7 | + | 223.14 | 164.02 | 30 | 20 |
| Inosine | - | 267.10 | 135.00 | 40 | 20 |
| Inosine-N4 | - | 270.93 | 138.91 | 40 | 25 |
| Xanthurenic Acid | - | 203.79 | 160.03 | 25 | 20 |
| Xanthurenic Acid-D4 | - | 207.93 | 163.84 | 25 | 20 |
| Indoxyl sulphate | - | 212.00 | 132.02 | 30 | 20 |
| Indoxyl sulphate-C6 | - | 217.85 | 137.99 | 30 | 25 |
| Indole-3-acetic acid | - | 174.04 | 130.16 | 20 | 10 |
| Indole-3-acetic acid-D7 | - | 180.98 | 137.00 | 20 | 10 |
| Analyte | Retention Time (min) | R2 | Regression Equation | Linear Range a | LOQ a | LOD a |
|---|---|---|---|---|---|---|
| Methylguanidine | 0.63 | 0.99958 | y = 0.000168985x − 0.000447236 | 40–8000 | 40 | 11.0 |
| N-acetylarginine | 0.71 | 0.99982 | y = 0.000639819x + 0.000866957 | 160–16,000 | 160 | 12.0 |
| Inosine | 1.00 | 0.99980 | y = 0.00170719x + 0.000559034 | 12–2400 | 12 | 1.1 |
| Xanthurenic acid | 2.76 | 0.99879 | y = 0.00182916x + 0.00182916 | 12–2400 | 12 | 1.5 |
| Indoxyl sulphate | 2.92 | 0.99977 | y = 0.000522458x + 0.00146806 | 480–48,000 | 480 | 15.8 |
| Indole-3-acetic acid | 3.87 | 0.99990 | y = 0.00157307x + 0.00153278 | 20–4000 | 20 | 1.9 |
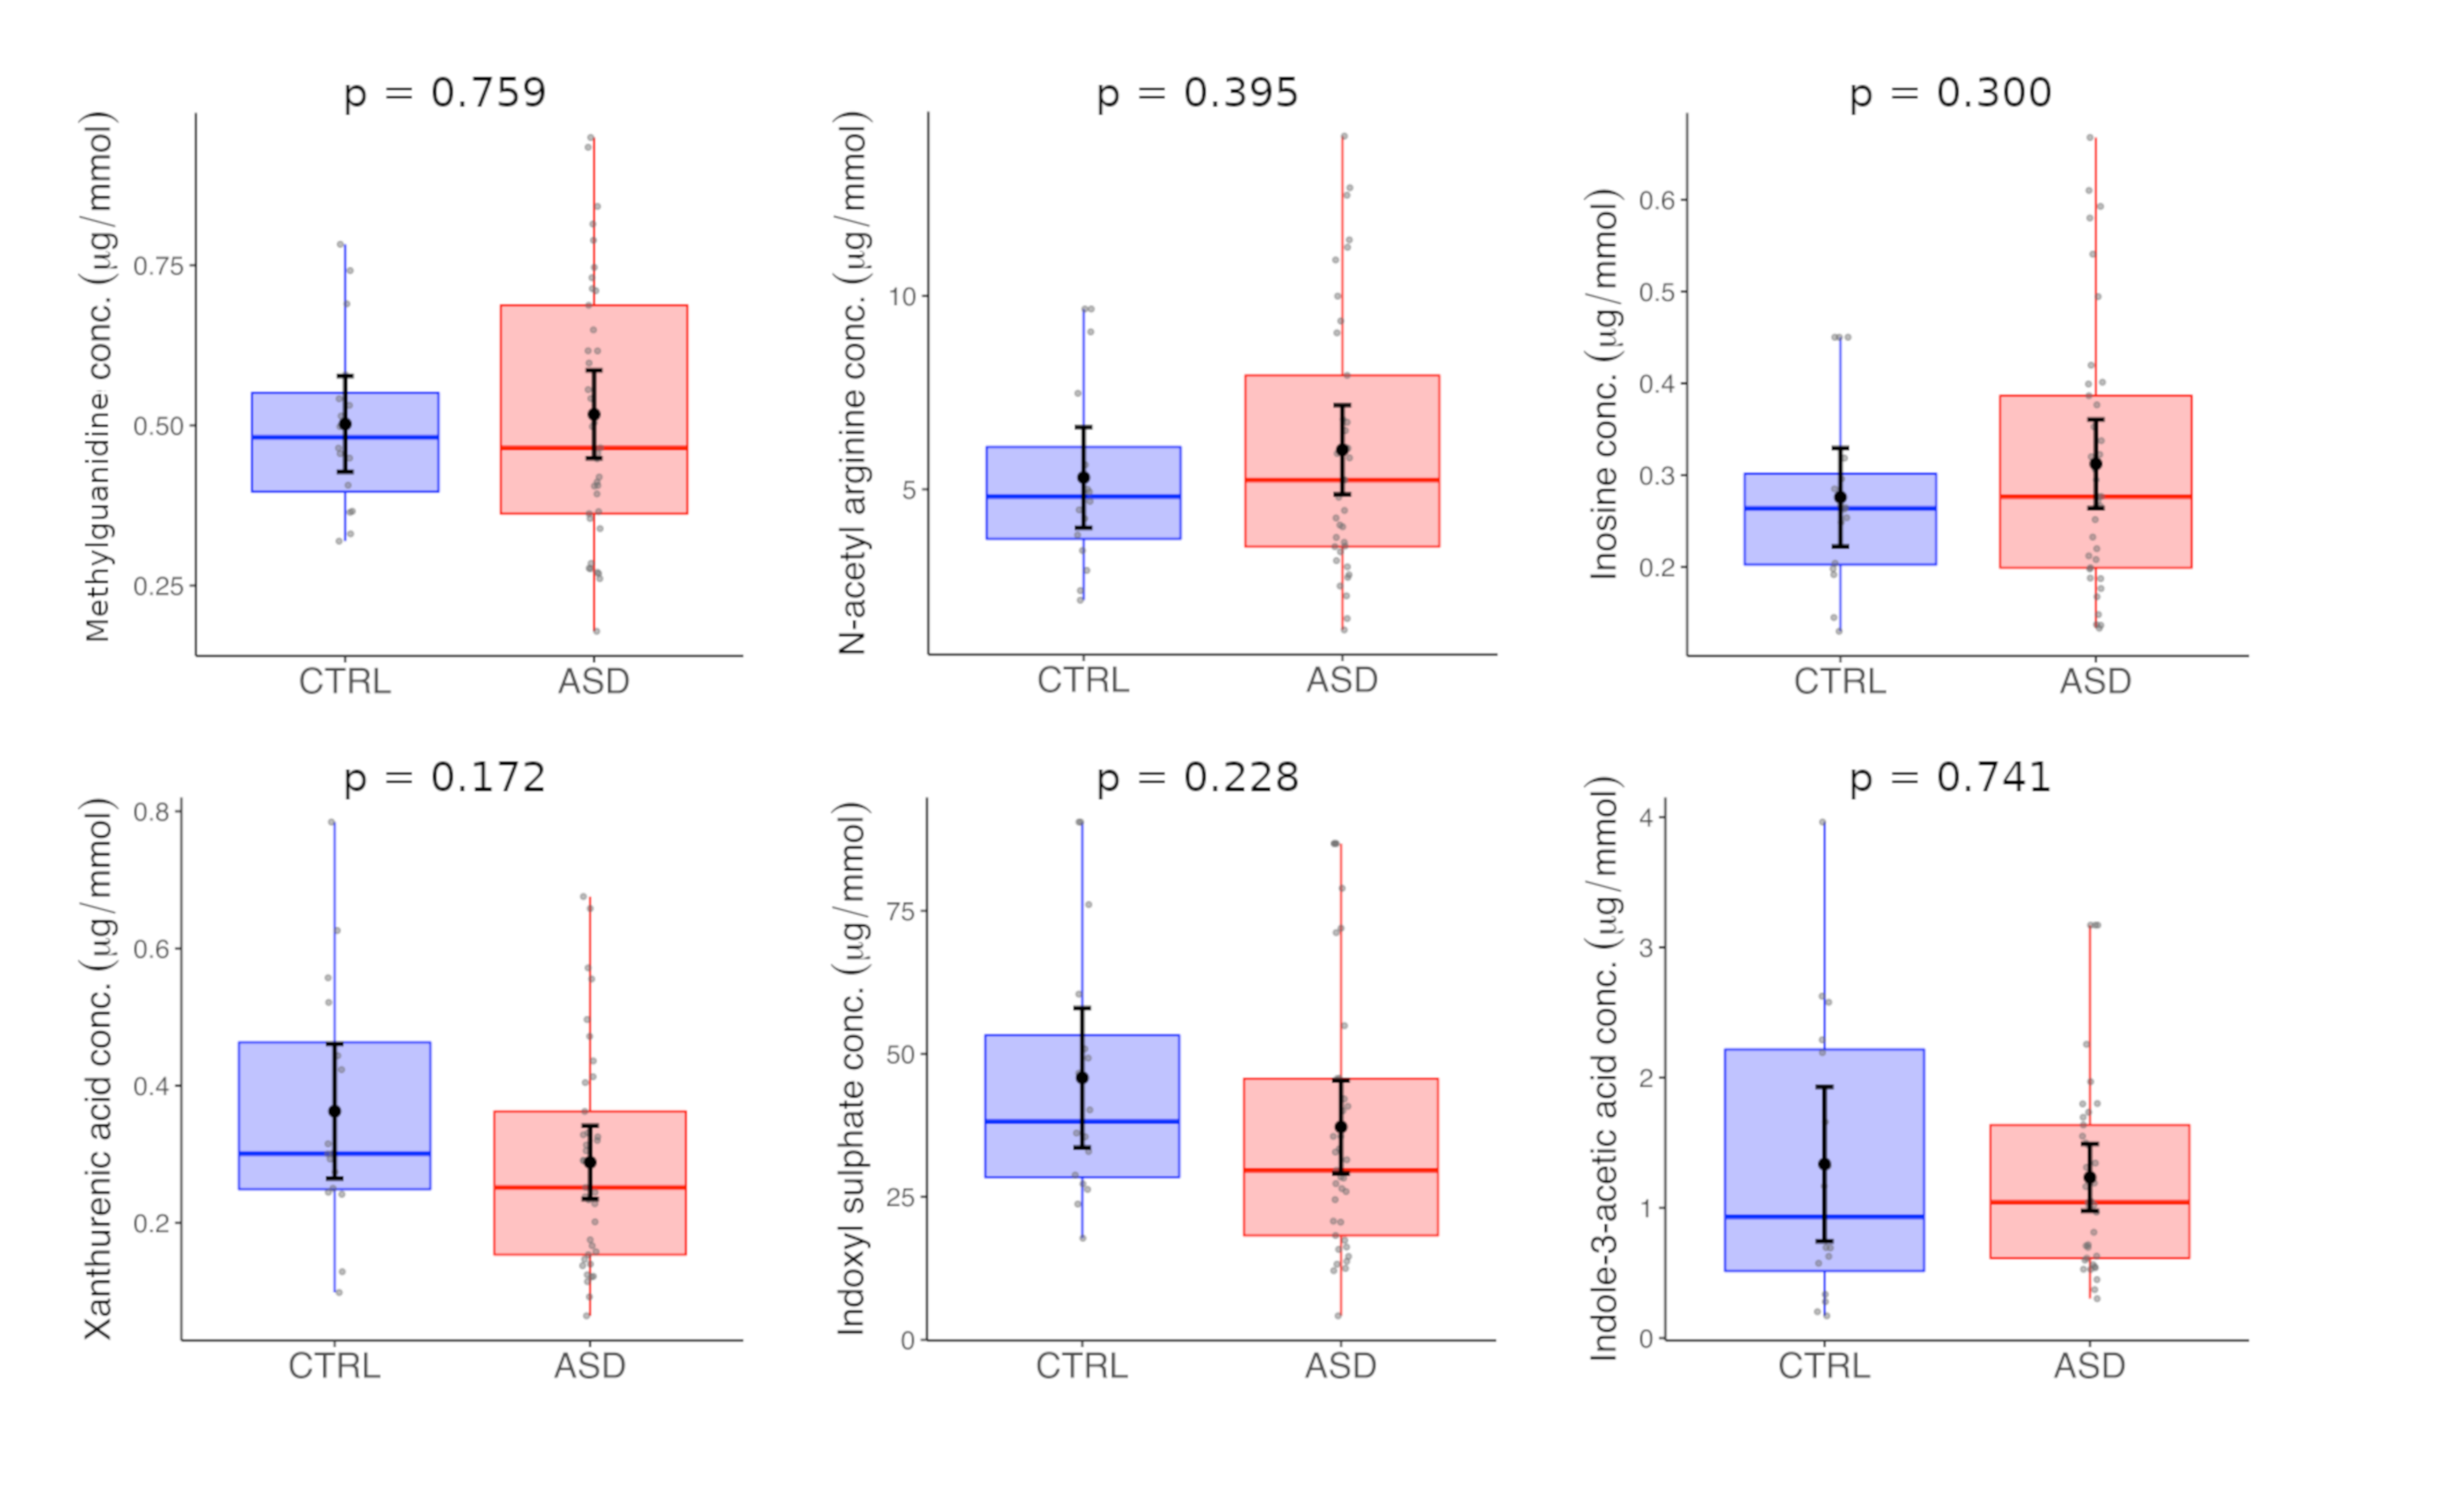
| <6 Years | CTRL | ASD | |||||
| Mean a | SD | Median a | Mean a | SD | Median a | p-val | |
| Methylguanidine | 0.50 | 0.14 | 0.48 | 0.52 | 0.21 | 0.46 | 0.759 |
| N-acetyl arginine | 5.31 | 2.44 | 4.81 | 6.02 | 3.45 | 5.24 | 0.395 |
| Indole-3-acetic acid | 1.34 | 1.11 | 0.93 | 1.23 | 0.77 | 1.04 | 0.741 |
| Indoxyl sulphate | 45.81 | 22.89 | 38.18 | 37.22 | 24.38 | 29.62 | 0.228 |
| Xanthurenic acid | 0.36 | 0.18 | 0.30 | 0.29 | 0.16 | 0.25 | 0.172 |
| Inosine | 0.28 | 0.10 | 0.26 | 0.31 | 0.14 | 0.28 | 0.300 |
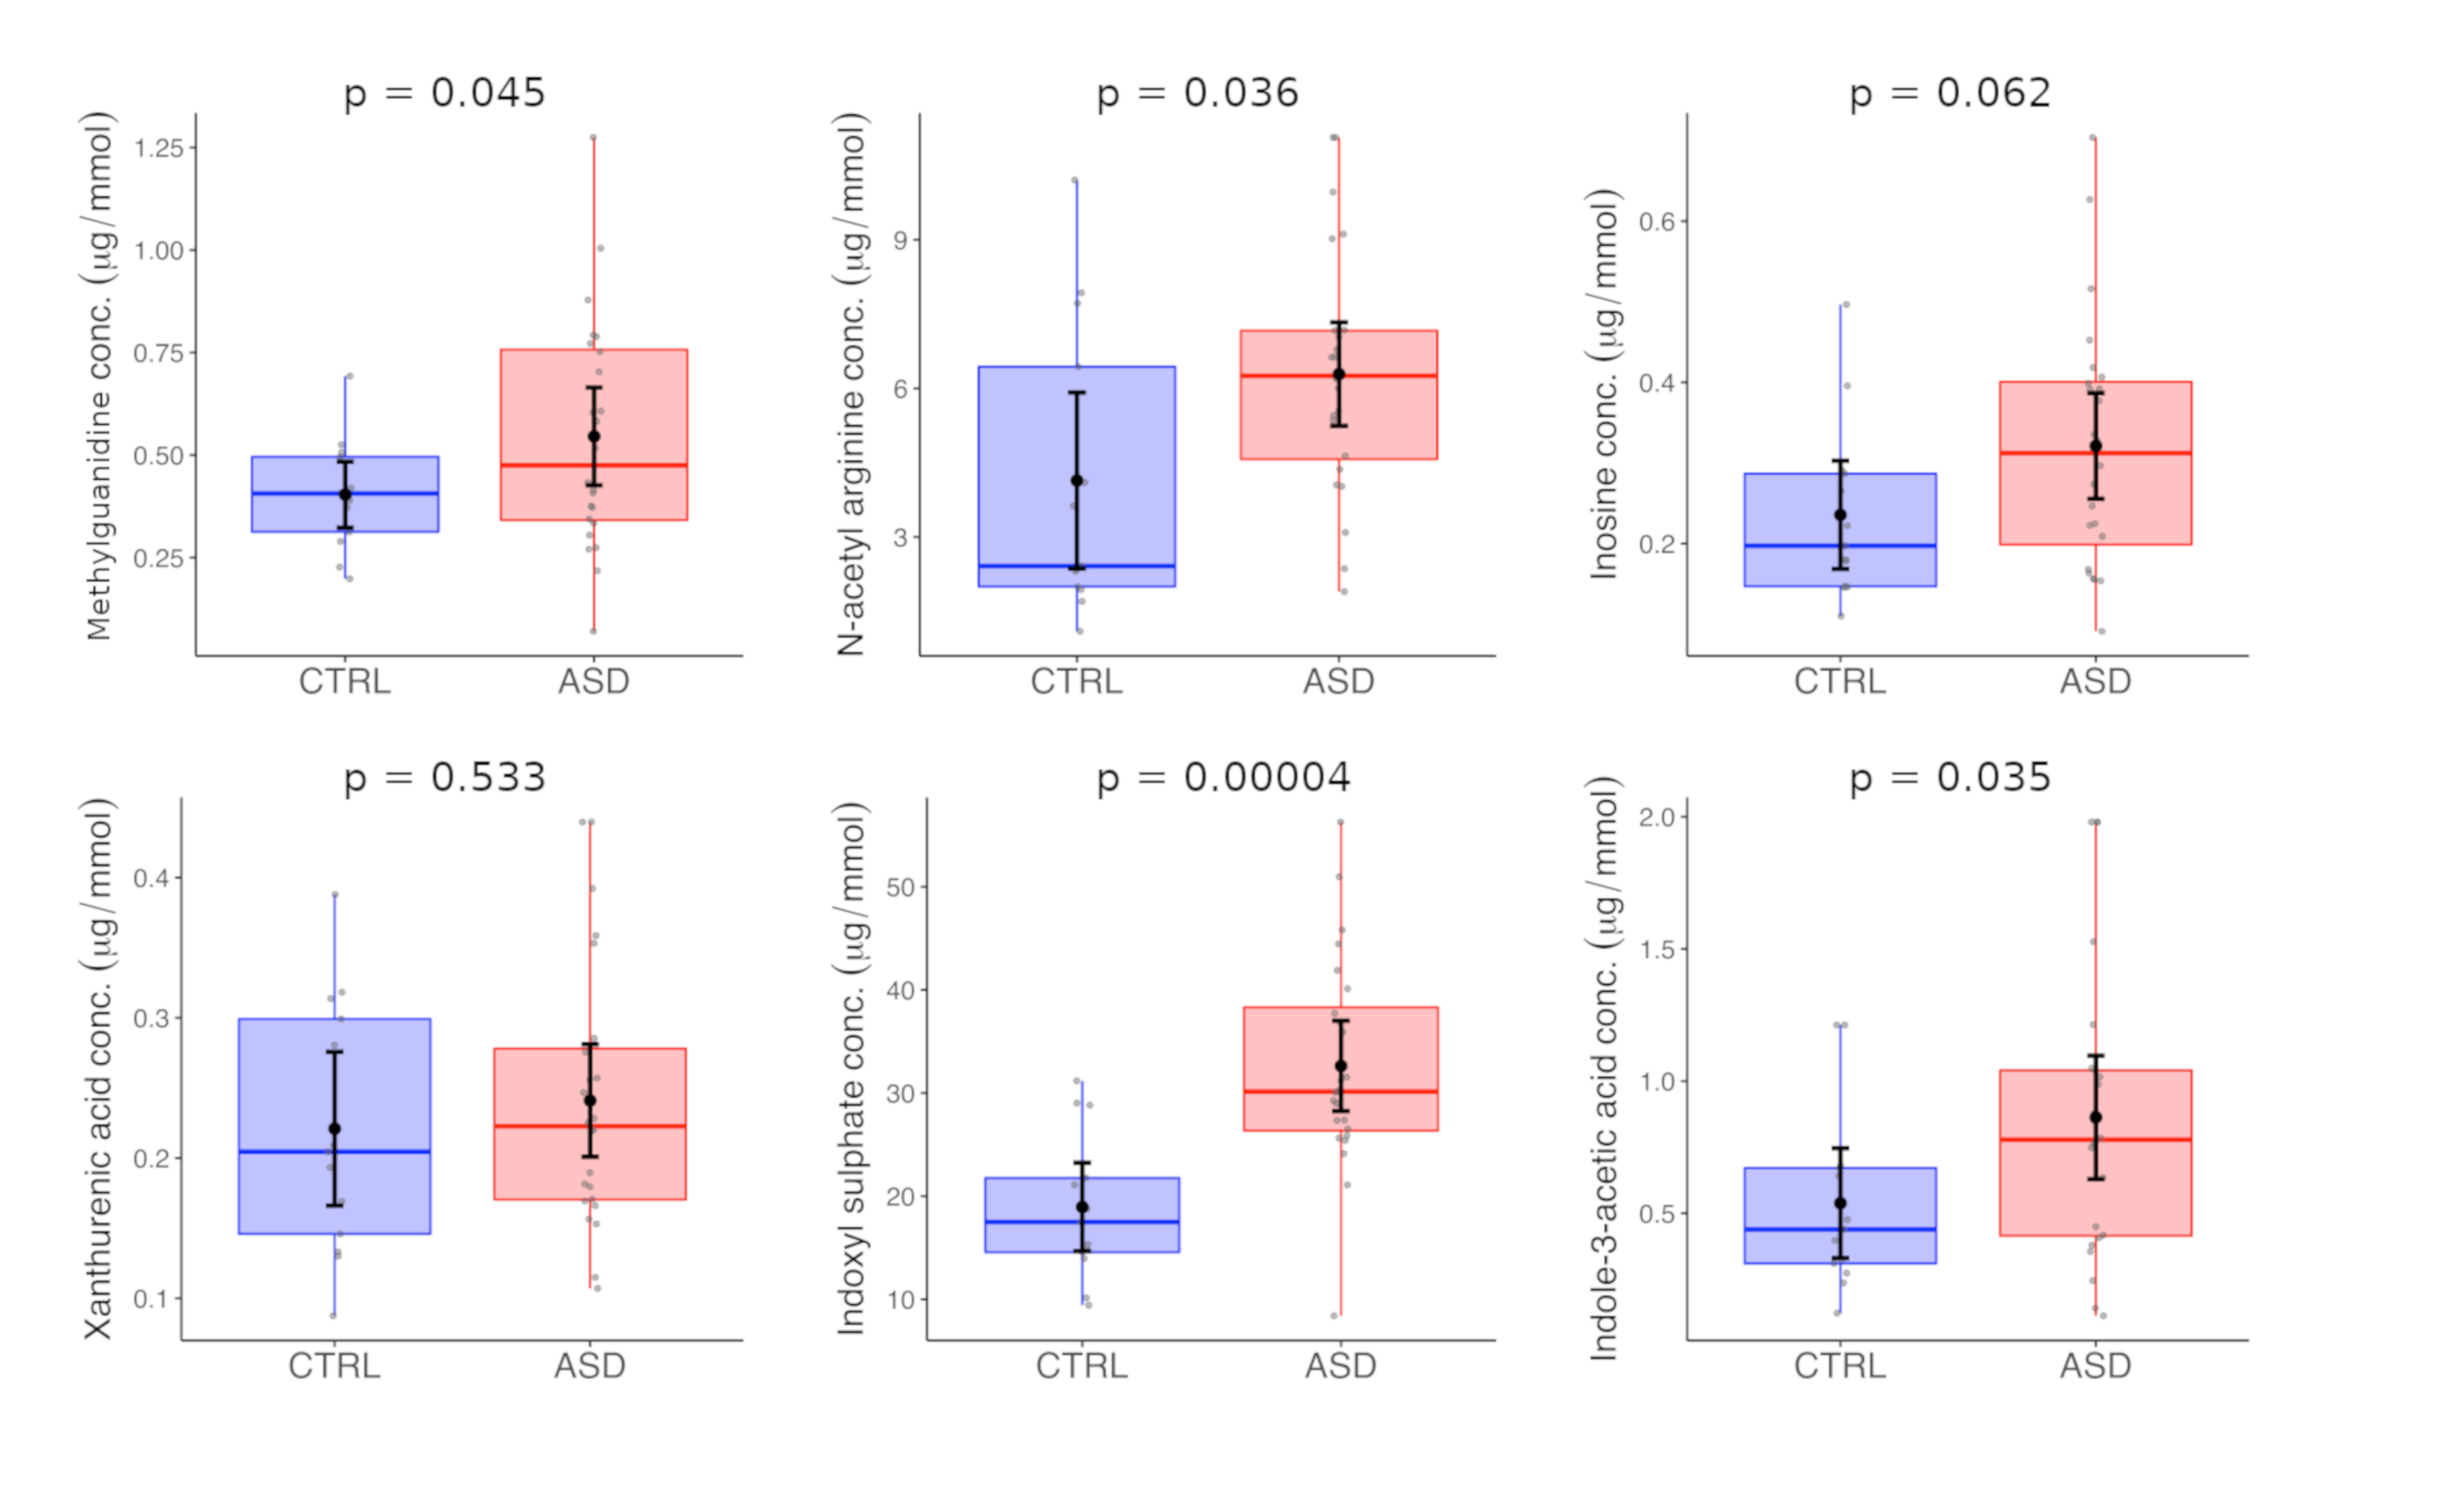
| ≥6 Years | CTRL | ASD | |||||
| Mean a | SD | Median a | Mean a | SD | Median a | p-val | |
| Methylguanidine | 0.40 | 0.13 | 0.41 | 0.55 | 0.28 | 0.47 | 0.045 |
| N-acetyl arginine | 4.14 | 2.94 | 2.41 | 6.29 | 2.48 | 6.25 | 0.036 |
| Indole-3-acetic acid | 0.54 | 0.34 | 0.44 | 0.86 | 0.55 | 0.78 | 0.035 |
| Indoxyl sulphate | 18.95 | 7.11 | 17.49 | 32.63 | 10.38 | 30.15 | 0.00004 |
| Xanthurenic acid | 0.22 | 0.09 | 0.20 | 0.24 | 0.10 | 0.22 | 0.533 |
| Inosine | 0.24 | 0.11 | 0.20 | 0.32 | 0.16 | 0.31 | 0.062 |
Publisher’s Note: MDPI stays neutral with regard to jurisdictional claims in published maps and institutional affiliations. |
© 2020 by the authors. Licensee MDPI, Basel, Switzerland. This article is an open access article distributed under the terms and conditions of the Creative Commons Attribution (CC BY) license (http://creativecommons.org/licenses/by/4.0/).
Share and Cite
Olesova, D.; Galba, J.; Piestansky, J.; Celusakova, H.; Repiska, G.; Babinska, K.; Ostatnikova, D.; Katina, S.; Kovac, A. A Novel UHPLC-MS Method Targeting Urinary Metabolomic Markers for Autism Spectrum Disorder. Metabolites 2020, 10, 443. https://doi.org/10.3390/metabo10110443
Olesova D, Galba J, Piestansky J, Celusakova H, Repiska G, Babinska K, Ostatnikova D, Katina S, Kovac A. A Novel UHPLC-MS Method Targeting Urinary Metabolomic Markers for Autism Spectrum Disorder. Metabolites. 2020; 10(11):443. https://doi.org/10.3390/metabo10110443
Chicago/Turabian StyleOlesova, Dominika, Jaroslav Galba, Juraj Piestansky, Hana Celusakova, Gabriela Repiska, Katarina Babinska, Daniela Ostatnikova, Stanislav Katina, and Andrej Kovac. 2020. "A Novel UHPLC-MS Method Targeting Urinary Metabolomic Markers for Autism Spectrum Disorder" Metabolites 10, no. 11: 443. https://doi.org/10.3390/metabo10110443
APA StyleOlesova, D., Galba, J., Piestansky, J., Celusakova, H., Repiska, G., Babinska, K., Ostatnikova, D., Katina, S., & Kovac, A. (2020). A Novel UHPLC-MS Method Targeting Urinary Metabolomic Markers for Autism Spectrum Disorder. Metabolites, 10(11), 443. https://doi.org/10.3390/metabo10110443