Effects of Probiotics Administration on Human Metabolic Phenotype


 ,
,  , ,
, ,  ,
,  , ,
, ,  , ,
, , 
Abstract
1. Introduction
2. Results
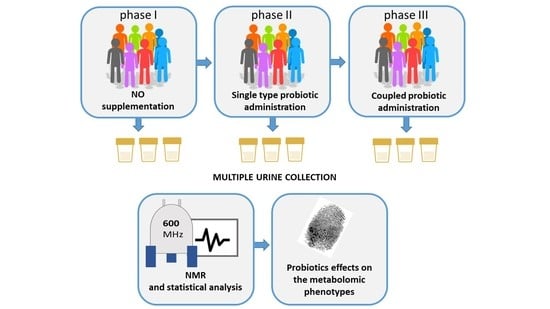
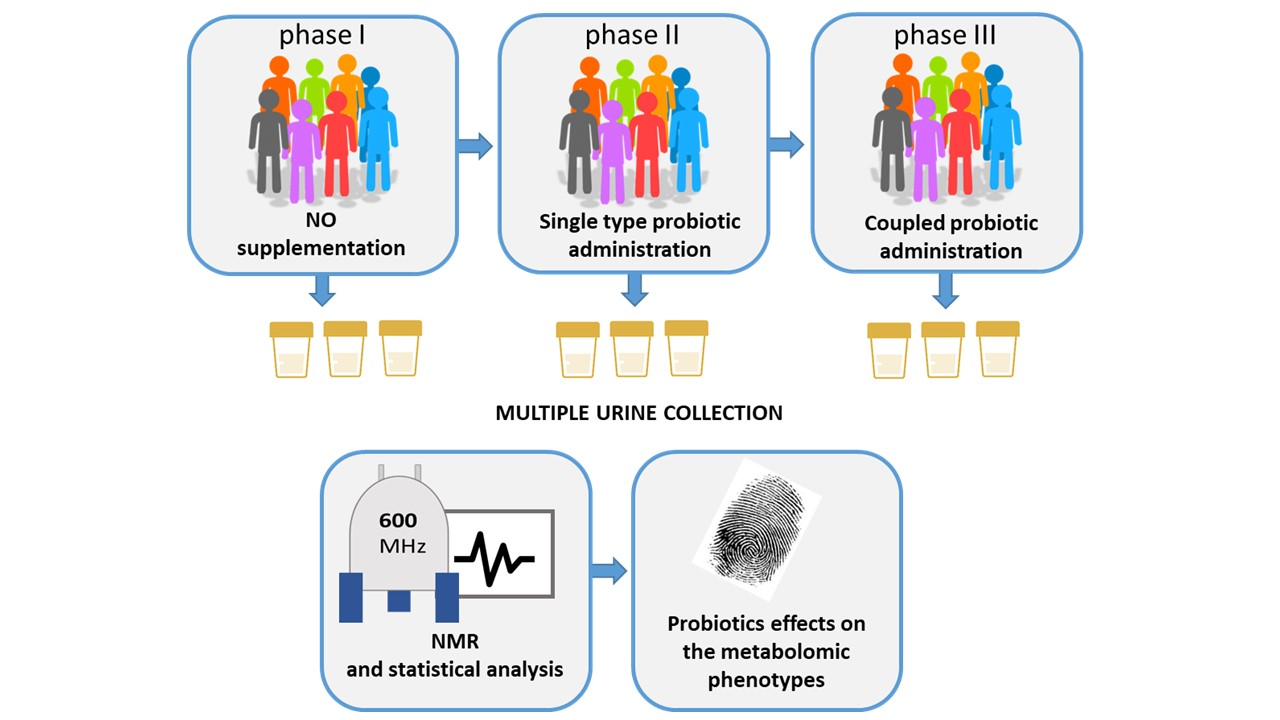
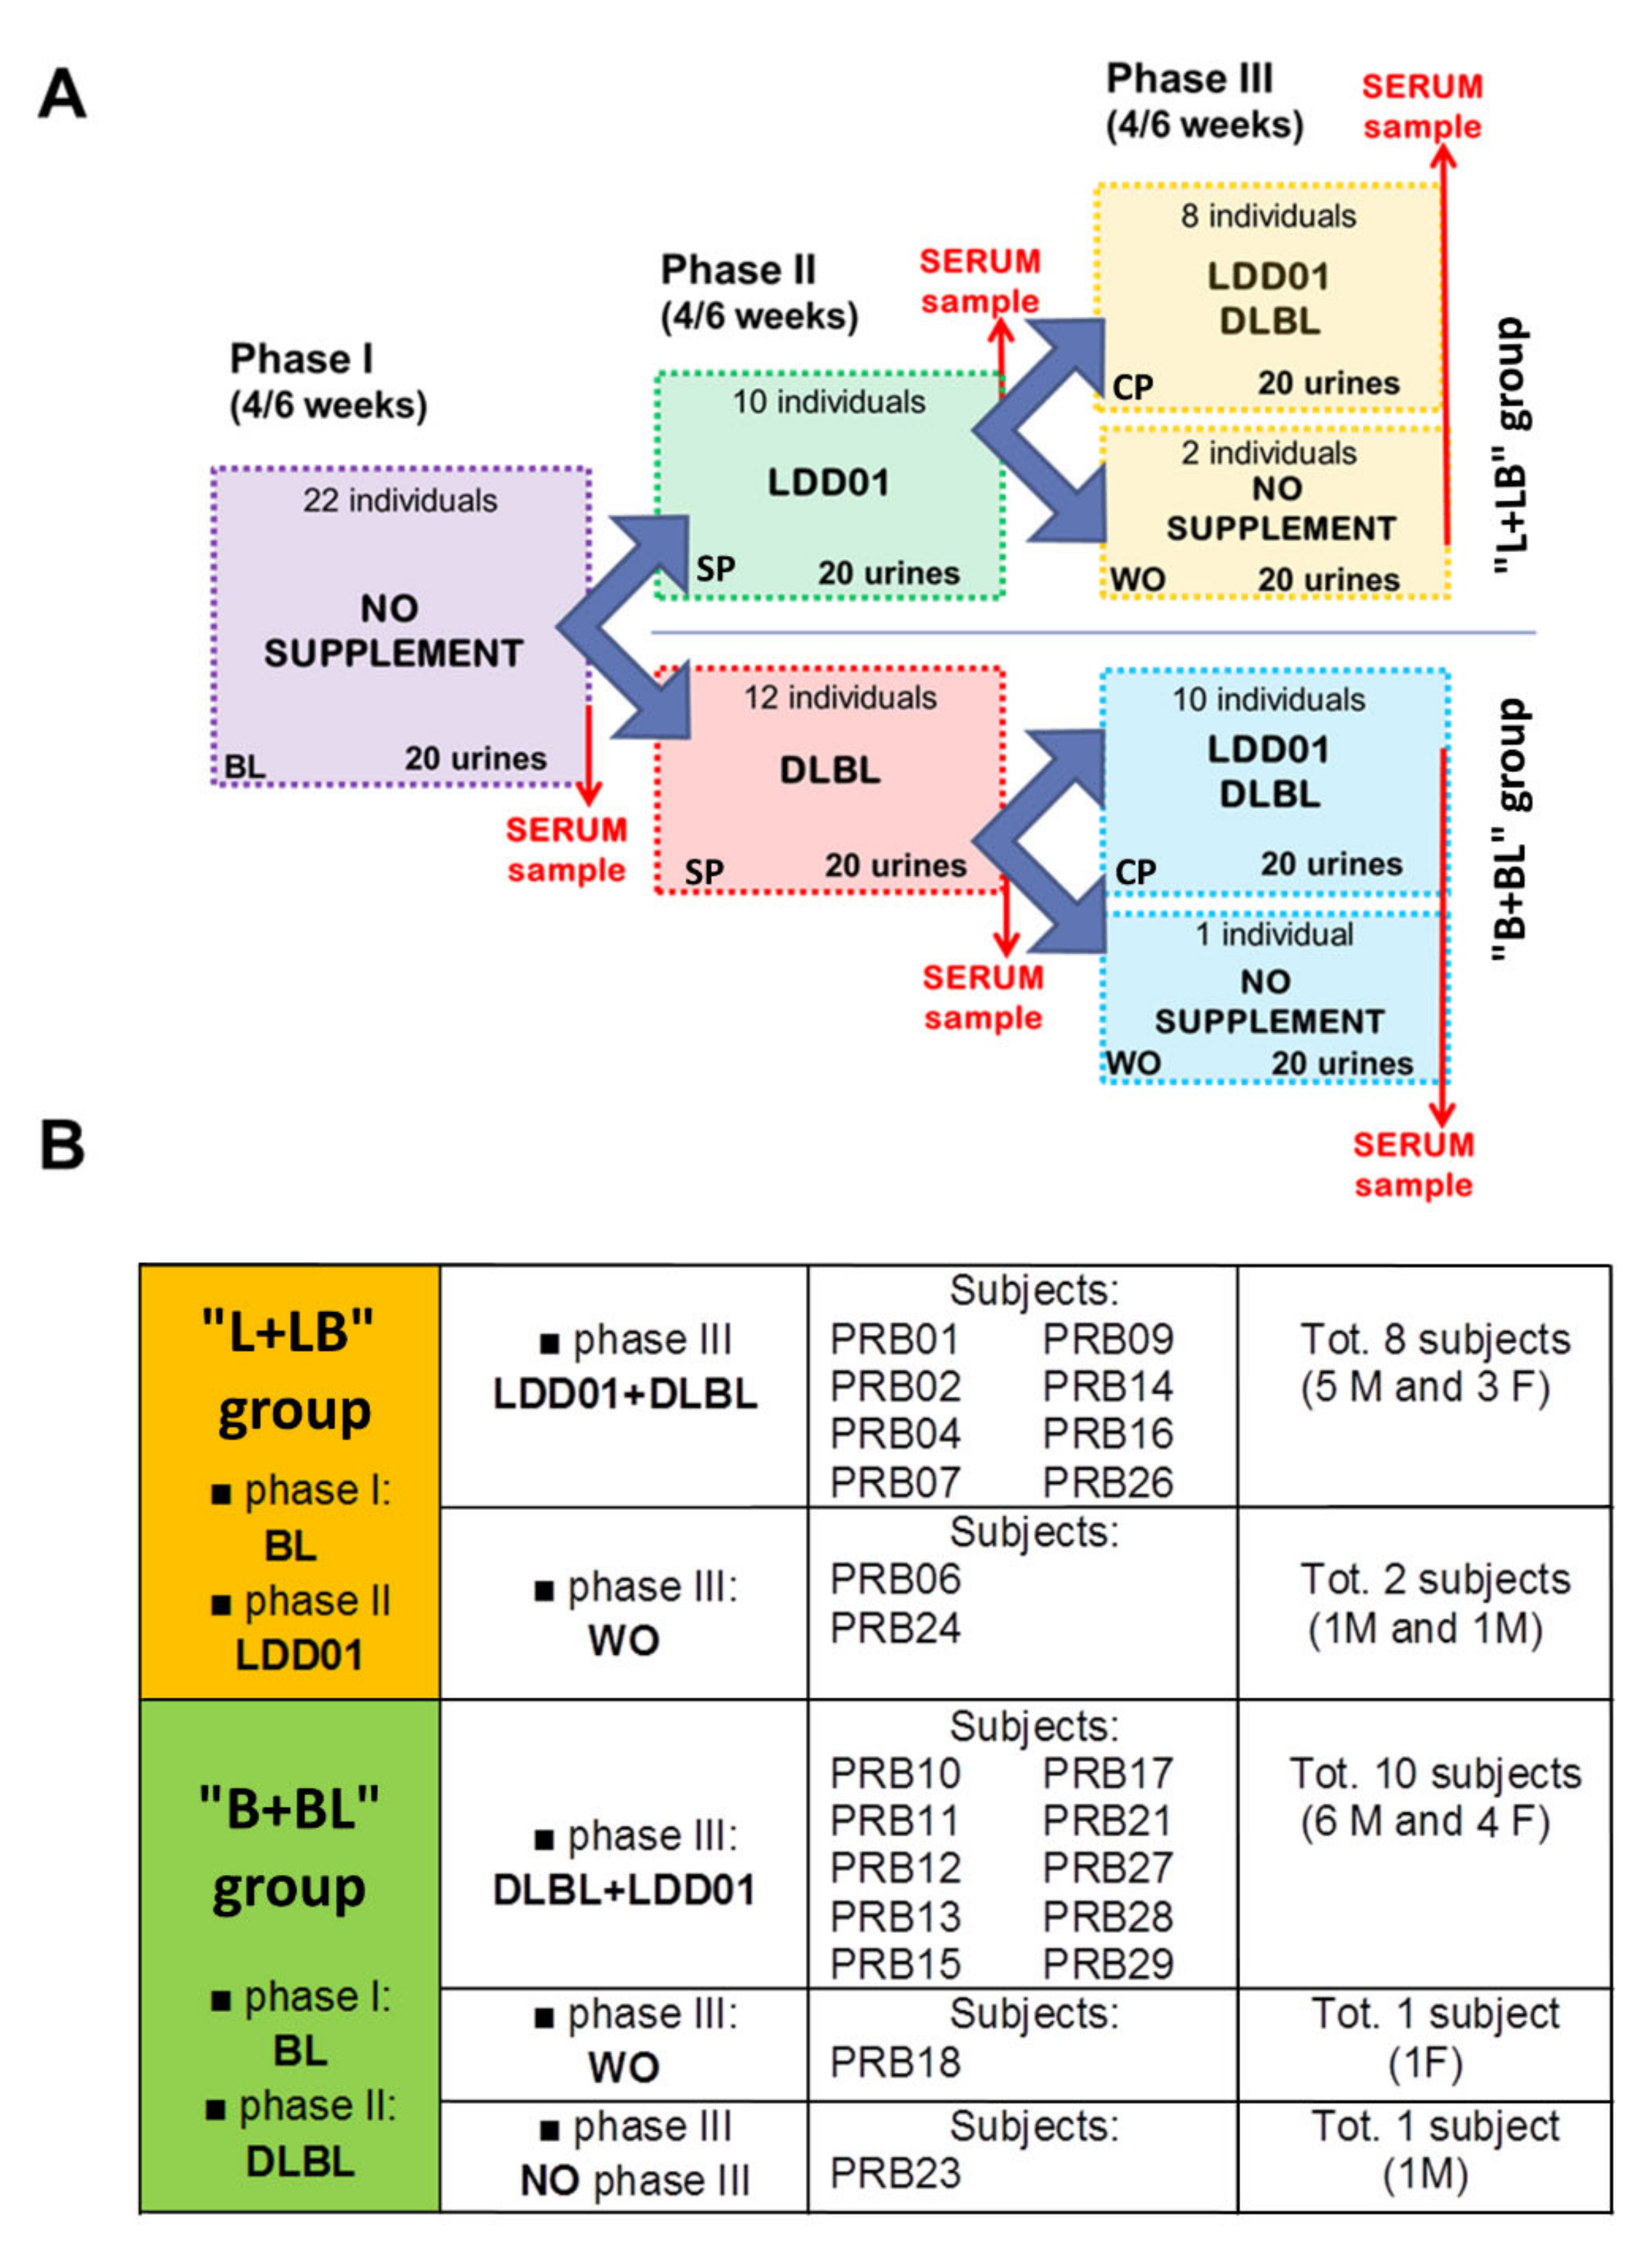
2.1. Study Design
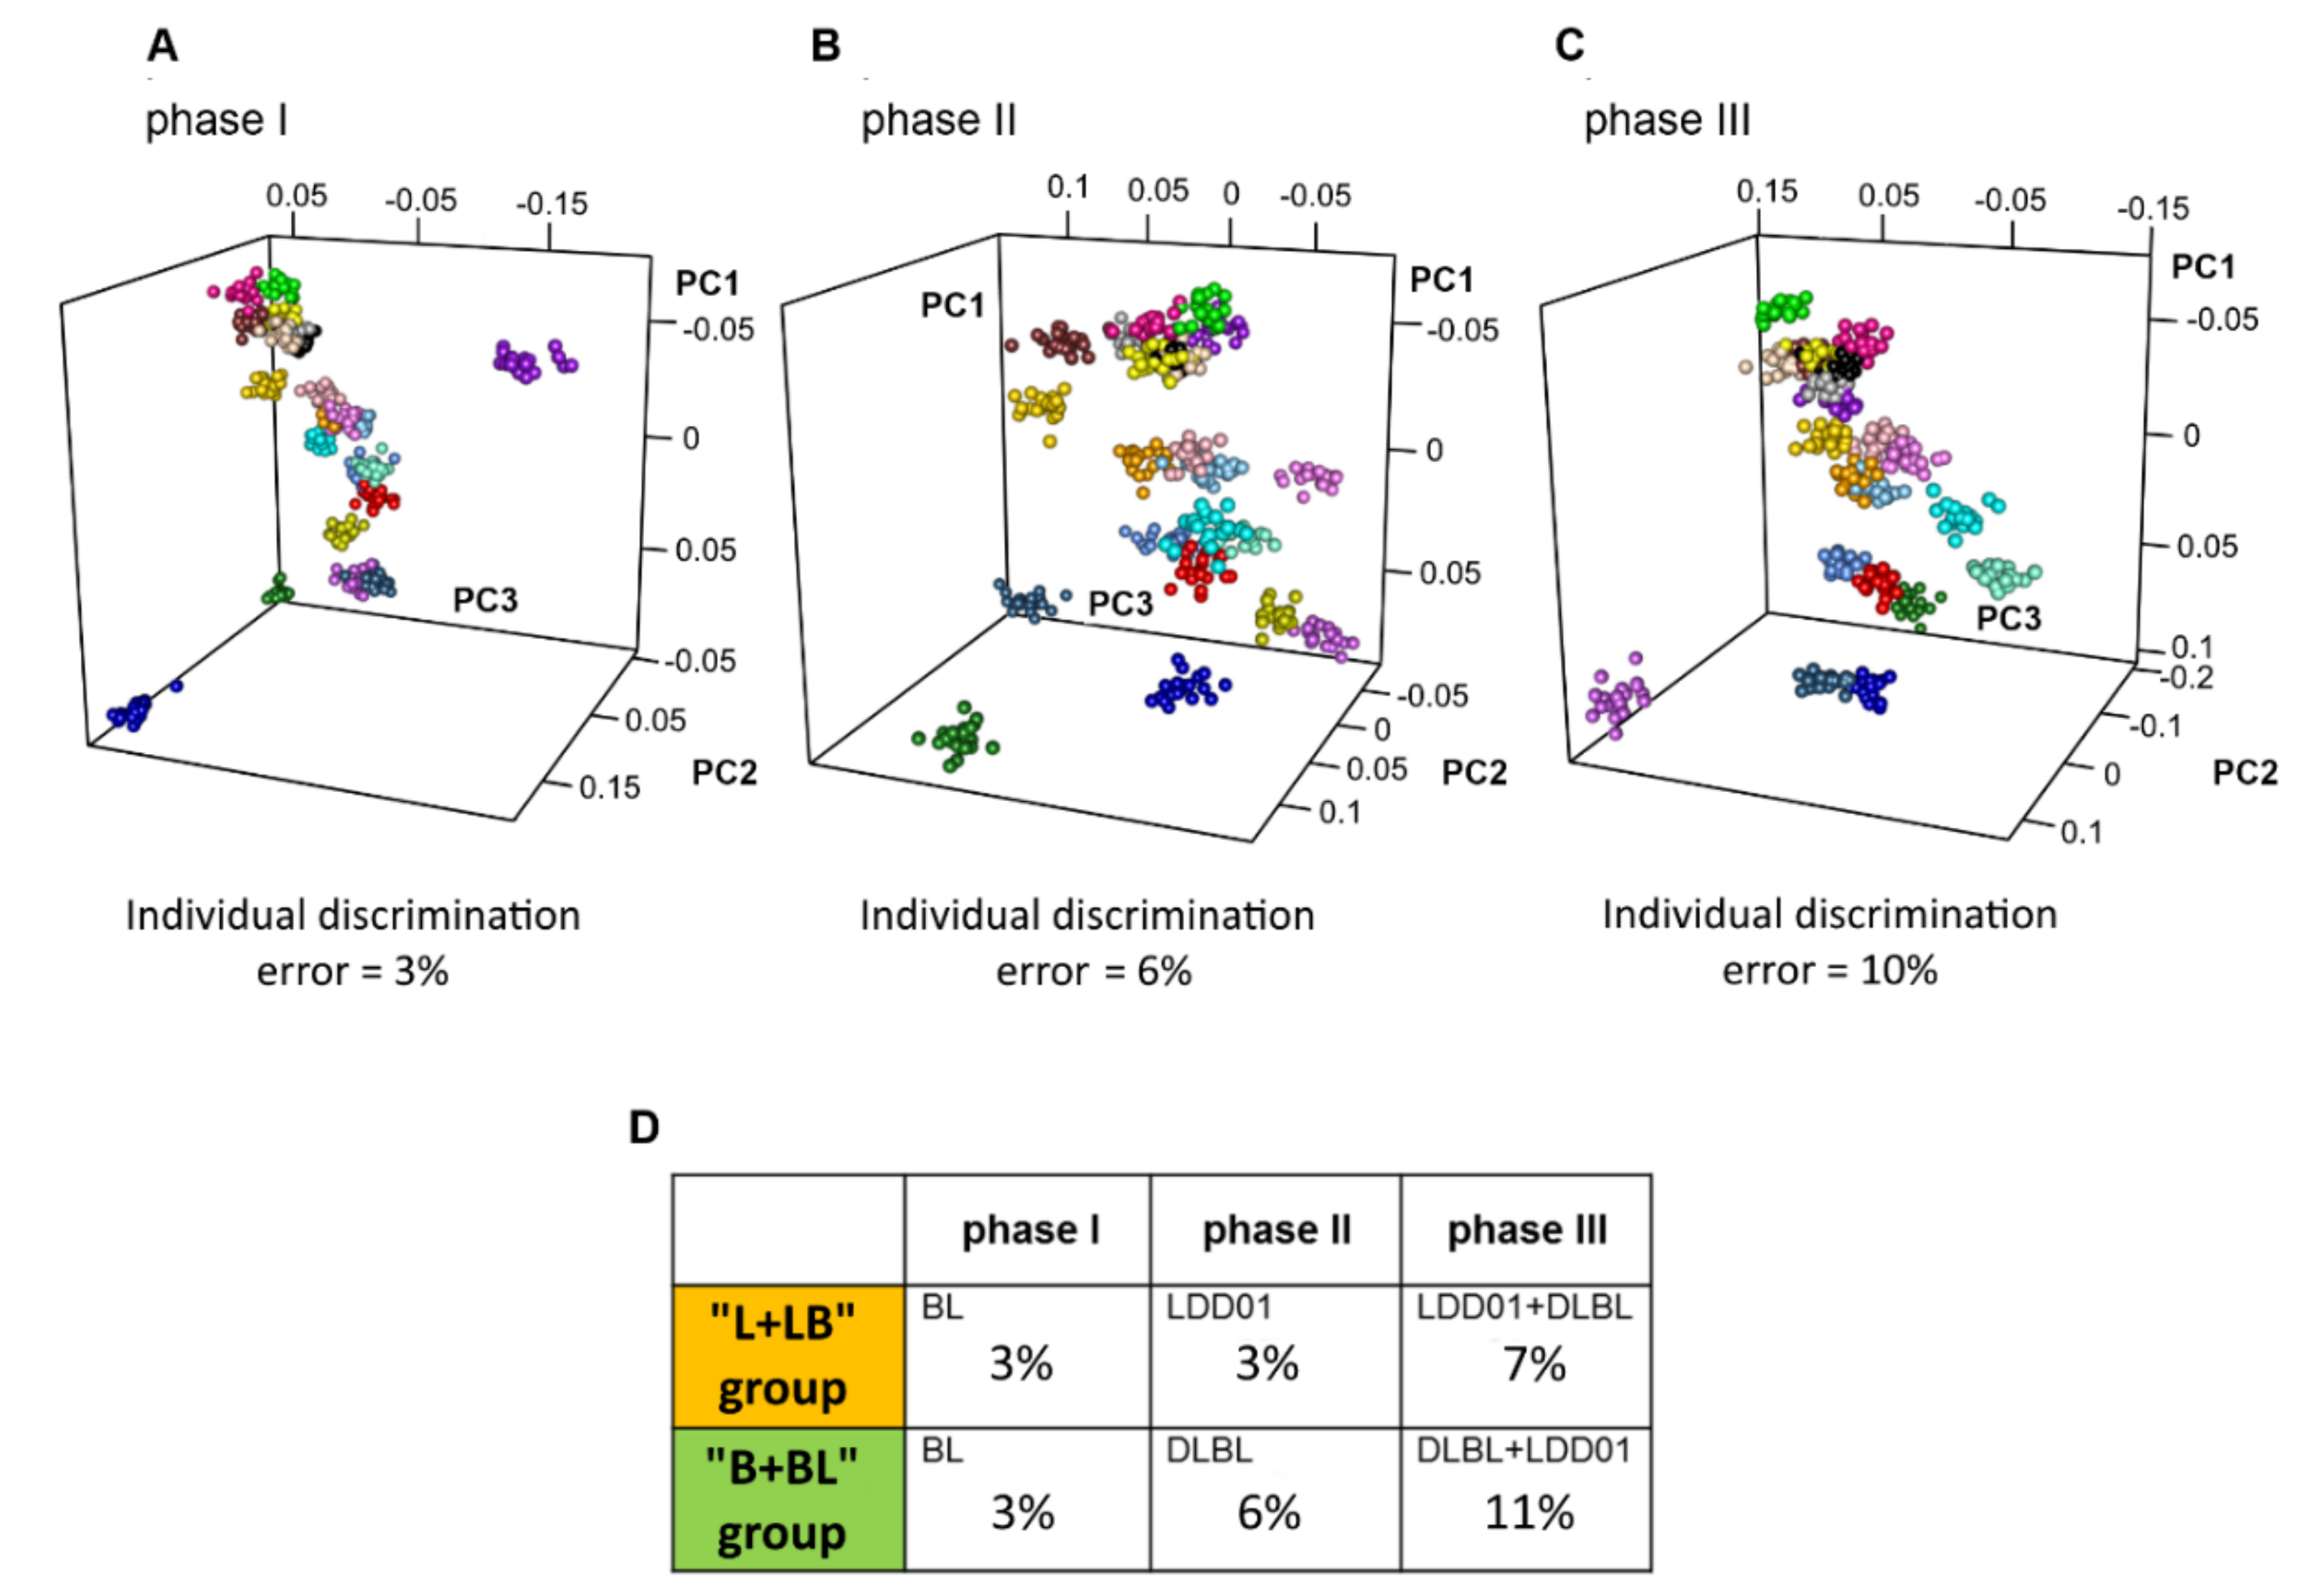
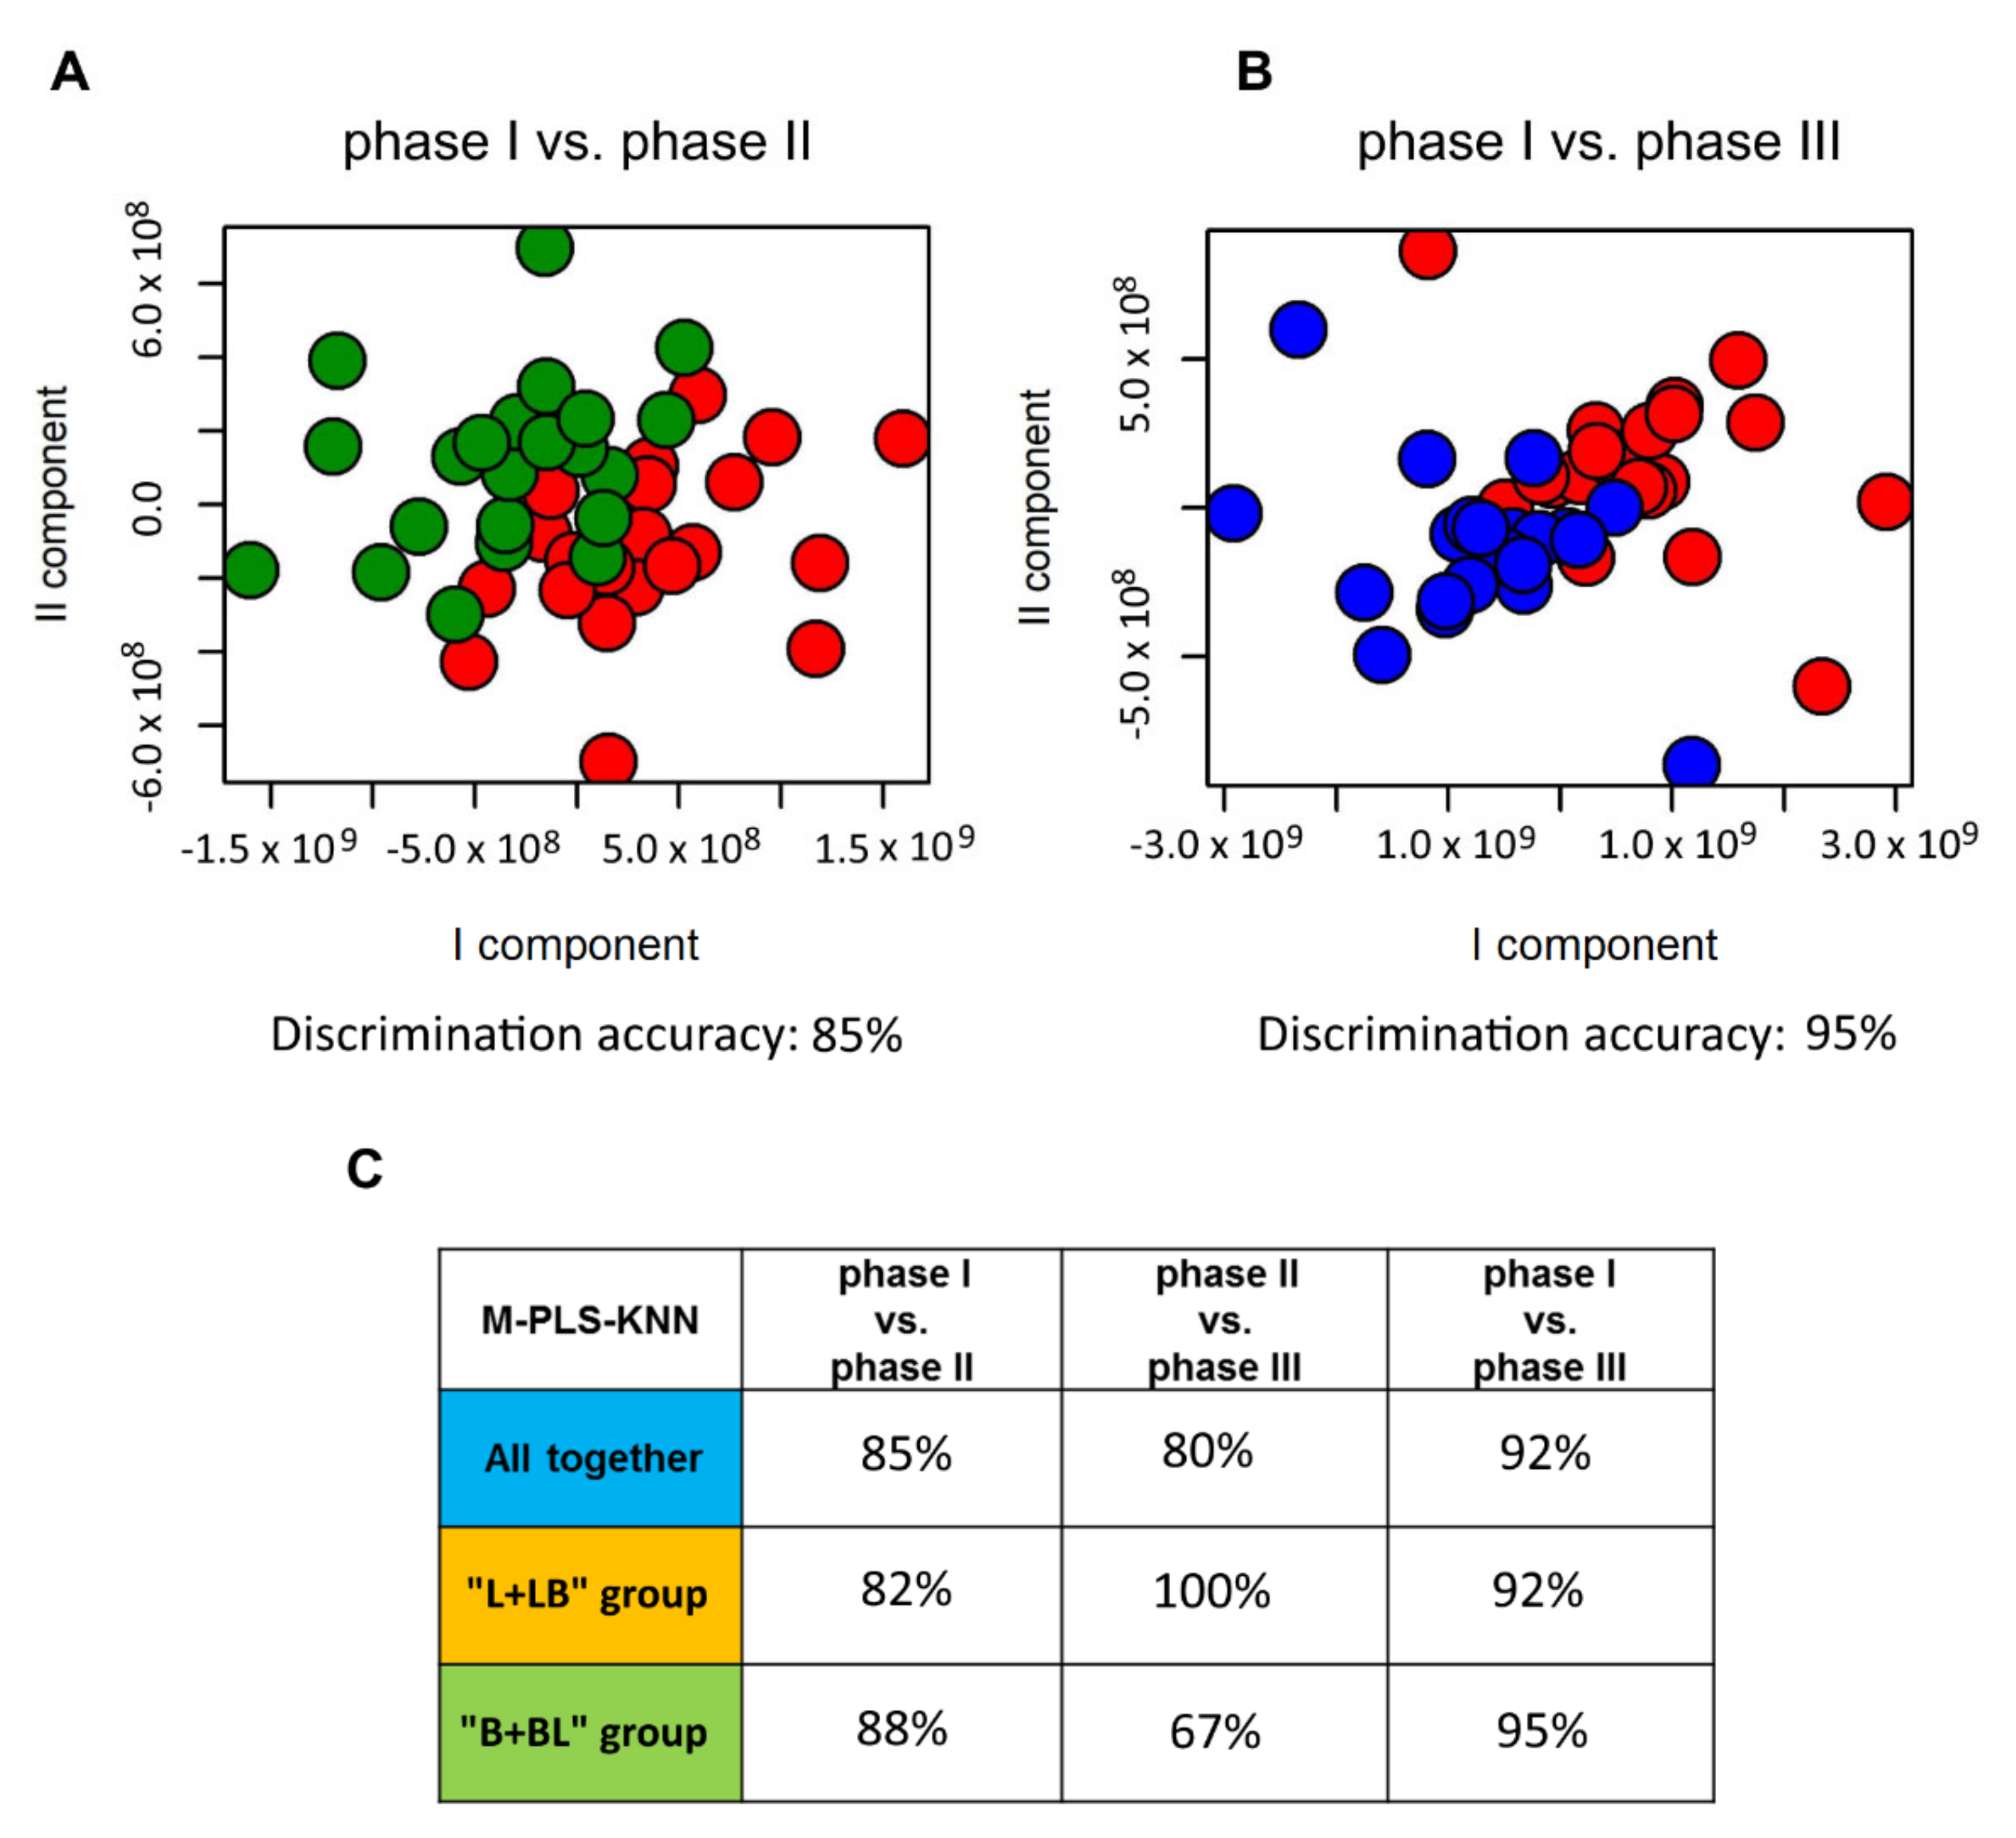
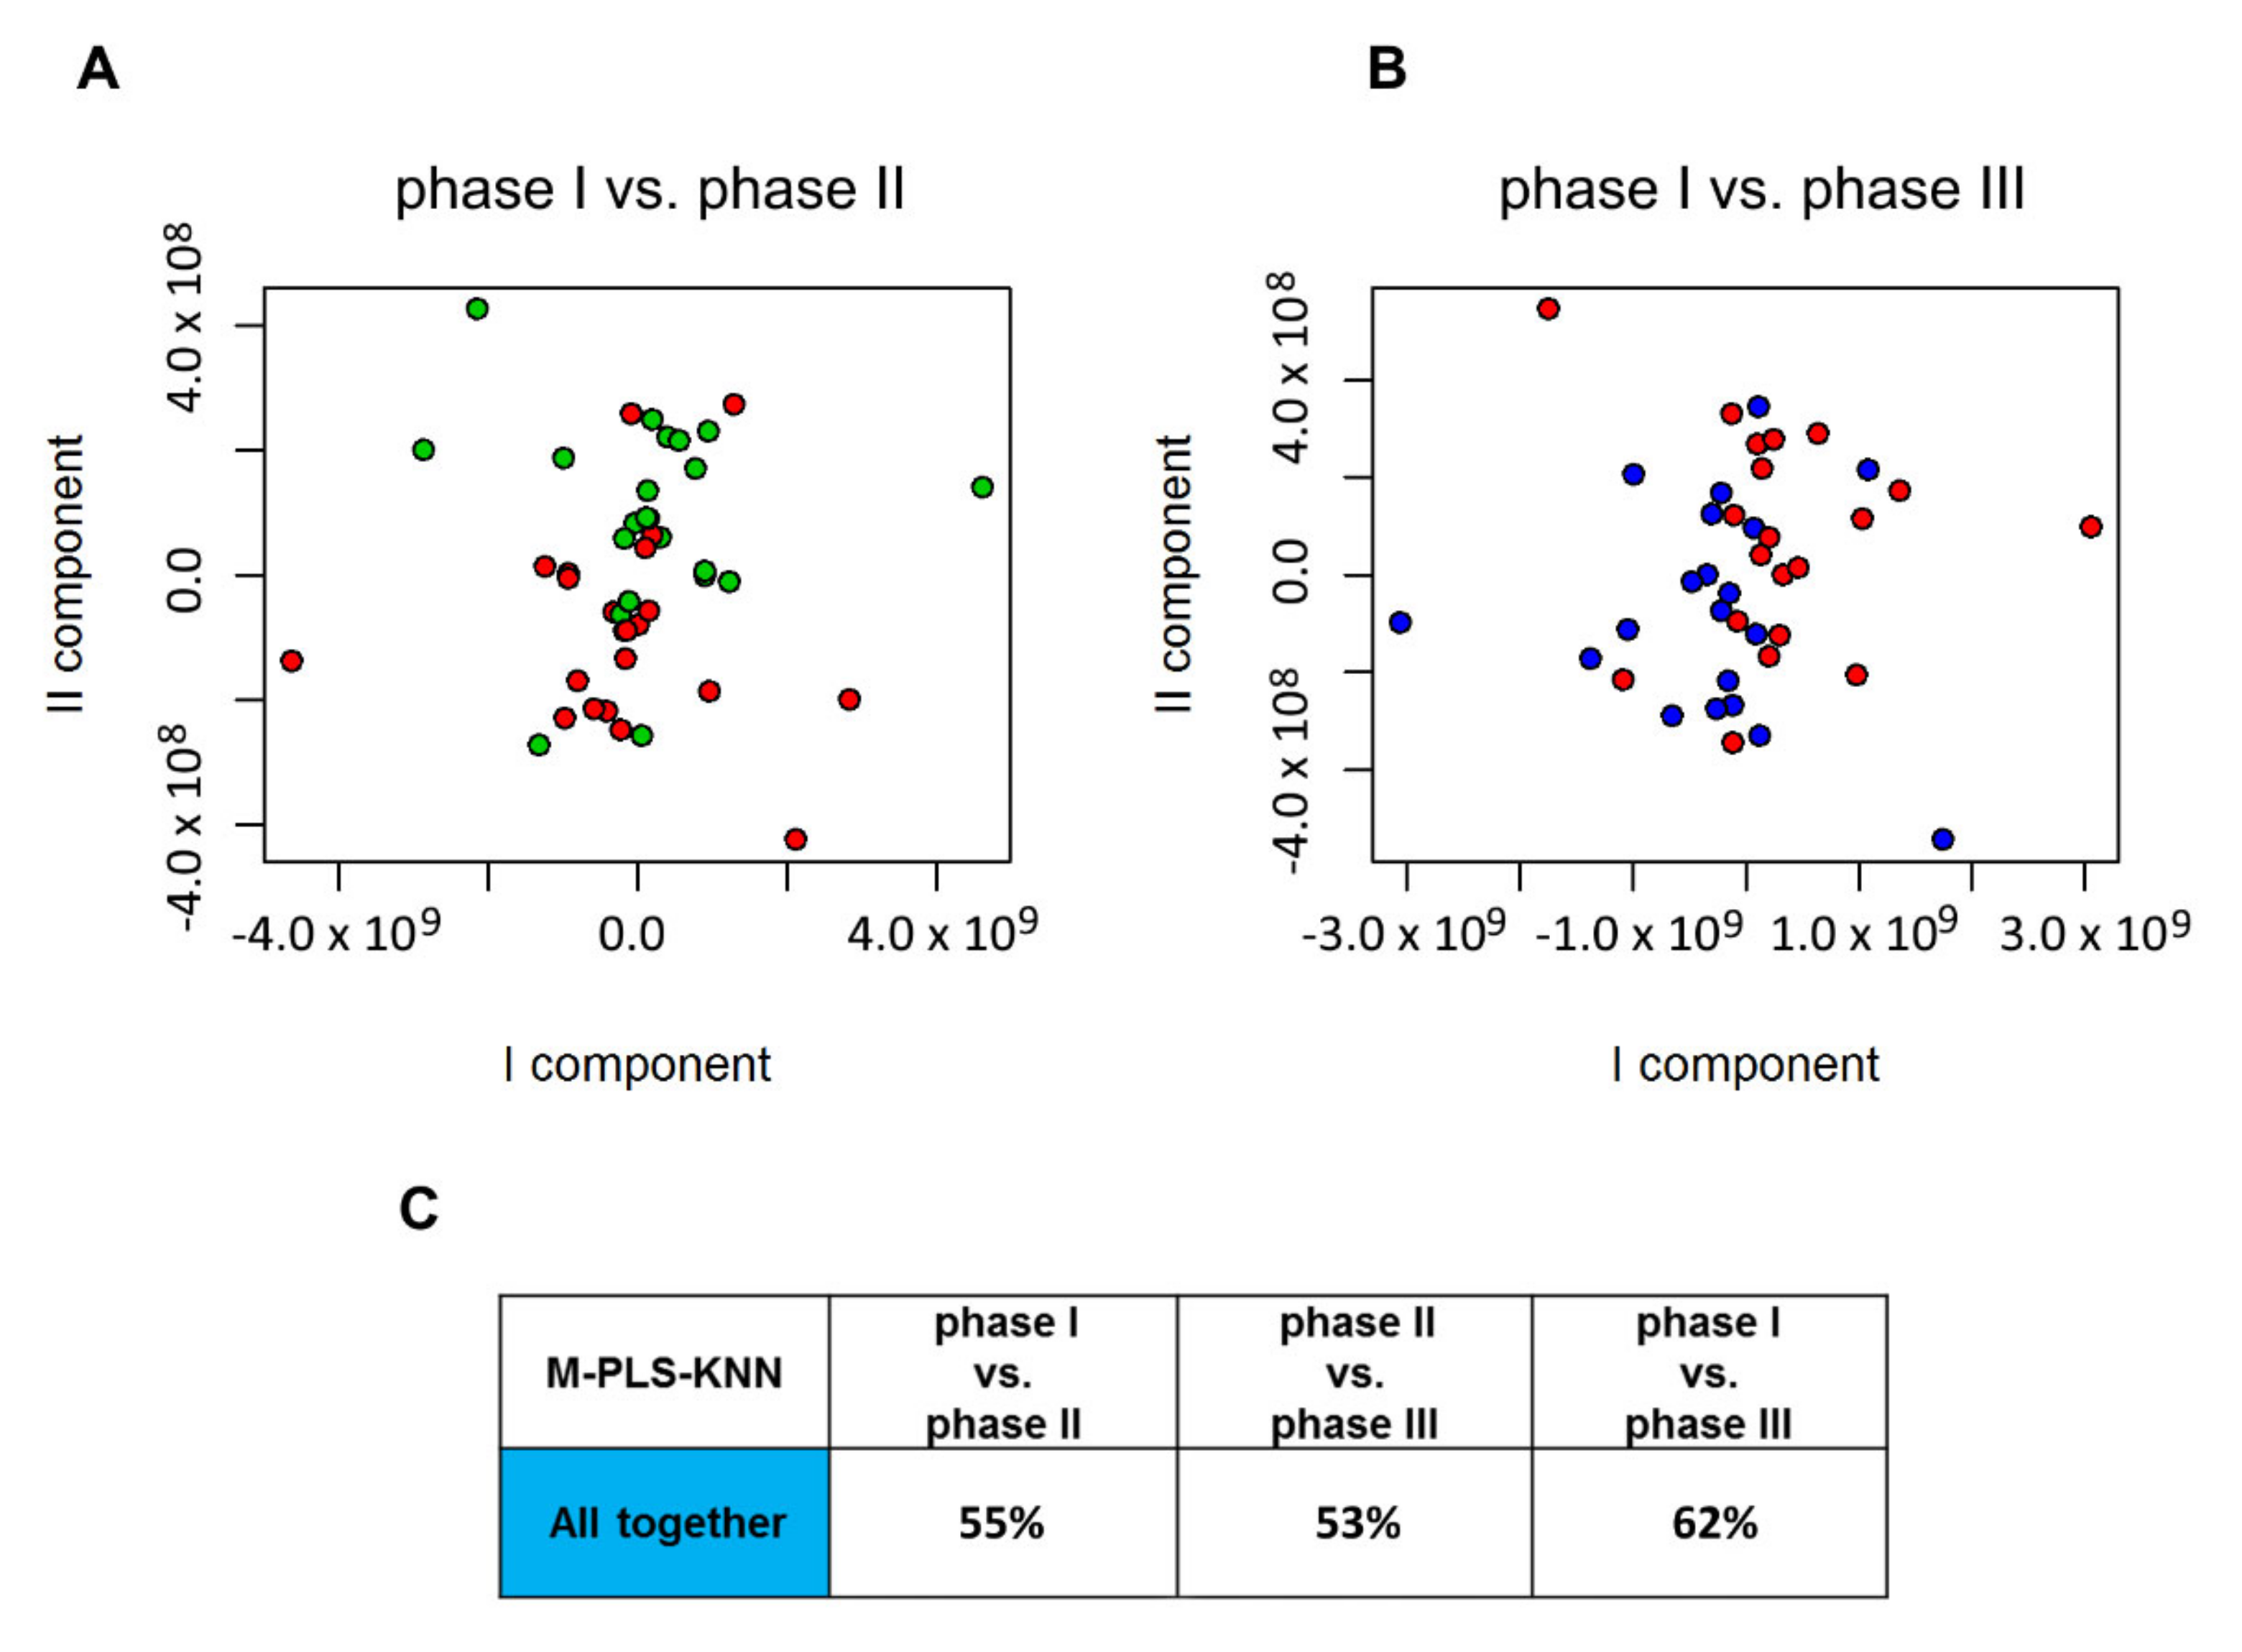
2.2. Influence of Probiotic Treatment on Individual Urine Metabolic Phenotype
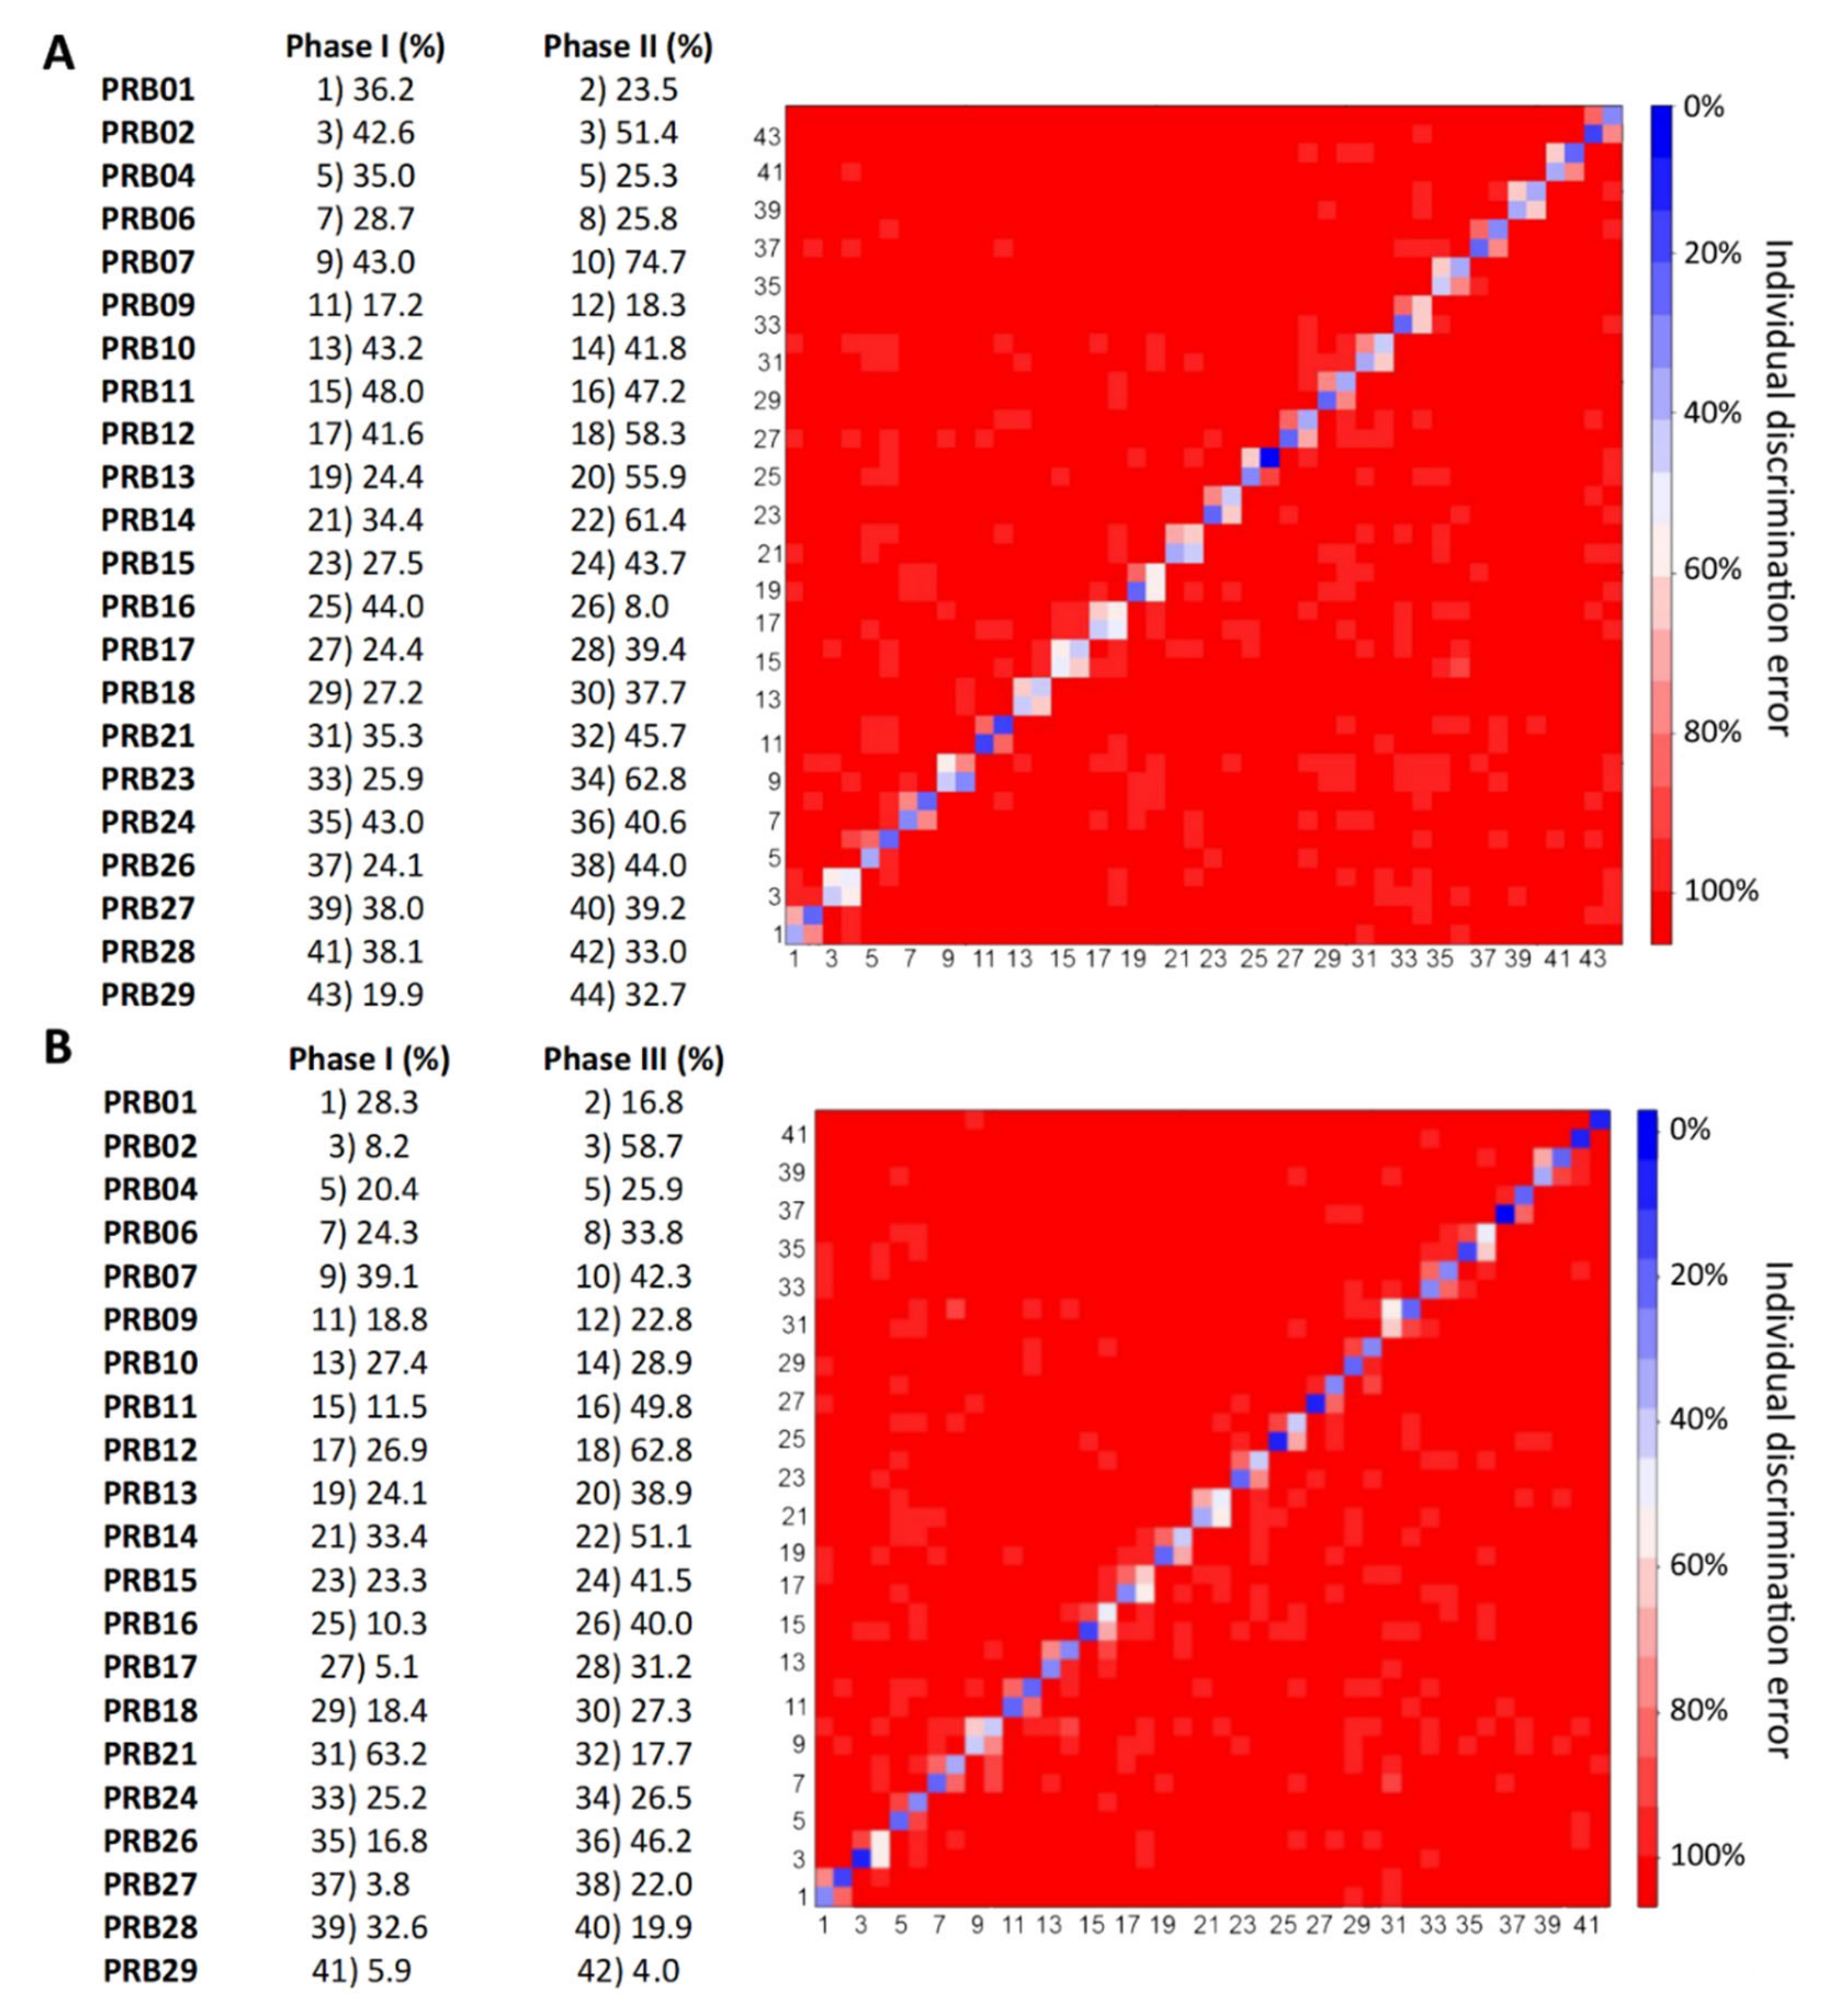
2.3. Individual Urine Effects of Probiotic Administration
2.4. Urine Metabolite Analysis
2.5. Serum Metabolite Analysis
3. Discussion
4. Materials and Methods
4.1. Recruitment of Volunteers and Exclusion Criteria
4.2. Probiotic Formulation
4.3. Sample Collection
4.4. NMR Analysis and Spectral Processing
4.5. Statistical Analysis
Supplementary Materials
Author Contributions
Funding
Acknowledgments
Conflicts of Interest
References
- Sommer, F.; Bäckhed, F. The gut microbiota—Masters of host development and physiology. Nat. Rev. Microbiol. 2013, 11, 227–238. [Google Scholar] [CrossRef] [PubMed]
- Xu, J.; Gordon, J.I. Honor thy symbionts. Proc. Natl. Acad. Sci. USA 2003, 100, 10452–10459. [Google Scholar] [CrossRef] [PubMed]
- Sender, R.; Fuchs, S.; Milo, R. Revised Estimates for the Number of Human and Bacteria Cells in the Body. PLoS Biol. 2016, 14, e1002533. [Google Scholar] [CrossRef] [PubMed]
- Clemente, J.C.; Ursell, L.K.; Parfrey, L.W.; Knight, R. The Impact of the Gut Microbiota on Human Health: An Integrative View. Cell 2012, 148, 1258–1270. [Google Scholar] [CrossRef] [PubMed]
- Bengmark, S. Probiotics and prebiotics in prevention and treatment of gastrointestinal diseases. Gastroenterol. Int. 1998, 11, 4–7. [Google Scholar]
- Ley, R.E.; Peterson, D.A.; Gordon, J.I. Ecological and Evolutionary Forces Shaping Microbial Diversity in the Human Intestine. Cell 2006, 124, 837–848. [Google Scholar] [CrossRef] [PubMed]
- LeBlanc, J.G.; Chain, F.; Martín, R.; Bermúdez-Humarán, L.G.; Courau, S.; Langella, P. Beneficial effects on host energy metabolism of short-chain fatty acids and vitamins produced by commensal and probiotic bacteria. Microb. Cell Factories 2017, 16, 1–10. [Google Scholar] [CrossRef]
- Sekirov, I.; Russell, S.L.; Antunes, L.C.M.; Finlay, B.B. Gut Microbiota in Health and Disease. Physiol. Rev. 2010, 90, 859–904. [Google Scholar] [CrossRef]
- Lederberg, J. Infectious History. Science 2000, 288, 287–293. [Google Scholar] [CrossRef]
- Walsh, C.J.; Guinane, C.M.; O’Toole, P.W.; Cotter, P.D. Beneficial modulation of the gut microbiota. FEBS Lett. 2014, 588, 4120–4130. [Google Scholar] [CrossRef]
- Ringel, Y.; Carroll, I.M. Alterations in the intestinal microbiota and functional bowel symptoms. Gastrointest. Endosc. Clin. N. Am. 2009, 19, 141–150. [Google Scholar] [CrossRef] [PubMed]
- DuPont, A.W.; DuPont, H.L. The intestinal microbiota and chronic disorders of the gut. Nat. Rev. Gastroenterol. Hepatol. 2011, 8, 523–531. [Google Scholar] [CrossRef] [PubMed]
- Hills, R.D.; Pontefract, B.A.; Mishcon, H.R.; Black, C.A.; Sutton, S.C.; Theberge, C.R. Gut Microbiome: Profound Implications for Diet and Disease. Nutrients 2019, 11, 1613. [Google Scholar] [CrossRef]
- Collins, M.D.; Gibson, G.R. Probiotics, prebiotics, and synbiotics: Approaches for modulating the microbial ecology of the gut. Am. J. Clin. Nutr. 1999, 69, 1052s–1057s. [Google Scholar] [CrossRef] [PubMed]
- Martin, F.-P.J.; Wang, Y.; Sprenger, N.; Yap, I.K.S.; Lundstedt, T.; Lek, P.; Rezzi, S.; Ramadan, Z.; van Bladeren, P.; Fay, L.B.; et al. Probiotic modulation of symbiotic gut microbial-host metabolic interactions in a humanized microbiome mouse model. Mol. Syst. Biol. 2008, 4, 157. [Google Scholar] [CrossRef]
- Ringel, Y.; Quigley, E.M.; Lin, H.C. Using Probiotics in Gastrointestinal Disorders. Am. J. Gastroenterol. Suppl. 2012, 1, 34–40. [Google Scholar] [CrossRef]
- Plaza-Diaz, J.; Ruiz-Ojeda, F.J.; Gil-Campos, M.; Gil, A. Mechanisms of Action of Probiotics. Adv. Nutr. 2019, 10, S49. [Google Scholar] [CrossRef]
- Fuller, R. Probiotics in human medicine. Gut 1991, 32, 439–442. [Google Scholar] [CrossRef]
- Hill, C.; Guarner, F.; Reid, G.; Gibson, G.R.; Merenstein, D.J.; Pot, B.; Morelli, L.; Canani, R.B.; Flint, H.J.; Salminen, S.; et al. Expert consensus document. The International Scientific Association for Probiotics and Prebiotics consensus statement on the scope and appropriate use of the term probiotic. Nat. Rev. Gastroenterol. Hepatol. 2014, 11, 506–514. [Google Scholar] [CrossRef]
- Takis, P.G.; Ghini, V.; Tenori, L.; Turano, P.; Luchinat, C. Uniqueness of the NMR approach to metabolomics. TrAC Trends Anal. Chem. 2019, 120, 115300. [Google Scholar] [CrossRef]
- Vignoli, A.; Ghini, V.; Meoni, G.; Licari, C.; Takis, P.G.; Tenori, L.; Turano, P.; Luchinat, C. High-Throughput Metabolomics by 1D NMR. Angew. Chem. Int. Ed. Engl. 2019, 58, 968–994. [Google Scholar] [CrossRef] [PubMed]
- Assfalg, M.; Bertini, I.; Colangiuli, D.; Luchinat, C.; Schäfer, H.; Schütz, B.; Spraul, M. Evidence of different metabolic phenotypes in humans. Proc. Natl. Acad. Sci. USA 2008, 105, 1420–1424. [Google Scholar] [CrossRef] [PubMed]
- Bernini, P.; Bertini, I.; Luchinat, C.; Nepi, S.; Saccenti, E.; Schäfer, H.; Schütz, B.; Spraul, M.; Tenori, L. Individual Human Phenotypes in Metabolic Space and Time. J. Proteome Res. 2009, 8, 4264–4271. [Google Scholar] [CrossRef] [PubMed]
- Ghini, V.; Saccenti, E.; Tenori, L.; Assfalg, M.; Luchinat, C. Allostasis and Resilience of the Human Individual Metabolic Phenotype. J. Proteome Res. 2015, 14, 2951–2962. [Google Scholar] [CrossRef] [PubMed]
- Wallner-Liebmann, S.; Tenori, L.; Mazzoleni, A.; Dieber-Rotheneder, M.; Konrad, M.; Hofmann, P.; Luchinat, C.; Turano, P.; Zatloukal, K. Individual Human Metabolic Phenotype Analyzed by (1)H NMR of Saliva Samples. J. Proteome Res. 2016, 15, 1787–1793. [Google Scholar] [CrossRef]
- Saccenti, E.; Menichetti, G.; Ghini, V.; Remondini, D.; Tenori, L.; Luchinat, C. Entropy-Based Network Representation of the Individual Metabolic Phenotype. J. Proteome Res. 2016, 15, 3298–3307. [Google Scholar] [CrossRef]
- Wallner-Liebmann, S.; Gralka, E.; Tenori, L.; Konrad, M.; Hofmann, P.; Dieber-Rotheneder, M.; Turano, P.; Luchinat, C.; Zatloukal, K. The impact of free or standardized lifestyle and urine sampling protocol on metabolome recognition accuracy. Genes Nutr. 2015, 10, 441. [Google Scholar] [CrossRef]
- Antonaros, F.; Ghini, V.; Pulina, F.; Ramacieri, G.; Cicchini, E.; Mannini, E.; Martelli, A.; Feliciello, A.; Lanfranchi, S.; Onnivello, S.; et al. Plasma metabolome and cognitive skills in Down syndrome. Sci. Rep. 2020, 10, 1–2. [Google Scholar] [CrossRef]
- Vignoli, A.; Orlandini, B.; Tenori, L.; Biagini, M.R.; Milani, S.; Renzi, D.; Luchinat, C.; Calabrò, A.S. Metabolic Signature of Primary Biliary Cholangitis and Its Comparison with Celiac Disease. J. Proteome Res. 2019, 18, 1228–1236. [Google Scholar] [CrossRef]
- Vignoli, A.; Paciotti, S.; Tenori, L.; Eusebi, P.; Biscetti, L.; Chiasserini, D.; Scheltens, P.; Turano, P.; Teunissen, C.; Luchinat, C.; et al. Fingerprinting Alzheimer’s Disease by 1H Nuclear Magnetic Resonance Spectroscopy of Cerebrospinal Fluid. J. Proteome Res. 2020, 19, 1696–1705. [Google Scholar] [CrossRef]
- Meoni, G.; Lorini, S.; Monti, M.; Madia, F.; Corti, G.; Luchinat, C.; Zignego, A.L.; Tenori, L.; Gragnani, L. The metabolic fingerprints of HCV and HBV infections studied by Nuclear Magnetic Resonance Spectroscopy. Sci. Rep. 2019, 9, 4128. [Google Scholar] [CrossRef] [PubMed]
- Romano, F.; Meoni, G.; Manavella, V.; Baima, G.; Mariani, G.M.; Cacciatore, S.; Tenori, L.; Aimetti, M. Effect of non-surgical periodontal therapy on salivary metabolic fingerprint of generalized chronic periodontitis using nuclear magnetic resonance spectroscopy. Arch. Oral Biol. 2019, 97, 208–214. [Google Scholar] [CrossRef]
- Dani, C.; Bresci, C.; Berti, E.; Ottanelli, S.; Mello, G.; Mecacci, F.; Breschi, R.; Hu, X.; Tenori, L.; Luchinat, C. Metabolomic profile of term infants of gestational diabetic mothers. J. Matern. Fetal Neonatal Med. 2014, 27, 537–542. [Google Scholar] [CrossRef] [PubMed]
- Nicholson, G.; Rantalainen, M.; Maher, A.D.; Li, J.V.; Malmodin, D.; Ahmadi, K.R.; Faber, J.H.; Hallgrímsdóttir, I.B.; Barrett, A.; Toft, H.; et al. Human metabolic profiles are stably controlled by genetic and environmental variation. Mol. Syst. Biol. 2011, 7, 525. [Google Scholar] [CrossRef]
- Ghini, V.; Tenori, L.; Capozzi, F.; Luchinat, C.; Bub, A.; Malpuech-Brugere, C.; Orfila, C.; Ricciardiello, L.; Bordoni, A. DHA-induced perturbation of human serum metabolome. Role of the food matrix and Co-administration of oat β-glucan and anthocyanins. Nutrients 2020, 12, 86. [Google Scholar] [CrossRef] [PubMed]
- Li, M.; Wang, B.; Zhang, M.; Rantalainen, M.; Wang, S.; Zhou, H.; Zhang, Y.; Shen, J.; Pang, X.; Wei, H.; et al. Symbiotic gut microbes modulate human metabolic phenotypes. Proc. Natl. Acad. Sci. USA 2008, 105, 2117–2122. [Google Scholar] [CrossRef] [PubMed]
- Nicholson, J.K.; Wilson, I.D. Understanding “Global” Systems Biology: Metabonomics and the Continuum of Metabolism. Nat. Rev. Drug Discov. 2003, 2, 668–676. [Google Scholar] [CrossRef] [PubMed]
- Simon, J.-C.; Marchesi, J.R.; Mougel, C.; Selosse, M.-A. Host-microbiota interactions: From holobiont theory to analysis. Microbiome 2019, 7, 5. [Google Scholar] [CrossRef] [PubMed]
- Postler, T.S.; Ghosh, S. Understanding the Holobiont: How Microbial Metabolites Affect Human Health and Shape the Immune System. Cell Metab. 2017, 26, 110–130. [Google Scholar] [CrossRef]
- Kundu, P.; Blacher, E.; Elinav, E.; Pettersson, S. Our Gut Microbiome: The Evolving Inner Self. Cell 2017, 171, 1481–1493. [Google Scholar] [CrossRef]
- Saccenti, E.; Tenori, L.; Verbruggen, P.; Timmerman, M.E.; Bouwman, J.; van der Greef, J.; Luchinat, C.; Smilde, A.K. Of monkeys and men: A metabolomic analysis of static and dynamic urinary metabolic phenotypes in two species. PLoS ONE 2014, 9, e106077. [Google Scholar] [CrossRef] [PubMed]
- Westerhuis, J.A.; van Velzen, E.J.; Hoefsloot, H.C.; Smilde, A.K. Multivariate paired data analysis: Multilevel PLSDA versus OPLSDA. Metabolomics 2010, 6, 119–128. [Google Scholar] [CrossRef] [PubMed]
- Tarplin, S.; Ganesan, V.; Monga, M. Stone formation and management after bariatric surgery. Nat. Rev. Urol. 2015, 12, 263–270. [Google Scholar] [CrossRef] [PubMed]
- Caudarella, R.; Vescini, F.; Buffa, A.; Stefoni, S. Citrate and mineral metabolism: Kidney stones and bone disease. Front. Biosci. 2003, 8, s1084–s1106. [Google Scholar] [PubMed]
- Goodarzi, M.T.; Forouzanfar, F.; Moaddab, A.H.; Karimian, M.; Sabzevar, N.K. Comparison of 24-hour urinary citrate excretion in stone formers and healthy volunteers. Saudi J. Kidney Dis. Transpl. 2012, 23, 1227–1231. [Google Scholar] [CrossRef] [PubMed]
- Chlopicki, S.; Swies, J.; Mogielnicki, A.; Buczko, W.; Bartus, M.; Lomnicka, M.; Adamus, J.; Gebicki, J. 1-Methylnicotinamide (MNA), a primary metabolite of nicotinamide, exerts anti-thrombotic activity mediated by a cyclooxygenase-2/prostacyclin pathway. Br. J. Pharmacol. 2007, 152, 230–239. [Google Scholar] [CrossRef] [PubMed]
- Brasili, E.; Mengheri, E.; Tomassini, A.; Capuani, G.; Roselli, M.; Finamore, A.; Sciubba, F.; Marini, F.; Miccheli, A. Lactobacillus acidophilus La5 and Bifidobacterium lactis Bb12 Induce Different Age-Related Metabolic Profiles Revealed by 1H-NMR Spectroscopy in Urine and Feces of Mice. J. Nutr. 2013, 143, 1549–1557. [Google Scholar] [CrossRef] [PubMed]
- Vanholder, R.; Glorieux, G. The intestine and the kidneys: A bad marriage can be hazardous. Clin. Kidney J. 2015, 8, 168–179. [Google Scholar] [CrossRef]
- Wikoff, W.R.; Anfora, A.T.; Liu, J.; Schultz, P.G.; Lesley, S.A.; Peters, E.C.; Siuzdak, G. Metabolomics analysis reveals large effects of gut microflora on mammalian blood metabolites. Proc. Natl. Acad. Sci. USA 2009, 106, 3698–3703. [Google Scholar] [CrossRef]
- Zhong, Y.; Nyman, M. Prebiotic and synbiotic effects on rats fed malted barley with selected bacteria strains. Food Nutr. Res. 2014, 58, 24848. [Google Scholar] [CrossRef]
- Li, P.; Yin, Y.-L.; Li, D.; Kim, S.W.; Wu, G. Amino acids and immune function. Br. J. Nutr. 2007, 98, 237–252. [Google Scholar] [CrossRef] [PubMed]
- Shi, X.; Wei, X.; Yin, X.; Wang, Y.; Zhang, M.; Zhao, C.; Zhao, H.; McClain, C.J.; Feng, W.; Zhang, X. Hepatic and fecal metabolomic analysis of the effects of Lactobacillus rhamnosus GG on alcoholic fatty liver disease in mice. J. Proteome Res. 2015, 14, 1174–1182. [Google Scholar] [CrossRef] [PubMed]
- Gray, L.R.; Tompkins, S.C.; Taylor, E.B. Regulation of pyruvate metabolism and human disease. Cell Mol. Life Sci. 2014, 71, 2577–2604. [Google Scholar] [CrossRef] [PubMed]
- Harding, S.V.; Fraser, K.G.; Wykes, L.J. Probiotics stimulate liver and plasma protein synthesis in piglets with dextran sulfate-induced colitis and macronutrient restriction. J. Nutr. 2008, 138, 2129–2135. [Google Scholar] [CrossRef] [PubMed]
- Bernini, P.; Bertini, I.; Luchinat, C.; Nincheri, P.; Staderini, S.; Turano, P. Standard operating procedures for pre-analytical handling of blood and urine for metabolomic studies and biobanks. J. Biomol. NMR 2011, 49, 231–243. [Google Scholar] [CrossRef] [PubMed]
- Ghini, V.; Quaglio, D.; Luchinat, C.; Turano, P. NMR for sample quality assessment in metabolomics. N Biotechnol. 2019, 52, 25–34. [Google Scholar] [CrossRef]
- Emwas, A.-H.; Luchinat, C.; Turano, P.; Tenori, L.; Roy, R.; Salek, R.M.; Ryan, D.; Merzaban, J.S.; Kaddurah-Daouk, R.; Zeri, A.C.; et al. Standardizing the experimental conditions for using urine in NMR-based metabolomic studies with a particular focus on diagnostic studies: A review. Metabolomics 2015, 11, 872–894. [Google Scholar] [CrossRef] [PubMed]
- Marcon, G.; Nincheri, P. The Multispecialistic da Vinci European BioBank. Open J. Bioresour. 2014, 1. [Google Scholar] [CrossRef]
- Carotenuto, D.; Luchinat, C.; Marcon, G.; Rosato, A.; Turano, P. The Da Vinci European BioBank: A Metabolomics-Driven Infrastructure. J. Pers. Med. 2015, 5, 107–119. [Google Scholar] [CrossRef]
- Beckonert, O.; Keun, H.C.; Ebbels, T.M.D.; Bundy, J.; Holmes, E.; Lindon, J.C.; Nicholson, J.K. Metabolic profiling, metabolomic and metabonomic procedures for NMR spectroscopy of urine, plasma, serum and tissue extracts. Nat. Protoc. 2007, 2, 2692–2703. [Google Scholar] [CrossRef]
- Benjamini, Y.; Hochberg, Y. On the adaptive control of the false discovery rate in multiple testing with independent statistics. J. Educ. Behav. Stat. 2000, 25, 60–83. [Google Scholar] [CrossRef]


| “L + LB” Group | “B + BL” Group | ||||||
|---|---|---|---|---|---|---|---|
| Phase I vs. Phase II | Phase II vs. Phase III | Phase I vs. Phase III | Phase I vs. Phase II | Phase II vs. Phase III | Phase I vs. Phase III | ||
| Subject: | % | % | % | Subject: | % | % | % |
| PRB01 | 78 | 72 | 81 | PRB10 | 65 | 68 | 85 |
| PRB02 | 68 | 60 | 83 | PRB11 | 73 | 83 | 85 |
| PRB04 | 80 | 84 | 95 | PRB12 | 58 | 50 | 68 |
| PRB06 | 88 | 65 * | 91 * | PRB13 | 83 | 61 | 92 |
| PRB07 | 63 | 57 | 82 | PRB15 | 75 | 67 | 75 |
| PRB09 | 83 | 59 | 85 | PRB17 | 84 | 72 | 99 |
| PRB14 | 80 | 62 | 89 | PRB18 | 78 | 73 * | 86 * |
| PRB16 | 85 | 67 | 85 | PRB21 | 72 | 74 | 89 |
| PRB24 | 78 | 57 * | 83 * | PRB23 | 70 | -- | -- |
| PRB26 | 65 | 62 | 82 | PRB27 | 56 | 73 | 80 |
| PRB28 | 68 | 74 | 73 | ||||
| PRB29 | 74 | 98 | 97 | ||||
| All Together | Phase I vs. Phase II | FC | Phase II vs. Phase III | FC | Phase I vs. Phase III | FC |
|---|---|---|---|---|---|---|
| Leucine | 0.020 | 0.10 | 0.656 | −0.03 | 0.222 | 0.07 |
| Isoleucine | 0.057 | 0.11 | 0.351 | 0.03 | 0.004 | 0.13 |
| Valine | 0.041 | 0.11 | 0.945 | −0.01 | 0.079 | 0.10 |
| Citrate | 0.040 | 0.10 | 0.731 | 0.04 | 0.013 | 0.14 |
| Creatinine | 0.041 | 0.07 | 0.374 | 0.01 | 0.003 | 0.08 |
| Choline | 0.228 | 0.01 | 0.521 | −0.06 | 0.013 | −0.05 |
| 1-methylnicotinamide | 0.185 | 0.03 | 0.083 | 0.01 | 6.32 * 10−5 | 0.04 |
| Malonate | 0.001 | 0.05 | 0.351 | 0.01 | 1.27 * 10−5 | 0.06 |
| Valerate | 0.040 | 0.03 | 0.858 | −0.02 | 0.079 | 0.02 |
| 2-hydroxyisobutyric | 0.358 | 0.14 | 0.351 | −0.01 | 0.019 | 0.13 |
| Acetoacetate | 0.042 | 0.06 | 0.771 | 0.04 | 0.032 | 0.1 |
| Fucose | 0.178 | 0.05 | 0.374 | 0.02 | 0.021 | 0.07 |
| Induxylsulfate | 0.180 | 0.20 | 0.374 | −0.12 | 0.004 | 0.08 |
| Methanol | 0.239 | -0.1 | 0.008 | −0.21 | 6.42 * 10−5 | −0.31 |
| Dimethylglycine | 0.013 | 0.25 | 0.848 | −0.04 | 0.008 | 0.21 |
| Acetone | 2.71 * 10−5 | 0.25 | 0.351 | −0.09 | 0.013 | 0.16 |
| Glycolate | 0.042 | 0.46 | 0.752 | −0.15 | 0.309 | 0.31 |
| Ornithine+arginine-acetate | 0.021 | 0.10 | 0.666 | −0.03 | 0.001 | 0.07 |
| 4-hydroxyhippuricacid | 0.586 | 0.17 | 0.376 | 0.14 | 0.041 | 0.31 |
| L + LB Group | Phase I vs. Phase II | FC | Phase II vs. Phase III | FC | Phase I vs. Phase III | FC |
| Leucine | 0.026 | 0.12 | 0.622 | −0.05 | 0.359 | 0.07 |
| Valine | 0.025 | 0.16 | 0.622 | −0.05 | 0.152 | 0.1 |
| Citrate | 0.071 | 0.09 | 0.466 | 0.07 | 0.012 | 0.16 |
| Creatinine | 0.071 | 0.07 | 0.622 | 0.03 | 0.042 | 0.010 |
| Choline | 0.135 | 0.03 | 0.466 | 0.03 | 0.001 | 0.06 |
| 1-methylnicotinamide | 0.386 | 0.004 | 0.466 | 0.04 | 0.012 | 0.045 |
| Malonate | 0.059 | 0.06 | 0.925 | −0.001 | 0.043 | 0.05 |
| Induxylsulfate | 0.984 | 0.036 | 0.466 | 0.18 | 0.043 | 0.22 |
| Dimethylglycine | 0.105 | 0.15 | 0.798 | 0.07 | 0.044 | 0.22 |
| Acetone | 0.021 | ↑0.22 | 0.622 | −0.02 | 0.127 | 0.19 |
| Glycolate | 0.026 | ↑0.74 | 0.466 | −0.5 | 0.273 | 0.24 |
| Ornithine + arginine + acetate | 0.091 | 0.09 | 0.834 | −0.004 | 0.043 | 0.1 |
| B + BL Group | Phase I vs. Phase II | FC | Phase II vs. Phase III | FC | Phase I vs. Phase III | FC |
| Isoleucine | 0.282 | 0.12 | 0.282 | 0.02 | 0.033 | 0.14 |
| Creatinine | 0.281 | 0.07 | 0.282 | 0.003 | 0.036 | 0.07 |
| Formate | 0.860 | 0.08 | 0.860 | −0.01 | 0.033 | 0.07 |
| 1-methylnicotinamide | 0.517 | 0.05 | 0.517 | −0.01 | 0.009 | 0.04 |
| Malonate | 0.038 | 0.04 | 0.038 | −0.01 | 0.0001 | 0.03 |
| Methanol | 0.281 | −0.1 | 0.282 | −0.25 | 0.0001 | −0.36 |
| Acetone | 0.005 | 0.28 | 0.005 | −0.16 | 0.086 | 0.11 |
| Erythritol | 0.158 | 0.27 | 0.158 | 0.50 | 0.009 | 0.77 |
| Ornith-arginine-acetate | 0.236 | 0.11 | 0.236 | −0.05 | 0.032 | 0.06 |
| 4-hydroxyhippuricacid | 0.302 | 0.24 | 0.302 | 0.13 | 0.033 | 0.37 |
| All Together | Phase I vs. Phase II | FC | Phase II vs. Phase III | FC | Phase I vs. Phase III | FC |
|---|---|---|---|---|---|---|
| proline | 0.018 | 0.32 | 0.886 | 0.02 | 0.014 | 0.34 |
| pyruvate | 0.078 | 0.41 | 0.292 | 0.25 | 0.0006 | 0.65 |
| dimethylglycine | 0.046 | −0.33 | 0.755 | 0.20 | 0.656 | −0.13 |
| phenylalanine | 0.018 | 0.23 | 0.806 | 0.001 | 0.0006 | 0.23 |
| B + BL Group | Phase I vs. Phase II | FC | Phase II vs. Phase III | FC | Phase I vs. Phase III | FC |
| pyruvate | 0.209 | 0.46 | 0.762 | 0.31 | 0.033 | 0.77 |
| phenylalanine | 0.209 | 0.28 | 0.711 | −0.003 | 0.038 | 0.28 |
© 2020 by the authors. Licensee MDPI, Basel, Switzerland. This article is an open access article distributed under the terms and conditions of the Creative Commons Attribution (CC BY) license (http://creativecommons.org/licenses/by/4.0/).
Share and Cite
Ghini, V.; Tenori, L.; Pane, M.; Amoruso, A.; Marroncini, G.; Squarzanti, D.F.; Azzimonti, B.; Rolla, R.; Savoia, P.; Tarocchi, M.; et al. Effects of Probiotics Administration on Human Metabolic Phenotype. Metabolites 2020, 10, 396. https://doi.org/10.3390/metabo10100396
Ghini V, Tenori L, Pane M, Amoruso A, Marroncini G, Squarzanti DF, Azzimonti B, Rolla R, Savoia P, Tarocchi M, et al. Effects of Probiotics Administration on Human Metabolic Phenotype. Metabolites. 2020; 10(10):396. https://doi.org/10.3390/metabo10100396
Chicago/Turabian StyleGhini, Veronica, Leonardo Tenori, Marco Pane, Angela Amoruso, Giada Marroncini, Diletta Francesca Squarzanti, Barbara Azzimonti, Roberta Rolla, Paola Savoia, Mirko Tarocchi, and et al. 2020. "Effects of Probiotics Administration on Human Metabolic Phenotype" Metabolites 10, no. 10: 396. https://doi.org/10.3390/metabo10100396
APA StyleGhini, V., Tenori, L., Pane, M., Amoruso, A., Marroncini, G., Squarzanti, D. F., Azzimonti, B., Rolla, R., Savoia, P., Tarocchi, M., Galli, A., & Luchinat, C. (2020). Effects of Probiotics Administration on Human Metabolic Phenotype. Metabolites, 10(10), 396. https://doi.org/10.3390/metabo10100396