Figure 1.
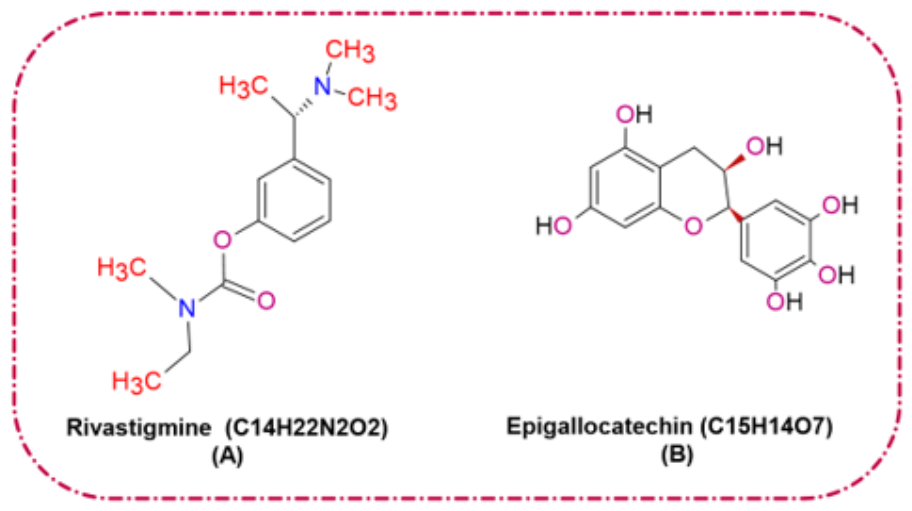
Chemical structures of (A) Rivastigmine (C14H22N2O2) and (B) Epigallocatechin (C15H14O7), illustrating their key functional groups and structural features relevant to their pharmacological activity in Alzheimer’s disease.
Figure 1.
Chemical structures of (A) Rivastigmine (C14H22N2O2) and (B) Epigallocatechin (C15H14O7), illustrating their key functional groups and structural features relevant to their pharmacological activity in Alzheimer’s disease.
Figure 2.
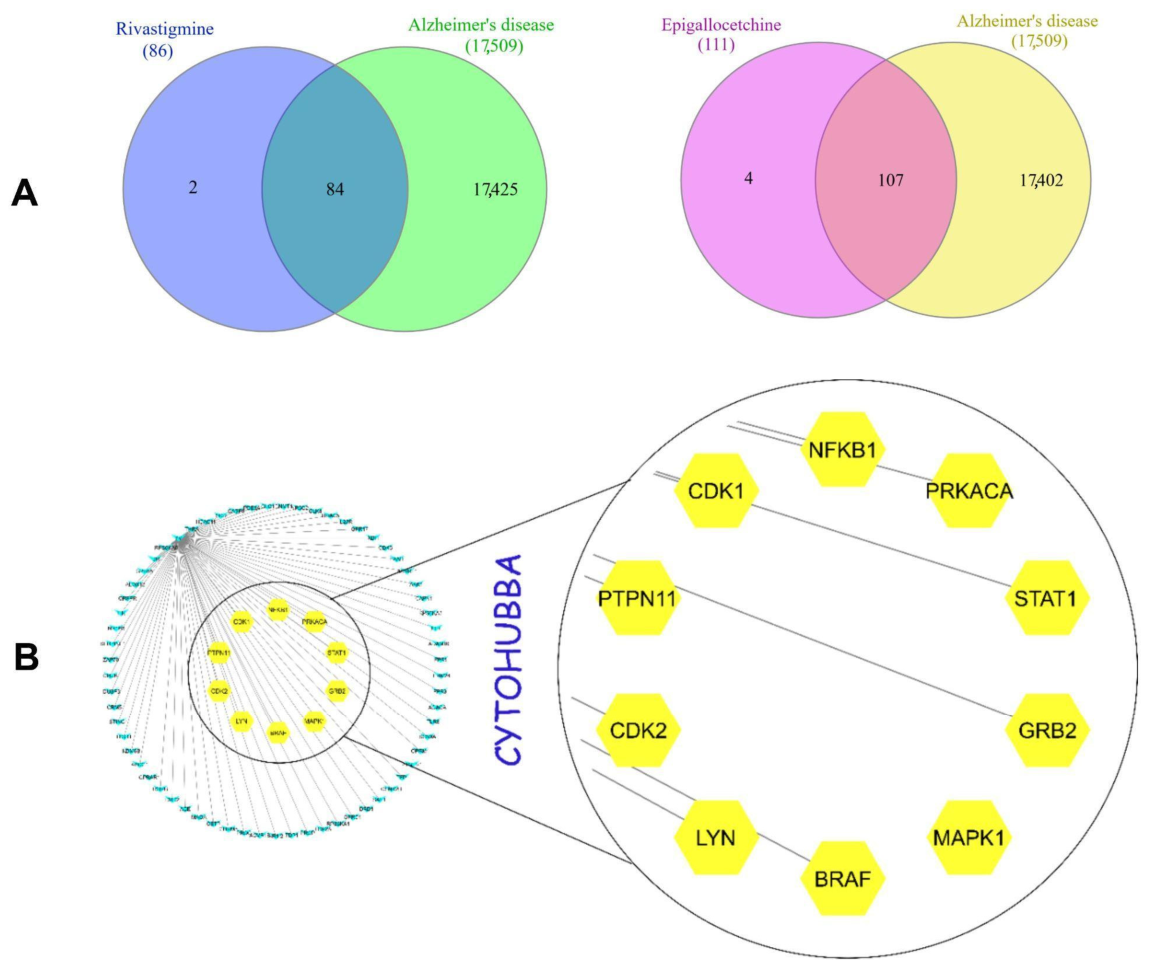
Network-based pharmacology prediction of RVG and EGC targets in AD. (A) shows Venn diagrams and the overlap between predicted targets of RVG and EPG with AD-associated genes, highlighting the common targets considered for further analysis. (B) A PPI network constructed from the overlapping targets using Cytoscape, and the nodes indicate proteins and the edges indicate their functional connectivity. Identification of hub genes using Cytohubba, with highlighted nodes representing the top-ranked genes (CDK2, PTPN11, CDK1, NFKB1, PRKACA, STAT1, GRB2, MAPK1, BRAF, and LYN) based on their degree of connectivity, suggesting their potential regulatory roles in Alzheimer’s disease.
Figure 2.
Network-based pharmacology prediction of RVG and EGC targets in AD. (A) shows Venn diagrams and the overlap between predicted targets of RVG and EPG with AD-associated genes, highlighting the common targets considered for further analysis. (B) A PPI network constructed from the overlapping targets using Cytoscape, and the nodes indicate proteins and the edges indicate their functional connectivity. Identification of hub genes using Cytohubba, with highlighted nodes representing the top-ranked genes (CDK2, PTPN11, CDK1, NFKB1, PRKACA, STAT1, GRB2, MAPK1, BRAF, and LYN) based on their degree of connectivity, suggesting their potential regulatory roles in Alzheimer’s disease.
Figure 3.
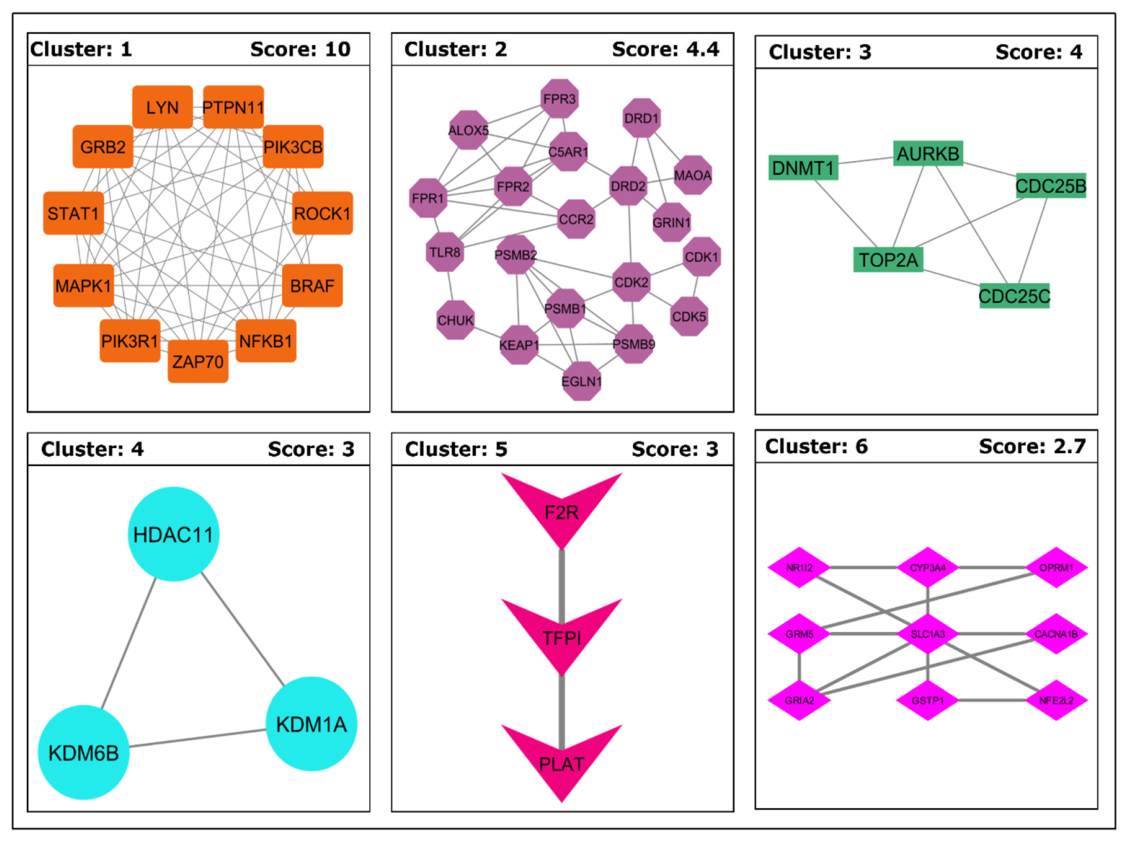
MCODE-based clustering of the RVG-EGC PPI network. Six functional clusters (Clusters 1–6) are extracted from the PPI network by the MCODE in Cytoscape, based on topological connectivity. Nodes represent proteins, while edges denote validated protein–protein interactions. Different node colors indicate individual protein members within each module. Cluster 1 (score: 10) represents the principal seed module and includes key hub proteins such as MAPK1, STAT1, and GRB2. The remaining clusters (Clusters 2–6) correspond to supporting functional modules associated with processes such as drug transport (e.g., ABCC1, SLC19A1) and metabolic regulation.
Figure 3.
MCODE-based clustering of the RVG-EGC PPI network. Six functional clusters (Clusters 1–6) are extracted from the PPI network by the MCODE in Cytoscape, based on topological connectivity. Nodes represent proteins, while edges denote validated protein–protein interactions. Different node colors indicate individual protein members within each module. Cluster 1 (score: 10) represents the principal seed module and includes key hub proteins such as MAPK1, STAT1, and GRB2. The remaining clusters (Clusters 2–6) correspond to supporting functional modules associated with processes such as drug transport (e.g., ABCC1, SLC19A1) and metabolic regulation.
Figure 4.
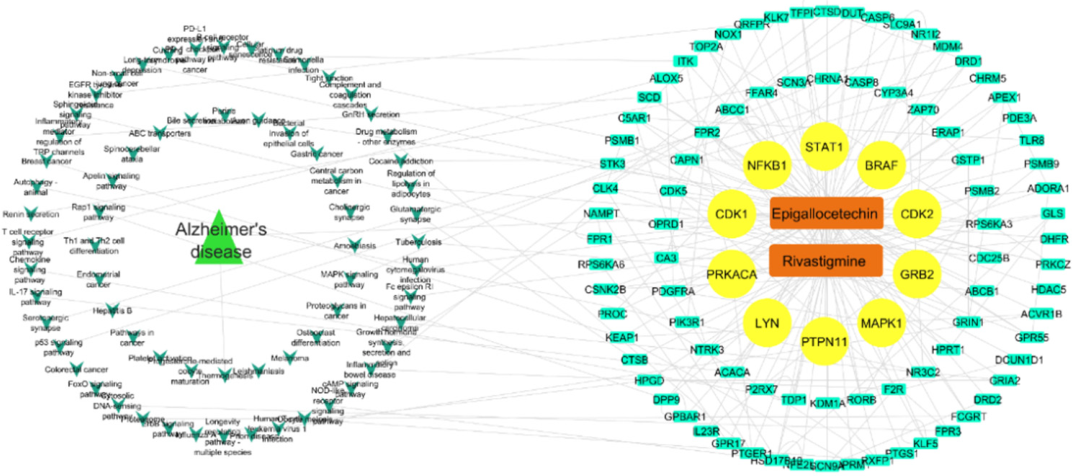
Compound-Target-Pathway (CTP) network of RVG and EGC in AD. The network shows the interactions between RVG and EGC (yellow diamond nodes), their predicted target proteins (blue rectangular nodes), and key hub genes (pink circular nodes), along with enriched signaling pathways (purple triangular nodes). The central orange node represents AD. Edges indicate the relationships between compounds, targets, and pathways, indicating a multi-target and multi-pathway regulatory framework. The highlighted hub genes (e.g., STAT1, MAPK1, NFKB1, PRKACA, GRB2, CDK1, CDK2, BRAF, LYN, and PTPN11) suggest their critical involvement in disease-associated signaling pathways, emphasizing the potential synergistic action of RVG and EGC in modulating AD pathophysiology.
Figure 4.
Compound-Target-Pathway (CTP) network of RVG and EGC in AD. The network shows the interactions between RVG and EGC (yellow diamond nodes), their predicted target proteins (blue rectangular nodes), and key hub genes (pink circular nodes), along with enriched signaling pathways (purple triangular nodes). The central orange node represents AD. Edges indicate the relationships between compounds, targets, and pathways, indicating a multi-target and multi-pathway regulatory framework. The highlighted hub genes (e.g., STAT1, MAPK1, NFKB1, PRKACA, GRB2, CDK1, CDK2, BRAF, LYN, and PTPN11) suggest their critical involvement in disease-associated signaling pathways, emphasizing the potential synergistic action of RVG and EGC in modulating AD pathophysiology.
Figure 5.
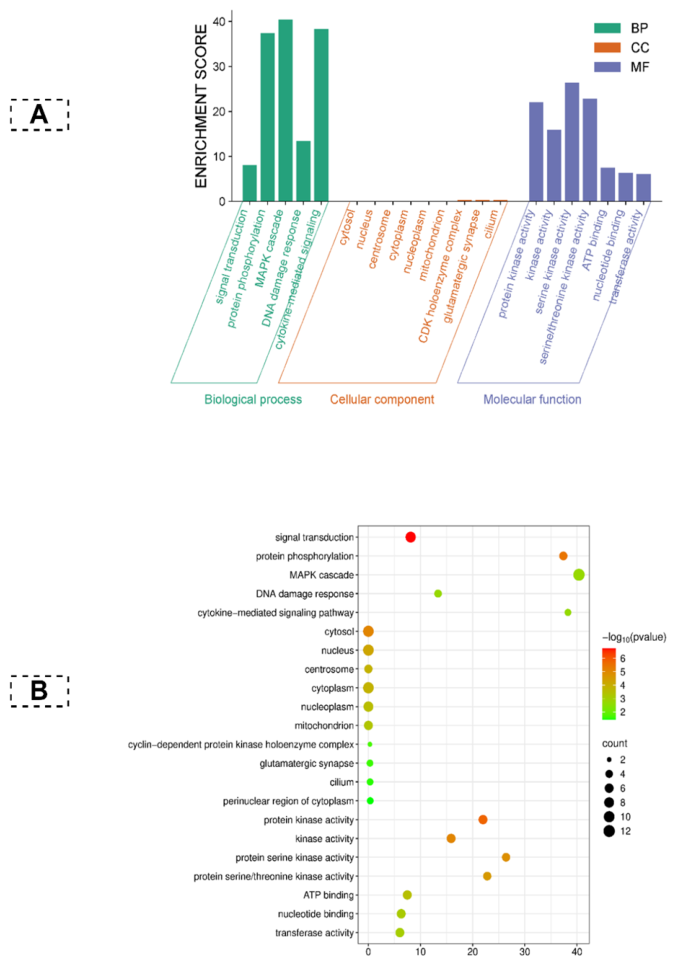
Functional enrichment analysis of RVG and EGC associated with AD. (A) GO enrichment analysis showing the key enriched terms under Biological Process (green), Cellular Component (orange), and Molecular Function (blue). Bar lengths correspond to the enrichment magnitude of each term. (B) Bubble plot representing significantly enriched GO categories; bubble size corresponds to the number of associated genes, and color gradient represents statistical significance based on −log10 (p-value), with darker shades indicating stronger significance.
Figure 5.
Functional enrichment analysis of RVG and EGC associated with AD. (A) GO enrichment analysis showing the key enriched terms under Biological Process (green), Cellular Component (orange), and Molecular Function (blue). Bar lengths correspond to the enrichment magnitude of each term. (B) Bubble plot representing significantly enriched GO categories; bubble size corresponds to the number of associated genes, and color gradient represents statistical significance based on −log10 (p-value), with darker shades indicating stronger significance.
Figure 6.
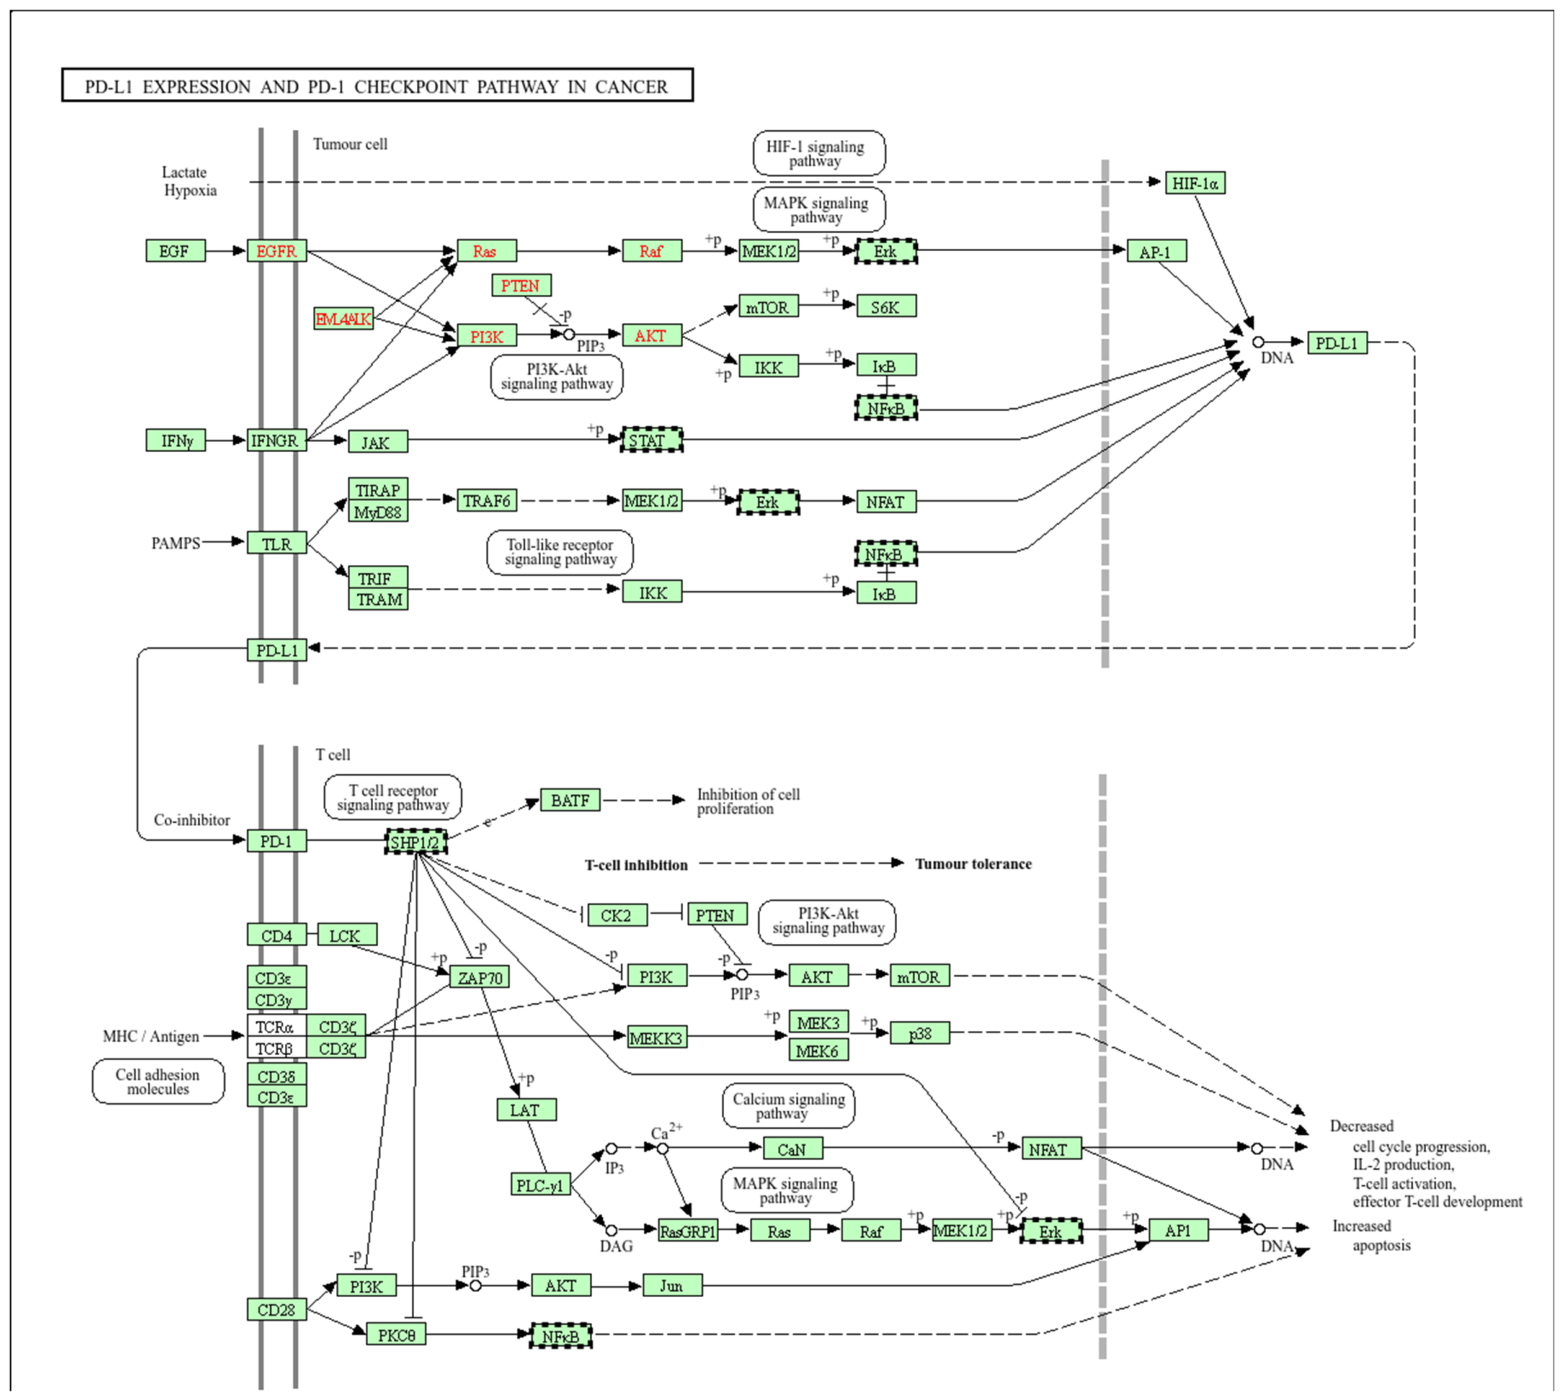
KEGG-derived PD-L1 expression and PD-1 checkpoint signaling pathway identified through DAVID enrichment analysis. Although this canonical pathway is annotated in KEGG as the PD-L1 expression and PD-1 checkpoint pathway in cancer, it is selected because it contains the enriched MAPK1 signaling module identified in this network pharmacology analysis. The highlighted MAPK cascade shows the potential neuroimmune signaling explored in the present AD study rather than indicating a cancer-specific mechanism.
Figure 6.
KEGG-derived PD-L1 expression and PD-1 checkpoint signaling pathway identified through DAVID enrichment analysis. Although this canonical pathway is annotated in KEGG as the PD-L1 expression and PD-1 checkpoint pathway in cancer, it is selected because it contains the enriched MAPK1 signaling module identified in this network pharmacology analysis. The highlighted MAPK cascade shows the potential neuroimmune signaling explored in the present AD study rather than indicating a cancer-specific mechanism.
Figure 7.
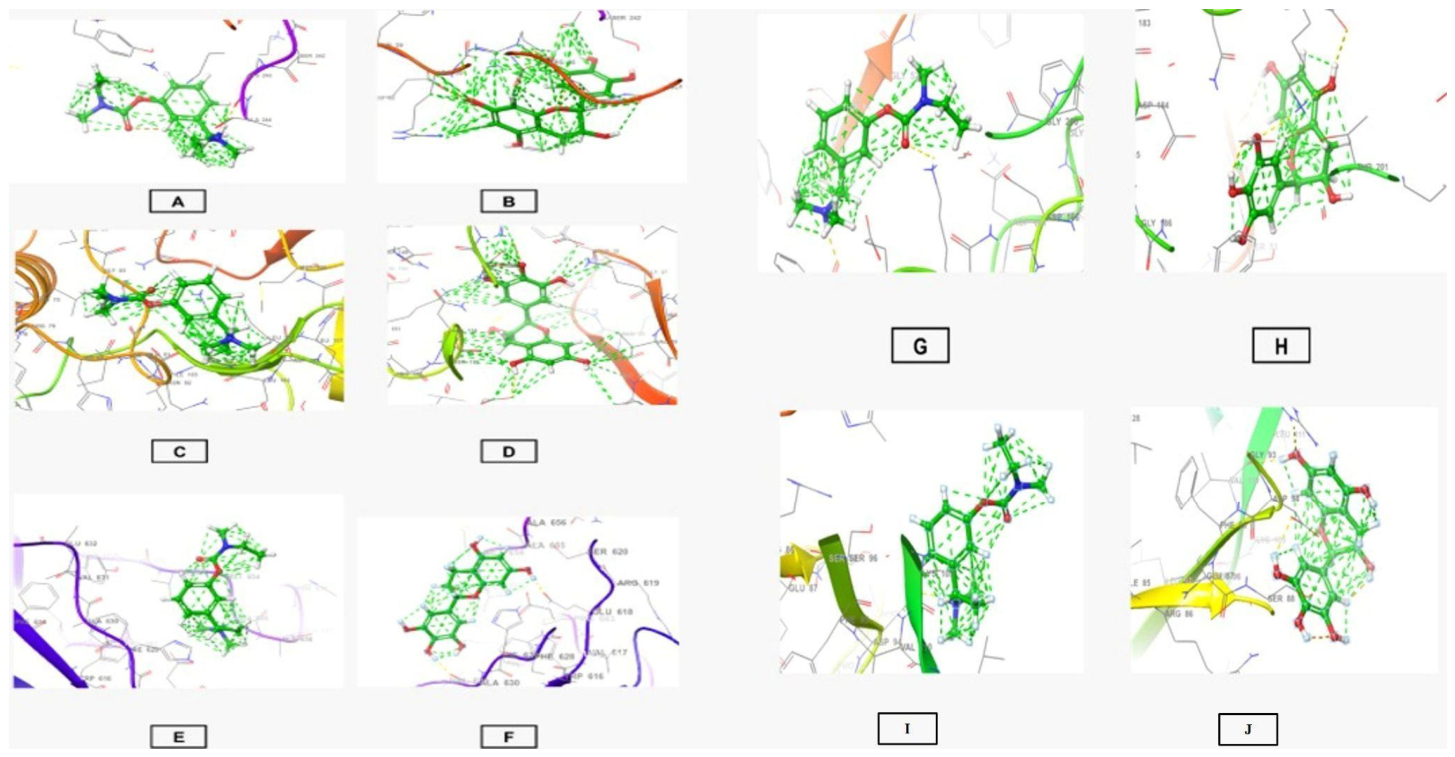
3D protein-ligand interaction poses of RVG and EGC with key AD targets. (A) (NFKB1:RVG), (B) (NFKB1:EGC), (C) (MAPK1:RVG), (D) (MAPK1:EGC), (E) (STAT1:RVG), (F) (STAT1:EGC), (G) (PRKACA:RVG), (H) (PRKACA:EGC), (I) (GRB2:RVG), (J) (GRB2:EGC). Ligands are represented as orange stick structures, and proteins are represented in ribbon form. Green dotted lines represent hydrogen-bond interactions with active position residues.
Figure 7.
3D protein-ligand interaction poses of RVG and EGC with key AD targets. (A) (NFKB1:RVG), (B) (NFKB1:EGC), (C) (MAPK1:RVG), (D) (MAPK1:EGC), (E) (STAT1:RVG), (F) (STAT1:EGC), (G) (PRKACA:RVG), (H) (PRKACA:EGC), (I) (GRB2:RVG), (J) (GRB2:EGC). Ligands are represented as orange stick structures, and proteins are represented in ribbon form. Green dotted lines represent hydrogen-bond interactions with active position residues.
Figure 8.
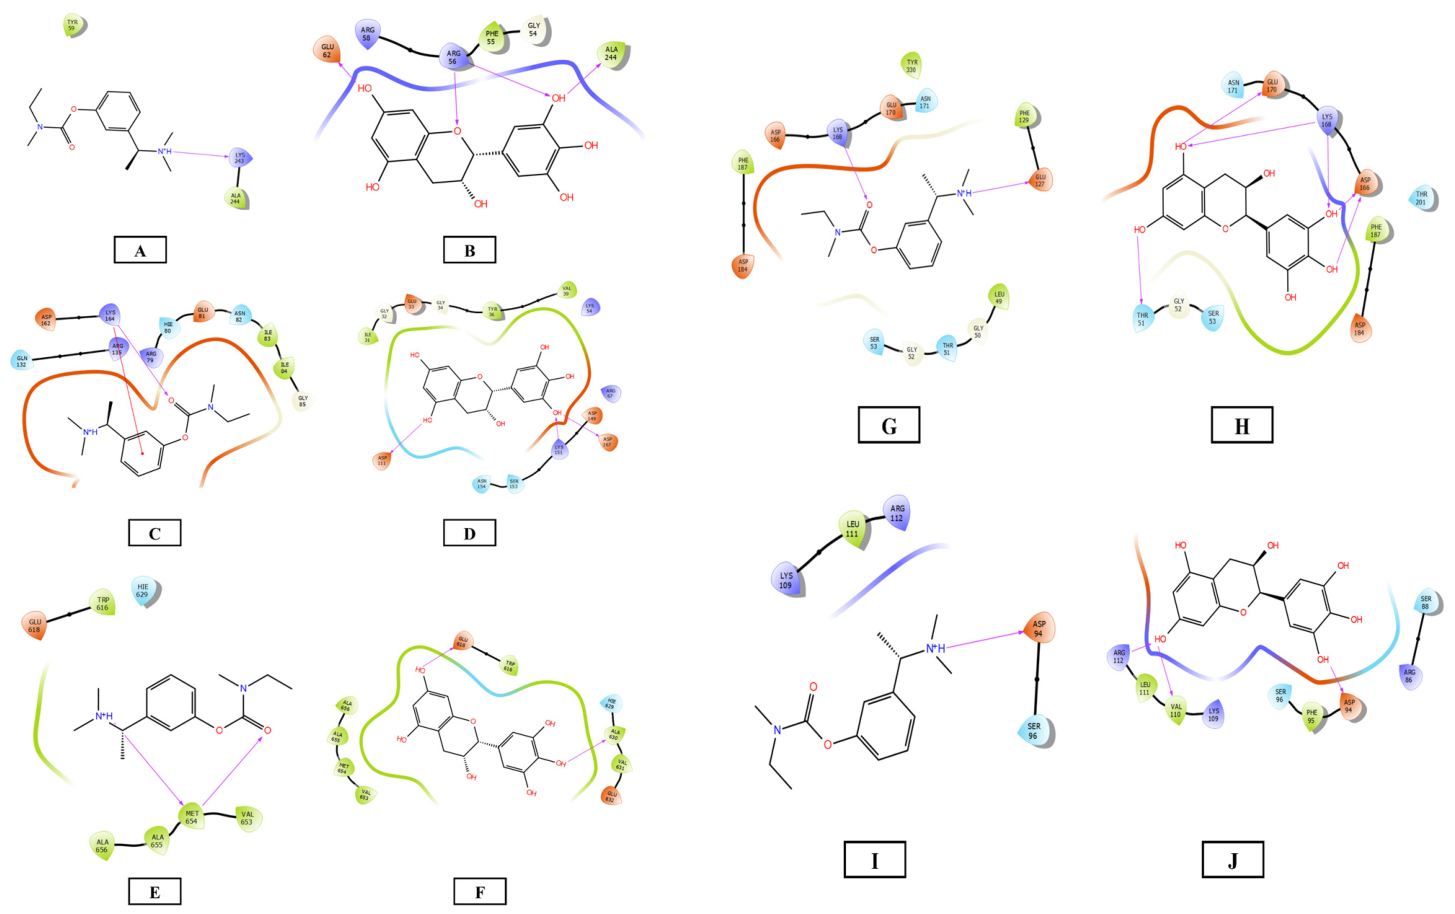
2D protein-ligand interaction poses of RVG and EGC with key AD targets. (A) (NFKB1:RVG), (B) (NFKB1:EGC), (C) (MAPK1:RVG), (D) (MAPK1:EGC), (E) (STAT1:RVG), (F) (STAT1:EGC), (G) (PRKACA:RVG), (H) (PRKACA:EGC), (I) (GRB2:RVG), (J) (GRB2:EGC). Colored spheres show amino acid residues based on their physicochemical characteristics: green indicates hydrophobicity, blue indicates positive charge, red indicates negative charge, and cyan indicates polar residues. Hydrogen bonds formed with backbone or side-chain residues are shown by pink arrows, while green lines correspond to π–cation contacts.
Figure 8.
2D protein-ligand interaction poses of RVG and EGC with key AD targets. (A) (NFKB1:RVG), (B) (NFKB1:EGC), (C) (MAPK1:RVG), (D) (MAPK1:EGC), (E) (STAT1:RVG), (F) (STAT1:EGC), (G) (PRKACA:RVG), (H) (PRKACA:EGC), (I) (GRB2:RVG), (J) (GRB2:EGC). Colored spheres show amino acid residues based on their physicochemical characteristics: green indicates hydrophobicity, blue indicates positive charge, red indicates negative charge, and cyan indicates polar residues. Hydrogen bonds formed with backbone or side-chain residues are shown by pink arrows, while green lines correspond to π–cation contacts.
Figure 9.
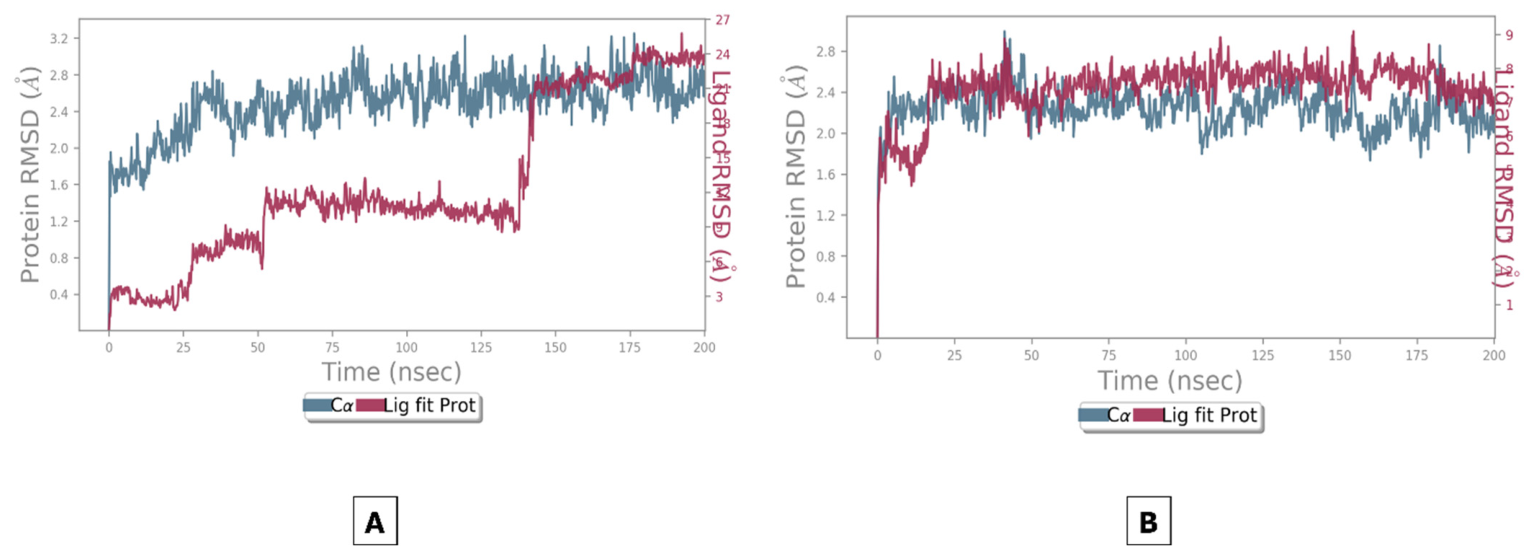
RMSD profiles of Rivastigmine and Epigallocatechin complexes during molecular dynamics simulation. (A) Represents the RVG-MAPK1complex, showing gradual stabilization with significant ligand fluctuations at later simulation time, indicating conformational rearrangement within the binding pocket. (B) Represents the EGC-MAPK1 complex, indicating stable protein and ligand RMSD with minimal deviations, suggesting strong and consistent binding. The blue line indicates the protein backbone (Cα)-RMSD, and the red line indicates ligand-RMSD.
Figure 9.
RMSD profiles of Rivastigmine and Epigallocatechin complexes during molecular dynamics simulation. (A) Represents the RVG-MAPK1complex, showing gradual stabilization with significant ligand fluctuations at later simulation time, indicating conformational rearrangement within the binding pocket. (B) Represents the EGC-MAPK1 complex, indicating stable protein and ligand RMSD with minimal deviations, suggesting strong and consistent binding. The blue line indicates the protein backbone (Cα)-RMSD, and the red line indicates ligand-RMSD.
Figure 10.
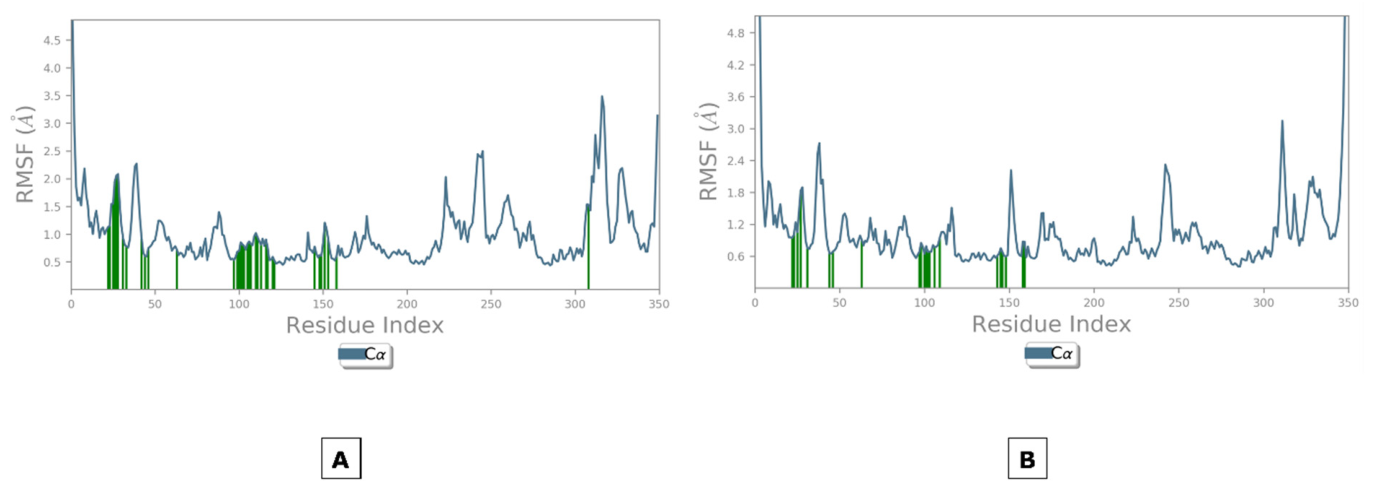
RMSF profiles of Rivastigmine and Epigallocatechin complexes during molecular dynamics simulation. (A) RVG-MAPK1 complex. (B) EGC-MAPK1 complex. The plot represents residue-wise RMSF (Å) of the protein backbone (Cα) over the simulation period.
Figure 10.
RMSF profiles of Rivastigmine and Epigallocatechin complexes during molecular dynamics simulation. (A) RVG-MAPK1 complex. (B) EGC-MAPK1 complex. The plot represents residue-wise RMSF (Å) of the protein backbone (Cα) over the simulation period.
Figure 11.
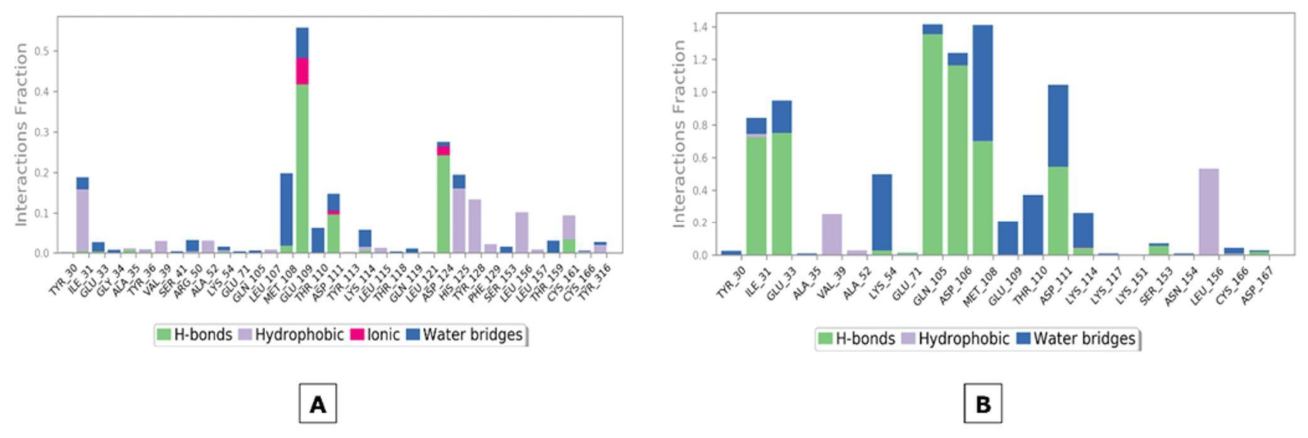
Protein-ligand interaction profiles of RVG and EGC complexes during MD simulation. (A) RVG-MAPK1 complex. (B) EGC-MAPK1 complex. The bars represent interaction fractions of hydrophobic contacts, hydrogen bonds, water bridges, and ionic interactions, formed with individual residues over the simulation period.
Figure 11.
Protein-ligand interaction profiles of RVG and EGC complexes during MD simulation. (A) RVG-MAPK1 complex. (B) EGC-MAPK1 complex. The bars represent interaction fractions of hydrophobic contacts, hydrogen bonds, water bridges, and ionic interactions, formed with individual residues over the simulation period.
Figure 12.
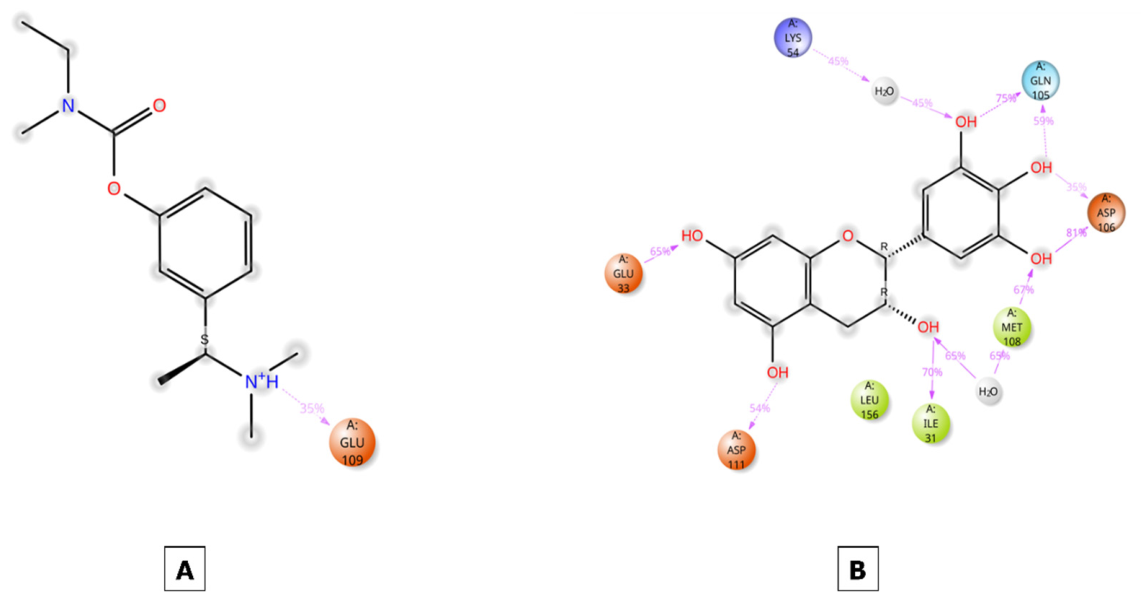
Ligand-protein interaction diagrams of Rivastigmine and Epigallocatechin within the binding site. (A) RVG protein complex. (B) EGC protein complex. Dashed lines represent hydrogen bonds and water-mediated interactions, while colored residues indicate interacting amino acids within the binding pocket.
Figure 12.
Ligand-protein interaction diagrams of Rivastigmine and Epigallocatechin within the binding site. (A) RVG protein complex. (B) EGC protein complex. Dashed lines represent hydrogen bonds and water-mediated interactions, while colored residues indicate interacting amino acids within the binding pocket.
Figure 13.
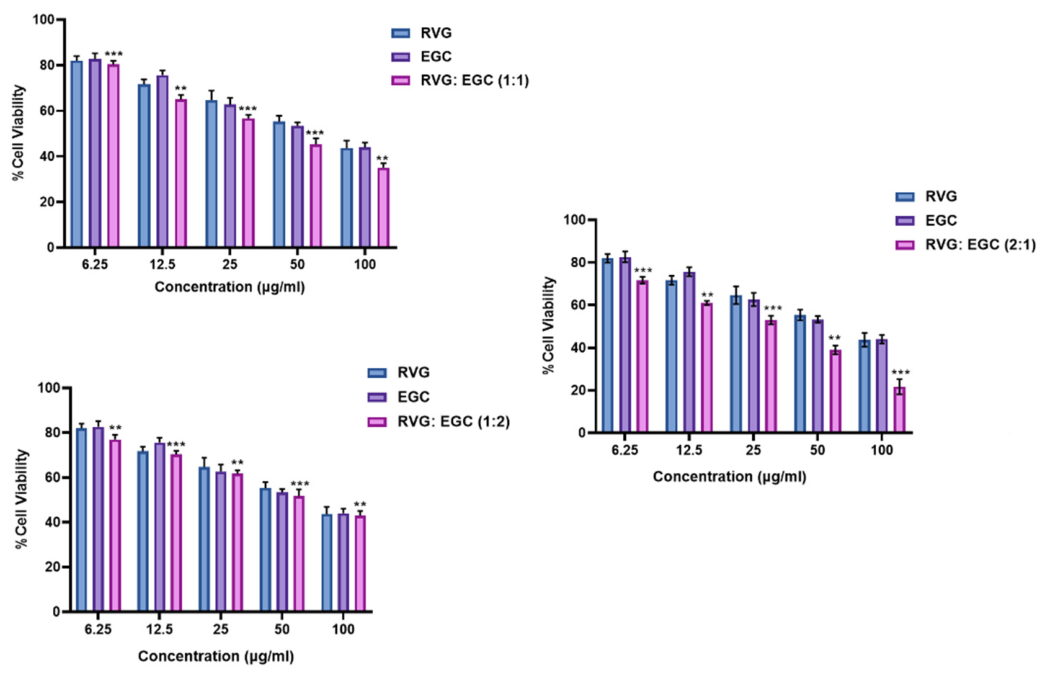
Cytotoxic effects of RVG, EGC, and their combinations. RVG:EGC (1:1), RVG:EGC (1:2), and RVG:EGC (2:1). Cells were treated with increasing concentrations (6.25–100 µg/mL), and the MTT assay determines cell viability. The cytotoxic effects of the combination treatments were compared with those of the respective individual compounds, RVG and EGC, to evaluate the impact of different combination ratios on cell viability. Data are presented as mean ± SE from three independent experiments (n = 3). Statistical analysis was performed using two-way ANOVA followed by Tukey’s post hoc test. ** p < 0.01 and *** p < 0.001 compared with the respective individual drug-treated groups.
Figure 13.
Cytotoxic effects of RVG, EGC, and their combinations. RVG:EGC (1:1), RVG:EGC (1:2), and RVG:EGC (2:1). Cells were treated with increasing concentrations (6.25–100 µg/mL), and the MTT assay determines cell viability. The cytotoxic effects of the combination treatments were compared with those of the respective individual compounds, RVG and EGC, to evaluate the impact of different combination ratios on cell viability. Data are presented as mean ± SE from three independent experiments (n = 3). Statistical analysis was performed using two-way ANOVA followed by Tukey’s post hoc test. ** p < 0.01 and *** p < 0.001 compared with the respective individual drug-treated groups.
Figure 14.
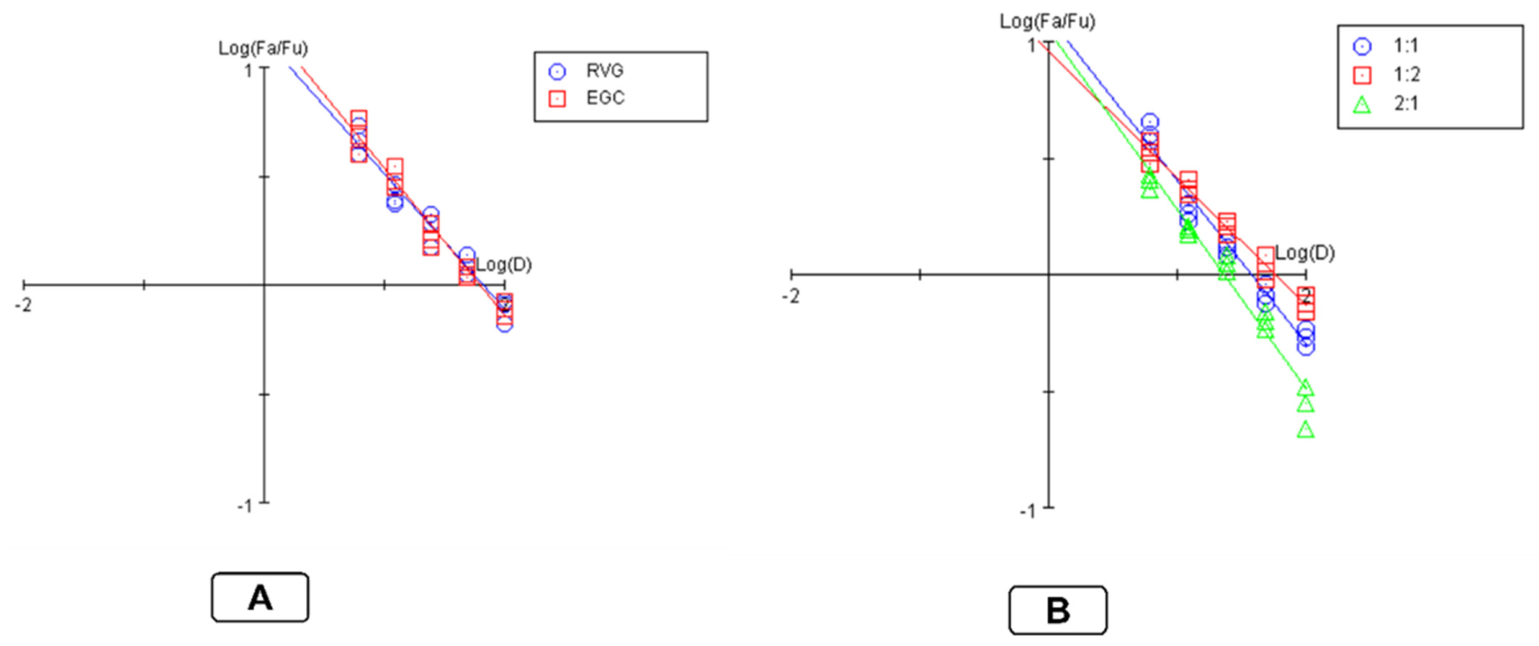
Median-effect plots for the dose–effect relationship. (A) Represents the median-effect plots of the individual compounds, RVG and EGC. (B) Shows the median-effect plots for the fixed-ratio combinations of RVG and EGC: blue line (1:1), red line (1:2), and green line (2:1). The combination curves exhibit a leftward shift relative to the monotherapy curves, indicating increased effects at lower concentrations. The plots were generated using CompuSyn software based on the median-effect principle to characterize the dose–response relationships of individual compounds and their combinations.
Figure 14.
Median-effect plots for the dose–effect relationship. (A) Represents the median-effect plots of the individual compounds, RVG and EGC. (B) Shows the median-effect plots for the fixed-ratio combinations of RVG and EGC: blue line (1:1), red line (1:2), and green line (2:1). The combination curves exhibit a leftward shift relative to the monotherapy curves, indicating increased effects at lower concentrations. The plots were generated using CompuSyn software based on the median-effect principle to characterize the dose–response relationships of individual compounds and their combinations.
Figure 15.
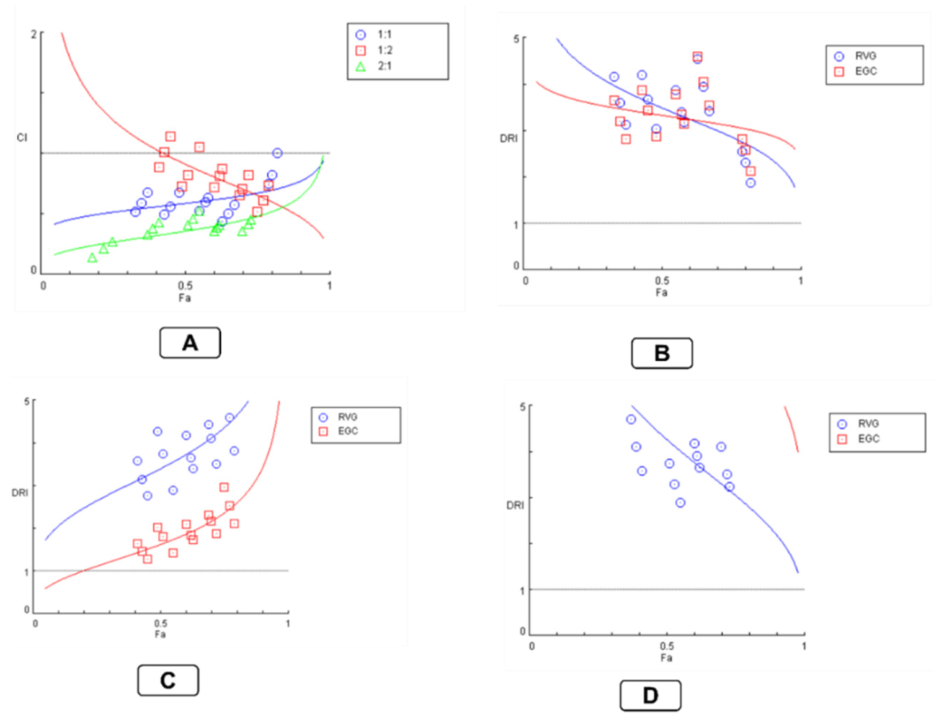
CompuSyn-generated plots showing (A) Fa-CI analysis of RVG and EGC combinations at fixed ratios (1:1, 1:2, and 2:1). (B–D) Dose reduction index (DRI) plots showing the dose reduction potential of RVG and EGC across the tested combinations: (B) 1:1, (C) 1:2, and (D) 2:1.
Figure 15.
CompuSyn-generated plots showing (A) Fa-CI analysis of RVG and EGC combinations at fixed ratios (1:1, 1:2, and 2:1). (B–D) Dose reduction index (DRI) plots showing the dose reduction potential of RVG and EGC across the tested combinations: (B) 1:1, (C) 1:2, and (D) 2:1.
Figure 16.
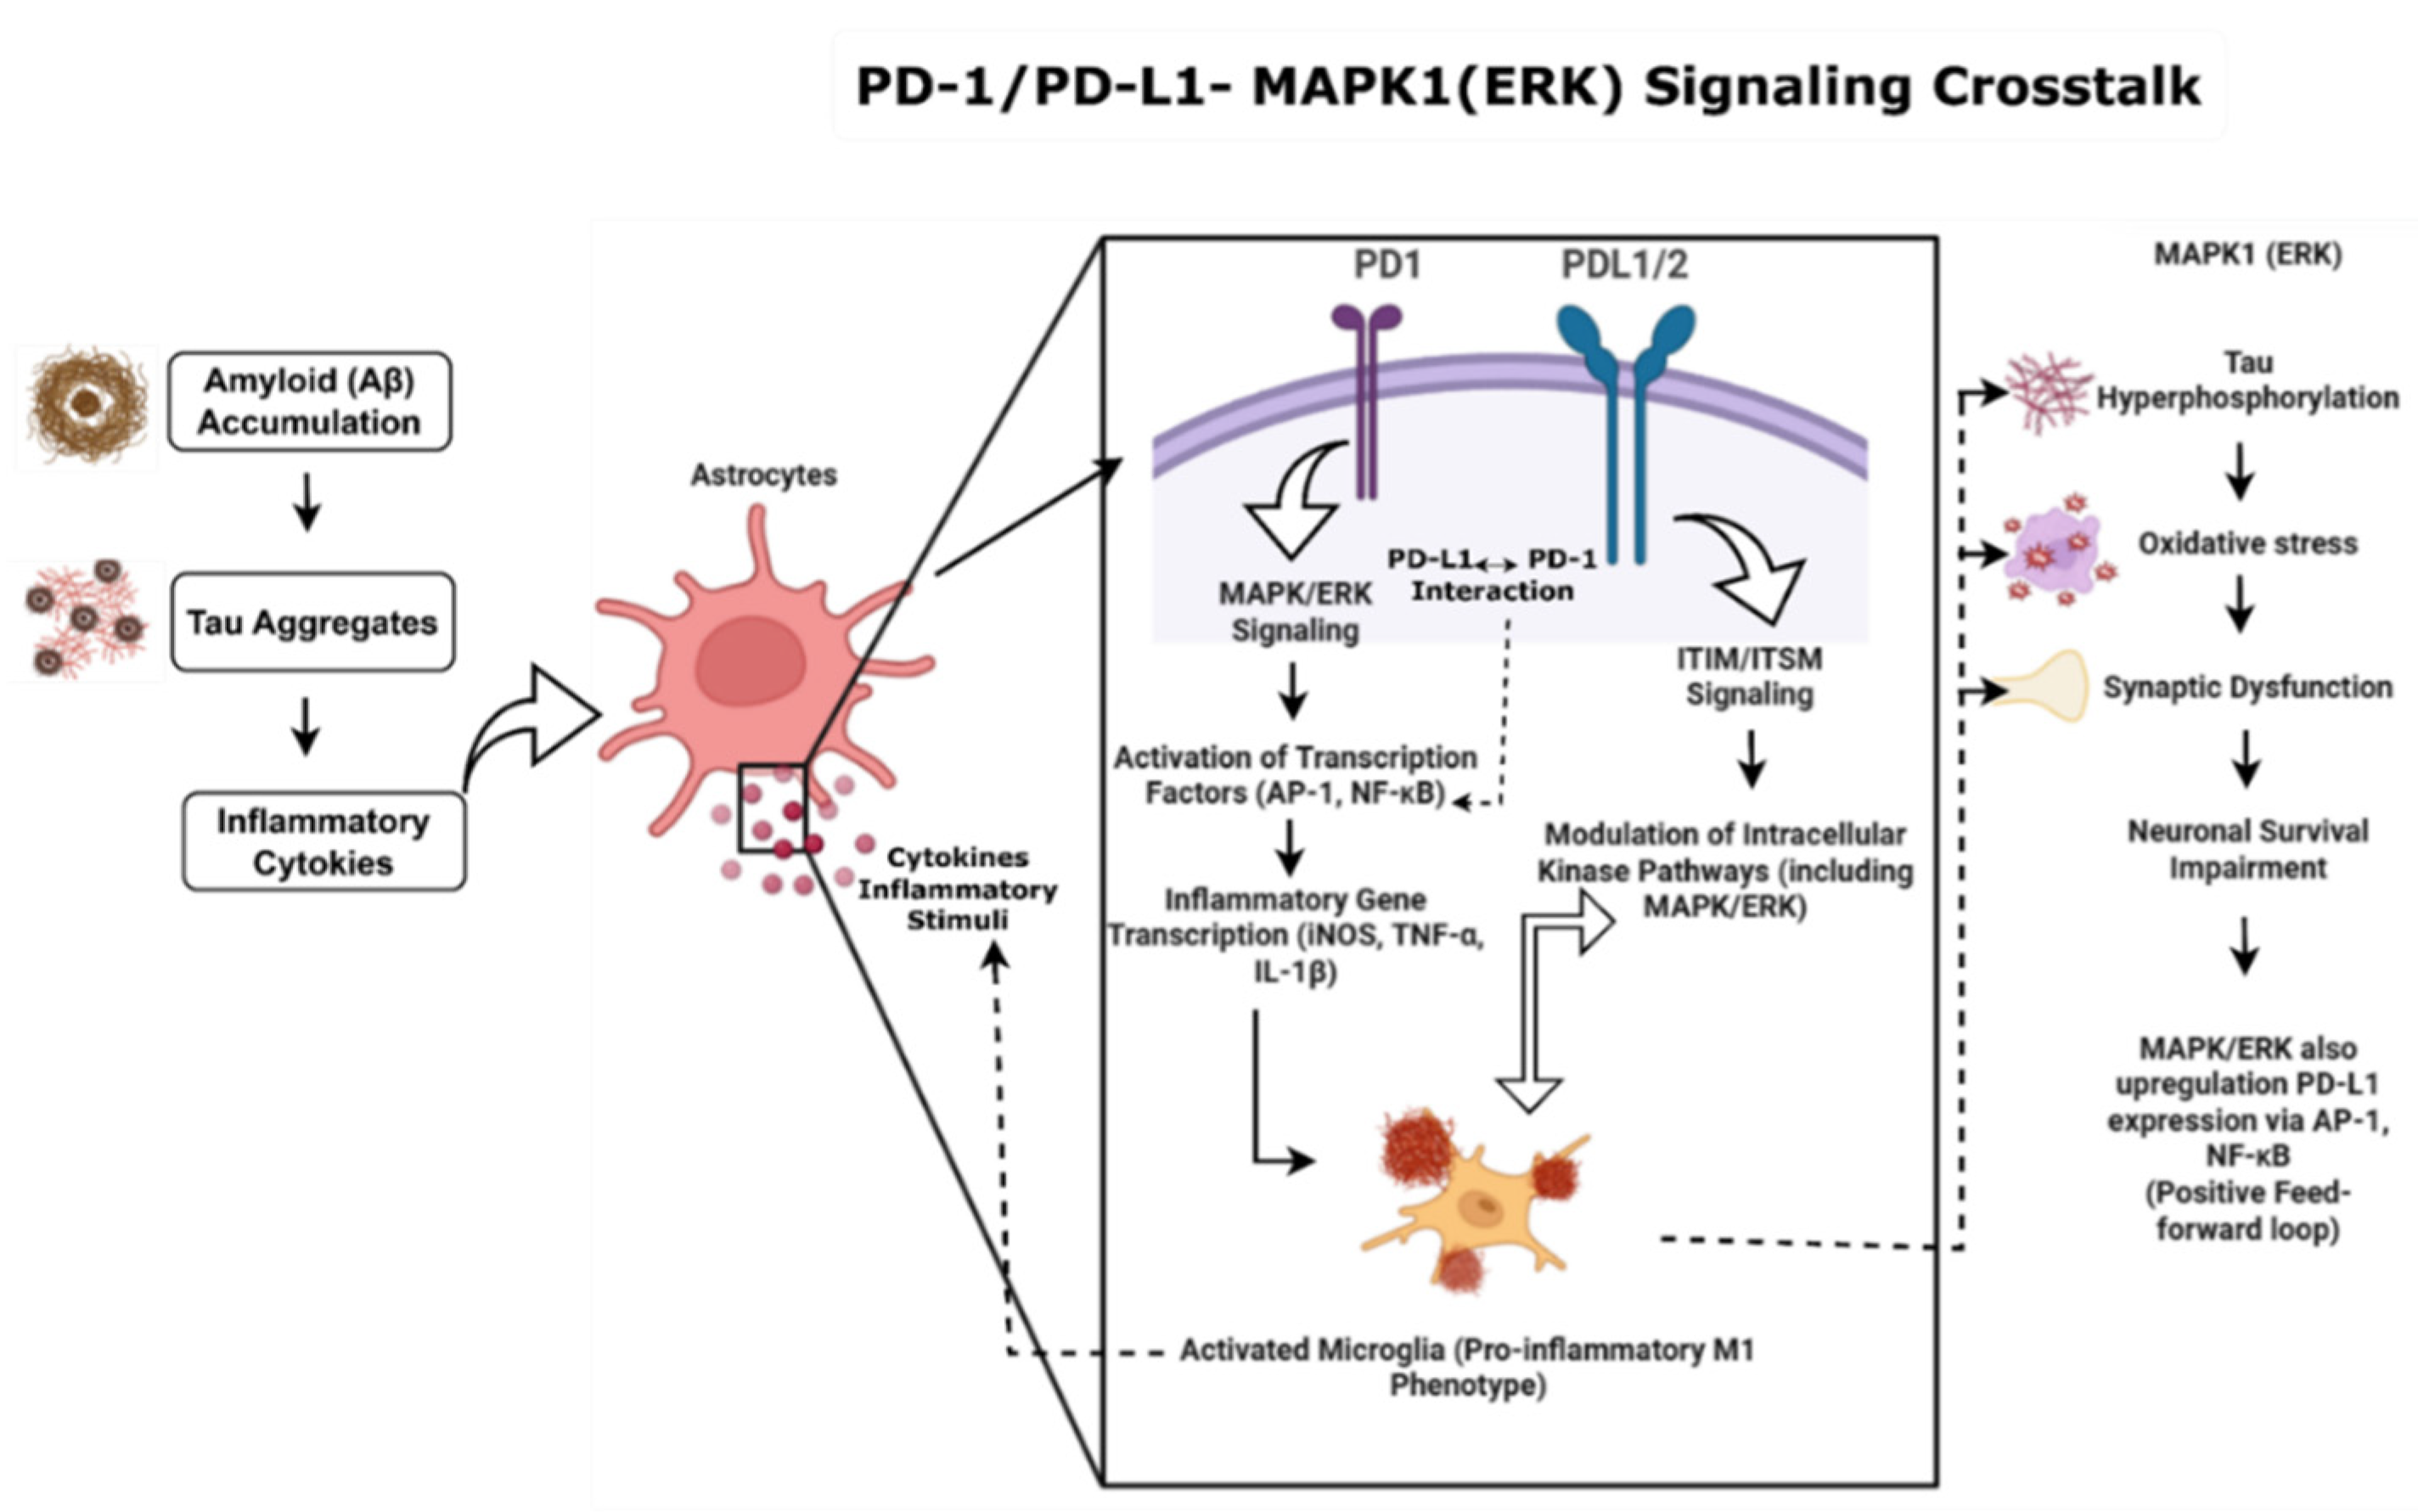
PD-1/PD-L1-MAPK1 (ERK) signaling crosstalk in AD. Amyloid-β (Aβ) accumulation, tau aggregation, and inflammatory cytokines activate astrocytes and microglia, promoting PD-1/PD-L1 signaling and MAPK1 (ERK) pathway activation. This crosstalk enhances AP-1/NF-κB-mediated inflammatory gene expression, leading to increased production of pro-inflammatory mediators, microglial activation, tau hyperphosphorylation, oxidative stress, synaptic dysfunction, and neuronal survival impairment. MAPK1 (ERK) signaling may also upregulate PD-L1 expression, forming a positive feed-forward loop that sustains neuroinflammation and contributes to Alzheimer’s disease progression.
Figure 16.
PD-1/PD-L1-MAPK1 (ERK) signaling crosstalk in AD. Amyloid-β (Aβ) accumulation, tau aggregation, and inflammatory cytokines activate astrocytes and microglia, promoting PD-1/PD-L1 signaling and MAPK1 (ERK) pathway activation. This crosstalk enhances AP-1/NF-κB-mediated inflammatory gene expression, leading to increased production of pro-inflammatory mediators, microglial activation, tau hyperphosphorylation, oxidative stress, synaptic dysfunction, and neuronal survival impairment. MAPK1 (ERK) signaling may also upregulate PD-L1 expression, forming a positive feed-forward loop that sustains neuroinflammation and contributes to Alzheimer’s disease progression.
Table 1.
Drug-likeness properties of RVG and EGC.
Table 1.
Drug-likeness properties of RVG and EGC.
| Compounds Name | Molecular Weight (MW) | Hydrogen Bond Acceptor (HBA) | Hydrogen Bond Donor (HBD) | Lipophilicity (LogP) | Lipinski Rule | No. of Rotatable Bonds | Topological Polar Surface Area (TPSA) |
|---|
| RVG | 250.17 | 3 | 0 | 1.86 | 0 | 4 | 25.09 |
| EGC | 306.07 | 7 | 6 | 0.26 | 1 | 1 | 105.93 |
Table 2.
Computationally derived ADME and safety parameters of RIV and EPI.
Table 2.
Computationally derived ADME and safety parameters of RIV and EPI.
| ADME/Toxicity Property | Reference Criterion for Favourability | RIV | EPI |
|---|
| Intestinal absorption (%) | >30% considered good absorption | 88.456% | 54.128% |
| Skin sensitization | Absence indicates safety | No | No |
| Blood–brain barrier permeability (BBB) | >0.3 indicates strong BBB | 0.508 | −1.377 |
| CNS permeability (log BB) | log BB > −1 shows CNS penetration | −2.255 | −3.507 |
| hERG I channel inhibition | Absence suggests safety | No | No |
| Acute oral toxicity (LD50 mol/kg) | >1 suggests low toxicity | 3.402 | 2.492 |
| Chronic oral toxicity (LOAEL log mg/kg bw/day) | <2 indicates reduced chronic toxicity | 1.163 | 2.927 |
| Liver Toxicity | Absence indicates hepatosafety | No | No |
Table 3.
Hub genes and their scores.
Table 3.
Hub genes and their scores.
| Gene | Code |
|---|
| NFKB1 | 40 |
| MAPK1 | 31 |
| STAT1 | 28 |
| PRKACA | 24 |
| GRB2 | 24 |
| LYN | 23 |
| PTPN11 | 22 |
| BRAF | 22 |
| CDK2 | 21 |
| CDK1 | 21 |
Table 4.
Analysis of RVG and EGC binding affinities in comparison with co-crystal ligands.
Table 4.
Analysis of RVG and EGC binding affinities in comparison with co-crystal ligands.
| Targets | PDB | Docking Energy (kcal/mol) | Interacting Residues | RMSD Range (Å) | Validation Method |
|---|
| NFKB1 | 8TQD | −5.02 | GLU 62, ARG 56, ALA 244, ARG 58, LYS 243 | 1.10 Å | Redocking of the co-crystallized ligand |
| MAPK1 | 1TVO | −7.01 | ASP 111, LYS 151, ASP 167, LYS 164 | 1.24 Å |
| STAT1 | 1YVL | −5.63 | GLU 618, ALA 630, MET 654 | 0.82 Å |
| PRKACA | 2GU8 | −8.22 | GLU 170, LYS 168, ASP 166, THR 51, LYS 168, GLU 127 | 0.60 Å |
| GRB2 | 7MPH | −4.90 | ARG 112, VAL 110, ASP 94 | 1.50 Å |
Table 5.
Binding scores of RVG and EGC toward AD target proteins.
Table 5.
Binding scores of RVG and EGC toward AD target proteins.
| Target | PDB | Ligand Name | Docking Energy (kcal/mol) | Binding Residues |
|---|
| NFKB1 | 8TQD | RIV | −7.94 | LYS 243, ALA 244, TYR 59 |
| EPI | −6.79 | GLU 62, ARG 56, ALA 244, ARG 58, PHE 55, GLY 54 |
| MAPK1 | 1TVO | RIV | −8.63 | LYS 164, ASP 162, GLN 132, ARG 135, ARG 79, HIE 80, GLU 81, ASN 82, ILE 83, ILE 84, GLY 85 |
| EPI | −7.32 | ASP 111, LYS 151, ASP 167, ASN 154, SER 153, ASP 149, ARG 67, ILE 31, GLY 32, GLU 33, GLY 34, TYR 36, VAL 39, LYS 54 |
| STAT1 | 1YVL | RIV | −5.28 | MET 654, ALA 656, ALA 655, VAL 653, GLU 618, TRP 616, HIE 629 |
| EPI | −6.61 | GLU 618, ALA 630, TRP 616, HIE 629, VAL 631, GLU 632, ALA 656, ALA 655, MET 654, VAL 653 |
| PRKACA | 2GU8 | RIV | −4.81 | LYS 168, GLU 127, ASP 166, GLU170, ASN 171, TYR 330, PHE 187, ASP 184, PHE 129, SER 53, GLY 52, THR 51, GLY 50, LEU 49 |
| EPI | −4.61 | GLU 170, LYS 168, ASP 166, THR 51, GLY 52, SER 53, THR 201, PHE 187, ASP 184, ASN 171 |
| GRB2 | 7MPH | RIV | −3.74 | ASP 94, SER 96, LYS 109, LEU 111, ARG 112 |
| EPI | −3.49 | ARG 112, VAL 110, ASP 94, LEU 111, LYS 109, SER 96, PHE 95, SER 88, ARG 86 |
Table 6.
Protein-ligand interaction patterns and bond lengths of RIV and EPI.
Table 6.
Protein-ligand interaction patterns and bond lengths of RIV and EPI.
| Target | PDB | Ligand Name | Type of Interaction | Binding Residue | Ligand Atom (or) Ring | Predicted Distance (Å) |
|---|
| NFKB1 | 8TQD | RIV | Conventional H-bond Interaction | LYS 243 | H atom | 5.68 |
| EPI | GLU 62, ARG 56, ALA 244, | H atom | 4.42 |
| O atom | 4.29 |
| H atom | 4.47 |
| MAPK1 | 1TVO | RIV | Conventional H-bond | LYS 164 | Benzene ring | 5.96 |
| O atom | 5.36 |
| EPI | ASP 111, LYS 151, ASP 167 | H atom | 4.46 |
| H atom | 5.79 |
| H atom | 4.37 |
| STAT1 | 1YVL | RIV | Conventional H-bond Interaction | MET 654 | H atom | 5.42 |
| O atom | 4.46 |
| EPI | GLU 618, ALA 630 | H atom | 4.42 |
| H atom | 4.08 |
| PRKACA | 2GU8 | RIV | Conventional H-bond Interaction | GLU 127
LYS 168 | H atom | 5.66 |
| O atom | 6.04 |
| EPI | LYS 168, ASP 166, GLU170 | O atom | 5.21 |
| H atom | 4.53 |
| H atom | 4.13 |
| GRB2 | 7MPH | RIV | Conventional H-bond | ASP 94 | H atom | 4.02 |
| EPI | ARG 112, VAL 110, ASP 94 | H atom | 3.43 |
| H atom | 4.70 |
| H atom | 3.37 |
Table 7.
Median-effect plot parameters.
Table 7.
Median-effect plot parameters.
| Treatment | Median-Effect Dose, Dm (µM) | Slope, m | Correlation Coefficient, r |
|---|
| RVG | 66.5927 | −0.6233 | −0.9800 |
| EGC | 63.5688 | −0.6709 | −0.9840 |
| RVG:EGC (1:1) | 38.2236 | −0.7019 | −0.9843 |
| RVG:EGC (1:2) | 58.8297 | −0.5457 | −0.9895 |
| RVG:EGC (2:1) | 23.4602 | −0.7704 | −0.9778 |
Table 8.
Combination index and dose reduction parameters.
Table 8.
Combination index and dose reduction parameters.
| Fa (Effect Level) | Combination | CI Value | RVG Dose (µM) | EGC Dose (µM) |
|---|
| 0.50 (ED50) | 1:1 | 0.58764 | 19.1118 | 19.1118 |
| 1:2 | 0.91144 | 19.6099 | 39.2198 |
| 2:1 | 0.35788 | 15.6402 | 7.82008 |
| 0.75 (ED75) | 1:1 | 0.67289 | 3.99544 | 3.99544 |
| 1:2 | 0.65301 | 2.61924 | 5.23848 |
| 2:1 | 0.48085 | 3.75766 | 1.87883 |
| 0.90 (ED90) | 1:1 | 0.77351 | 0.83527 | 0.83527 |
| 1:2 | 0.46953 | 0.34984 | 0.69969 |
| 2:1 | 0.64825 | 0.90281 | 0.45140 |