Article

High Drug Loading of Amorphous Solid Dispersion by Hot Melt Extrusion: The Role of Magnesium Aluminometasilicate (Neusilin® US2)

by
Nithin Vidiyala
1,
Pavani Sunkishala
2,
Prashanth Parupathi
3,
Preethi Mandati
4,
Srujan Kumar Mantena
5,
Raghu Rami Reddy Kasu
6 and
Dinesh Nyavanandi
7,*
1
Drug Product Development, Sciegen Pharmaceuticals, Hauppauge, NY 11788, USA
2
Process Validation, PCI Pharma Services, Bedford, NH 03110, USA
3
Division of Pharmaceutical Sciences, Arnold & Marie Schwartz College of Pharmacy and Health Sciences, Long Island University, Brooklyn, NY 11201, USA
4
Department of Pharmaceutics and Drug Delivery, School of Pharmacy, University of Mississippi, Oxford, MS 38677, USA
5
Institute of Pharmaceutical Sciences & Research, Bhagwant University, Ajmer 305023, India
6
RK Pharma Inc., Pearl River, NY 10965, USA
7
Small Molecule Drug Product Development, Cerevel Therapeutics, Cambridge, MA 02141, USA
*
Author to whom correspondence should be addressed.
Sci. Pharm. 2025, 93(3), 30; https://doi.org/10.3390/scipharm93030030
Submission received: 17 May 2025 / Revised: 10 July 2025 / Accepted: 11 July 2025 / Published: 16 July 2025

Abstract

The objective of the current research is to investigate the role of Neusilin US2 as a porous carrier for improving the drug loading and stability of Ezetimibe (EZB) by hot melt extrusion (HME). The amorphous solid dispersions (ASDs) were developed from 10–40% of drug loading using Kollidon VA 64 (Copovidone) as a polymer matrix and Neusilin US2 as a porous carrier. The solid-state characterization of EZB was studied using differential scanning calorimetry (DSC), powder X-ray diffraction (PXRD), and Fourier transform infrared spectroscopy (FTIR). The formulation blends were characterized for flow properties, and CTC (compressibility, tabletability, compactibility) profile. The in-vitro drug release profiles were studied in 0.1 N HCl (pH 1.2). The incorporation of Neusilin US2 has facilitated the development of ASDs up to 40% of drug loading. The CTC profile has demonstrated excellent tabletability for the ternary (EZB, copovidone and Neusilin) dispersions over binary dispersion (EZB and copovidone) formulations. The tablet formulations with binary (20%) and ternary (30% and 40%) dispersions have demonstrated complete dissolution of the drug in 30 min in 0.1 N HCl (pH 1.2). The incorporation of copovidone has prevented the recrystallization of the drug in the solution state. Upon storage of formulations at accelerated conditions, the stability of ternary dispersion tablets was preserved attributing to the entrapment of the drug within Neusilin pores thereby inhibiting molecular mobility. Based on the observations, the current research concludes that it is feasible to incorporate Neusilin US2 to improve the drug loading and stability of ASD systems.

1. Introduction

Over a few decades, poor solubility of drug substances has been the major challenge being faced by the pharmaceutical industries. Incomplete solubility of the drug substance limits the oral drug bioavailability, thereby requiring higher strengths to achieve the desired plasma concentration or switching to an alternative route or dosage regimen [1,2,3,4,5,6]. Failure to improve the solubility of the drug substance results in alternate administration routes, such as intravenous injections. Among various dosage forms, oral medications are widely preferred by the patient population due to various advantages such as low cost, ease of carry, self-administration, and no pain [7,8,9]. The majority of the medications available in the market belong to the oral route of administration. Among all the medications approved by the Food and Drug Administration (FDA) each year, around 50–60% of them belong to oral medications such as tablets, capsules, powder sachets, and liquids. Developing medications that need to be administered through other routes might not be completely in line with patient compliance. Various studies have been published where the patients did not adhere to the prescription medications, attributing to the route of administration limitations. Thus, improving solubility and oral bioavailability is of utmost importance for the pharmaceutical industries in developing patient-friendly medication [10,11,12,13,14].
To date, a lot of research has been conducted and is ongoing across academia and pharmaceutical industries, either alone or in collaboration, aiming to develop platforms for improving the solubility of drug substances [15,16,17,18]. At least 40% of the molecules within the developmental pipeline are claimed to be poorly soluble. During early drug discovery, following the lead compound identification, the researchers will conduct a wide range of experiments to improve and optimize the physicochemical properties of the drug substance, such as solubility, stability, and toxicity [19,20,21,22,23]. Failure to improve the solubility by structural modifications will result in the initiation of polymorph, salt, and co-crystal screening to identify any alternate form of the drug with better properties [24,25,26,27]. If no alternate form is identified, then the only option which is available to the developmental scientist is to improve the solubility of the drug substance by employing any of the formulation strategies such as micronization, complexation, pH modification, lipid-based systems, and enabling formulations (amorphous solid dispersions; ASDs) [28,29,30,31].
In today’s market, various medications for poorly soluble drug substances are available in the form of ASDs. Within ASDs, the drug substance is molecularly dispersed within a carrier matrix, which is usually a polymer [32,33,34,35,36]. In ASDs, the drug exists in a high-energy state and tends to recrystallize over a period of time due to various factors such as poor miscibility and storage conditions [37,38,39,40,41]. Thus, highly viscous polymers are used to dissolve and entrap the drug in a molecular state, thereby preventing recrystallization and improving stability. The miscibility of drugs and polymers plays an important role in developing a stable amorphous system [42,43,44,45,46]. High drug load remains to be challenging due to poor miscibility and stability of the ASDs. The ASDs are mostly manufactured by hot melt extrusion (HME) or spray drying (SD) platforms and mechanochemistry which is an emerging approach in the recent years [47].
The main objective of current research is to investigate the role of magnesium aluminometasilicate (Neusilin® US2) in improving the drug load and stability of ASDs manufactured by employing the HME process. A limited and incomplete resources are available for developing Neusilin based ASDs using HME platform. Ezetimibe (EZB), belonging to the biopharmaceutical classification system (BCS) class II (poorly solubility and high permeability), has been selected as a model active pharmaceutical ingredient (API, throughout the manuscript the drug will be labeled as “EZB”). EZB is a first-in-class cholesterol absorption inhibitor. It inhibits the absorption of cholesterol in the small intestine by blocking the NPC1L1 transporter protein. The structure and physicochemical properties of EZB are shown in Figure 1. EZB is a neutral to weakly acidic drug that remains unionized throughout the physiological pH (1.2–7.4). It has a phenolic functional group (-OH) that is responsible for its weak acidic nature. A hydrophilic polymer, Kollidon® VA 64 (PVP VA 64, copovidone), was selected as a matrix carrier. PVP VA 64 is most widely employed in developing ASD formulations. Between 2012 and 2023, out of 37 approved products, PVP VA64 was employed in 18 products. Additionally, out of 37 products, the HME process was employed for 13 products, of which 92% of products were manufactured employing PVP VA 64 as a polymeric carrier [4]. The drug EZB is a fast recrystallizer; incorporation of PVP VA 64 prevents recrystallization of the drug when present in solution [48,49,50]. Along with PVP VA 64, Neusilin® US2 was employed as a porous carrier to entrap amorphous drug and to prevent drug recrystallization upon storage. Neusilin® US2 has a surface area of 300 m2/g with an oil adsorption capacity of 3.2 mL/g. The milled HME extrudates were future compressed into tablets and characterized for solid-state properties, in-vitro dissolution and stability.

2. Materials and Methods

2.1. Materials

Ezetimibe (EZB) was purchased from Metrochem API Private Limited (Hyderabad, India). Kollidon® VA 64 (PVP VA 64) was obtained as a gift sample from BASF Pharma (Florham Park, NJ, USA). Neusilin® US2 was supplied by Fuji Chemical Industry Co., Ltd. (Burlington Township, NJ, USA). The tablet excipients Avicel PH102 (microcrystalline cellulose), and AC-DI-SOL (Croscarmellose sodium) were received as gift samples from IMCD (Westlake, OH, USA). SuperTab® 21AN (lactose anhydrous) was provided by DFE Pharma (Paramus, NJ, USA). Lastly, magnesium stearate was received from Roquette (Montgomery County, PA, USA).

2.2. Preparation of Physical Blends

The physical blends needed for the HME process were prepared by passing EZB and PVP VA64 through #20 ASTM sieve and blended in a 0.5 qt V-blender for 20 min at 25 rpm (MaxiBlend Lab Blender, GlobePharma, Inc., Monmouth Junction, NJ, USA). Following the blending process, the material was discharged into an amber polybag and stored in a desiccator until further processing. For the formulations with Neusilin US2, along with drug and polymer, the porous carrier was also passed through a #20 ASTM sieve and loaded into a V-blender. All the formulations which were studied in the investigation are presented in Table 1.

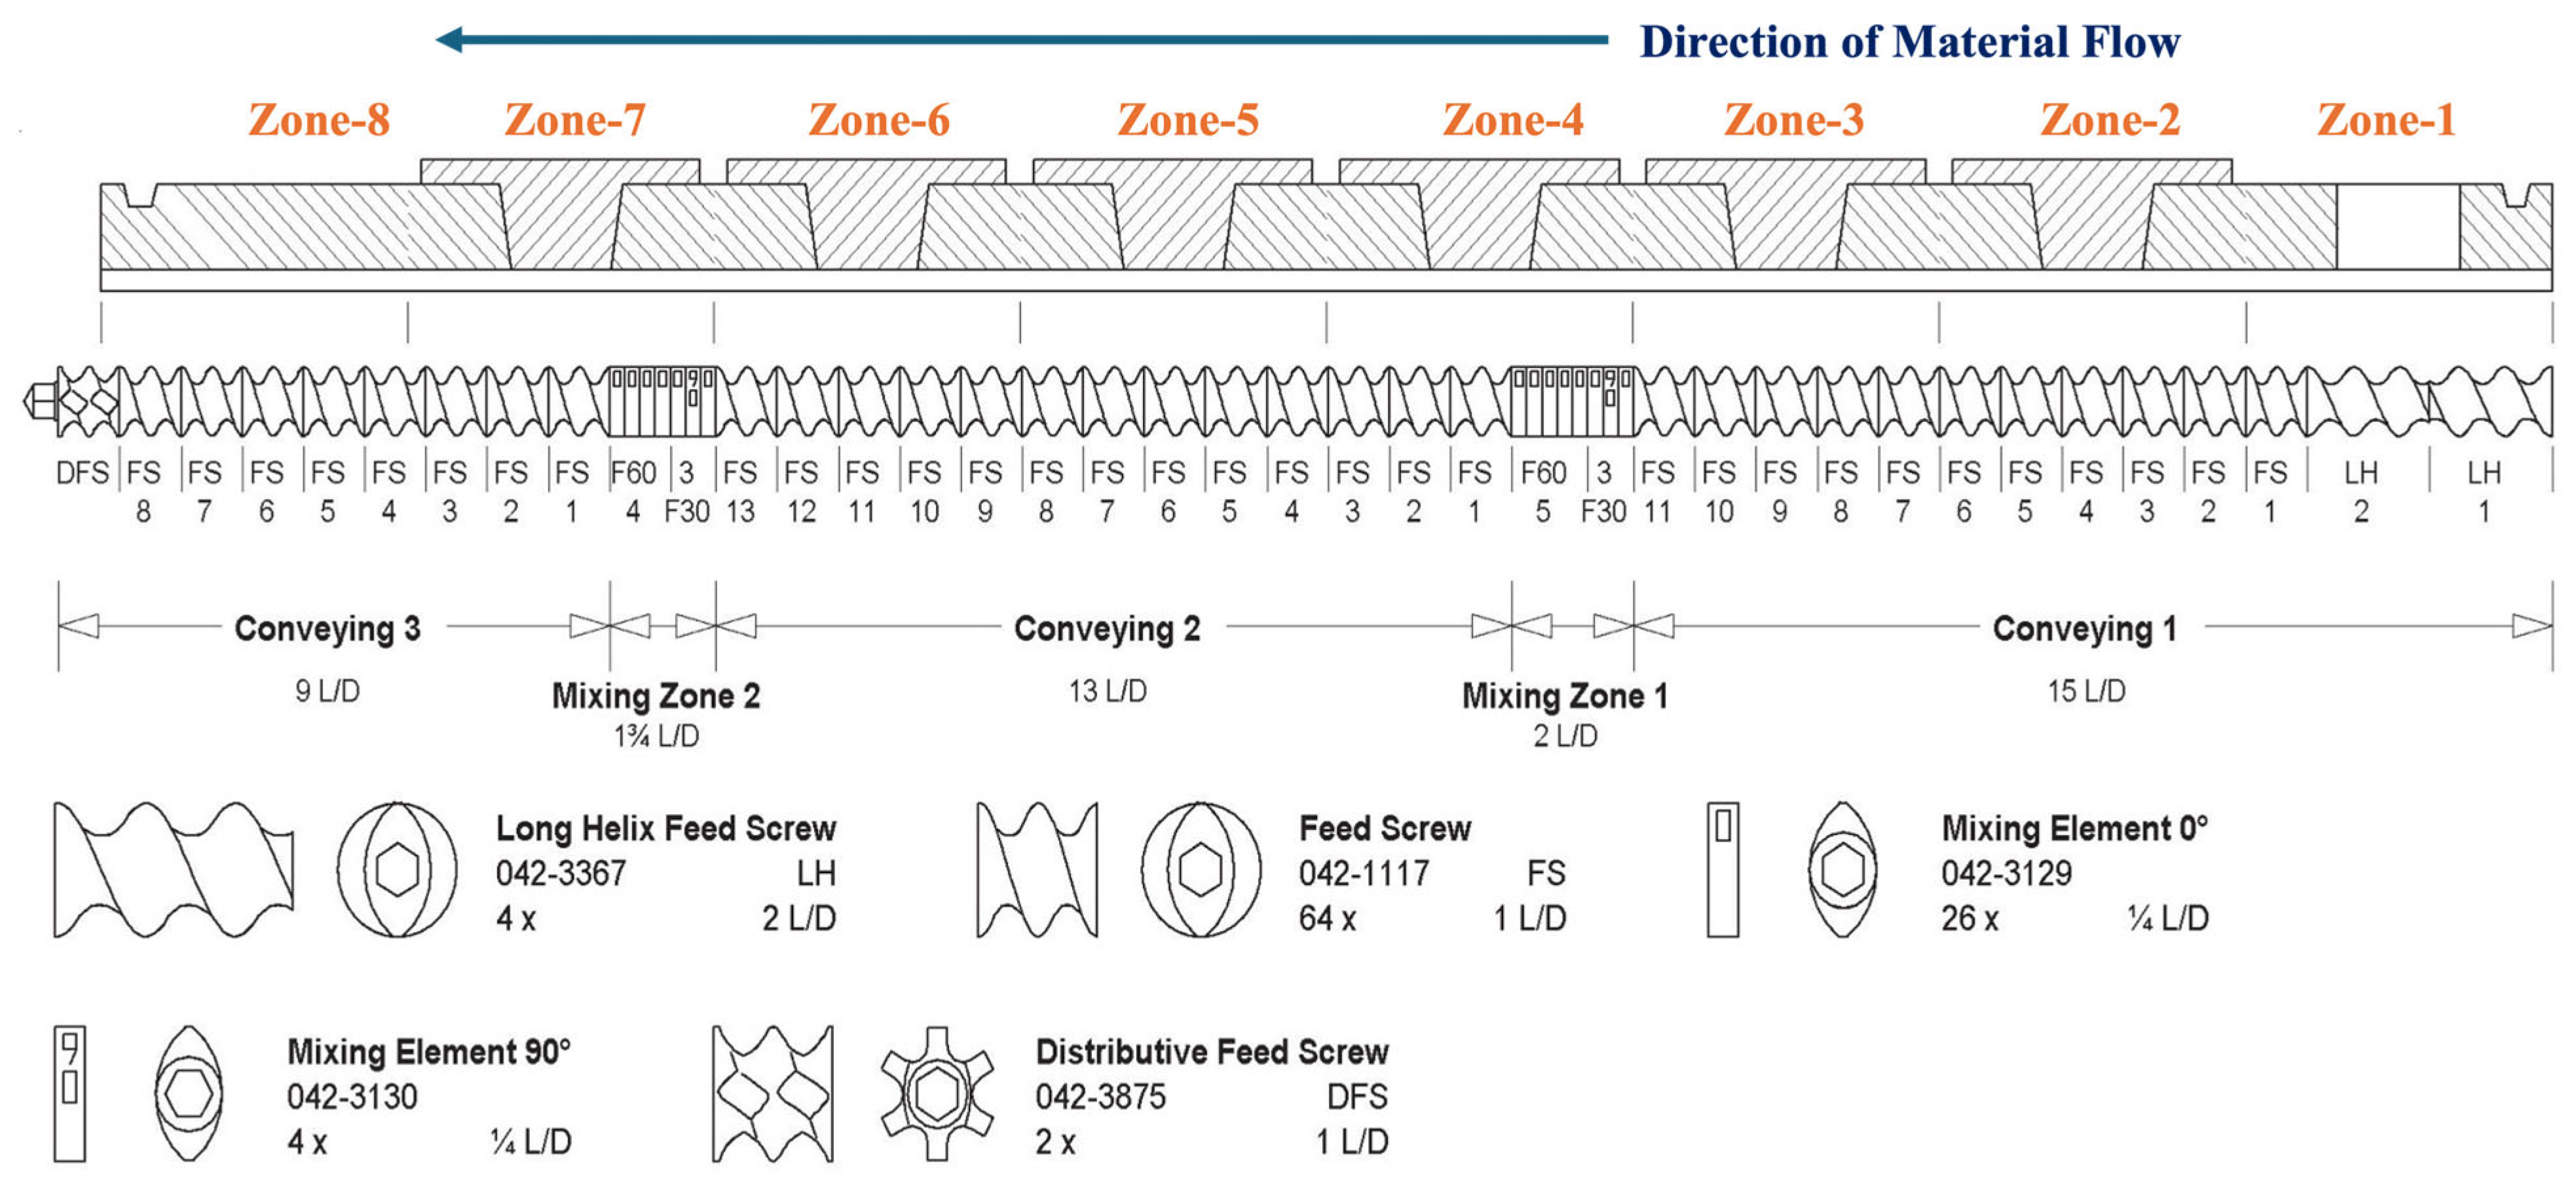
2.3. Hot Melt Extrusion (HME)

All the physical blends prepared in Section 2.2 were extruded using Process 11 Parallel Twin-Screw extruder (ThermoFisher Scientific, Waltham, MA, USA). The entire barrel consists of 8 zones, of which zone-1 was maintained at ambient temperature, and the temperature for zones 2–8 was adjusted between 170–180 °C based on the processing torque. The die temperature was maintained slightly below the barrel temperature to facilitate the collection of filaments from the extruder. The material was fed into the barrel at a feed rate of 2.5–3.5 g/min, and the screw speed was maintained at 50 rpm for all the investigated formulations. The material was extruded through a 2.5 mm die nozzle. A standard ThermoFisher screw configuration with two mixing zones near zone 4 and zone 7 was used for the extrusion process (Figure 2). Throughout the extrusion, the process torque was monitored and controlled by adjusting the process parameters such as feed rate and barrel temperature.

2.4. Modulated Differential Scanning Calorimetry (mDSC)

The solid-state characterization of the drug within the extrudates obtained from the HME process was characterized using DSC 250 (TA Instruments, New Castle, DE, USA). The HME extrudates were crushed into coarse powder by gentle application of pressure using a mortar. An approximate sample quantity of 5 mg was weighed and manually sealed in a Tzero aluminum pan using a Tzero lid. An empty pan was also sealed and used as a reference. The samples were subjected to heating at an increment of 10 °C/min from 25–175 °C. The sample chamber was continuously purged with nitrogen at a 50 mL/min flow rate to maintain an inert atmosphere. For measuring the glass transition (Tg) temperature, the samples were equilibrated for 5 min at 25 °C with a heating rate of 2 °C/min. The modulation was performed every 60 s at ±1.0 °C. The change in heat flow was plotted against temperature using TRIOS software (Version 5.1). The observations of mDSC were further confirmed with powder X-ray diffraction analysis.

2.5. Powder X-Ray Diffraction (PXRD)

The solid-state of the drug within the HME extrudate samples was further confirmed by PXRD analysis. The HME extrudates were crushed into coarse powder by gentle application of pressure using a mortar. The samples were studied at ambient temperature using Bruker D2 Phaser (Bruker AXS GmbH, Karlsruhe, Germany). The XRD (Bruker AXS GmbH, Karlsruhe, Germany) instrument was mounted with a LYNXEYE detector and CU Kα (λ = 1.54 A°). An approximate sample quantity of 100 mg was placed on top of the sample holder and scanned from 5–50° of 2θ angle rotated at a speed of 15 rpm. The samples were analyzed at 30 KV of voltage and 10 mA of current. The step size was maintained at 0.02°/s. The diffractograms were plotted using Diffract SuiteTM V4.2.1 (Bruker AXS GmbH, Karlsruhe, Germany).

2.6. Downstream Processing

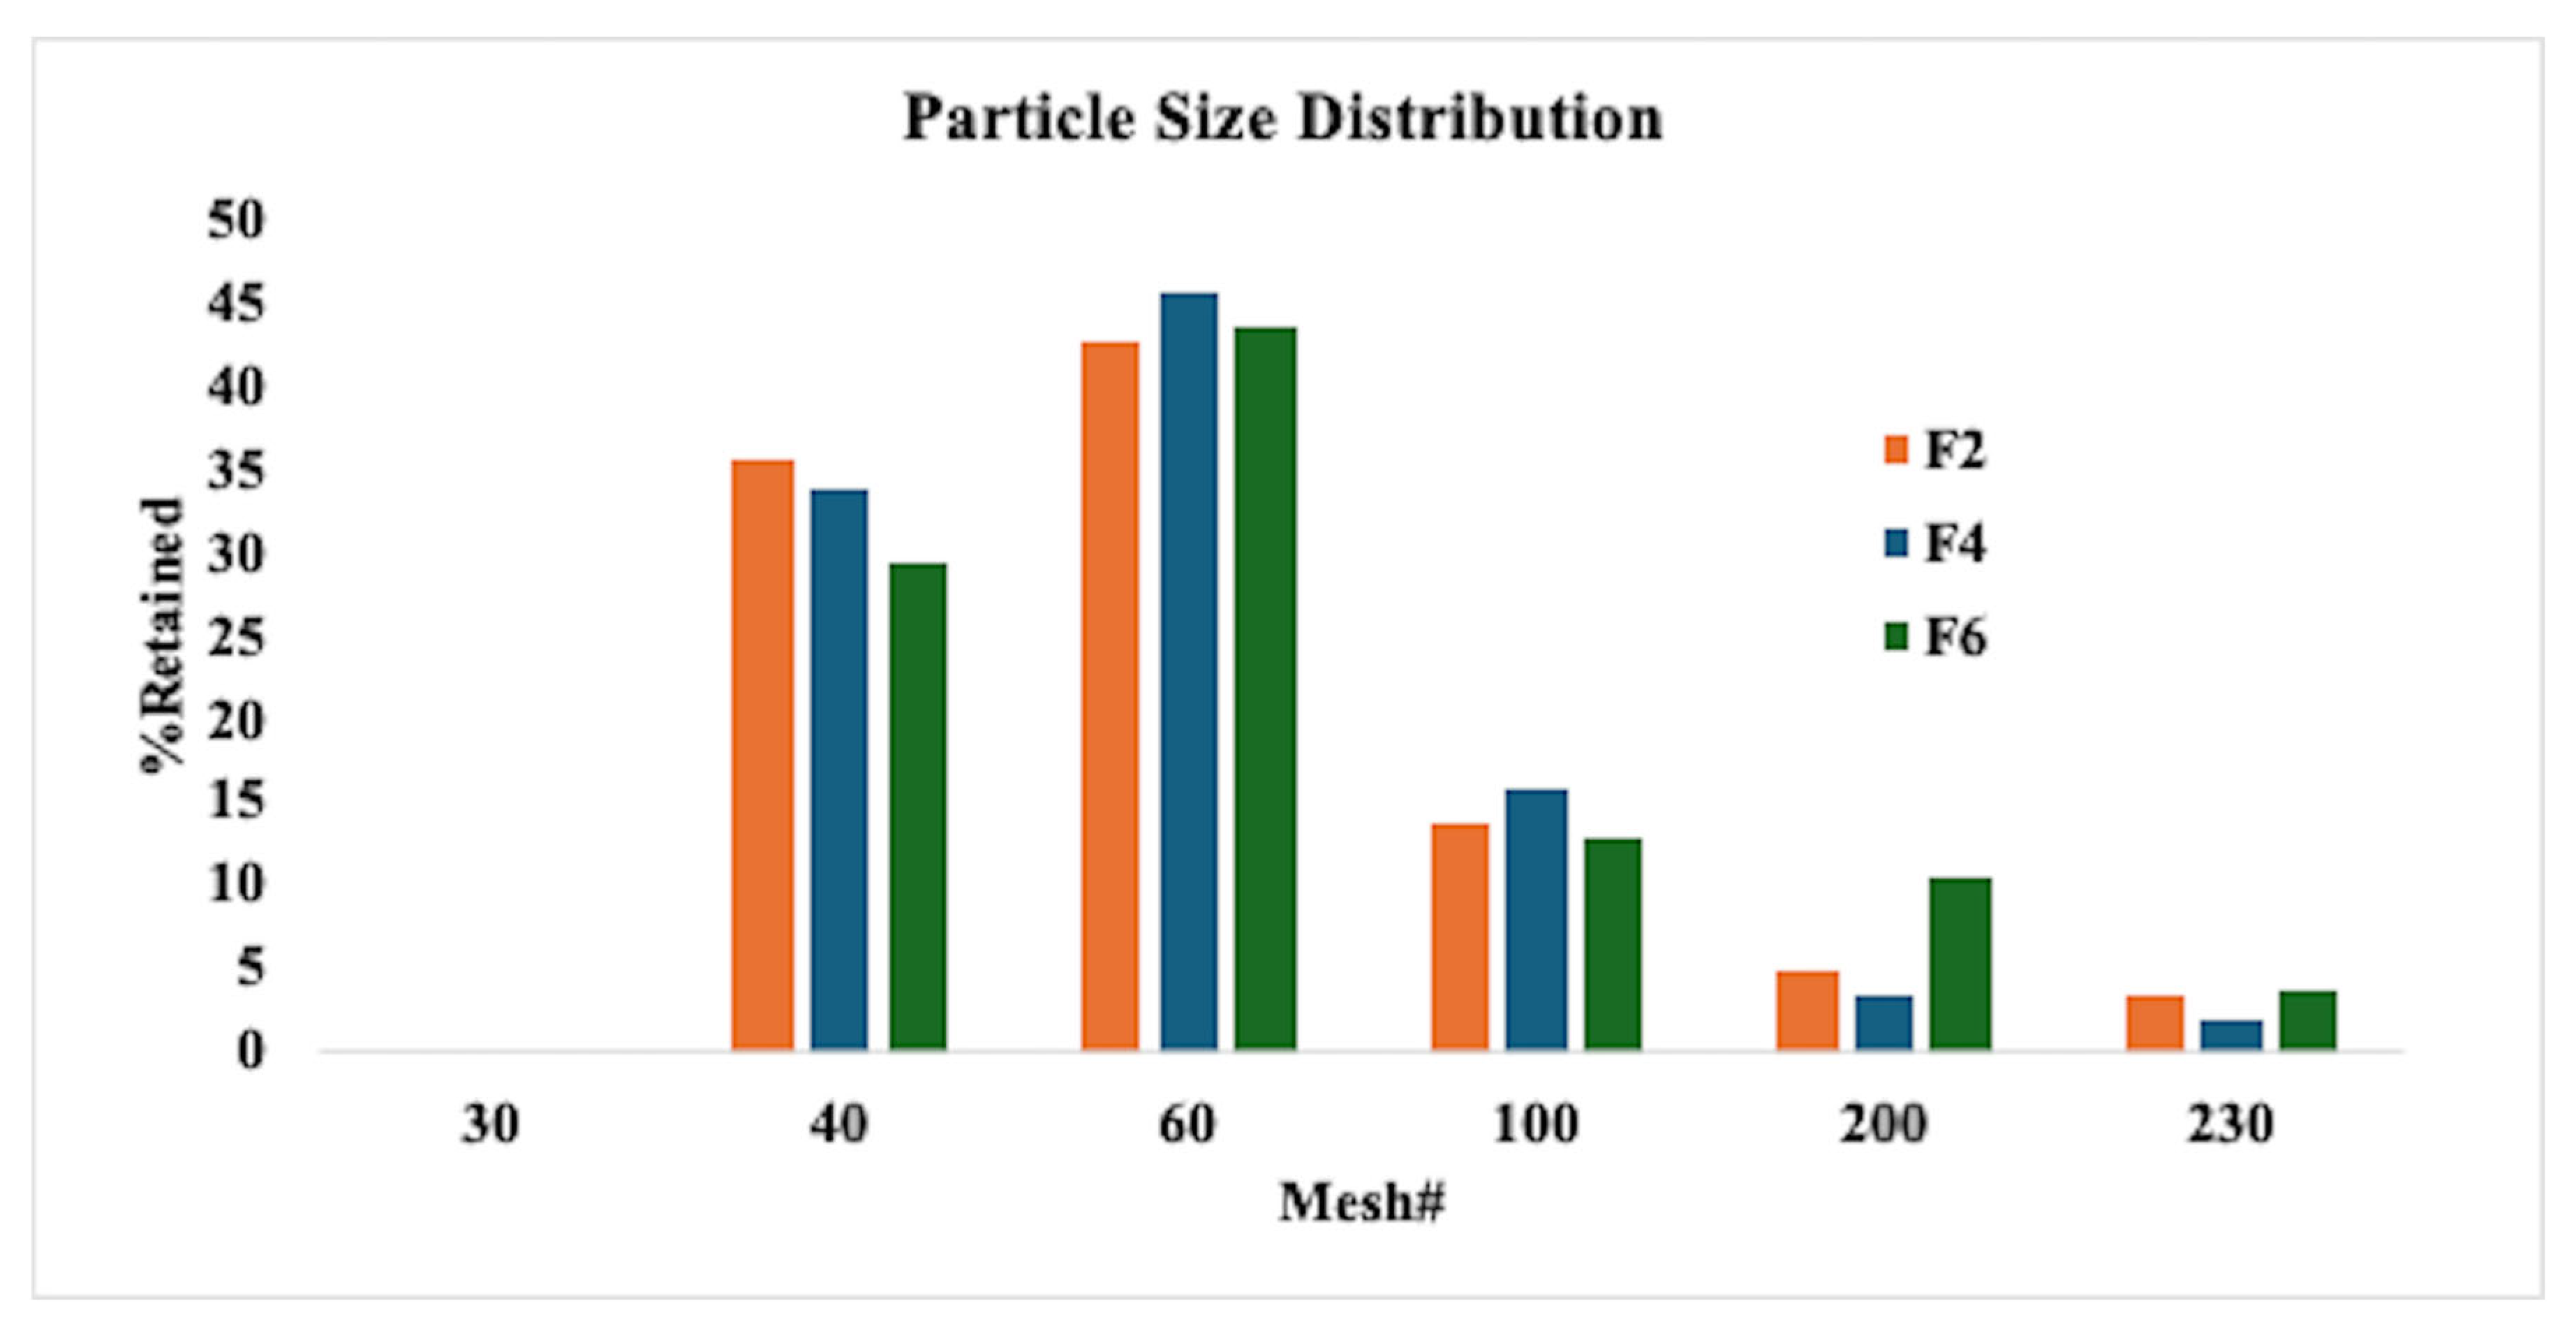
2.6.1. Milling and Particle Size Distribution

The extrudates collected from the HME process were further milled and characterized for particle size distribution. The extrudates were milled using Quadro Comil (SLS-Scalable Lab SystemsTM, Piscataway, NJ, USA) equipped with a 024R (0.6 mm) screen and round impeller operated at 1750 rpm. Following the milling process, the obtained milled material was studied for particle size distribution using the L3P Sonic Sifter Separator (Advantech A W.S.tyler Company, Cincinnati, OH, USA). A sample quantity of 5.0 g was placed on top of the ASTM sieve arranged in the order of #30 (600 microns), 40 (425 microns), 60 (250 microns), 100 (150 microns), 200 (75 microns), 230 (63 microns), and pan, operated for 5 min at an amplitude of 5. Following 5 min, the pans were carefully weighed, and the percentage retained on each sieve was calculated.

2.6.2. Blending for Roller Compaction Process (Intra-Granular Portion)

The milled HME material was further processed for dry granulation to improve the flow and compressibility of the tablet. The milled extrudates were loaded into a 0.5 qt V-blender (MaxiBlend Lab Blender, GlobePharma, INC., Monmouth Junction, NJ, USA). The detailed list of excipients and their weight fractions added to each of the studied formulations is shown in Table 2. The microcrystalline cellulose, lactose anhydrous, colloidal silicon dioxide, and croscarmellose sodium were dispensed and passed through the #20 ASTM sieve and loaded into the V-blender. The materials were mixed for 20 min and 25 rpm. The magnesium stearate was passed through the #30 ASTM sieve, added to the V-blender, and mixed for 3 min at 25 RPM. Following blending, the material was discharged into an amber polybag due to light sensitivity of EZB. A portion of the blend was utilized for plotting the compressibility, tabletability, and compactability (CTC) profile, and the rest was utilized for the dry granulation process.

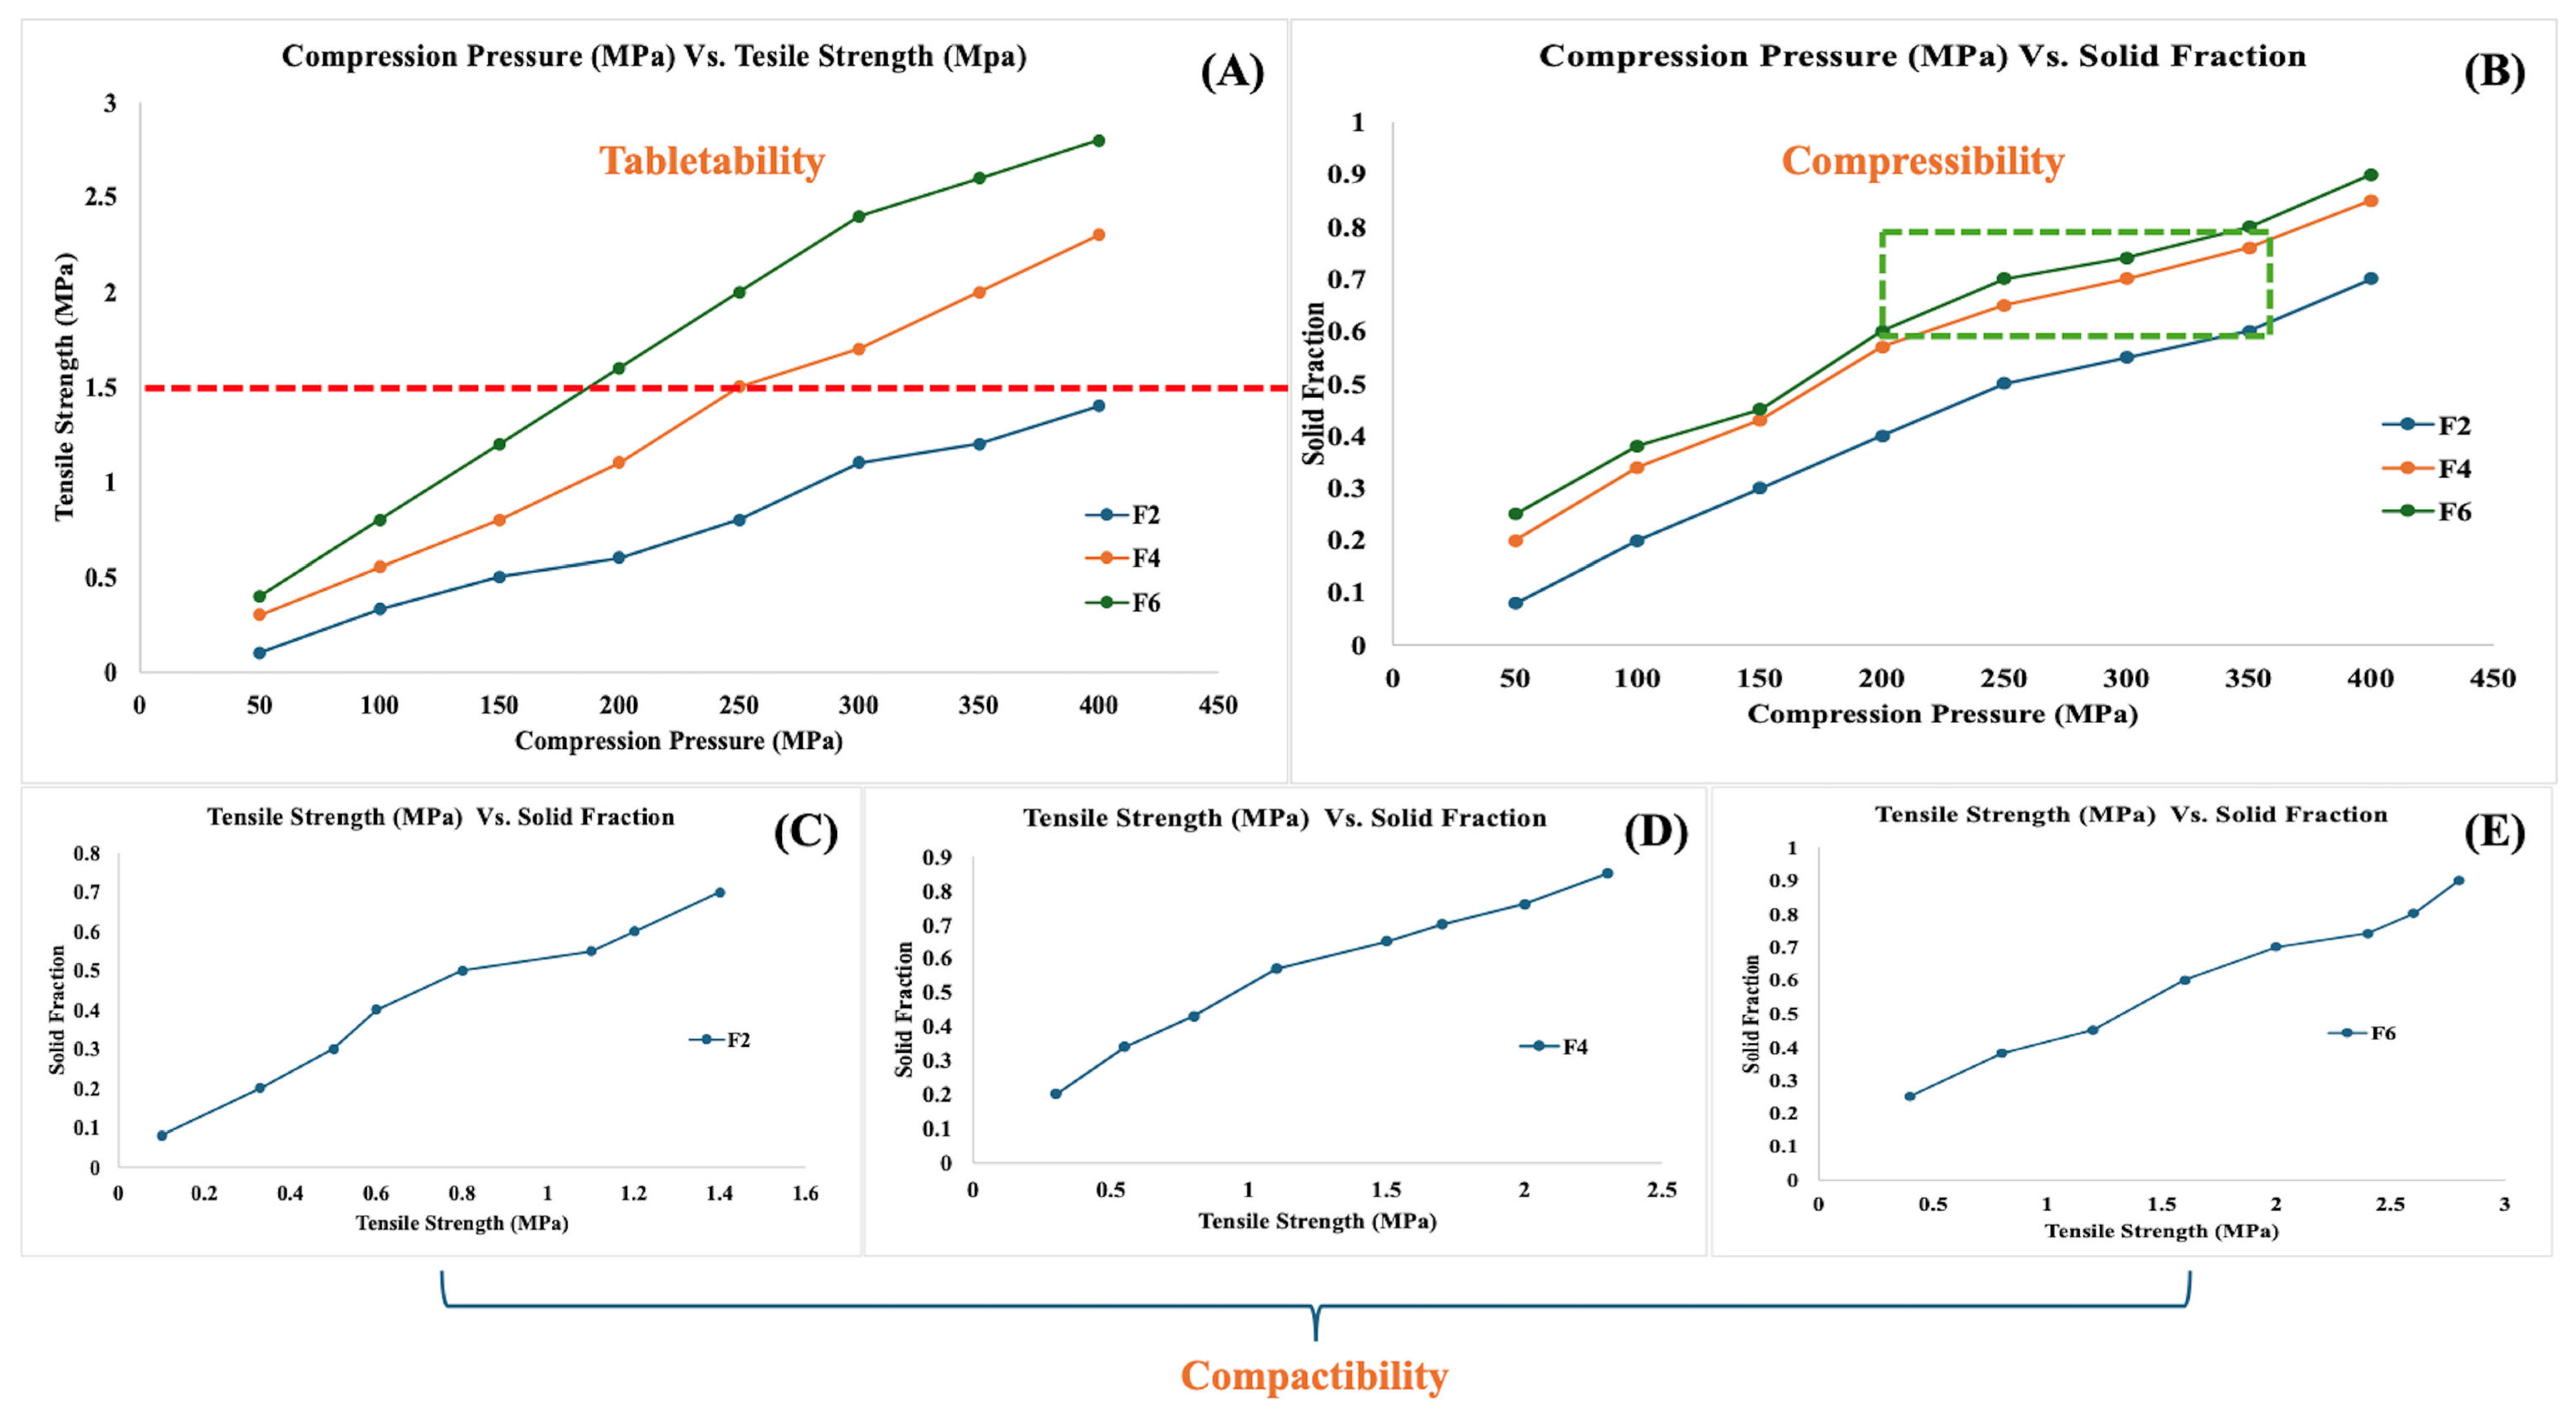
2.6.3. Compressibility, Tabletability, and Compactability (CTC) Profile

The CTC profile was constructed using the pre-granulated blend to understand the effect of compression pressure on the solid fraction and tensile strength of tablets. The tablets were compressed for a weight of 100 mg using 6 mm round concave B-tooling on a single station manual press (Natoli NP-RD10A, St. Charles, MO, USA). Thirty tablets were compressed at each of the following compression pressures of 50, 100, 150, 200, 250, 300, 350 and 400 MPa. The compressed tablets were characterized for tensile strength (n = 3) and solid fraction.
The solid fraction is the ratio of envelope density and the true density of the tablets. The true density (g/cm3) of the tablets was measured using AccuPyc II 1345 (Micromeritics, Norcross, GA, USA). The sample cup (10 cm3) was tared, two-thirds of the cup was filled with tablets, and the net sample weight was recorded. The sample cup was loaded into the chamber, and the analysis was performed using the following parameters: number of purges: 10, purge and cycle fill pressure: 19.5 psig, number of cycles: 10, analysis gas: nitrogen. The envelop density (g/cm3) was measured using GeoPyc 1365 (Micromeritics, Norcross, GA, USA). Approximately 2 g of tablets were weighed and placed into the sample cylinder, and the analysis was performed using DryFlo material. The solid fraction was calculated using the below equation.
S o l i d   F r a c t i o n = E n v e l o p   D e n s i t y   g c m 3 T r u e   D e n s i t y   g c m 3
The tensile strength of tablets is calculated using the Fell-Newton equation:
T e n s i l e   S t r e n g t h   σ = 2 F Π D H
where F is the breaking force (N), D is the tablet diameter (m), and H is the tablet thickness (m). The breaking force in Kilopascal (kp) is converted to Newton (N) using the below equation.
B r e a k i n g   F o c e   N = B r e a k i n g   F o r c e   k p ×   9.80665

2.6.4. Dry Granulation by Roller Compaction

The blend prepared in Section 2.6.2 was dry granulated using a TFC-LAB Micro roller compactor (Freund Vector, Marion, IA, USA). The roller compaction process parameters were adjusted to achieve a target solid fraction between of 0.75 for the ribbons. The solid fraction of the ribbons was measured using the methodology described in Section 2.6.3. The roller compaction for all the formulations (F2, F4, and F6) was performed using S-rolls (flat and serrated). The collected ribbons were subjected to milling using a rotary mill equipped with a #20 mesh screen (0.8 mm) operated at 150 rpm. Following milling, the particle size distribution of the granules was determined using the method described in Section 2.6.1. A sample quantity of 5.0 g was placed on top of the ASTM sieves arranged in the order of #20 (850 microns), 30 (600 microns), 40 (425 microns), 60 (250 microns), 100 (150 microns), 200 (75 microns), 230 (63 microns), and pan, operated for 5 min at an amplitude of 5. Following 5 min, the pans were carefully weighed, and the percentage retained on each sieve was calculated.

2.6.5. Characterization of Blend

The flow properties of milled HME extrudates, pre-granulated blend, and milled ribbon granules were compared by determining Carr’s index, Hausner’s ratio, and Flow Function (FF). Carr’s index and Hausner’s ratio were determined using the below equations [51].
C a r r s   I n d e x   ( % ) = ( T a p p e d   d e n s i t y B u l k   d e n s i t y ) T a p p e d   d e n s i t y
H a u s n e r s   R a t i o = T a p p e d   d e n s i t y B u l k   d e n s i t y
The FF of the blends was determined by employing shear cell analysis using an FT4 powder rheometer (Freeman Technology, Norcross, GA, USA) using a 1 mL shear cell. The FF < 4 indicates poor flow, 4 < FF < 10 indicates intermediate flow, and FF > 10 indicates good flow.

2.6.6. Final Blending and Tablet Compression

The milled granules (from Section 2.6.4) and the extra-granular materials (croscarmellose sodium and magnesium stearate) were mixed and compressed into tablets. The extra granular materials were dispensed based on the calculated adjustment factor. The milled granules were loaded into 0.5 qt V-Blender and mixed for 5 min at 25 rpm. The disintegrant (croscarmellose sodium) was passed through the #20 ASTM mesh screen, added to the V-blender, and mixed for 10 min at 25 rpm. The magnesium stearate was passed through the #30 ASTM mesh screen and blended for 3 min at 25 rpm. The lubricated material was dispensed into an amber polybag and stored until further processing.
The lubricated material was compressed into tablets using a Korsch XP1 (Korsch, South Easton, MA, USA) single-station tablet press. The tablet press was equipped with 6 mm round concave tooling operated at 20 tablets per minute of operating speed. The tablets were compressed for a weight of 100 mg, equivalent to a 10 mg dose of Ezetimibe. The tablets were compressed for 6.0–8.0 kp of hardness. The compressed tablets were characterized for various physicochemical properties, solid-state properties, in vitro dissolution, and stability.

2.7. Characterization of Tablets

2.7.1. Weight Variation, Thickness, Hardness, Friability, Disintegration

Ten tablets of each formulation were weighed individually, and the average weight and standard deviation were calculated. The acceptance criteria of the weight variation test for tablets of 100 mg weight is within ±10%.
The thickness of ten tablets for each formulation was measured using a digital vernier scale. The average ± SD (standard deviation) was reported.
The hardness of five tablets from each formulation was measured using a hardness tester (PharmaTest, PTB 111EP, Hainburg, Germany). The average tablet hardness ± SD (standard deviation) was reported.
The friability of the tablets was determined by placing 6.5 g of equivalent-weight tablets into the drum of the friability tester (PharmaTest, PTF 100, Hainburg, Germany), operated at 25 rpm for 4 min. Following the run, the tablets were collected, dedusted, and inspected for any damage, and the weight was determined. The %friability was calculated using the below equation.
% F r i a b i l i t y = ( I n i t i a l   w e i g h t F i n a l   w e i g h t ) I n i t i a l   w e i g h t   ×   100
The disintegration of tablets was tested by dropping three tablets of each formulation into the disintegration basket tubes using a disintegration tester (PharmaTest, PTZ Auto EZ, Hainburg, Germany). The basket was immersed into a beaker containing 900 mL of distilled water maintained at 37.0 ± 0.5 °C. The time taken for the last tablet to disintegrate was recorded as the disintegration time.

2.7.2. Assay and High-Performance Liquid Chromatography (HPLC)

The assay of the tablets for each formulation was evaluated by placing 10 powdered tablets into a 500 mL volumetric flask filled with 60% acetonitrile, glacial acetic acid, and water in a ratio of 600:1:400. The volumetric flask was sonicated for 30 min, and the volume was made up to 500 mL. An aliquot of sample was collected and filtered through a 0.45 μm filter, and the drug content was measured using HPLC (Agilent, 1260 Infinity III LC system, Folsom, CA, USA) at 232 nm. The samples were analyzed using a 4.6 mm × 15 cm 5 μm column at a flow rate of 1 mL/min. The injection volume is 30 μL, and the mobile phase is tetrahydrofuran, acetonitrile, and phosphate buffer mixed in at a ratio of 100:250:650. The calibration curve was plotted from 1–10 μg/mL with a correlation coefficient (R2) of 0.998. The assay and HPLC methods were referenced from the United States Pharmacopeia (USP) Monograph.

2.7.3. In Vitro Drug Release

The drug release profiles of the tablets were analyzed using a USP type 2 (paddle) dissolution apparatus (Agilent Technologies, 708-DS, Folsom, CA, USA). Three tablets of each formulation were dropped into each dissolution vessel consisting of 500 mL 0.1 N HCl (pH 1.2) maintained at 37 °C and operated at 50 rpm of paddle speed. An aliquot of sample was collected at 5, 10, 15, 30, 45, 60, 90, 120 min and filtered through 0.45 μm filter. The drug content in the samples was measured using the HPLC method described in Section 2.7.2. The dissolution profiles were plotted with time (x-axis) against %drug dissolved (y-axis).

2.7.4. mDSC and Fourier Transform Infrared Spectroscopy (FTIR)

The solid-state of the drug within the tablets of each formulation was measured using the procedure described in Section 2.4.
The compatibility between the drug and the formulation excipients was evaluated using the FTIR instrument (Agilent Technologies, Cary 630, Folsom, CA, USA). The tablets of each formulation were pulverized into powder in a mortar. An approximate sample quantity of 2–3 mg was placed on the diamond crystal and compressed with a high-pressure clamp. The samples were scanned over a range of 650–4000 cm−1 for 16 times at a resolution of 4 cm−1.

2.8. Stability Studies

The tablets of each formulation were further evaluated for stability by storing the samples at accelerated conditions (40 ± 2 °C & 75 ± 5%RH) for six months in a stability chamber (Weisstechnik, 280-T, Grand Rapids, MI, USA). The tablets of each formulation were sealed in a 30 cc HDPE bottle and loaded into a stability chamber. The samples were collected at 3 months and 6 months, characterized for weight variation, hardness, friability, disintegration, assay, mDSC, and dissolution studies. The similarity of the dissolution profiles between the initial and stability samples was calculated using the equation below.
% F r i a b i l i t y = ( I n i t i a l   w e i g h t F i n a l   w e i g h t ) I n i t i a l   w e i g h t   ×   100
Within the equation, n is the number of sampling points, Rt and Tt are the cumulative release rate of the test and reference sample. An f2 value greater than or equal to 50 represents the similarity between the release profiles.

3. Results and Discussion

3.1. Hot Melt Extrusion Process

All the formulations listed in Table 1 were extruded successfully except one of the high drug load formulations (F8) with 50% drug load. All the formulations were extruded between 170–180 °C of barrel temperature, which is slightly greater than the melting point of the drug, which is 165 °C. The temperature in zone-1 was maintained at ambient to prevent melting or sticking of the material which might impact consistent feeding of material into the extruder barrel. The die temperature was maintained at slightly lower than the barrel temperature to prevent the flow of the polymeric mass in a liquid state. The feed rate and screw speed were maintained at 2.5–3.5 g/min and 50 rpm for all the formulations. The flow of the material was found to be excellent for the formulations with Neusilin US2, which can be attributed to the spherical morphology of the porous material. The process torque was found to be decreased with increasing drug load which indicates plasticizing property of EZB. Overall, the torque stayed below 50% for all the formulations which were extruded successfully. For formulation, F8, the extruded was torqued out (100%), resulting in an unsuccessful extrusion process. The failure of extrusion can be attributed to low polymer and high Neusilin US2 concentration, resulting in poor material conveying. For all the formulations, the filaments were collected using a 2.5 mm die nozzle. The diameter of the filaments was found to be within 2.5 ± 1.0 mm (F1–F3) and 2.5 ± 0.2 mm (F4–F7). The greater variation in the diameter of the filaments without Neusilin (F1–F3) can be due to the die-swell behavior of the polymer, which was not observed in the rest of the formulations (F4–F7). The filaments were collected and stored in an amber bag until further processing. All the process parameters of the HME process for all the investigated formulations are listed in Table 3.

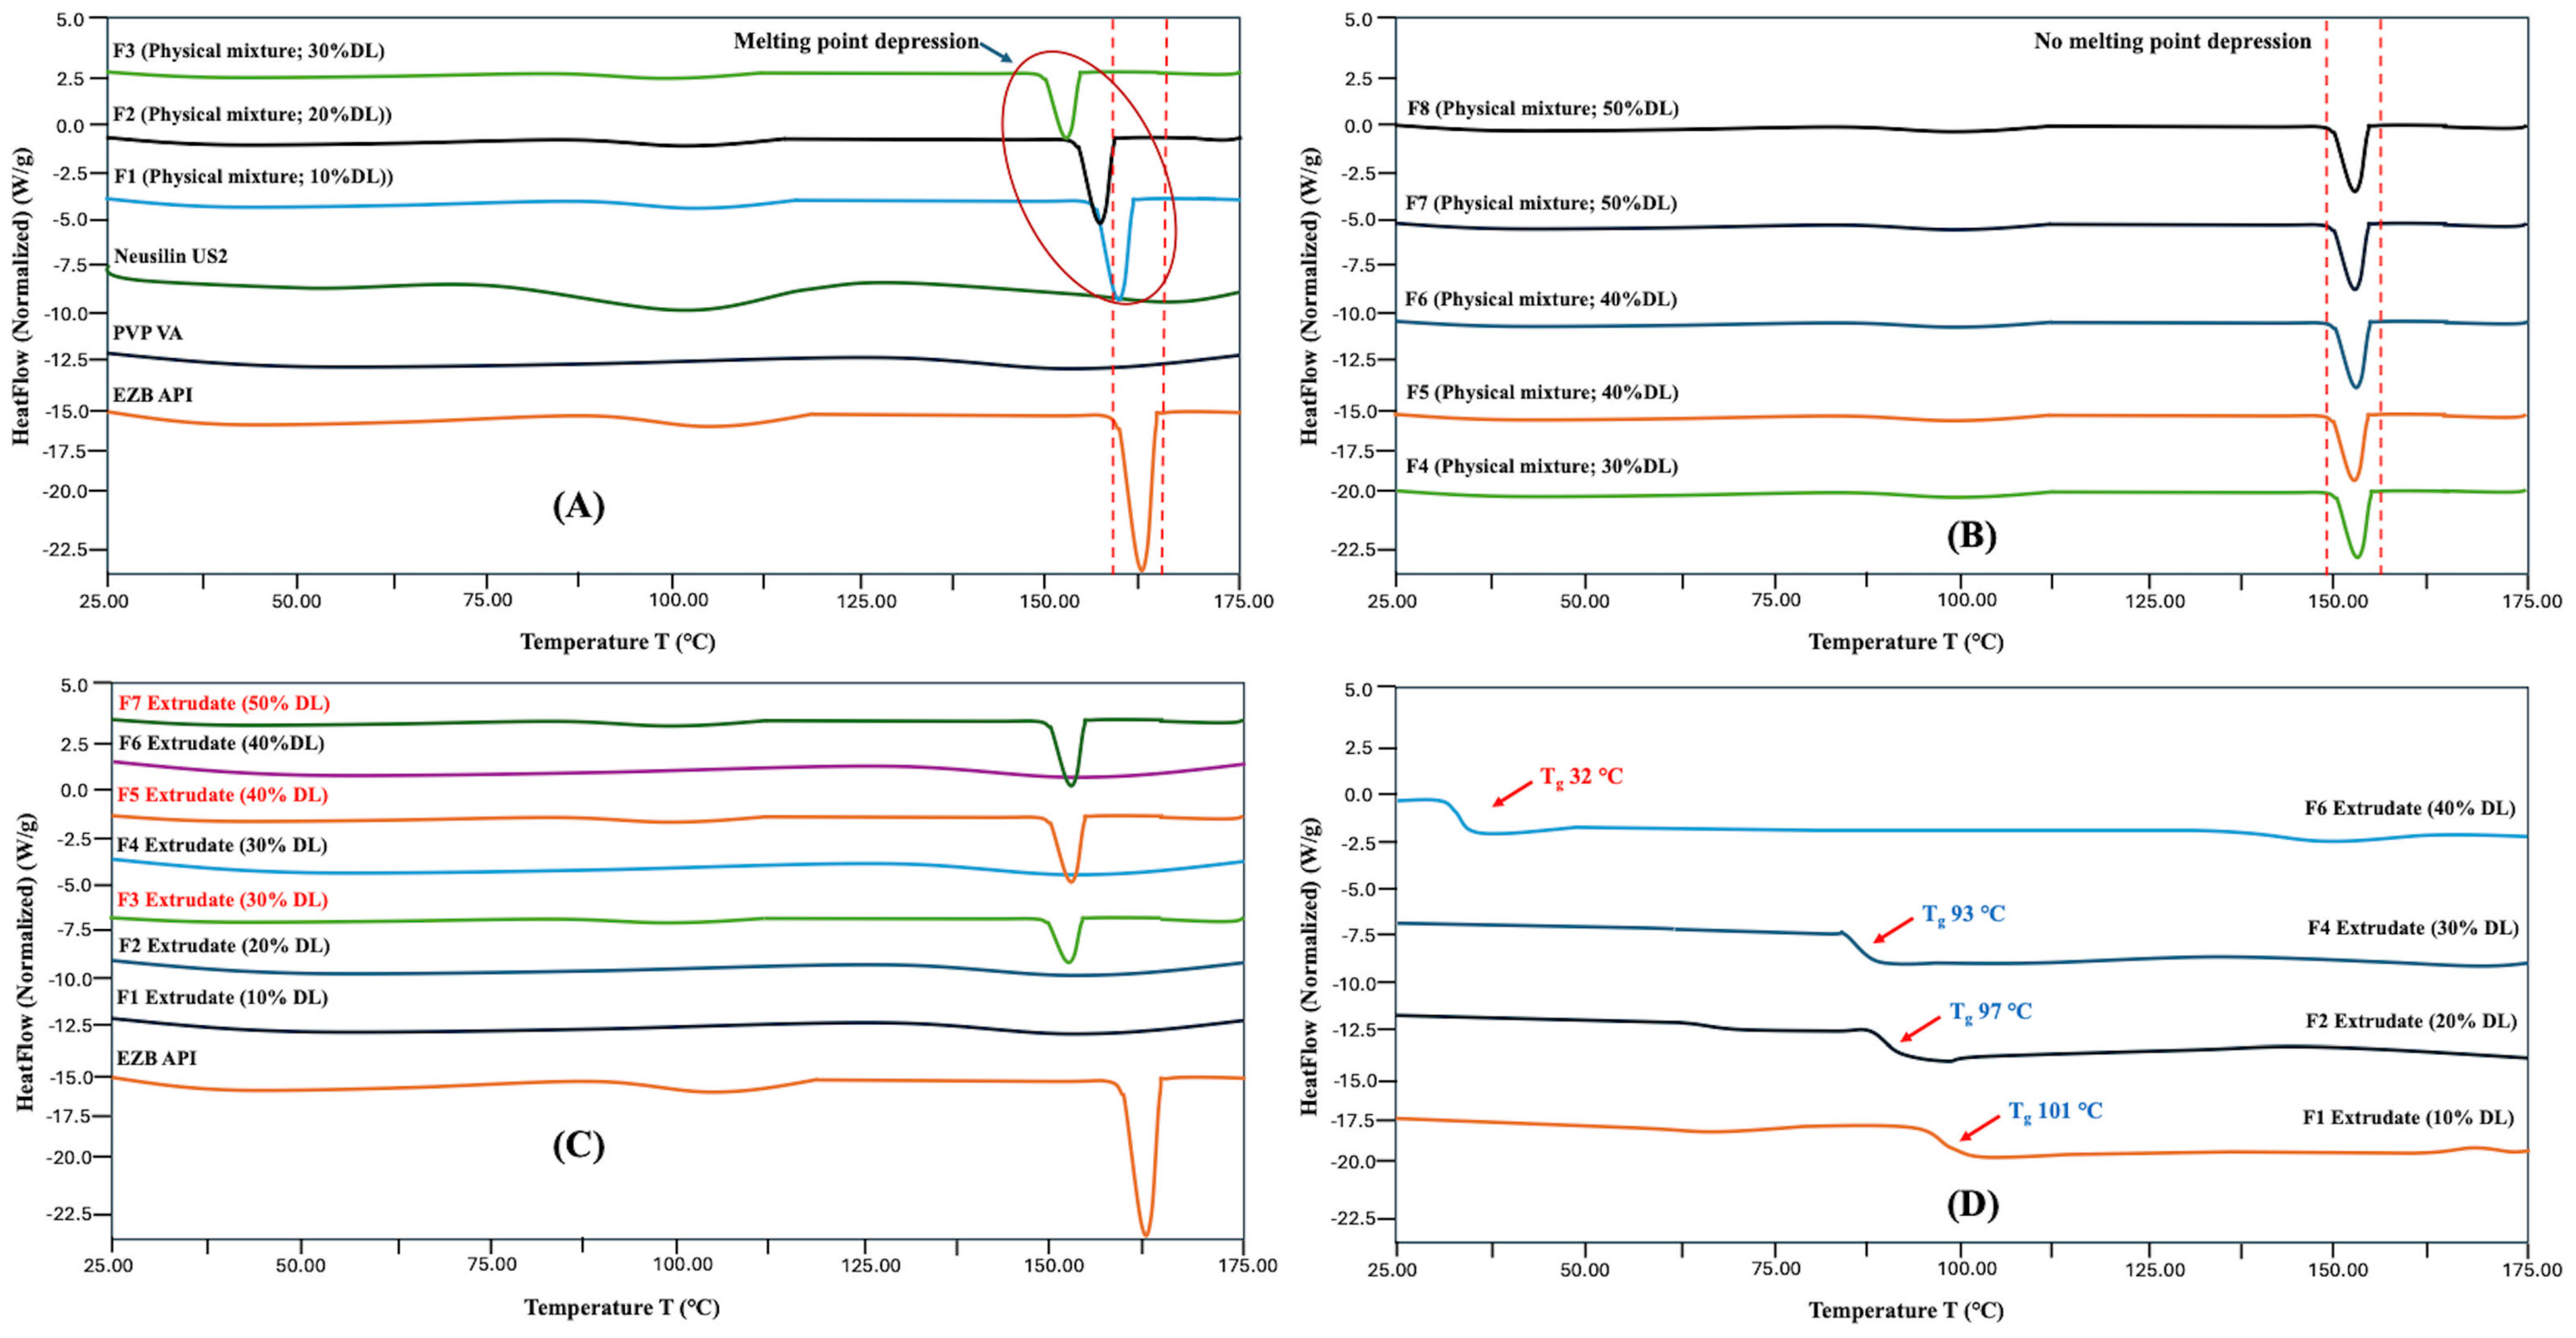
3.2. Characterization of HME Extrudates

The extruded filaments collected from the HME process were further characterized to study the solid state of the drug. Figure 3 shows the DSC thermograms investigated for the pure formulation materials, physical blends, and extruded samples. The thermogram of pure EZB has shown an endothermic peak at 163 °C (Figure 3A), indicating the endothermic melting point of the drug substance. The DSC scan of PVP VA64 (Copovidone) and Neusilin US2 showed a straight line with no characteristic peaks, indicating their amorphous nature. With increasing drug load from 10% to 30%, the physical blends of formulations F1-F3 have shown a slight reduction in the melting temperature called melting point depression, indicating good miscibility between the formulation components. The melting point was found to be at 160 °C, 158 °C, and 155 °C for 10%, 20%, and 30% drug load formulations. Whereas no melting point depression was noticed with increasing drug load for the formulations with Neusilin US2. The melting point for all the Neusilin US2 based formulations was found to be at 155 °C (Figure 3B). The absence of melting point depression within the physical blends consisting of Neusilin might be due to the presence of insoluble solid content (Neusilin) in the formulation.
The thermograms of formulations F1 and F2 have shown no melting peak, indicating successful conversion of the drug into the amorphous state. Whereas the formulation F3, with 30% drug load, has shown a characteristic melting peak of the drug, indicating the existence of the drug in crystalline form. The formulation F4, with 30% drug load and 10% Neusilin US2, has resulted in the absence of a melting peak, indicating complete conversion of the drug into an amorphous form, which might be due to the entrapment of a certain amount of amorphous drug in the cavities of Neusilin US2. Similarly, the drug was found to be crystalline in formulation F5 with a 40% drug load, which was further addressed by the incorporation of 15% Neusilin US2 (F6). Lastly, the formulation F7, with 50% drug load, has also resulted in the existence of the drug in crystalline form. Increasing the concentration of Neusilin US2 to 20% has resulted in the failure of the extrusion process due to the increased amount of solid content. Thus, an amorphous drug load of 40% was achieved with the incorporation of 15% Neusilin US2 and 45% copovidone as a polymeric carrier. A significant drop in the glass transition temperature for the formulations consisting of Neusilin was observed. The glass transition temperature for formulation F6 was found to be 32 °C, which is quite below the storage temperature. The stability of the formulation upon storage needs to be closely monitored. Whereas the glass transition temperature for formulations F1, F2, and F4 was found to be 101 °C, 97 °C, and 93 °C respectively. Similar to the melting point depression in the physical blends, the glass transition temperature was found to decrease with increasing drug load. For all the formulations (F1, F2, F4, F6), a single glass transition point was observed, indicating a homogeneous system.
The solid state of the drug within the formulations F2, F4, and F6 was further confirmed using PXRD analysis. The diffractogram of the neat EZB has shown characteristic peaks at 14.7°, 16.06°, 18.63°, 20.16°, 23.59°, 24.20°, 25.11°, 28.14°, and 32.75° indicating Form A of the drug substance [7,52]. The diffractograms of HME extrudates for F2, F4, and F6 formulations have shown hollow curves indicating the existence of the drug in amorphous form. The PXRD diffractograms are depicted in Figure 4.
The HME extrudates were milled into fine powder to be processed into tablet formulations along with other excipients. The PSD of the milled extrudates is shown in Figure 5. For all the formulations (F2, F4, F6), the majority (80%) of the material has a particle size between 250–600 microns. The amount of fines contributes to less than 10% (<75 microns) for all three formulations, which is advantageous for ideal blend flow characteristics.

3.3. CTC Profile

The CTC profile was constructed for the pre-roller compaction blends that were prepared by mixing the milled HME extrudates with microcrystalline cellulose, lactose anhydrous, aerosol, croscarmellose sodium, and magnesium stearate. The main intention of constructing the CTC profiles for the blends is to understand the impact of compression pressure on the tensile strength and solid fraction. At higher compression pressures, a lower tensile strength and low solid fraction would indicate poor compressibility characteristics of the material. Within the industry, the general rule of thumb for manufacturing tablet dosage forms is to achieve a tensile strength of greater than 1.5 MPa and a solid fraction between 0.6–0.8. Failure to achieve tensile strength would result in weaker tablets, which might get damaged during the coating or packaging, impacting the quality. Similarly, a solid fraction within the range of 0.6–0.8 for the roller-compacted ribbons will ensure sufficient mechanical properties and granule formation. Additionally, the solid fraction greater than 0.8 would result in lower tablet porosity affecting the disintegration and drug release characteristics. Thus, investigating the tensile strength and solid fraction with respect to the compression pressure would provide an understanding of the processing material and will also serve as a basis for establishing the solid fraction as a control measure during the roller compaction process.
The complete picture of the CTC profile studied for the pre-roller compaction blends of F2, F4, and F6 formulations is shown in Figure 6. The tabletability was found to be better for the blends with decreasing amounts of milled HME extrudate content within the tablets (Figure 6A). The tensile strength of the tablets was found to be increased with increasing compression pressure. The blends of formulations F4 and F6 with 33.33%w/w and 25%w/w of milled extrudate content have resulted in a tensile strength of greater than 1.5 MPa at 200 MPa and 250 MPa of compression pressure, respectively. Whereas the formulation F2 with 50%w/w of milled extrudate content required a higher compression pressure of 400 MPa to achieve 1.5 MPa of tensile strength, indicating a poor tabletability profile.
Similarly to the tabletability profile, the compressibility of the formulation (F4 and F6) with a lower amount of milled HME extrudates has resulted in better compressibility compared with formulation (F2) with 50%w/w of milled extrudate content. The milled extrudates exhibit a glassy nature, which is poorly compressible. Thus, with increasing amounts of milled extrudate content, the tabletability and compressibility of the materials are found to be compromised. At a compression pressure of 200–300 MPa, the formulations F4 and F6 have resulted in a solid fraction of 0.6–0.8. Whereas at higher compression pressures of 400 MPa, the formulation F2 with a higher amount of milled extrudate has resulted in 0.7 of solid fraction, indicating the need for high compression force.
Finally, the compactibility profile plotted for F2, F4, and F6 formulations (Figure 6C–E) has shown the relation between the solid fraction and the tensile strength. The formulations F4 and F6 have resulted in stronger tablets at lower solid fractions. The compactibility was found to be in the order of F6 > F4 > F2 which is in line with the amount of milled extrudate content within each formulation. Thus, overall, the CTC profile has provided an understanding of the formulation behavior under the application of compression pressure.

3.4. Roller Compaction and Characterization of Milled Ribbons

The roller compaction was executed successfully for all the physical blends (F2, F4, and F6). All the blends have exhibited behavior similar to those studied in the CTC profile with respect to compression pressure and solid fraction. The formulation F2, with the highest concentration of milled HME extrudates (50%w/w), has demonstrated poor compressibility, requiring a higher roll pressure of 13 kN to achieve 0.61 of solid fraction. Attributing to the poor flow of the blend due to the presence of a higher portion of milled extrudate material, it has required higher screw speed to feed the material and has resulted in a higher screw current of 0.5–0.6 Amps. The roll speed was maintained identically for all the investigated formulations at 1 rpm. Higher roll speed was not favorable for the formation of ribbons with desired mechanical properties. The roller compaction of F4 and F6 formulations with 33.33%w/w and 25%w/w of milled extrudate content was found to be excellent compared to the F2 formulation. The formulations F4 and F6 have resulted in a solid fraction of 0.73 and 0.84 at a roll force of 13 kN, demonstrating better compressibility properties of the blend. Additionally, the blends have exhibited better flow requiring lower screw speeds, and have also resulted in low screw current of less than 0.45 Amps. The process parameters of the roller compaction process and solid fraction are tabulated in Table 4.
Following roller compaction, the ribbons were subjected to milling using a rotary mill operated at low speed (150 rpm) such that gentle pressure was applied onto the ribbons. The principle of operation is similar to an oscillatory mill equipped with commercial manufacturing equipment. The PSD of the milled ribbons is shown in Figure 7. The size of the particles was found to be less than 850 μm. For all the formulations (F2, F4, and F6), around 70% of the material was found to be between 250–600 μm. Overall, the fines were found to be less than 10%, ranging between 60–75 μm. The PSD was found to be unimodal, which is advantageous and compatible with further downstream processing with no risk of segregation.
The flow behavior of the milled material was studied in comparison with the milled HME extrudates and pre-roller compaction blend. The Carr’s index, Hausner’s ratio, and flow function were studied for all three formulations (F2, F4, F6), and the results were tabulated in Table 5. As discussed earlier the milled HME extrudates have exhibited poor flow behavior across all three characterizations where the Carrs Index value was found to be greater than 35% and, Hausner’s ratio was found to be greater than 1.4 and the flow function was found to be less than 4 indicating poor flow behavior for the material. The flow properties of the pre-roller compacted blend was found to be improved compared with the milled extrudates alone due to the presence of glidant along with additional excipients. Finally, the flow of the milled ribbons was found to be more promising to that of the milled extrudates and pre-roller compacted blends. Based on flow function, the granules of milled ribbons for F2 formulation have demonstrated intermediate flow due to a greater amount of milled HME content. Whereas, the formulations F4 and F6 have demonstrated a flow function of >10 indicating good flow properties.

3.5. Compression of Tablets and Characterization

The tablets of all the formulations (F2, F4, and F6) were compressed successfully using 6 mm round concave tooling for 100 mg of tablet weight equivalent to 10 mg dose of EZB. The tablets were compressed for a hardness range of 6–8 kp. The compressibility of the material was ruled by the amount of milled extrudate content present in the formulation. The formulation F2, with the highest amount of milled extrudate content (50%w/w), was able to be compressed at 8–10 kN of compression force to achieve a tablet hardness of 6–8 kp. Whereas, the formulations F4 and F6 required 7–8 kN and 4–6 kN of compression force. All the results were in accordance with the observations of the CTC profile.
The weight variation was found to be acceptable and is within ±2%. The thickness of tablets for all the formulations was found to be less than 2.65 mm. The average hardness of the tablets for all the formulations was found to be around 7 kp. The friability was found to be acceptable and is less than 0.5%. The disintegration time for all three formulations was found to be less than 5 min, which might result in faster release profiles. The incorporation of extra-granular disintegration within the tablets might have aided in faster disintegration. The assay of the drug within the tablets of all the formulations was found to be within ±1%, indicating homogeneous distribution, no loss, and no degradation of the drug during the manufacturing process. The detailed results of the tablet characterization for all the formulations are listed in Table 6.

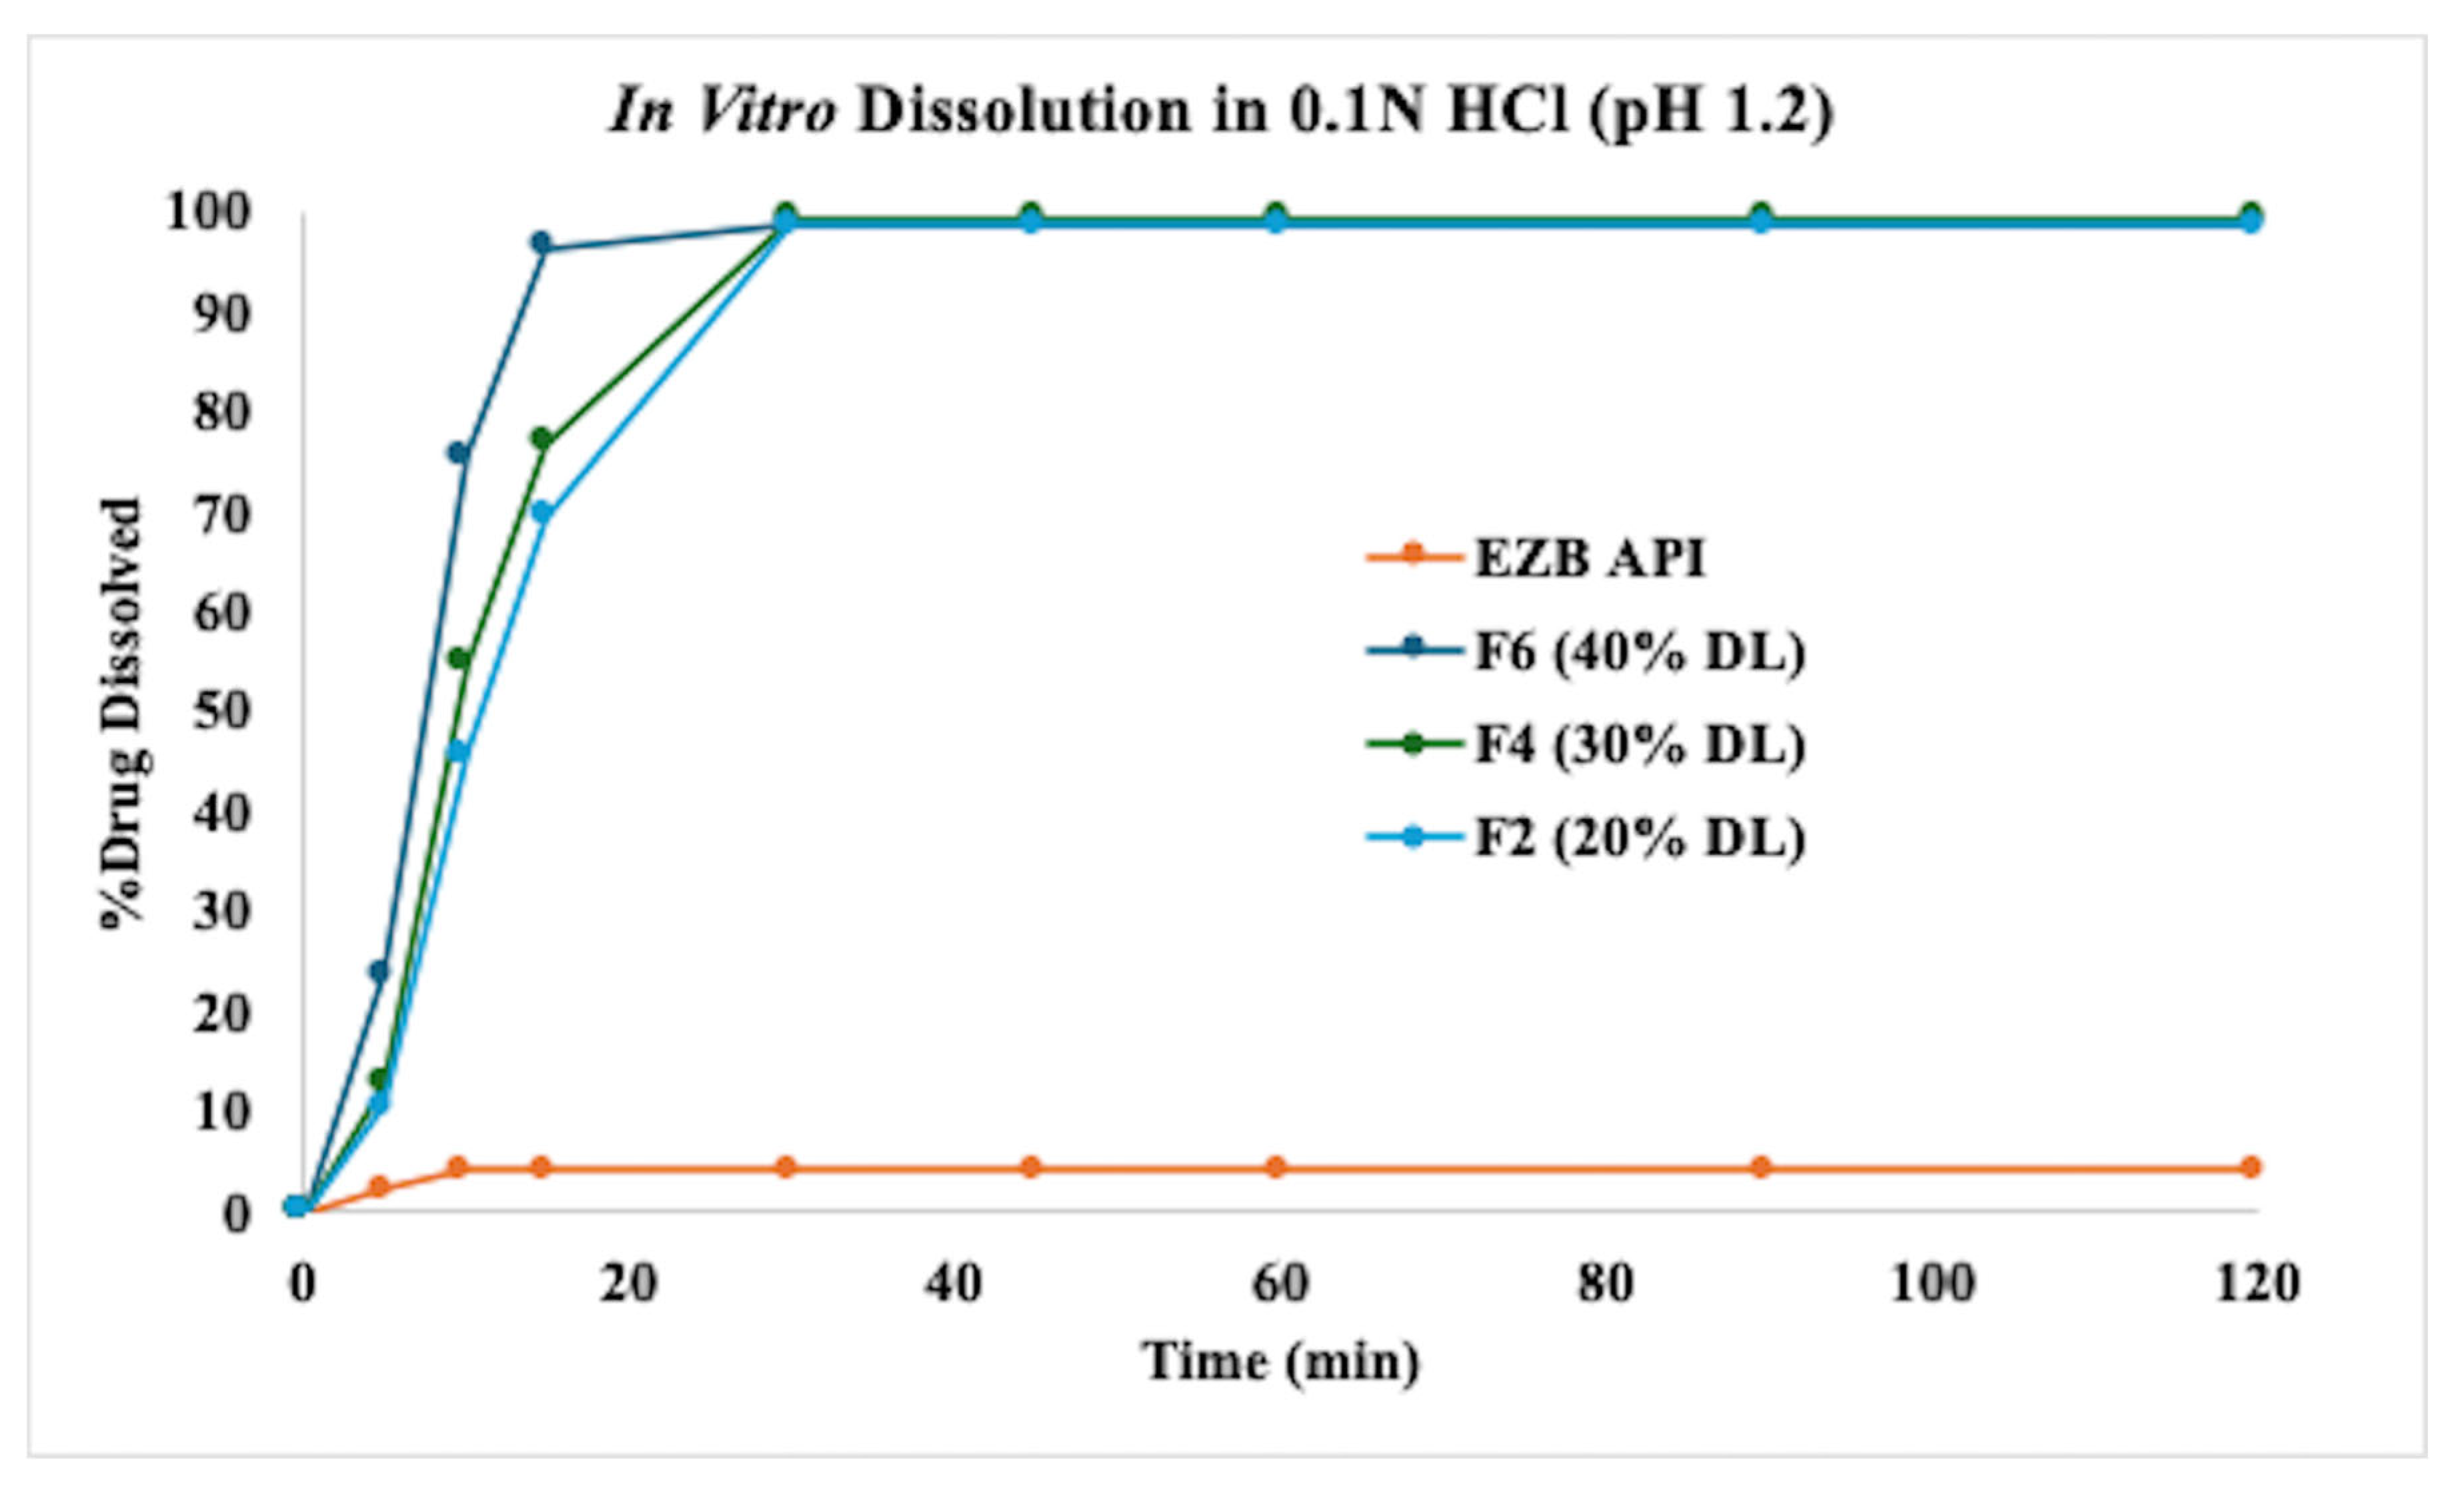
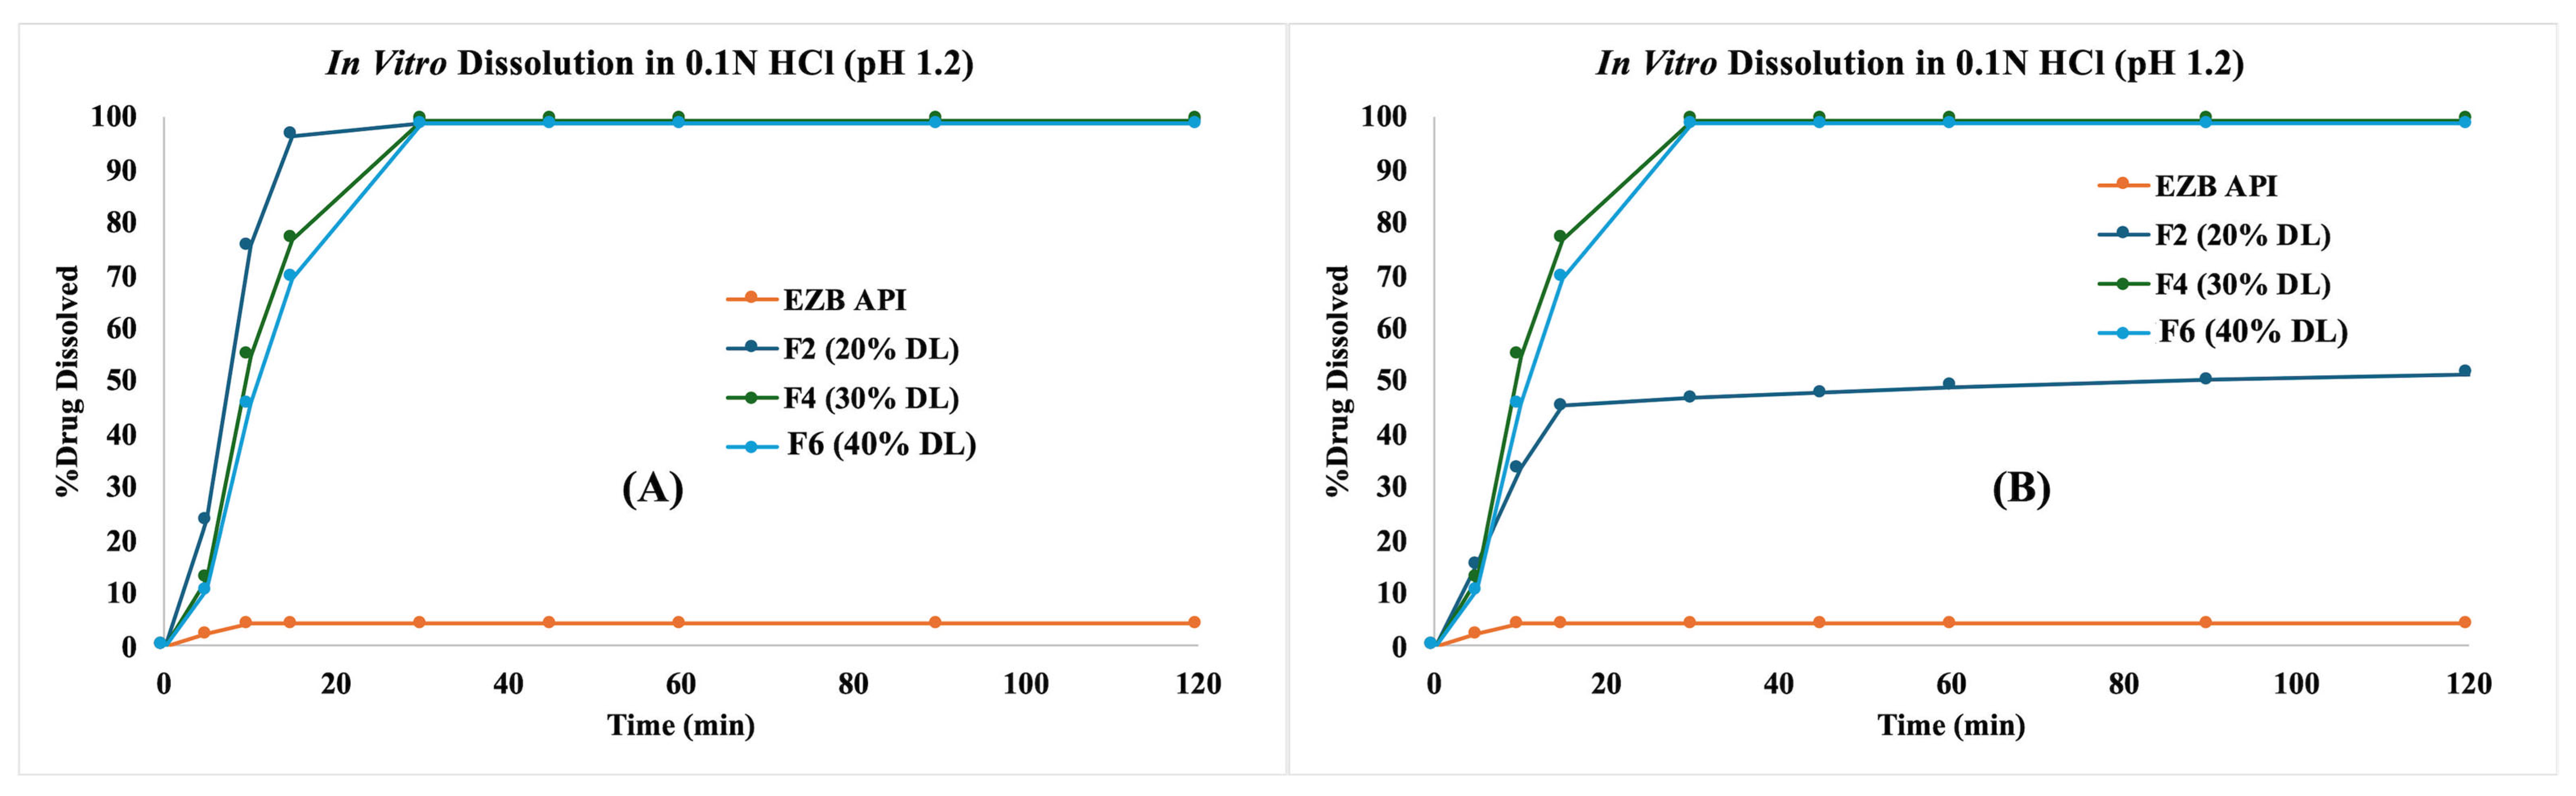
3.6. In Vitro Dissolution Profiles
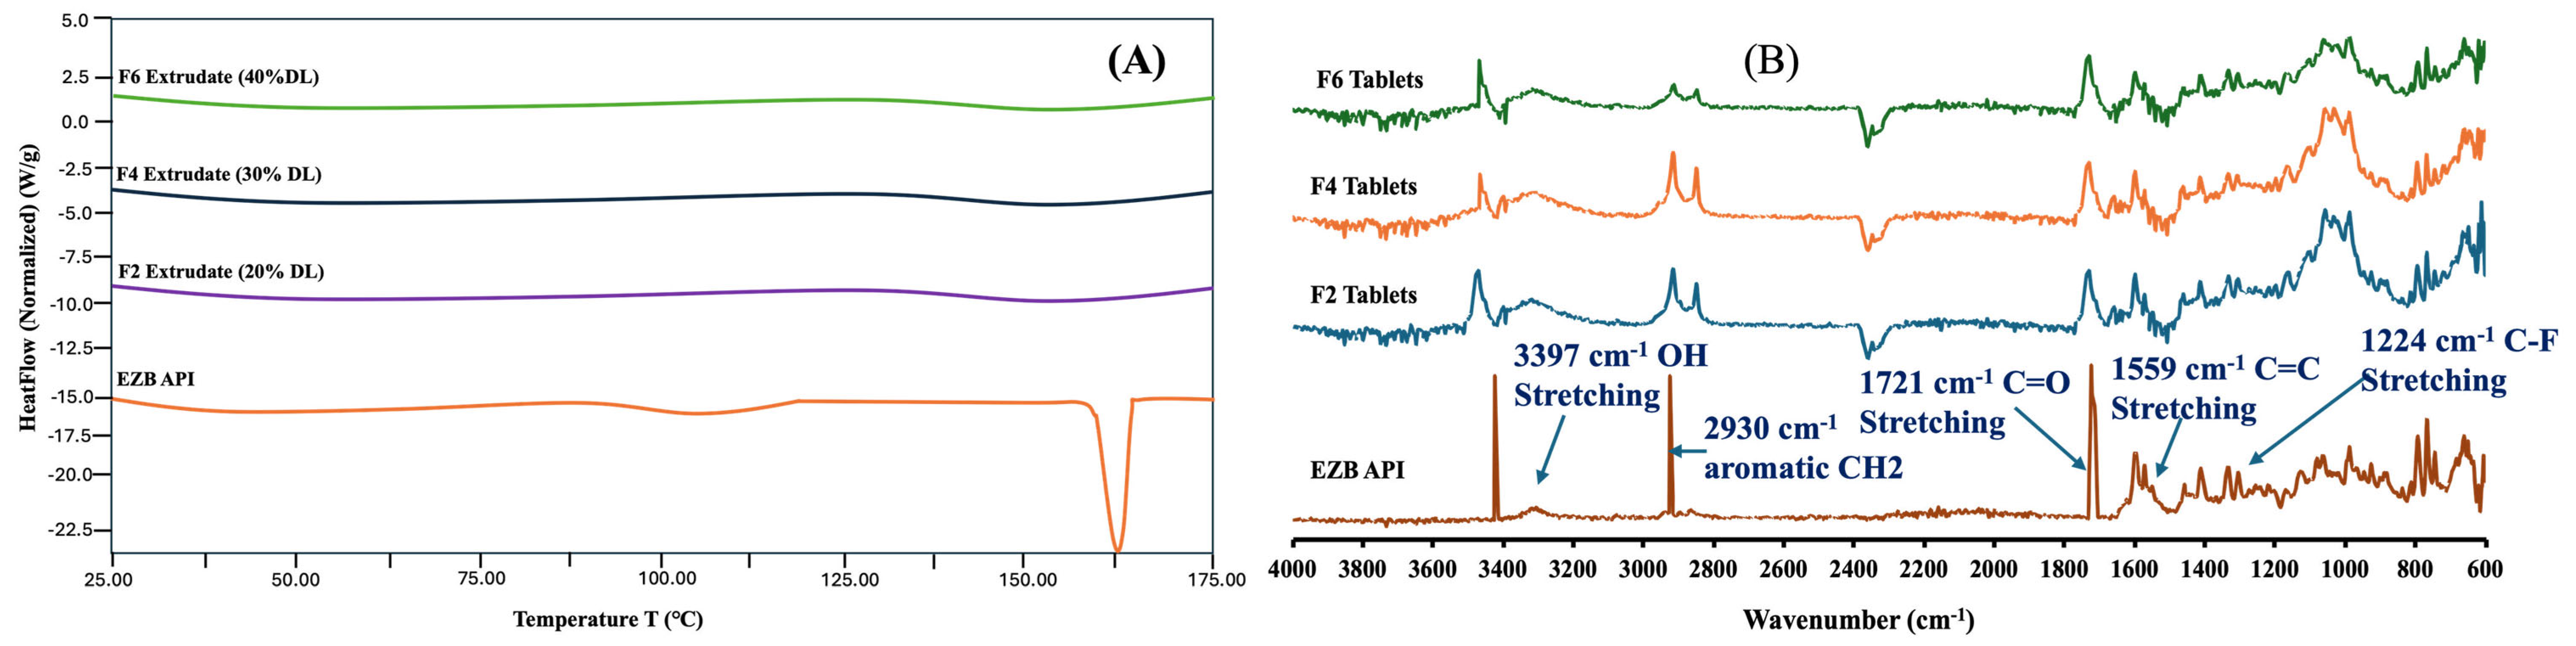
The dissolution profiles of all the formulations under investigation were studied in 0.1 N HCl (pH 1.2) in comparison with pure EZB. The ASD tablets (F2, F4, and F6) have demonstrated greater solubility over pure EZB. The entire dissolution run was conducted for 120 min to monitor any recrystallization or precipitation of the drug. Various research articles have been published reporting EZB as a potential recrystallization drug when present in a solution state. Over 120 min, the pure EZB crystalline drug has resulted in a maximum dissolution of 4.2% (0.42 mg), indicating 0.84 μg/mL of solubility, which is in line with the reported literature. All the ASD tablets have resulted in the dissolution of >80% in 30 min. The formulations with higher amounts of drug loading have resulted in faster release profiles in the order of F6 > F4 > F2. The faster release of high drug load formulations can be attributed to greater surface area exposure of amorphous drug to the bulk media. The amount of drug dissolved remained to be stable until 120 min of time point with no precipitation or recrystallization which can be due to the precipitation inhibition property of the copovidone polymer (Kollidon VA 64). Various studies have reported the precipitation inhibition property of copovidone when the amorphous drug is present in the solution state [53,54]. Thus, copovidone has not only served as a polymeric carrier for the amorphous EZB but also aided in inhibiting the drug precipitation. Developing ASDs of EZB has resulted in a 23.8-fold increase in solubility compared with the crystalline drug. The dissolution profiles of all the formulations under investigation are shown in Figure 8.

3.7. DSC and FTIR

The solid state of the drug within the tablets and the compatibility with the tablet excipients were further studied using DSC thermograms and FTIR spectra. The DSC thermograms of all the tablet formulations have resulted in the absence of characteristic melting peaks, indicating the existence of the drug in an amorphous form. The IR spectra of pure EZB has shown characteristic peaks at 3397 cm−1, 1721 cm−1, 1224 cm−1, 1559 cm−1, and 2930 cm−1 representing OH stretching, C=O stretching, aromatic C-F stretching, aromatic C=C, and aromatic CH2 respectively. All the characteristic peaks of neat EZB were preserved with no broadening or shifting within the IR spectra of tablet formulations (F2, F4, and F6), indicating no interactions and compatibility between the drug and formulation excipients. The characteristic peaks of pure EZB are in line with the reported literature [55,56,57]. The DSC and FTIR scans of the ASD tablet formulations are shown in Figure 9.

3.8. Stability Studies

The stability of ASD tablets of all three formulations (F2, F4, and F6) was studied at accelerated storage conditions for six months. The tablet characterization data at 3 M and 6 M is shown in Table 7. The DSC thermograms of all three formulations are shown in Figure 10. At 3 M of time point, all the formulations were found to be stable, and the results were in line with the initial (0 days) data. The weight variation was within the acceptable limits, and no significant drop in the tablet hardness was noticed. The tablets were able to retain mechanical integrity, with the friability being less than 0.5% and the disintegration time being below 5 min. The assay of the tablets was found to be consistent with the initial results, indicating no degradation of the drug. The DSC thermograms of all three formulations have shown the absence of a melting peak, confirming the presence of the drug in amorphous form. The dissolution profiles were in line with the initial data, and the calculated similarity factor between the test and reference samples was found to be greater than 50, confirming the similarity between the profiles. The dissolution profile of the stability samples is shown in Figure 11.
At 6 M of time point, the ASD tablet formulations (F4 and F6) consisting of Neusilin US2 were found to be stable with no recrystallization of the drug. Whereas the formulation consisting of EZB and copovidone with 20% drug load has resulted in recrystallization affecting the performance of the dosage form. Within the formulations F4 and F6, the drug might have entrapped in the cavities of Neusilin US2, thereby inhibiting drug mobility and preserving the stability of the formulations. Though the glass transition temperature of the stable formulations was well below the storage temperature, the presence of Neusilin has not only enabled high drug load but also preserved the stability upon storage at accelerated conditions. The weight variations of the tablets was found to be within acceptable limits, and the hardness of the tablets was found to be between 6–7 kp, indicating a slight drop in the mechanical integrity. The friability of unstable formulations was found to be 0.57 and remained below 0.5% for the stable formulations. The disintegration of the tablets was found to be similar to the initial tablets which is less than 5 min. The assay of all three formulations was within ±2%, indicating stability and no loss or degradation of the drug upon storage. The drug release profiles of unstable (F2) formulation has resulted in incomplete release profiles attributing to the presence of the drug in crystalline form. The formulation F2 has resulted in a drug dissolution of 51.45% towards the end of 120 min, indicating partial recrystallization. The dissolution profiles of stable formulations (F4 and F6) are in line with the initial (0 days) and 3 M release profiles. The calculated similarity factor for both the stable formulations is found to be greater than 50, confirming the similarity between the release profiles. The DSC thermograms of 6M stability samples have shown no characteristics of the endothermic peak for stable formulations (F4 and F6). Thus, the incorporation of Neusilin US2 as a porous carrier into the ASD system has not only improved the drug load but also preserved the stability of the formulation.

4. Conclusions

Increasing of drug loading in amorphous solid dispersions is one of the major limitations associated with the enabling platforms. In the current research, the amorphous drug loading was increased by up to 40% by the incorporation of Neusilin US2 as a porous carrier by employing an HME platform. The CTC profile has concluded better tabletability characteristics for the formulations with Neuslin US2 and high drug loading. Even the Neusilin-based formulations demonstrated promising flow properties when mixed with the other tableting excipients. The incorporation of copovidone (Kollidon VA 64) has not only served as a polymeric carrier but also prevented the drug precipitation in the solution state. Upon storage at accelerated conditions, the ternary dispersions were found to be stable with no drug recrystallization compared with the binary dispersion consisting of only the drug and polymer. The entrapment of amorphous drugs within the porous network of Neusilin might have limited molecular mobility and preserved stability. Thus, the current research concludes the feasibility of incorporating Neusilin US2 as a porous carrier within the amorphous solid dispersion formulations for improving drug loading and also for preserving stability.

Author Contributions

Conceptualization, N.V., P.S. and P.M.; methodology, P.P.; investigation, N.V., P.S., P.M. and P.P.; writing—original draft preparation, N.V. and S.K.M.; writing—review and editing, S.K.M., R.R.R.K. and D.N.; supervision, D.N. All authors have read and agreed to the published version of the manuscript.

Funding

This research received no external funding.

Institutional Review Board Statement

Not applicable.

Informed Consent Statement

Not applicable.

Data Availability Statement

The original contributions presented in this study are included in the article. Further inquiries can be directed to the corresponding author(s).

Conflicts of Interest

Nithin Vidiyala is employed by Sciegen Pharmaceuticals (Hauppauge, NY, USA), Pavani Sunkishala is employed by PCI Pharma Services (Bedford, NH, USA), Raghu Rami Reddy Kasu is employed by RK Pharma Inc. (Pearl River, NY, USA) and Dinesh Nyavanandi is employed by Cerevel Therapeutics (Cambridge, MA, USA). The authors declare no conflicts of interest.

References

  1. Yu, D.; Hoag, S.W. The Impact of Diluents on the Compaction, Dissolution, and Physical Stability of Amorphous Solid Dispersion Tablets. Int. J. Pharm. 2024, 654, 123924. [Google Scholar] [CrossRef] [PubMed]
  2. Deac, A.; Luebbert, C.; Qi, Q.; Courtney, R.M.; Indulkar, A.S.; Gao, Y.; Zhang, G.G.Z.; Sadowski, G.; Taylor, L.S. Dissolution Mechanisms of Amorphous Solid Dispersions: Application of Ternary Phase Diagrams to Explain Release Behavior. Mol. Pharm. 2024, 21, 1900–1918. [Google Scholar] [CrossRef] [PubMed]
  3. Bapat, P.; Paul, S.; Tseng, Y.C.; Taylor, L.S. Interplay of Drug-Polymer Interactions and Release Performance for HPMCAS-Based Amorphous Solid Dispersions. Mol. Pharm. 2024, 21, 1466–1478. [Google Scholar] [CrossRef] [PubMed]
  4. Moseson, D.E.; Tran, T.B.; Karunakaran, B.; Ambardekar, R.; Hiew, T.N. Trends in Amorphous Solid Dispersion Drug Products Approved by the U.S. Food and Drug Administration between 2012 and 2023. Int. J. Pharm. X 2024, 7, 100259. [Google Scholar] [CrossRef] [PubMed]
  5. Rusdin, A.; Mohd Gazzali, A.; Ain Thomas, N.; Megantara, S.; Aulifa, D.L.; Budiman, A.; Muchtaridi, M. Advancing Drug Delivery Paradigms: Polyvinyl Pyrolidone (PVP)-Based Amorphous Solid Dispersion for Enhanced Physicochemical Properties and Therapeutic Efficacy. Polymers 2024, 16, 286. [Google Scholar] [CrossRef] [PubMed]
  6. Nyavanandi, D.; Mandati, P.; Narala, S.; Alzahrani, A.; Kolimi, P.; Vemula, S.K.; Repka, M.A. Twin Screw Melt Granulation: A Single Step Approach for Developing Self-Emulsifying Drug Delivery System for Lipophilic Drugs. Pharmaceutics 2023, 15, 2267. [Google Scholar] [CrossRef] [PubMed]
  7. Tambe, S.; Jain, D.; Meruva, S.K.; Rongala, G.; Juluri, A.; Nihalani, G.; Mamidi, H.K.; Nukala, P.K.; Bolla, P.K. Recent Advances in Amorphous Solid Dispersions: Preformulation, Formulation Strategies, Technological Advancements and Characterization. Pharmaceutics 2022, 14, 2203. [Google Scholar] [CrossRef] [PubMed]
  8. Mamidi, H.K.; Palekar, S.; Nukala, P.K.; Mishra, S.M.; Patki, M.; Fu, Y.; Supner, P.; Chauhan, G.; Patel, K. Process Optimization of Twin-Screw Melt Granulation of Fenofibrate Using Design of Experiment (DoE). Int. J. Pharm. 2021, 593, 120101. [Google Scholar] [CrossRef] [PubMed]
  9. Mamidi, H.K.; Rohera, B.D. Application of Thermodynamic Phase Diagrams and Gibbs Free Energy of Mixing for Screening of Polymers for Their Use in Amorphous Solid Dispersion Formulation of a Non-Glass-Forming Drug. J. Pharm. Sci. 2021, 110, 2703–2717. [Google Scholar] [CrossRef] [PubMed]
  10. Mamidi, H.K.; Mishra, S.M.; Rohera, B.D. Determination of Maximum Flowable Liquid-Loading Potential of Neusilin® US2 and Investigation of Compressibility and Compactibility of Its Liquisolid Blends with PEG (400). J. Drug Deliv. Sci. Technol. 2019, 54, 101285. [Google Scholar] [CrossRef]
  11. Palekar, S.; Mamidi, H.K.; Guo, Y.; Vartak, R.; Patel, K. Corroborating Various Material-Sparing Techniques with Hot Melt Extrusion for the Preparation of Triclabendazole Amorphous Solid Dispersions. Int. J. Pharm. 2023, 640, 122989. [Google Scholar] [CrossRef] [PubMed]
  12. Mamidi, H.; Palekar, S.; Patel, H.; Nukala, P.K.; Patel, K. Formulation Strategies for the Development of High Drug-Loaded Amorphous Solid Dispersions. Drug Discov. Today 2023, 28, 103806. [Google Scholar] [CrossRef] [PubMed]
  13. Kelsall, K.N.; Schubiner, R.O.; Schenck, L.; Frank, D.S.; Matzger, A.J. Enhancing the Acidity of Polymers for Improved Stabilization of Amorphous Solid Dispersions: Protonation of Weakly Basic Compounds. ACS Appl. Polym. Mater. 2024, 6, 1592–1598. [Google Scholar] [CrossRef]
  14. Nyavanandi, D.; Mandati, P.; Vidiyala, N.; Parupathi, P.; Kolimi, P.; Mamidi, H.K. Enhancing Patient-Centric Drug Development: Coupling Hot Melt Extrusion with Fused Deposition Modeling and Pressure-Assisted Microsyringe Additive Manufacturing Platforms with Quality by Design. Pharmaceutics 2024, 17, 14. [Google Scholar] [CrossRef] [PubMed]
  15. Zhuo, X.; Foderà, V.; Larsson, P.; Schaal, Z.; Bergström, C.A.S.; Löbmann, K.; Kabedev, A. Analysis of Stabilization Mechanisms in β-Lactoglobulin-Based Amorphous Solid Dispersions by Experimental and Computational Approaches. Eur. J. Pharm. Sci. 2024, 192, 106639. [Google Scholar] [CrossRef] [PubMed]
  16. Petrova, S.P.; Mohamed, M.A.; Wu, H.; Taylor, L.S.; Edgar, K.J. Threading the Needle: Achieving Simplicity and Performance in Cellulose Alkanoate ω-Carboxyalkanoates for Amorphous Solid Dispersion. Carbohydr. Polym. 2024, 333, 121988. [Google Scholar] [CrossRef] [PubMed]
  17. Petersen, E.F.; Larsen, B.S.; Nielsen, R.B.; Pijpers, I.; Versweyveld, D.; Holm, R.; Tho, I.; Snoeys, J.; Nielsen, C.U. Co-Release of Paclitaxel and Encequidar from Amorphous Solid Dispersions Increase Oral Paclitaxel Bioavailability in Rats. Int. J. Pharm. 2024, 654, 123965. [Google Scholar] [CrossRef] [PubMed]
  18. Pisay, M.; Padya, B.S.; Mutalik, S.; Koteshwara, K.B. Stability Challenges of Amorphous Solid Dispersions of Drugs: A Critical Review on Mechanistic Aspects. Crit. Rev. Ther. Drug Carrier Syst. 2024, 41, 45–94. [Google Scholar] [CrossRef] [PubMed]
  19. Ugur, B.E.; Caggiano, N.J.; Monson, S.; Bechtold, A.G.; Seo, Y.; Prud’homme, R.K.; Priestley, R.D.; Webb, M.A. Molecular Interactions Underlying Dissolution Trends in Cannabidiol-Polymer Amorphous Solid Dispersions. Macromolecules 2024, 57, 8287–8297. [Google Scholar] [CrossRef]
  20. Tripathi, D.; Manjunatha Prabhu, B.H.; Sahoo, J.; Kumari, J. Navigating the Solution to Drug Formulation Problems at Research and Development Stages by Amorphous Solid Dispersion Technology. Recent. Adv. Drug Deliv. Formul. 2024, 18, 79–99. [Google Scholar] [CrossRef] [PubMed]
  21. Rudolph, N.; Charbe, N.; Plano, D.; Al Shoyaib, A.; Pal, A.; Boyce, H.; Zhao, L.; Wu, F.; Polli, J.; Dressman, J.; et al. A Physiologically Based Biopharmaceutics Modeling (PBBM) Framework for Characterizing Formulation-Dependent Food Effects: Paving the Road towards Fed Virtual BE Studies for Itraconazole Amorphous Solid Dispersions. Eur. J. Pharm. Sci. 2025, 209, 107047. [Google Scholar] [CrossRef] [PubMed]
  22. Wdowiak, K.; Tajber, L.; Miklaszewski, A.; Cielecka-Piontek, J. Sweeteners Show a Plasticizing Effect on PVP K30—A Solution for the Hot-Melt Extrusion of Fixed-Dose Amorphous Curcumin-Hesperetin Solid Dispersions. Pharmaceutics 2024, 16, 659. [Google Scholar] [CrossRef] [PubMed]
  23. Nyavanandi, D.; Narala, S.; Repka, M.A.; Nyavanandi, D.; Narala, S.; Repka, M.A. Hot-Melt Extrusion Paired Fused Deposition Modeling 3D Printing: Development of Pharmaceutical Medications; Springer: New York, NY, USA, 2024; pp. 169–194. [Google Scholar] [CrossRef]
  24. Bolla, G.; Sarma, B.; Nangia, A.K. Crystal Engineering of Pharmaceutical Cocrystals in the Discovery and Development of Improved Drugs. Chem. Rev. 2022, 122, 11514–11603. [Google Scholar] [CrossRef] [PubMed]
  25. Yao, C.; Zhang, S.; Wang, L.; Tao, X. Recent Advances in Polymorph Discovery Methods of Organic Crystals. Cryst. Growth Des. 2023, 23, 637–654. [Google Scholar] [CrossRef]
  26. Suresh, K.; Mehta, T.; Thakrar, V.; Sharma, R.G. Innovative Strategies in Generic Drug Development: The Role of Polymorph, Amorphous, Pseudopolymorph, and Cocrystal Solid Forms. Cryst. Growth Des. 2025, 25, 1282–1292. [Google Scholar] [CrossRef]
  27. Wu, D.; Zhang, B.; Yao, Q.; Hou, B.; Zhou, L.; Xie, C.; Gong, J.; Hao, H.; Chen, W. Evaluation on Cocrystal Screening Methods and Synthesis of Multicomponent Crystals: A Case Study. Cryst. Growth Des. 2021, 21, 4531–4546. [Google Scholar] [CrossRef]
  28. Baumgartner, A.; Dobaj, N.; Planinšek, O. Investigating the Influence of Processing Conditions on Dissolution and Physical Stability of Solid Dispersions with Fenofibrate and Mesoporous Silica. Pharmaceutics 2024, 16, 575. [Google Scholar] [CrossRef] [PubMed]
  29. Okada, K.; Ono, T.; Hayashi, Y.; Kumada, S.; Onuki, Y. Use of Time-Domain NMR for 1H T1 Relaxation Measurement and Fitting Analysis in Homogeneity Evaluation of Amorphous Solid Dispersion. J. Pharm. Sci. 2024, 113, 680–687. [Google Scholar] [CrossRef] [PubMed]
  30. Zhuo, X.; Tozzetti, M.; Arnous, A.; Leng, D.; Foderà, V.; Löbmann, K. Investigating the Influence of Protein Secondary Structure on the Dissolution Behavior of β-Lactoglobulin-Based Amorphous Solid Dispersions. Int. J. Pharm. 2024, 653, 123887. [Google Scholar] [CrossRef] [PubMed]
  31. Shen, P.; Hu, E.; Zhang, C.; Gao, Y.; Qian, S.; Heng, W.; Zhang, J.; Wei, Y. Hot “Dissolving” Extrusion of Lurasidone with Natural Liquid Small Molecule for Amorphous Solid Dispersion Based Self-Assembled Submicron Emulsion. Adv. Healthc. Mater. 2024, 13, 2302488. [Google Scholar] [CrossRef] [PubMed]
  32. Leon, A.S.C.; Waterman, K.C.; Wang, G.; Wang, L.; Cai, T.; Zhang, X. Accelerated Stability Modeling of Recrystallization from Amorphous Solid Dispersions: A Griseofulvin/HPMC-AS Case Study. Int. J. Pharm. 2024, 657, 124189. [Google Scholar] [CrossRef] [PubMed]
  33. Zhao, P.; Wang, H.; Jia, J.; Song, D.; Yang, L.; Tang, X.; He, Z.; Fu, Q. Moisture-Induced Limited Recrystallization May Not Reduce the Dissolution of Amorphous Solid Dispersions: A Case of Nitrendipine. J. Ind. Eng. Chem. 2024, 137, 235–242. [Google Scholar] [CrossRef]
  34. Song, S.; Yao, X.; Wang, C.; Sun, C.C.; Siegel, R.A. Delaying the First Nucleation Event of Amorphous Solid Dispersions above the Polymer Overlap Concentration (C*): PVP and PVPVA in Posaconazole. J. Pharm. Sci. 2025, 114, 98–104. [Google Scholar] [CrossRef] [PubMed]
  35. Rosiak, N.; Tykarska, E.; Cielecka-Piontek, J. Enhanced Antioxidant and Neuroprotective Properties of Pterostilbene (Resveratrol Derivative) in Amorphous Solid Dispersions. Int. J. Mol. Sci. 2024, 25, 2774. [Google Scholar] [CrossRef] [PubMed]
  36. Aulifa, D.L.; Al Shofwan, A.A.; Megantara, S.; Fakih, T.M.; Budiman, A. Elucidation of Molecular Interactions Between Drug–Polymer in Amorphous Solid Dispersion by a Computational Approach Using Molecular Dynamics Simulations. Adv. Appl. Bioinform. Chem. 2024, 17, 1–19. [Google Scholar] [CrossRef] [PubMed]
  37. Schoeman, C.; van Niekerk, S.; Liebenberg, W.; Hamman, J. Cyclodextrin Inclusion Complex and Amorphous Solid Dispersions as Formulation Approaches for Enhancement of Curcumin’s Solubility and Nasal Epithelial Membrane Permeation. Future J. Pharm. Sci. 2024, 10, 85. [Google Scholar] [CrossRef]
  38. Trenkenschuh, E.; Blattner, S.M.; Hirsh, D.; Hoffmann, R.; Luebbert, C.; Schaefer, K. Development of Ternary Amorphous Solid Dispersions Manufactured by Hot-Melt Extrusion and Spray-Drying—Comparison of In Vitro and In Vivo Performance. Mol. Pharm. 2024, 21, 1309–1320. [Google Scholar] [CrossRef] [PubMed]
  39. Mora-Castaño, G.; Millán-Jiménez, M.; Niederquell, A.; Schönenberger, M.; Shojaie, F.; Kuentz, M.; Caraballo, I. Amorphous Solid Dispersion of a Binary Formulation with Felodipine and HPMC for 3D Printed Floating Tablets. Int. J. Pharm. 2024, 658, 124215. [Google Scholar] [CrossRef] [PubMed]
  40. Almeida, H.; Teixeira, N.; Sarmento, B.; Vasconcelos, T. Freeze-Drying Cycle Optimization of an Amorphous Solid Dispersion of Resveratrol. Eur. J. Pharm. Sci. 2024, 200, 106855. [Google Scholar] [CrossRef] [PubMed]
  41. Samsoen, S.; Dudognon, É.; Le Fer, G.; Fournier, D.; Woisel, P.; Affouard, F. Impact of the Polymer Dispersity on the Properties of Curcumin/Polyvinylpyrrolidone Amorphous Solid Dispersions. Int. J. Pharm. 2024, 653, 123895. [Google Scholar] [CrossRef] [PubMed]
  42. Kim, T.K.; Fina, F.; Rossignolo, F.; Kim, S.H.; Lee, H.; Jeong, K.; Xu, X.; Pignaffo, C.; Yang, C.; Koo, J.; et al. Evaluation of a Spray-Dried Amorphous Solid Dispersion Formulation of ID11916, a New Molecular Entity with Dual Inhibition Mechanisms Targeting the Androgen Receptor and Phosphodiesterase Type-5. J. Pharm. Investig. 2024, 54, 317–327. [Google Scholar] [CrossRef]
  43. He, R.; Lamm, M.S.; Brunskill, A.; Axnanda, S.; Li, Y. Impact of Processing Methods on the Physico-Chemical Properties of Posaconazole Amorphous Solid Dispersions. Pharm. Res. 2024, 41, 141–151. [Google Scholar] [CrossRef] [PubMed]
  44. Rosiak, N.; Tykarska, E.; Cielecka-Piontek, J. Myricetin Amorphous Solid Dispersions—Antineurodegenerative Potential. Molecules 2024, 29, 1287. [Google Scholar] [CrossRef] [PubMed]
  45. Huzjak, T.; Jakasanovski, O.; Berginc, K.; Puž, V.; Zajc-Kreft, K.; Jeraj; Janković, B. Overcoming Drug Impurity Challenges in Amorphous Solid Dispersion with Rational Development of Biorelevant Dissolution-Permeation Method. Eur. J. Pharm. Sci. 2024, 192, 106655. [Google Scholar] [CrossRef] [PubMed]
  46. Lennernäs, H.; Brisander, M.; Liljebris, C.; Jesson, G.; Andersson, P. Enhanced Bioavailability and Reduced Variability of Dasatinib and Sorafenib with a Novel Amorphous Solid Dispersion Technology Platform. Clin. Pharmacol. Drug Dev. 2024, 13, 985–999. [Google Scholar] [CrossRef] [PubMed]
  47. Podgorbunskikh, E.; Kuskov, T.; Rychkov, D.; Lomovskii, O.; Bychkov, A. Mechanical Amorphization of Chitosan with Different Molecular Weights. Polymers 2022, 14, 4438. [Google Scholar] [CrossRef] [PubMed]
  48. Szafraniec-Szczęsny, J.; Antosik-Rogóż, A.; Kurek, M.; Gawlak, K.; Górska, A.; Peralta, S.; Knapik-Kowalczuk, J.; Kramarczyk, D.; Paluch, M.; Jachowicz, R. How Does the Addition of Kollidon®VA64 Inhibit the Recrystallization and Improve Ezetimibe Dissolution from Amorphous Solid Dispersions? Pharmaceutics 2021, 13, 147. [Google Scholar] [CrossRef] [PubMed]
  49. Knapik, J.; Wojnarowska, Z.; Grzybowska, K.; Hawelek, L.; Sawicki, W.; Wlodarski, K.; Markowski, J.; Paluch, M. Physical Stability of the Amorphous Anticholesterol Agent (Ezetimibe): The Role of Molecular Mobility. Mol. Pharm. 2014, 11, 4280–4290. [Google Scholar] [CrossRef] [PubMed]
  50. Baghel, S.; Cathcart, H.; O’Reilly, N.J. Polymeric Amorphous Solid Dispersions: A Review of Amorphization, Crystallization, Stabilization, Solid-State Characterization, and Aqueous Solubilization of Biopharmaceutical Classification System Class II Drugs. J. Pharm. Sci. 2016, 105, 2527–2544. [Google Scholar] [CrossRef] [PubMed]
  51. Reddy, K.R.; Mutalik, S.; Reddy, S. Once-Daily Sustained-Release Matrix Tablets of Nicorandil: Formulation and in Vitro Evaluation. AAPS PharmSciTech 2003, 4, 480–488. [Google Scholar] [CrossRef] [PubMed]
  52. Patel, R.; Bhimani, D.; Patel, J.; Patel, D. Solid-State Characterization and Dissolution Properties of Ezetimibe-Cyclodextrins Inclusion Complexes. J. Incl. Phenom. Macrocycl. Chem. 2008, 60, 241–251. [Google Scholar] [CrossRef]
  53. Tres, F.; Treacher, K.; Booth, J.; Hughes, L.P.; Wren, S.A.C.; Aylott, J.W.; Burley, J.C. Indomethacin-Kollidon VA64 Extrudates: A Mechanistic Study of PH-Dependent Controlled Release. Mol. Pharm. 2016, 13, 1166–1175. [Google Scholar] [CrossRef] [PubMed]
  54. Parmar, T.; Kadu, P.; Kale, P. Critical Strategies for Drug Precipitation Inhibition: A Review with the Focus on Poorly Soluble Drugs. Curr. Drug Deliv. 2022, 20, 497–507. [Google Scholar] [CrossRef]
  55. Sugandha, K.; Kaity, S.; Mukherjee, S.; Isaac, J.; Ghosh, A. Solubility Enhancement of Ezetimibe by a Cocrystal Engineering Technique. Cryst. Growth Des. 2014, 14, 4475–4486. [Google Scholar] [CrossRef]
  56. Martins, G.A.G.; Murakami, F.S.; Sangoi, M.S.; Todeschini, V.S.; Bernardi, L.R.; Oliveira, P. Characterization, Purity Determination and Decomposition Kinetics of Ezetimibe Under Non-Isothermal Conditions. Curr. Pharm. Anal. 2018, 15, 327–332. [Google Scholar] [CrossRef]
  57. Prajapati, P.; Pandey, J.; Shimpi, M.R.; Srivastava, A.; Tandon, P.; Velaga, S.P.; Sinha, K. Combined Spectroscopic and Quantum Chemical Studies of Ezetimibe. J. Mol. Struct. 2016, 1125, 193–203. [Google Scholar] [CrossRef]
Figure 1. Chemical structure and physicochemical properties of Ezetimibe Kollidon® VA 64, and Neusilin® US2.
Scipharm 93 00030 g001
Figure 2. Detailed information for the standard screw configured utilized for the extrusion of all the formulations in HME.
Scipharm 93 00030 g002
Figure 3. DSC thermograms of EZB, copovidone (PVP VA), Neusilin US2, physical blends and extruded materials. (A,B) Shows the DSC thermograms of formulation components and physical mixtures (C) shows the thermograms of extruded formulations (D) shows the glass transition temperature (Tg) of the amorphous solid dispersions.
Scipharm 93 00030 g003
Figure 4. PXRD diffractograms of milled HME extrudates.
Scipharm 93 00030 g004
Figure 5. Particle size distribution of milled HME extrudates.
Scipharm 93 00030 g005
Figure 6. Compressibility, Tabletability, Compactibility (CTC) profile for pre-roller compacted blends. (A) Tabletability profile (B) Compressibility profile (CE) Compactibility profiles.
Scipharm 93 00030 g006
Figure 7. Particle size distribution of milled roller compacted ribbons.
Scipharm 93 00030 g007
Figure 8. In vitro dissolution profiles of amorphous solid dispersion tablets.
Scipharm 93 00030 g008
Figure 9. (A) DSC thermograms (B) FTIR spectra of amorphous solid dispersion tablets.
Scipharm 93 00030 g009
Figure 10. DSC thermograms of amorphous solid dispersion tablets stored at accelerated conditions for (A) 3 months and (B) 6 months.
Scipharm 93 00030 g010
Figure 11. In vitro dissolution profiles of amorphous solid dispersion tablets stored at accelerated conditions for (A) three months and (B) six months.
Scipharm 93 00030 g011
Table 1. A detailed list of formulation compositions processed through HME.
Formulation#EZB (%w/w)Kollidon VA 64 (%)Neusilin US2 (%)
F-0011090-
F-0022080-
F-0033070-
F-004306010
F-005405010
F-006404515
F-007503515
F-008503020
Table 2. Detailed composition of formulations processed for roller compaction and tablet compression.
Materials%w/w
F2F4F6
Intragranular
HME milled extrudates50.0033.3325.00
Avicel PH102 (microcrystalline cellulose)29.0040.0045.00
SuperTab 21AN (lactose anhydrous)14.0019.6723.00
Aerosil 200 (colloidal silicon dioxide)1.001.001.00
AC-DI-SOL (Croscarmellose sodium)3.003.003.00
Magnesium stearate0.500.500.50
Total Intragranular Portion97.5097.5097.50
Extragranular
AC-DI-SOL (Croscarmellose sodium)2.002.002.00
Magnesium stearate0.500.500.50
Total Extragranular Portion2.502.502.50
Total100.00100.00100.00
Table 3. Detailed list of process parameters employed for the extrusion of materials through HME.
Process ParametersF1F2F3F4F5F6F7F8
Zone 1 (C)2525252525252525
Zone 2–8 (C)170170170175175180180upto 240
Die (C)165165165170170175175upto 235
Feed Rate (g/min)2.5–3.52.5–3.52.5–3.52.5–3.52.5–3.52.5–3.52.5–3.52.5–3.5
Screw Speed (RPM)5050505050505050
Process torque (%)45–5040–4535–4040–4535–4045–5040–45100
Die Nozzle (mm)2.52.52.52.52.52.52.52.5
Successful Extrusion (Yes/No)YesYesYesYesYesYesYesNo
Table 4. Detailed list of roller compaction process parameter and density of ribbons.
Formulation Roll Force (kN)Roll Speed (rpm)Screw Speed (rpm)Screw Current (Amps)True Density (g/cm)Envelop Density (g/cm)Solid Fraction
F213135–450.5–0.61.530.940.61
F413130–350.35–0.451.541.120.73
F613120–250.25–0.301.541.30.84
Table 5. Flow properties of milled HME powder, pre-roller compacted blends and milled ribbons.
FormulationManufacturing
Stage
Carr’s Index
(%)
Hausner’s RatioFlow Function
(FF)
F2HME Milled Powder 36.45 (Very poor flow)1.492.45 (Poor flow)
Pre-Roller Compaction Blend27.32 (Poor flow)1.375.66 (Intermediate flow)
Milled Ribbons18.36 (Fair flow)1.217.45 (Intermediate flow)
F4HME Milled Powder 36.11 (Very poor flow)1.493.11 (Poor flow)
Pre-Roller Compaction Blend22.51 (Passable flow)1.318.67 (Intermediate flow)
Milled Ribbons16.23 (Fair flow)1.2212.08 (Good flow)
F6HME Milled Powder 36.21 (Very poor flow)1.472.91 (Poor flow)
Pre-Roller Compaction Blend19.32 (Fair flow)1.209.77 (Intermediate flow)
Milled Ribbons14.27 (Free flow)1.14 14.89 (Good flow)
Table 6. Detailed information for the tablet characterization data.
FormulationWeight Variation (mg)Thickness (mm)Hardness (kp)Friability (%)Disintegration (s)Assay
(%)
F2100.12 ± 0.722.49 ± 0.217.2 ± 1.70.4318098.23 ± 0.54
F499.23 ± 1.212.55 ± 0.127.3 ± 1.30.3424098.67 ± 0.34
F6101.45 ± 1.672.63 ± 0.087.5 ± 0.90.4127099.31 ± 0.69
Table 7. Detailed tablet characterization data for the stability samples stored at accelerated conditions.
Stability Time PointFormulation Weight Variation (mg)Hardness (kp)Friability (%)Disintegration (s)Assay (%)
Initial (0 M)F2100.12 ± 0.727.2 ± 1.70.4318098.23 ± 0.54
F499.23 ± 1.217.3 ± 1.30.3424098.67 ± 0.34
F6101.45 ± 1.677.5 ± 0.90.4127099.31 ± 0.69
3 MF298.34 ± 1.216.8 ± 0.70.5419699.15 ± 1.23
F499.45 ± 0.677.2 ± 1.60.41235100.45 ± 0.67
F6100.33 ± 1.097.1 ± 1.10.4526097.63 ± 0.32
6 MF298.11 ± 0.116.4 ± 1.60.5718797.11 ± 1.31
F4100.01 ± 0.476.8 ± 0.50.44238101.21 ± 0.87
F699.65 ± 2.456.7 ± 1.20.41265100.09 ± 1.67
Disclaimer/Publisher’s Note: The statements, opinions and data contained in all publications are solely those of the individual author(s) and contributor(s) and not of MDPI and/or the editor(s). MDPI and/or the editor(s) disclaim responsibility for any injury to people or property resulting from any ideas, methods, instructions or products referred to in the content.

