Article

Simultaneous Profiling of Terpenes and Cannabinoids in Hemp Essential Oils Using Static Headspace Gas Chromatography–Mass Spectrometry for Quality Control and Chemotype Differentiation

by
Nathareen Chaiwangrach
1,
Sirikan Mukda
1,
Prapapan Temkitthawon
1,2,
Nitra Nuengchamnong
3,
Sarita Pinmanee
4,
Thapakorn Somboon
1,
Panatpong Boonnoun
5 and
Kornkanok Ingkaninan
1,*
1
Center of Excellence for Natural Health Product Innovation and Center of Excellence for Innovation in Chemistry, Faculty of Pharmaceutical Sciences, Naresuan University, Phitsanulok 65000, Thailand
2
Cosmetics and Natural Products Research Center, Faculty of Pharmaceutical Sciences, Naresuan University, Phitsanulok 65000, Thailand
3
Science Laboratory Center, Faculty of Science, Naresuan University, Phitsanulok 65000, Thailand
4
Highland Research and Development Institute (Public Organization), Chiang Mai 50200, Thailand
5
Department of Industrial Engineering, Chemical Engineering Program, Faculty of Engineering, Naresuan University, Phitsanulok 65000, Thailand
*
Author to whom correspondence should be addressed.
Sci. Pharm. 2025, 93(2), 27; https://doi.org/10.3390/scipharm93020027
Submission received: 30 April 2025 / Revised: 29 May 2025 / Accepted: 10 June 2025 / Published: 16 June 2025

Abstract

:
Hemp essential oils are rich in bioactive compounds, including terpenes and cannabinoids, yet standardized analytical methods for their simultaneous quality control are limited. This study aimed to (i) validate a static headspace gas chromatography–mass spectrometry (SHS-GC-MS) method for simultaneous quantification of 20 terpenes and 2 cannabinoids and (ii) apply it to fingerprint essential oils from four hemp strains, including local (HRDI2, HRDI5) and internationally cultivated (Charlotte’s Angel, Cherry Wine) varieties. The method met AOAC validation criteria, with detection limits of 0.025–0.5 µg/mL for terpenes and 1 µg/mL for cannabinoids. Quantitation limits ranged from 0.1–1 µg/mL for terpenes and 5 µg/mL for cannabinoids. Intraday precision (%RSD) ranged from 0.27–11.00%, while interday precision ranged from 3.14–13.89%. The method recoveries ranged from 85.12–115.47%. Precision and recovery confirmed the method’s reliability. Multivariate statistical analysis identified 82 metabolites, revealing distinct chemical fingerprints among strains, and emerged as newly identified chemotype markers, supporting chemotype classification. This work demonstrates, for the first time, a solvent-free, automatable SHS-GC-MS approach for simultaneous terpene and cannabinoid profiling in hemp essential oils, enabling both qualitative and quantitative characterization and supporting regulatory compliance for the development of standardized phytopharmaceutical products.

1. Introduction

Hemp refers to Cannabis sativa L., a versatile plant belonging to the Cannabaceae family, cultivated globally for its industrial, food, and medicinal applications [1]. Distinguished by its low levels of the psychoactive compound delta-9-tetrahydrocannabinol (Δ9-THC) [2], hemp has emerged as a valuable commodity in sectors ranging from textiles and biodegradable plastics to nutrition and pharmaceuticals [1]. The global demand for low-Δ9-THC hemp is on the rise, with an annual market value estimated between $100–200 million [3], largely driven by consumer preferences for sustainable, plant-based products. To ensure legal compliance, regulatory frameworks in many countries strictly limit the Δ9-THC content in hemp—typically to below 0.3% by dry weight, as seen under United States federal law and in the European Union [4]. These thresholds underscore the need for robust and accurate analytical methods for Δ9-THC quantification, especially as international trade in hemp-derived goods continues to expand.
Among hemp’s most valuable components are its inflorescences, which house a complex array of secondary metabolites [5,6] within the glandular trichomes [5]. These metabolites are not only central to the plant’s therapeutic potential but also serve as the primary chemical foundation of hemp essential oil (EO). Once overlooked, EO is now gaining significant traction across industries due to its bioactivity and sensory attributes. It has shown promise in botanical insecticides [7], antimicrobials [8], and as natural flavoring agents [9] in the food and beverage industry. Additionally, the volatile compounds in EO contribute to its unique and attractive fragrance [10]. As consumer demand for natural over synthetic fragrances grows, the essential oils market, valued at over $7.51 billion in 2018, is projected to expand at a compound annual growth rate exceeding 9% from 2019 to 2026 [11]. This growth underscores the substantial potential of EO as a niche product with diverse applications [12].
The EO’s composition includes monoterpenes such as α-pinene, myrcene, and terpinolene; sesquiterpenes such as α-humulene and caryophyllene; and cannabinoids, with cannabidiol (CBD) being the predominant compound. Δ9-THC is either absent or present only in trace amounts [12,13,14,15]. The combined presence of cannabinoids and terpenes contributes to what is known as the entourage effect, wherein synergistic interactions enhance therapeutic efficacy [16,17]. For instance, formulations combining terpenes with CBD have demonstrated enhanced antiviral activity against human coronavirus E229, outperforming positive controls such as pyrazofurin and glycyrrhizin [18]. Such findings highlight the importance of profiling EO not only for compositional integrity but also for identifying functional ingredients.
As global demand accelerates, ensuring the quality, consistency, and safety of hemp-derived products is now a crucial challenge for manufacturers and regulators alike. Consequently, standardized analytical protocols are essential for accurately assessing product composition [19]. Analytical tools must keep pace with market expansion and the evolving regulatory landscape. Gas chromatography (GC), particularly when coupled with flame ionization detection (FID) or mass spectrometry (MS), remains the gold standard for analyzing volatile and semi-volatile compounds in hemp, including terpenes and cannabinoids [19]. Conventional GC analyses are typically conducted at elevated temperatures that convert acidic cannabinoids—e.g., cannabidiolic acid (CBDA) and tetrahydrocannabinolic acid (THCA)—into their neutral forms (CBD, Δ9-THC). This total cannabinoid content is often measured as it represents the pharmacological activity of the material, unless otherwise required by specific regulations [19,20].
Sample preparation for GC analysis is crucial for reliable results. Conventional solvent extraction, though effective, is a multistep process that uses environmentally hazardous solvents and may involve heat, which can alter the natural terpenoid composition [21]. However, headspace (HS)-based methods, especially static headspace (SHS) and headspace solid-phase microextraction (HS-SPME), offer solvent-free alternatives aligned with green chemistry principles [19]. HS-SPME has been widely used to simultaneously assess terpenes and cannabinoids in plant matrices [20,22]. However, this method presents certain drawbacks, including high cost, fiber fragility, and sample carryover [23]. SHS, by contrast, offers simpler workflows, lower costs [24], straightforward sample preparation, and minimal contamination [21,25], making it highly suitable for routine quality control in EO analysis.
Nevertheless, reliable methods for simultaneous quantification of terpenes and cannabinoids in EO using SHS are scarce. Such methods are critical for global quality control, product standardization, and regulatory compliance, especially as hemp products enter complex international markets. The distinctive volatile profiles of EOs from different hemp strains offer valuable insights into their pharmacological potential and suitability for food applications. Therefore, this study aimed to address the growing global need for robust quality control methods for hemp-derived products by (i) validating a SHS-GC-MS method for the simultaneous quantification of 20 terpenes and 2 cannabinoids and (ii) applying multivariate statistical analysis to investigate the chemical fingerprints of EOs from four genetically diverse hemp strains including both local two local strains (HRDI2, HRDI5) and internationally cultivated (Charlotte’s Angel; CA, Cherry Wine; CW) varieties. The resulting profiles provide insights into varietal discrimination, potential chemotype markers, and compositional consistency, with implications for international trade, regulatory compliance, and functional product development.

2. Materials and Methods

2.1. Chemicals and Reagents

CBD (purity > 99.9%) was purchased from THC Pharm GmbH (Frankfurt am Main, Germany). Δ9-THC (purity > 95%) was prepared from the cannabis samples. All the narcotic test materials were legalized for research purposes by the Narcotics Control Division, Food and Drug Administration, Thailand. A terpene reference standard mixture at 2500 µg/mL, including myrcene (purity 89.4%), α-pinene (purity 99.5%), α-humulene (purity 94.7%), (−)-isopulegol (purity 100%), β-ocimene (purity 97%), (−)-guaiol (purity 99.0%), γ-terpinene (purity 97.1%), β-pinene (purity 100%), camphene (purity 94.2%), (+)-limonene (purity 98.4%), linalool (purity 98.6%), terpinolene (purity 97.2%), (−)-α-bisabolol (purity 94.5%), α-terpinene (purity 92.0%), β-caryophyllene (purity 99.0%), and delta-3-carene (purity 98.1%), was purchased from AccuStandard (New Haven, CT, USA). Fenchol (purity > 95.0%) and α-terpineol (purity > 96.0%) were purchased from Chanjao Longevity Co., Ltd. (Bangkok, Thailand). Tridecane (purity > 99.0%) was purchased from Tokyo Chemical Industry Co., Ltd. (Tokyo, Japan). (−)-Caryophyllene oxide (purity > 99.0%) and (−)-terpinen-4-ol (purity > 95.0%) were purchased from Sigma–Aldrich (St. Louis, MO, USA). LC-grade acetone was purchased from Merck (Darmstadt, Germany). Coconut oil was purchased from Lam Soon (Thailand) Public Company Limited (Samut Prakan, Thailand).

2.2. Plant Materials and Essential Oil Extraction

Hemp inflorescences of the HRDI2 and HRDI5 strains were obtained from the Highland Research and Development Institute (Public Organization) in Chiangmai, Thailand. The CW strain was obtained from Climat Thai Farm in Mukdahan, Thailand. The CA strain was obtained from the Ple La Ploen Community Enterprise in Buriram, Thailand. The inflorescences were extracted in triplicate using microwave-assisted extraction (Milestone ETHOS X advanced microwave extraction system, Italy), with water as the solvent for 40 min. The EO yields varied by strain, with values of 0.26 ± 0.04%w/w for HRDI2, 2.86 ± 0.22%w/w for HRDI5, 0.03 ± 0.02%w/w for CA, and 0.01 ± 0.01%w/w for CW.

2.3. Standard and Sample Preparation for SHS-GC-MS

A mixture of 22 analytes containing terpenes and cannabinoids was prepared in acetone. For the construction of calibration curves, a single stock solution of the analyte mixture was prepared to achieve a final concentration of 200 μg/mL. Calibration curves were prepared in the range of approximately 0.5 to 100 μg/mL. Each calibration solution included tridecane at a concentration of 150 μg/mL as an internal standard. An aliquot of 20 μL from each concentration was used to prepare the calibration curves.
An amount of 50 mg of EO was weighed and dissolved in acetone to prepare a 50 mg/mL solution, along with 150 µg/mL of tridecane. The sample was diluted with acetone to fall within the working range for determination. Samples were prepared in triplicate to ensure reproducibility. Subsequently, 20 µL of the sample was submitted for SHS-GC-MS analysis. All samples were prepared in 20 mL flat-bottom HS vials, sealed with 20 mm PTFE septa caps using a crimper (Agilent Technologies, Santa Clara, CA, USA).

2.4. SHS-GC-MS Analysis

Analyses were performed using a 7890B gas chromatograph coupled with a 5977B mass spectrometer and a 7697A Headspace sampler (Agilent Technologies, Singapore). Separation was achieved using an Rtx-50 crossbond 50% phenyl/50% methyl polysiloxane (30 m, 0.25 mm ID, 0.25 µm df) from Restek Corporation (Bellefonte, PA, USA). The SHS sampling conditions were optimized and the final settings were as follows. The samples were heated to 200 °C for 5 min to reach equilibrium. The loop temperature was set to 200 °C, the transfer line to 250 °C, and the gas phase was injected into the GC-MS for analysis. The injection time was 0.5 min.
For GC analysis, the oven temperature was initially set to 60 °C (held for 3 min), increased at 20 °C/min to 290 °C (held for 6 min), then raised to 300 °C at 40 °C/min (held for 3 min). The injection volume was 5 µL with a split ratio of 1:30. Helium was used as the carrier gas at a flow rate of 1 mL/min. The injector, transfer line, and ion source temperatures were 310 °C, 200 °C, and 280 °C, respectively.
For the MS detection, data acquisition was performed in SIM/SCAN mode. In SCAN mode, electron ionization (EI) was set at 70 eV, operating in full-scan acquisition mode over the m/z range of 40–750. In SIM mode, data were collected using selected ion monitoring mode with a dwell time of 50 ms. The qualifier ions for each analyte were chosen based on abundance to maximize the signal-to-noise ratio in matrix samples (Table 1).

2.5. Optimization of the SHS Sampling

To optimize headspace sampling conditions, extraction times of 5, 10, and 15 min at 200 °C, as well as extraction temperatures of 150, 175, and 200 °C for 5 min, were tested. The analytes selected for optimization, each at a concentration of 50 µg/mL, included α-pinene, camphene, β-pinene, α-terpinene, (+)-limonene, (−)-terpinene-4-ol, β-caryophyllene, α-humulene, (−)-caryophyllene oxide, CBD, and Δ9-THC. Each experimental condition was performed in triplicate. The peak areas of these compounds were recorded and normalized to the internal standard (tridecane) to determine the optimal conditions for SHS sampling.

2.6. SHS-GC-MS Method Validation

The SHS-GC-MS method was validated for the determination of terpenes and cannabinoids according to AOAC guidelines [26], including linearity, limits of detection (LODs), limits of quantitation (LOQs), precision, and accuracy evaluations. A mixture of terpene and cannabinoid standards was prepared and diluted with acetone to obtain working concentrations of 0.5, 1, 5, 10, 25, 50, and 100 µg/mL. The LODs and LOQs of the SHS-GC-MS method were determined based on signal-to-noise ratios, comparing the signal from known low concentrations of standard solutions with background noise. Intraday and interday precision were assessed using nine determinations across the specified range at three different concentrations of standard solutions. The relative standard deviation (%RSD) was calculated. Accuracy was evaluated by adding mixed standard solutions at three concentration levels to sample solutions of coconut oil and calculating the average recovery percentage for both terpenes and cannabinoids.

2.7. Data Processing and Multivariate Analysis of Essential Oils

All samples were analyzed in triplicate by SHS-GC-MS analysis and a single pool of all samples was used as a quality control (QC). The QC sample was processed to monitor the reproducibility and stability of the system and was injected at the beginning and periodically throughout the analysis. Raw HS-GC-MS files were converted to .mzML format using ProteoWizard 3.0 MSConvert and processed using Mzmine 4.4.3 software. Five main steps—mass detection, chromatogram building, feature resolving, spectral deconvolution, and alignment—were adapted from the literature [27] and carried out. Mass detection was set in centroid mode, and the noise level was set at 1 × 10³. The GC-MS chromatogram builder was configured with a minimum of 5 consecutive scans, a minimum intensity of 1 × 10⁴, a minimum absolute height of 1 × 10⁴, and an m/z tolerance of 0.01. The local minimum resolver module, used to resolve co-eluting and overlapping chromatographic peaks, was set as follows: chromatographic threshold, 90%; minimum search range RT/mobility, 0.05; minimum relative height, 0.001%; minimum peak top/edge ratio, 1.50; peak duration range, 0.00–2.00 min; and minimum number of scans, 4. Spectral deconvolution to construct fragmentation spectra for metabolites was carried out by RT grouping and shape correlation with the following parameters: retention time tolerance, 0.02 min; minimum signals in pseudo spectrum, 10; and minimum shape similarity, 0.9. Peak lists were all aligned using the GC aligner with an m/z tolerance of 0.01, RT tolerance of 0.1 min, and RT weight of 0.7. The minimum cosine similarity was set at 0.2. The aligned peak list was then exported as a .csv file, consequentially providing a feature ID number, m/z, RT, and peak area for each feature in all samples.
The dataset was then imported into Metaboanalyst 6.0 software for multivariate data analysis [28]. The following parameters were used: sample normalization by reference feature of internal standard; no data transformation; and Pareto-scaling (mean-centered values divided by the square root of the standard deviation). Principal component analysis (PCA) and hierarchical cluster analysis (HCA) were used to assess the unsupervised clustering pattern of essential oil compositions from different strains. For HCA, Euclidean distances were set as the distance measure and Ward’s linkage as the clustering algorithm. Clustering results were visualized as a heatmap and dendrogram.

3. Results and Discussion

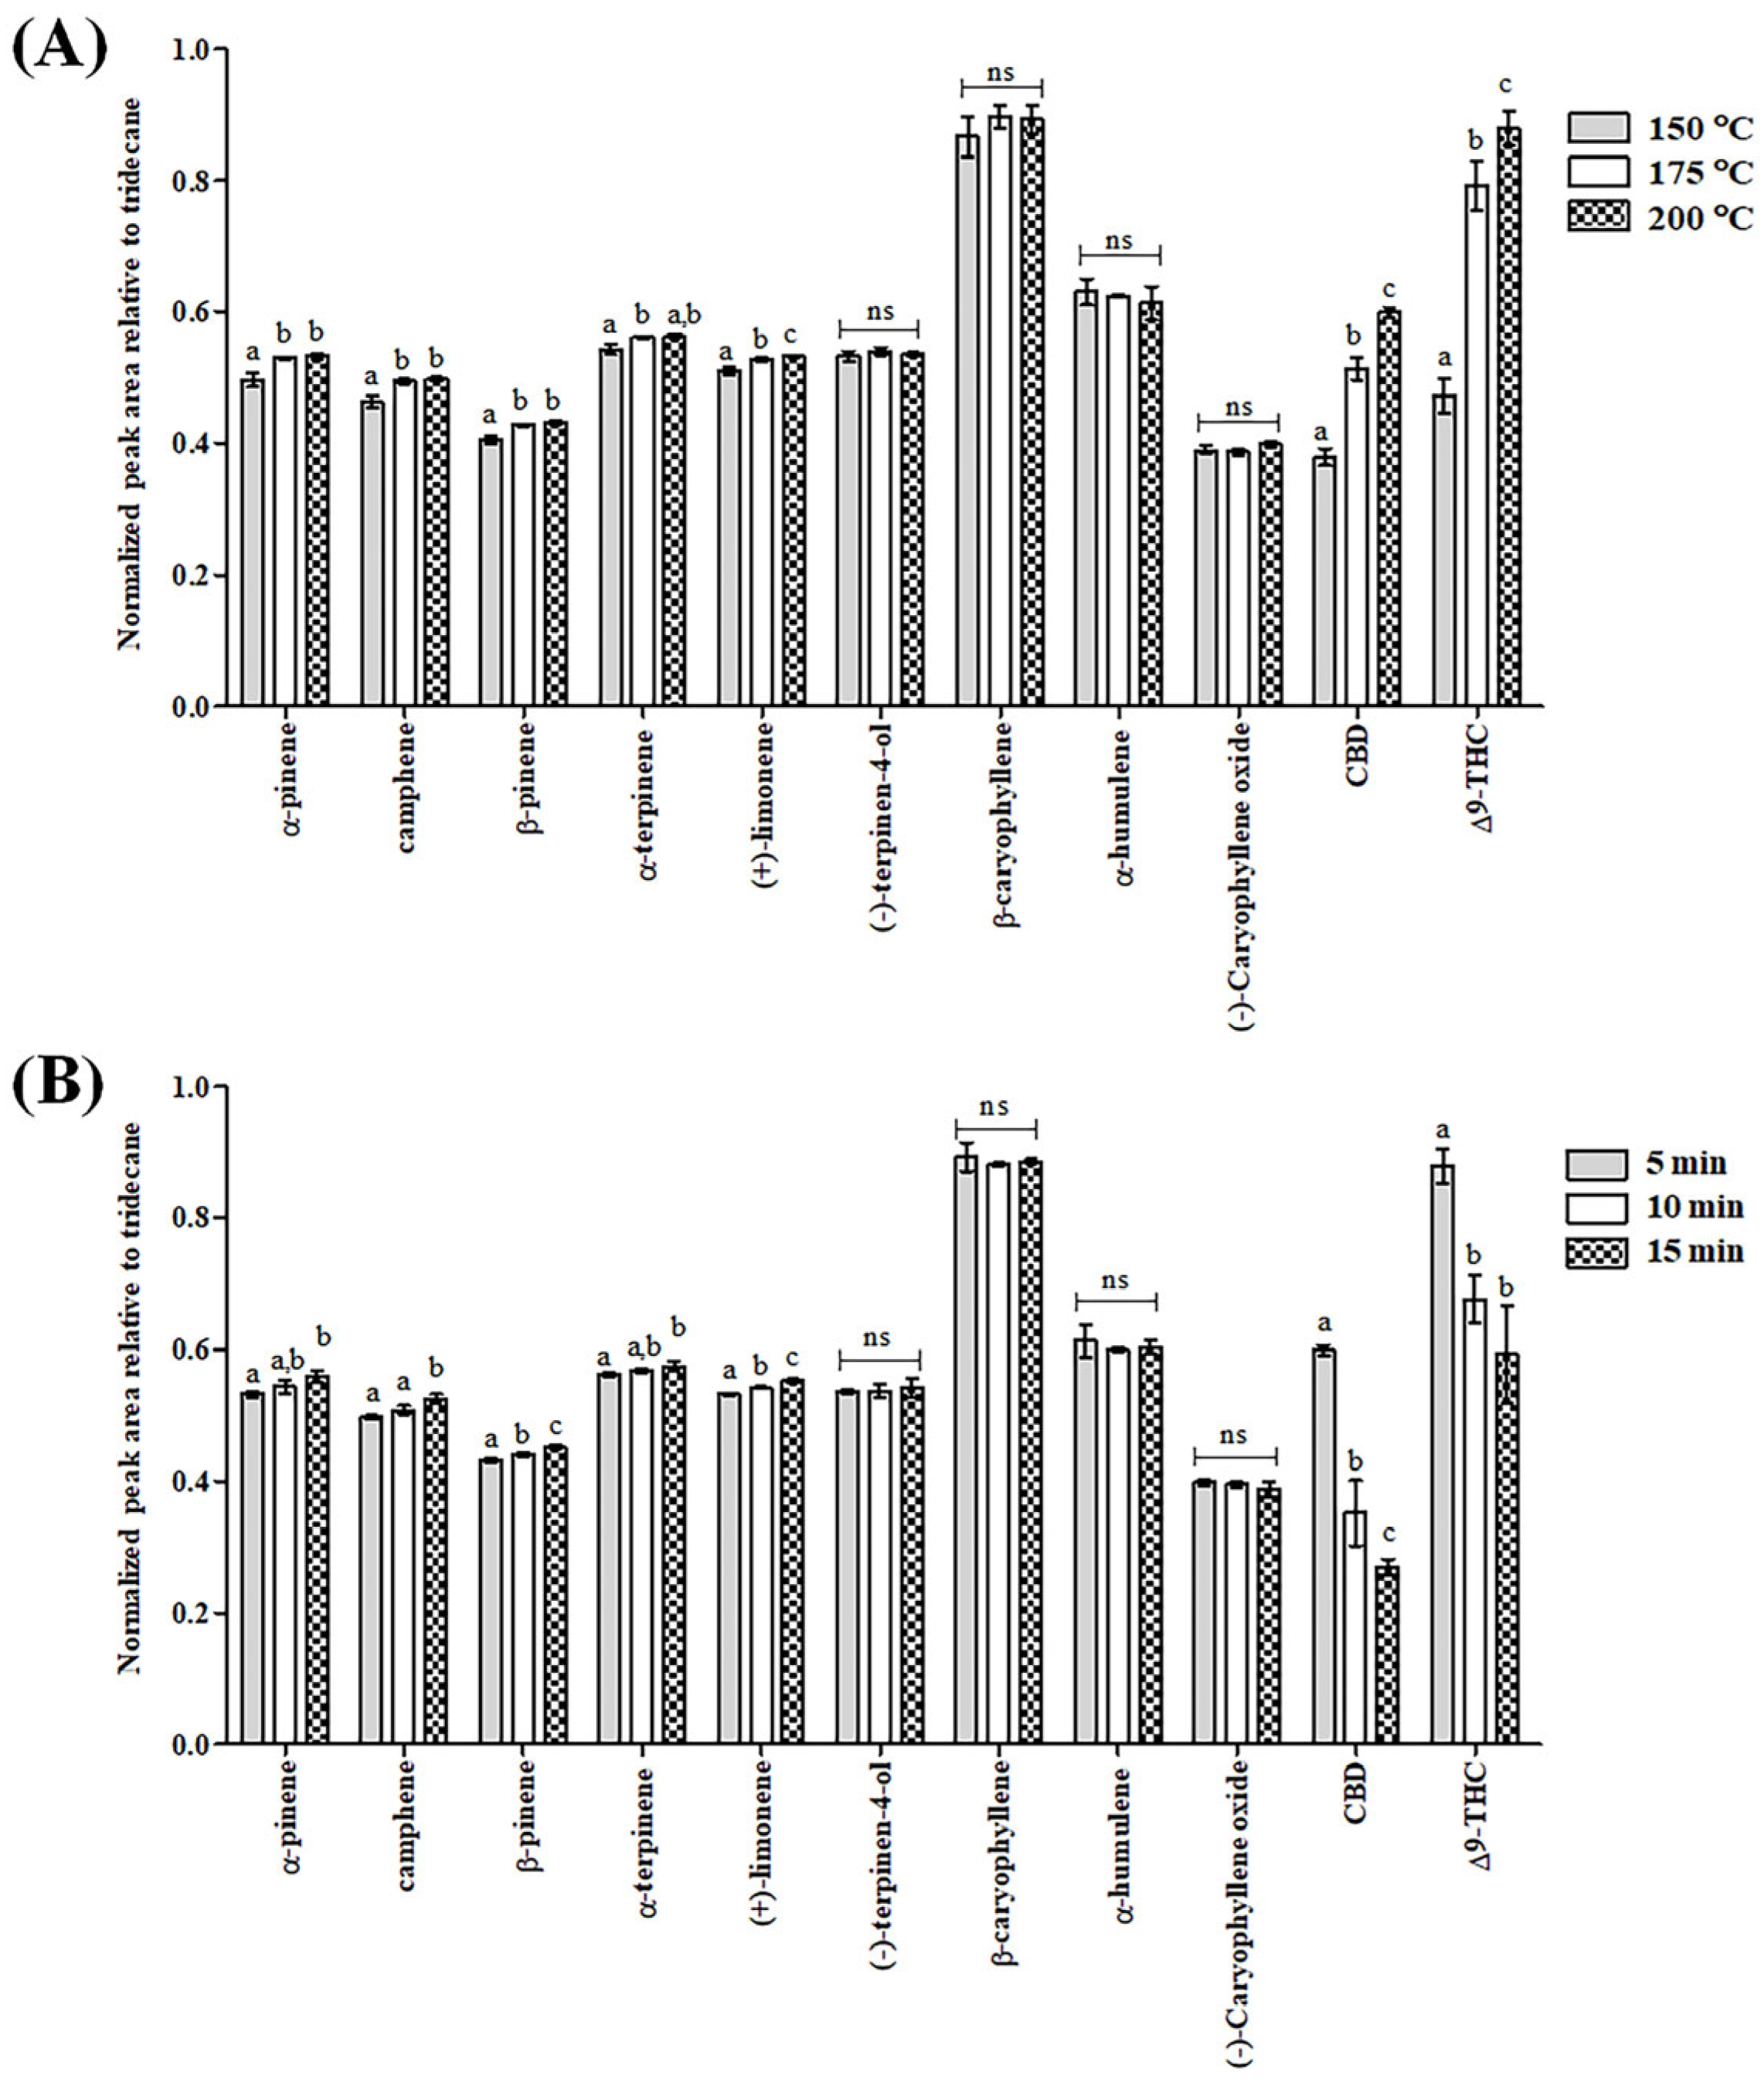
3.1. Optimization of the SHS Sampling

Since the simultaneous quantification of terpenes and cannabinoids in EO using SHS has not been previously reported, optimizing SHS conditions, especially incubation time and temperature, is essential. A standard solution containing representative terpenes and cannabinoids, including α-pinene, camphene, β-pinene, α-terpinene, (+)-limonene, (−)-terpinen-4-ol, β-caryophyllene, α-humulene, (−)-caryophyllene oxide, CBD, and Δ9-THC, was used for the optimization process. The effects of temperature (150, 175, and 200 °C) and incubation time (5, 10, and 15 min) on SHS extraction were evaluated based on the peak areas of representative compounds (50 µg/mL) normalized to tridecane (150 µg/mL), as shown in Figure 1.
Regarding the effect of temperature, cannabinoids have low volatility (boiling points calculated using Solaris V4.67: CBD, 392 ± 27 °C; Δ9-THC, 390 ± 27 °C), suggesting that higher temperatures can enhance their extraction into the HS [29]. Ilias et al. demonstrated that cannabinoid extraction should be performed at 150 °C to maximize their recovery in short sampling times (i.e., 5 min) when using SPME [29]. In contrast, terpenes are more volatile, which allows for efficient extraction at lower temperatures. To address these differences, our study extended the temperature range from 150 °C to 200 °C to ensure sufficient volatilization of both the low-volatility cannabinoids and the high-volatility terpenes.
Our results demonstrated that higher temperatures improved the extraction of cannabinoids and some monoterpenes (e.g., α-pinene, camphene, β-pinene, α-terpinene, (+)-limonene). However, no significant difference was observed for (−)-terpinen-4-ol, β-caryophyllene, α-humulene, and (−)-caryophyllene oxide. Interestingly, an extraction temperature of 200 °C efficiently extracted all compounds without causing significant thermal degradation. These results align with findings by Czégény et al., who investigated the effect of temperature on the composition of pyrolysis products of CBD in e-cigarettes by testing different operating temperatures (250–400 °C). They reported that depending on the temperature and atmosphere 25–52% of CBD can be converted into other cannabinoids, such as Δ9-THC, delta8-tetrahydrocannabinol, cannabinol, and cannabichromene [30], underscoring the risk of thermal degradation at elevated temperatures.
For the effect of extraction time, cannabinoids exhibited higher peak areas relative to tridecane at 5 min, but their levels decreased with longer incubation durations. While some monoterpenes (e.g., α-pinene, camphene, β-pinene, α-terpinene, (+)-limonene) increased slightly with longer incubation times, no significant changes were observed for (−)-terpinen-4-ol, β-caryophyllene, α-humulene, and (−)-caryophyllene oxide. The degradation of CBD and Δ9-THC was observed at extended incubation times (10–15 min). However, specific degradation products or other cannabinoids were not detected or identified in our analysis. The short extraction time minimizes thermal decomposition while still providing efficient simultaneous analysis. Therefore, an incubation time of 5 min at 200 °C provided the optimal balance between extraction efficiency and minimal thermal degradation.

3.2. SHS-GC-MS Method Validation

The SHS-GC-MS method was developed and validated according to AOAC guidelines [26] for the identification and quantification of the 20 terpenes and 2 cannabinoids in EO (Figure 2A). The chromatogram achieved satisfactory separation and retention time for terpenoids and cannabinoids within 23.75 min. Tridecane (C13) was selected as the internal standard since it was found that its retention time falls between the mono- (C10) and sesquiterpenes (C15), and it was not present in cannabis extracts as described by previous work [31]. However, in our study, tridecane partially overlapped with (−)-isopulegol, necessitating the use of selected ion monitoring (SIM) for improved quantification. SIM enabled the isolation of specific ions, reducing matrix interferences and improving analytical sensitivity. Thus, quantification of terpenes and cannabinoids was performed using SIM, which is more sensitive than the full scan mode and enhances precision [32].
In our study, no significant matrix effect was observed. Carryover, matrix effect, and extraction efficiency were not assessed because the solvent-free, static headspace approach inherently minimizes direct sample matrix contact with the injection system, eliminating common sources of these issues. Method validation results are summarized in Table 2. The LOD for individual terpenes and cannabinoids ranged from 0.025 to 1 µg/mL, while the LOQ ranged from 0.1 to 5 µg/mL. Some terpenes, such as α-pinene, camphene, and β-pinene, exhibited lower LOQ values than previously reported [21]. The working ranges were linear: 0.5–25 µg/mL for α-pinene, camphene, β-pinene, myrcene, delta-3-carene, α-terpinene, (+)-limonene, cis-β-ocimene, γ-terpinene, terpinolene, linalool, fenchol, (−)-terpinen-4-ol, α-humulene, (−)-guaiol, (−)-caryophyllene oxide, and (−)-α-bisabolol; 1–50 µg/mL for (-)-isopulegol, α-terpineol, and β-caryophyllene; and 5–100 µg/mL for CBD and Δ9-THC, with r2 values > 0.99 for all analytes. Intraday precision (%RSD) ranged from 0.27% to 11.00%, while interday precision ranged from 3.14% to 13.89%, with all values below the acceptable threshold of 20% [21]. Based on the literature and the physicochemical properties of terpenes and cannabinoids [33,34], recovery was tested using spiked blank coconut oil. Average recoveries of terpenes and cannabinoids spiked into placebo oil samples were also calculated. All analytes showed accuracies within 85.12–115.47%, which is within the acceptable range of 75–120% defined by AOAC guidelines [26]. These results demonstrate the method’s accuracy, precision, and reliability for quantifying terpenes and cannabinoids in EO. This study represents the first attempt to develop a reliable SHS-GC-MS method for the simultaneous quantification of both terpenes and cannabinoids in EO. Moreover, the SHS-GC-MS method offers key advantages over commonly used techniques such as HS-SPME. Specifically, SHS requires no costly or delicate fiber assemblies, resulting in significantly lower operational costs and easier method setup. SHS streamlined, solvent-free sample preparation reduces sample handling and potential matrix interferences, thereby minimizing variability and enhancing reproducibility, and is well suited for routine use in quality control laboratories.

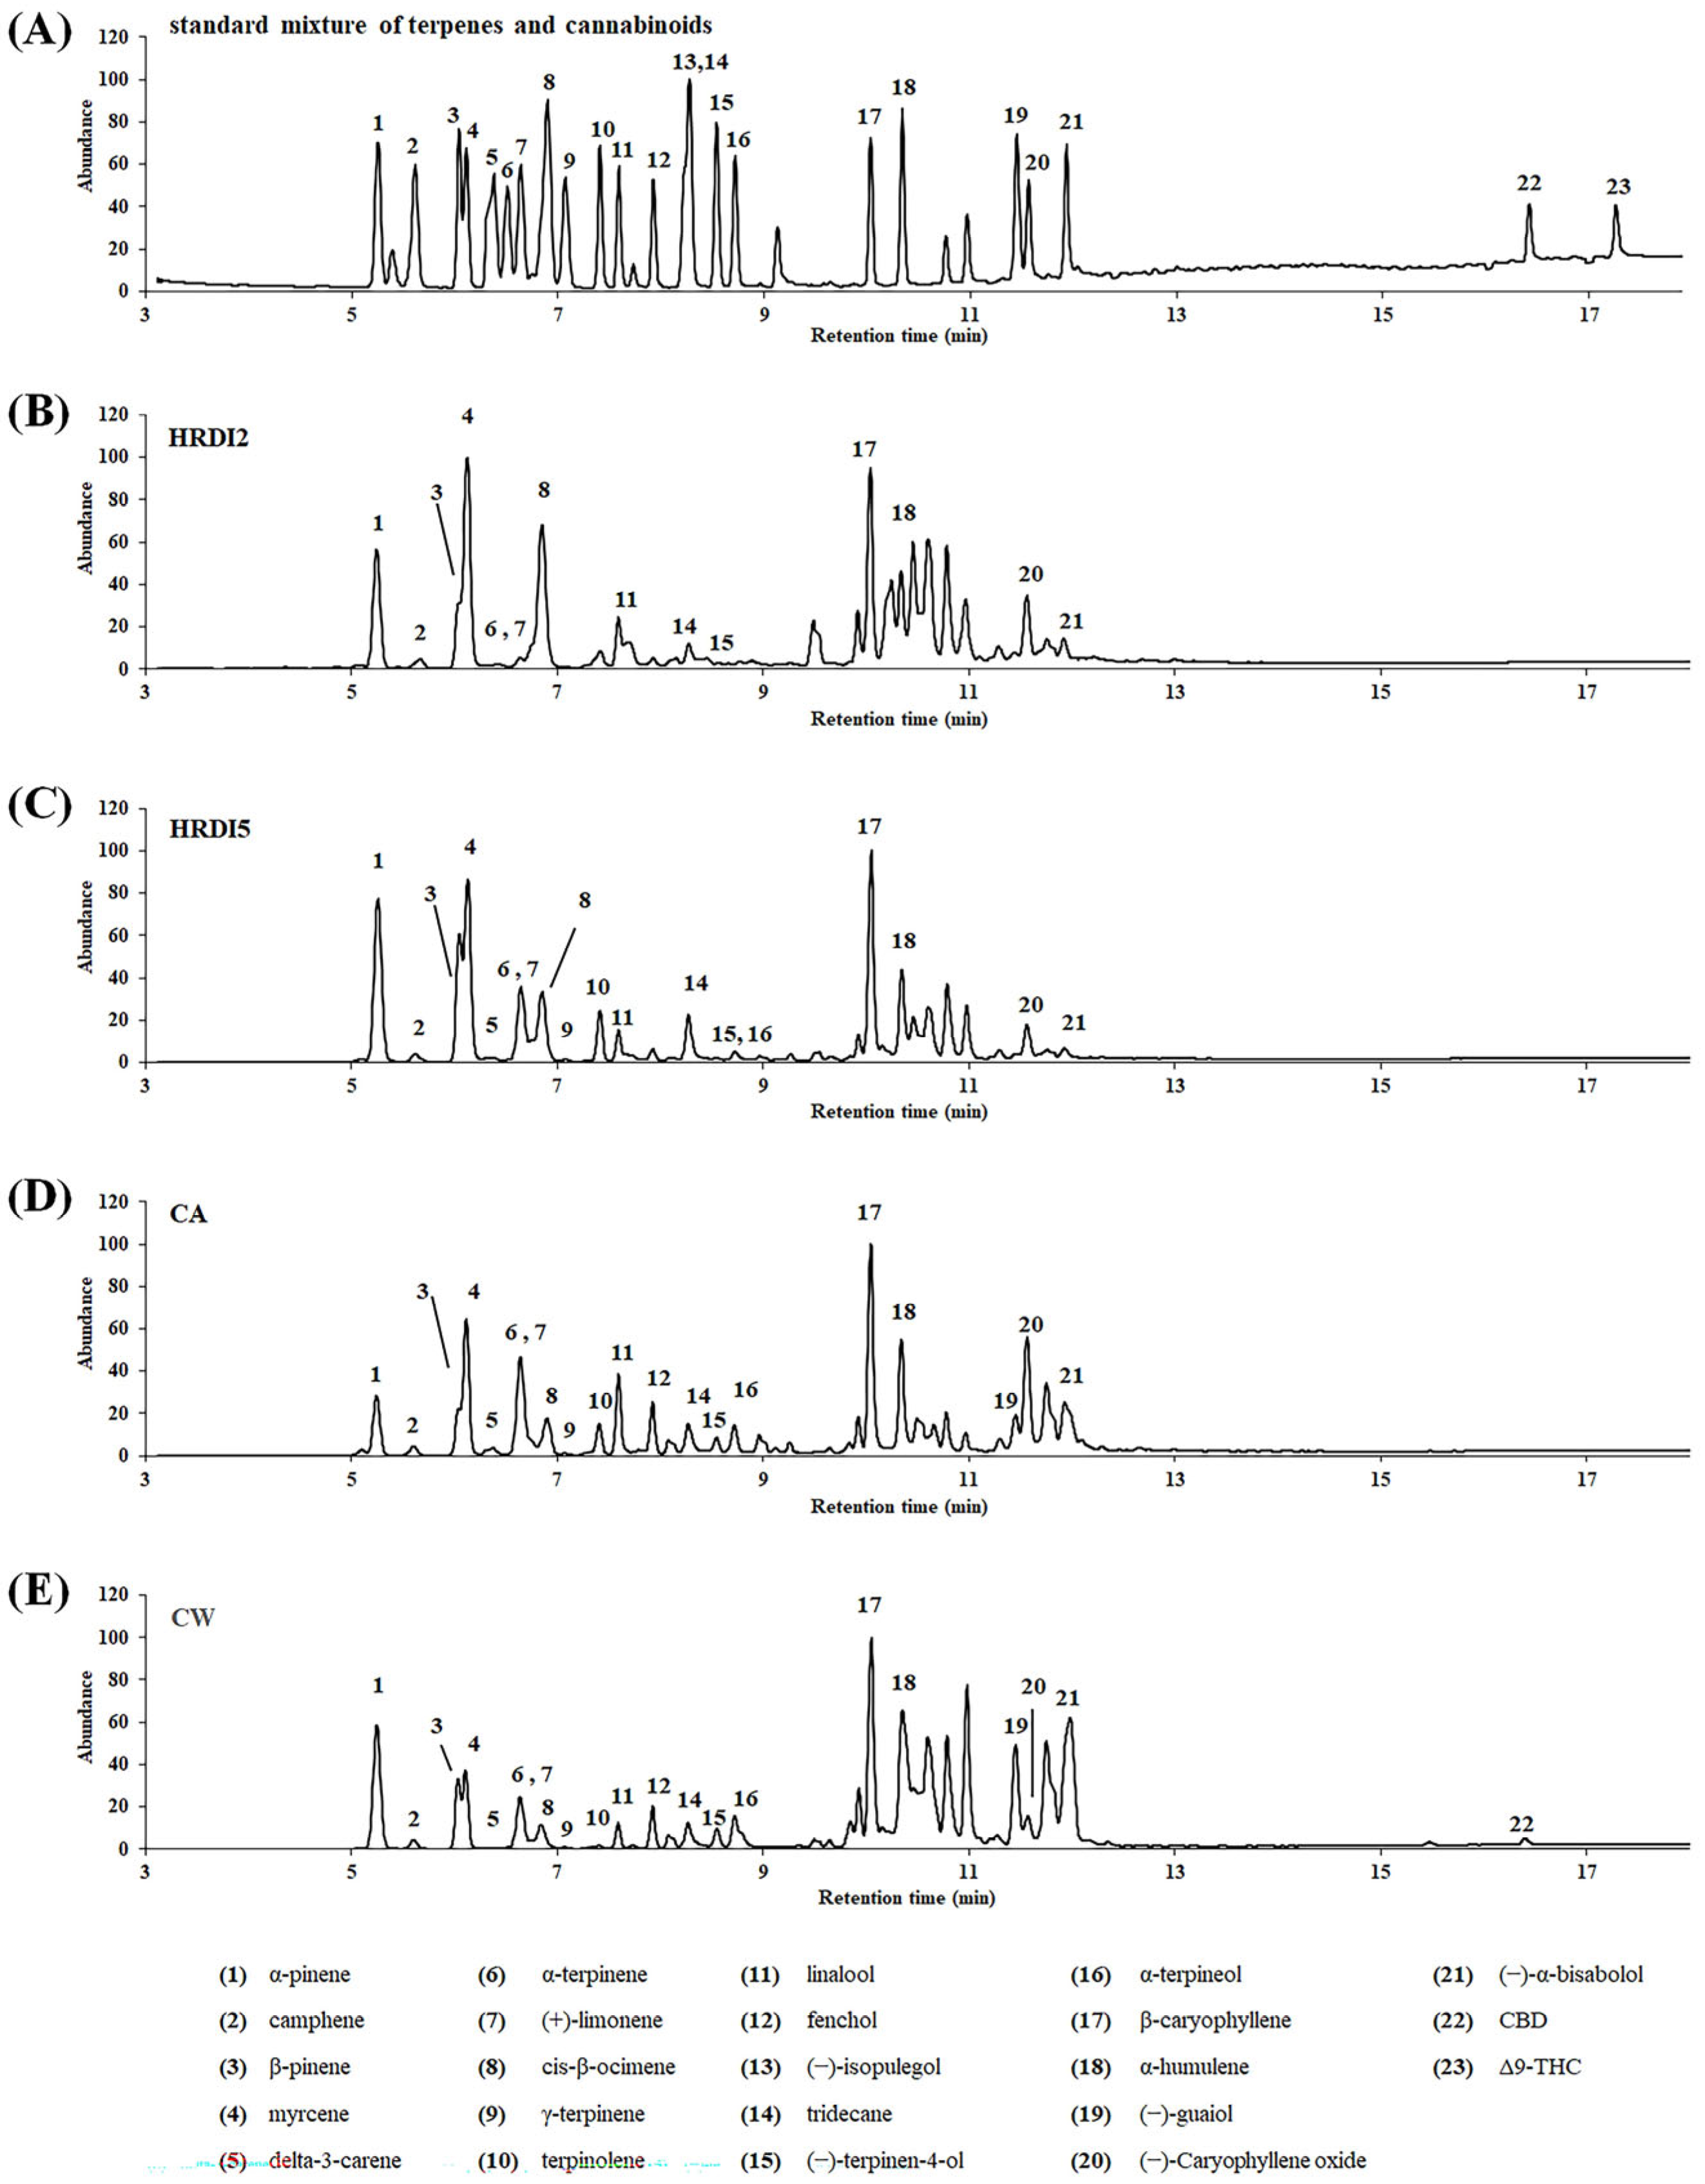
3.3. Quantitative Analysis of Terpenes and Cannabinoids in Hemp Essential Oil (EO)

The validated SHS-GC-MS method was applied to analyze essential oils (EOs) from four hemp strains: HRDI2, HRDI5, CA, and CW (Figure 2B–E). Both terpenes and cannabinoids were quantified, with the results presented in Table 3. Significant compositional differences were observed among the EOs, expressed as average %w/w ± SD (n = 3). Myrcene and β-caryophyllene were the dominant compounds across all samples, though their concentrations varied notably. Among the local strains, HRDI2 contained the highest myrcene content (15.35%), followed by HRDI5 (2.84%). Myrcene is widely recognized for its anxiolytic, antioxidant, anti-aging, anti-inflammatory, and analgesic properties [35], which may contribute to the calming effects associated with HRDI2 EO. In contrast, β-caryophyllene, a sesquiterpene known as a selective phytocannabinoid agonist of type 2 cannabinoid receptors (CB2), exerts anti-inflammatory and analgesic effects [36]. It was most abundant in the international strains with CW exhibiting the highest concentration (11.34%), while CA showed elevated levels of both β-caryophyllene (7.69%) and myrcene (7.00%), suggesting a potential synergistic profile that combines the pharmacological effects of both compounds. Additionally, α-pinene was consistently present at concentrations ≥ 1% across all EOs and is associated with anti-inflammatory, antioxidative, and neuroprotective effects, potentially contributing to the overall therapeutic benefits of these oils [37].
These findings align with the previous literature, where β-caryophyllene (45.4%), myrcene (25.0%), and α-pinene (17.9%) were reported as major constituents in EO derived from hemp cv. Felina 32 [7]. Other terpenes exhibited high variability among the samples, contributing to their distinct aromatic profiles of the EOs (see Table 3).
Moreover, cannabinoid analysis revealed that CBD was below the quantification limit (BQL) in most samples, except for CW (0.75 ± 0.14%). Δ9-THC was not detected in any sample, confirming compliance with industrial hemp regulations (<0.3% THC). The chemical composition of EO is influenced by several factors, including cultivar, harvesting period, and the extraction and processing methods used for the raw material [14,38]. These results underscore the critical role of rigorous quality control to ensure consistent characterization and quality of EO.
To gain deeper insights into the chemical diversity and better understand the unique volatile profiles, a multivariate analysis of hemp EO was conducted. This approach enabled a comprehensive evaluation of the data, shedding light on correlations between chemical profiles, the distinctive properties, and potentially therapeutic profiles of each strain.

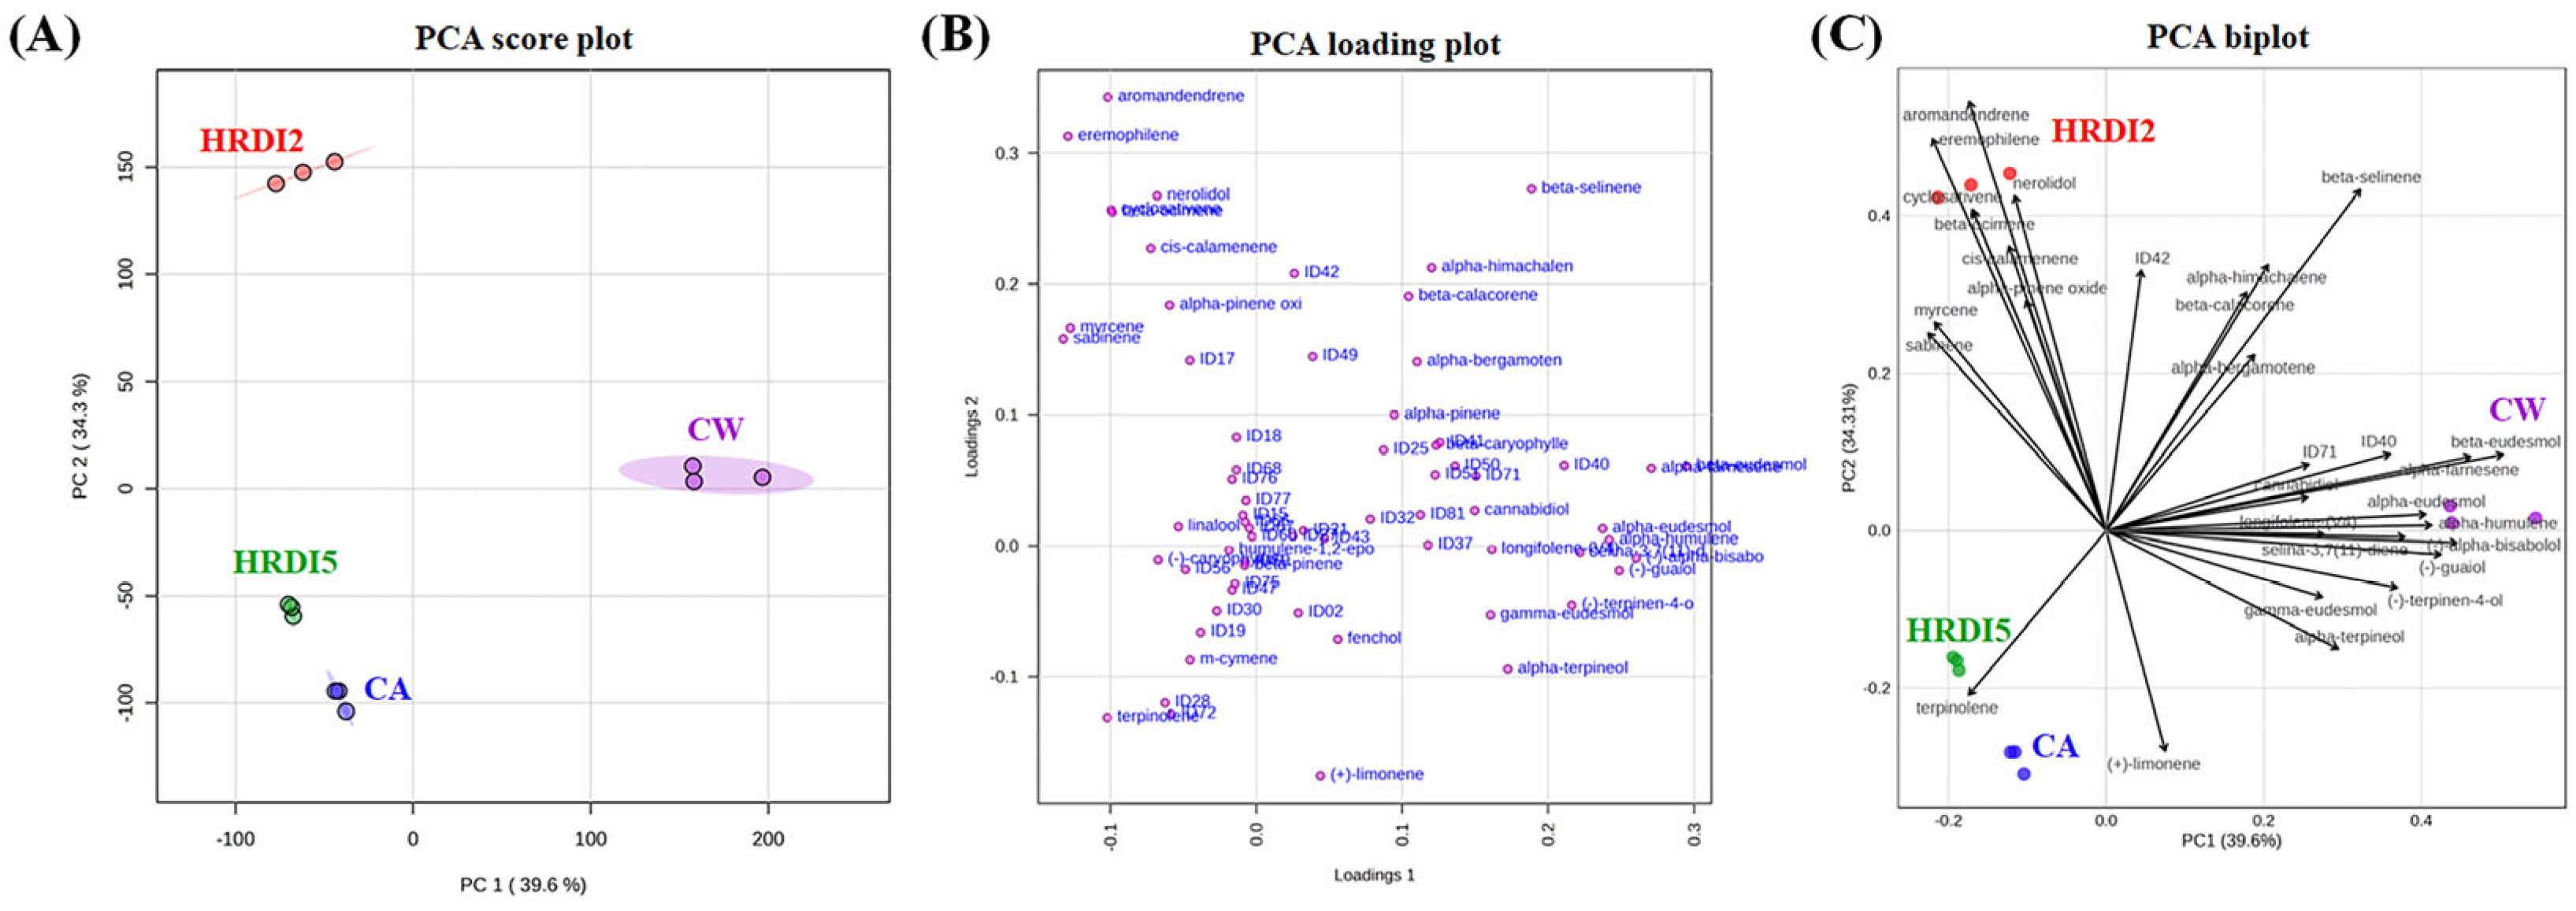
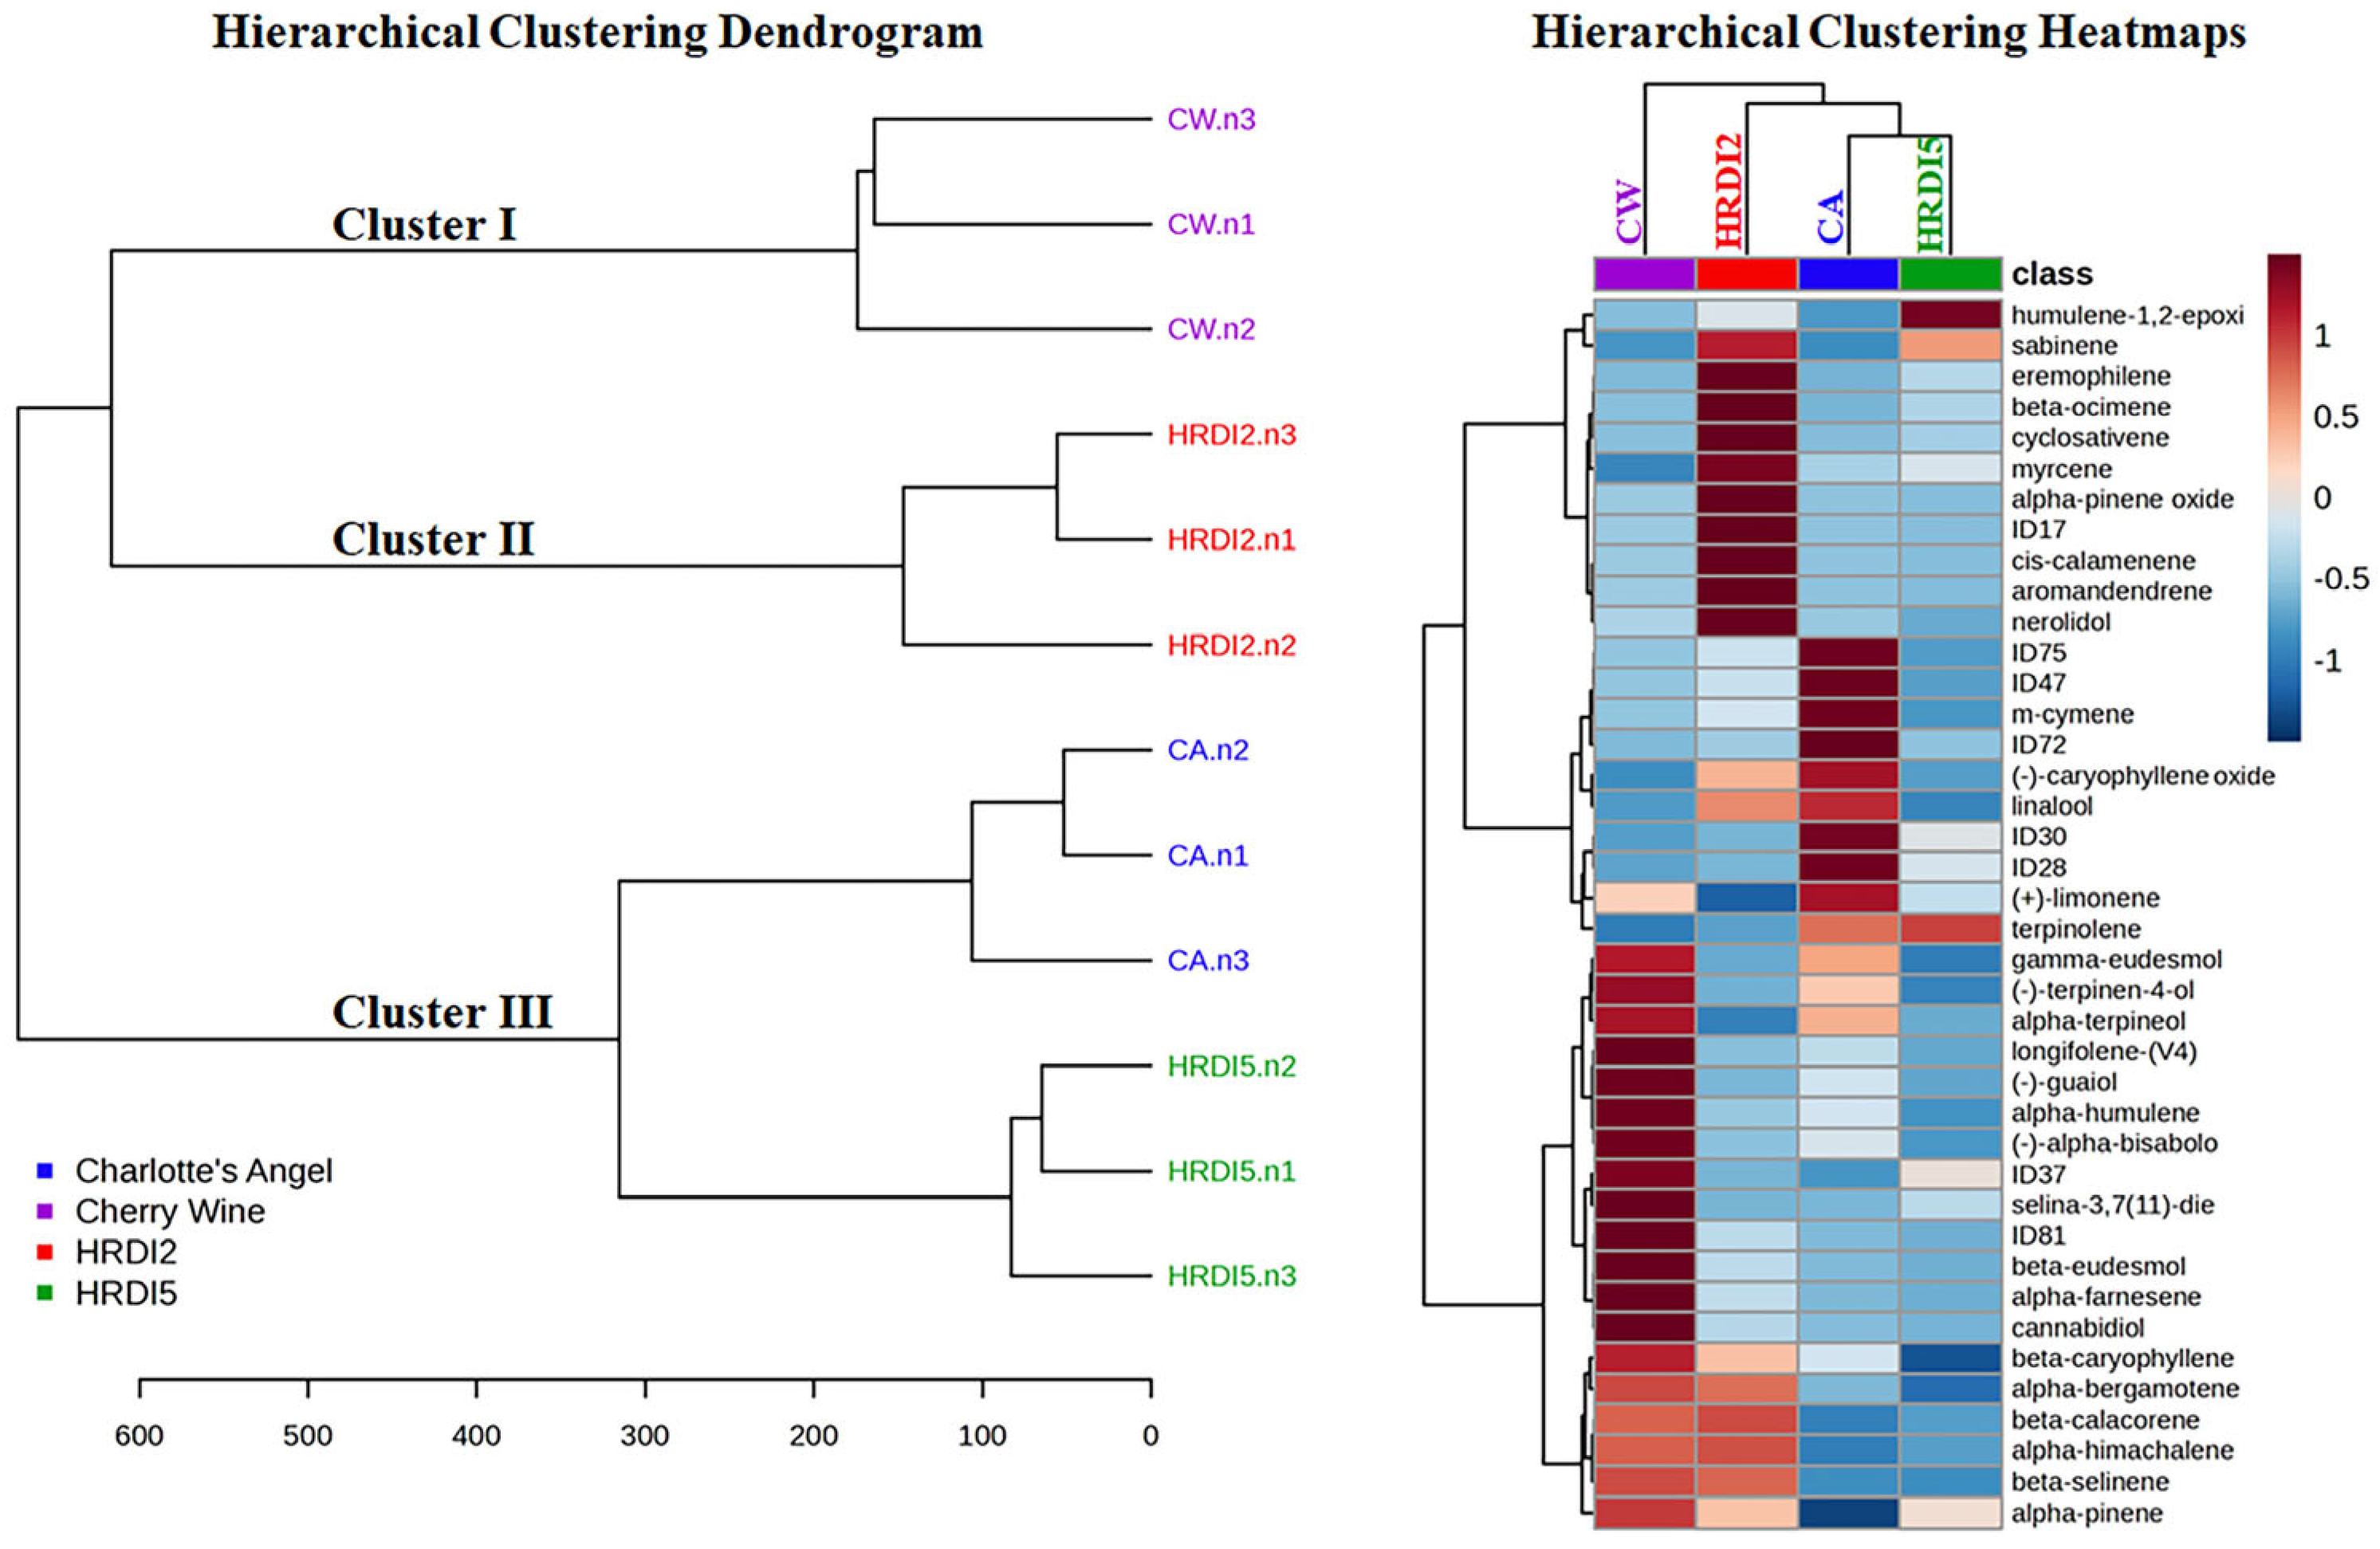
3.4. Multivariate Analysis of Hemp Essential Oils (EO)

To comprehensively compare the chemical compositions of different hemp strains, multivariate statistical analysis was performed using the peak area data obtained from the SHS-GC-MS analysis. PCA and HCA were used to investigate chemical differences among the four EO samples based on their volatile metabolite profiles. A total of 82 metabolites were identified using multivariate analysis. PCA revealed a significant compositional variance, with principal components 1 and 2 (PC1 and PC2) accounting for 73.9% of the total variance. The PCA score plot (Figure 3A) clearly separated the samples, with CW and HRDI2 samples forming distinct clusters away from the other varieties.
The compound-level contribution to group separation is shown in the PCA loading plot (Figure 3B), and the biplot visualizes the distribution of compounds and samples (Figure 3C). The key compounds responsible for this separation were myrcene, sabinene, α-pinene oxide, cis-calamenene, β-ocimene, cyclosativene, nerolidol, eremophilene, and aromandendrene, all of which showed high factor loadings on the positive side of PC2, indicating their higher abundance in the HRDI2 variety. Among these, cis-calamenene and cyclosativene emerged as newly identified chemotype markers, not previously reported in EO chemoprofiling and unique to the local HRDI2 variety.
CW, located in the lower right side of the PCA score, exhibited a unique profile characterized by CBD and terpene such as β-caryophyllene, β-eudesmol, α-farnesene, α-humulene, (−)-α-bisabolol, selina-3,7(11)-diene, (−)-guaiol, (−)-terpinen-4-ol, γ-eudesmol, and longifolene-(V4). This finding is in accordance with the study by Valtcho and Filippo [39], which reported that the EO of CW was predominantly composed of myrcene, β-caryophyllene, selina-3,7(11)-diene, and CBD.
In contrast, CA was predominantly associated with (+)-limonene, further emphasizing the varietal differences. This result aligns with the previous literature [16], which classified CA within a chemotype group characterized by limonene and β-caryophyllene. Interestingly, the local and international varieties, HRDI5 and CA, clustered closely together in the PCA score plot, suggesting similarities in their chemical profiles, particularly in their terpinolene content.
HCA provided additional insights into the clustering of samples. The dendrogram (Figure 4) identified three major clusters (I–III). Cluster I comprised CW, and Cluster II included HRDI2—both separated by considerable Euclidean distance, indicating substantial chemical divergence from the other samples. Cluster III included HRDI5 and CA, which shared similar profiles, particularly in terpinolene content. Additionally, the heatmap (Figure 4) visualizes compound abundance using color intensity, with reddish shades indicating higher relative levels. This representation confirmed the chemical differentiation of the EOs, especially in monoterpenes, sesquiterpenes, and CBD.
Overall, the multivariate analysis revealed distinct chemical profiles for each hemp EO variety cultivated in Thailand, highlighting the considerable variability in terpene and cannabinoid content across strains. Strain-specific biomarkers such as myrcene, terpinolene, and CBD contributed to chemotype differentiation and were consistent with prior reports. This study represents the first effort to profile and compare the chemical fingerprints of hemp EOs from both local and internationally cultivated strains under Thai growing conditions. These findings support the application of chemometric tools for chemotype classification and the rational development of EO-based products in the medicinal, therapeutic, and food sectors.

4. Conclusions

In conclusion, this study successfully developed and validated a SHS-GC-MS method for the simultaneous quantification and fingerprinting of 20 terpenes and 2 cannabinoids in EOs. The method is solvent-free, automatable, and compliant with AOAC validation guidelines, making it suitable for routine quality control. Integration with multivariate statistical analysis enabled a comprehensive assessment of chemical diversity and differentiation among hemp cultivars. This analytical approach provides a transferable platform for regulatory compliance, standardization, and consistent product development, supporting the broader utilization of hemp-derived EOs in the pharmaceutical, nutraceutical, cosmetic, and food industries. Given its operational simplicity and economic efficiency, we suggest that this SHS-GC-MS method is eminently suited for implementation across both industrial applications and regulatory frameworks.

Author Contributions

Investigation, data curation, formal analysis, writing—original draft, writing—review and editing, methodology, N.C.; investigation, data curation, formal analysis, S.M.; conceptualization, metabolomics, investigation, P.T. and N.N.; investigation, T.S., S.P., and P.B.; conceptualization, methodology, formal analysis, writing—original draft, writing—review and editing, supervision, K.I. All authors have read and agreed to the published version of the manuscript.

Funding

This work was supported by the National Research Council of Thailand (NRCT5-RGJ63009-106), National Science, Research and Innovation Fund (NSRF) via the Program Management Unit for Human Resources and Institutional Development, Research and Innovation (B16F640099), Institute for Small and Medium Enterprises Development, the Agricultural Research Development Agency (Public Organization), and the Center of Excellence for Innovation in Chemistry (PERCH-CIC). This work was partially supported by Global and Frontier Research University Fund, Naresuan University (Grant number R2566C053).

Institutional Review Board Statement

Not applicable.

Informed Consent Statement

Not applicable.

Data Availability Statement

The data that support the findings of this study, including raw data, SHS-GC-MS method validation results, and multivariate statistical analysis outputs, are available from the corresponding author upon reasonable request.

Acknowledgments

The Highland Research and Development Institute (Public Organization) is thanked for providing the hemp material. The authors acknowledge the assistance of ChatGPT (OpenAI), version GPT-4o-mini, in providing language and grammar suggestions during manuscript preparation.

Conflicts of Interest

The authors declare no conflicts of interest.

Abbreviations

The following abbreviations are used in this manuscript:
BQLbelow the quantification limit
CACharlotte’s Angel
CBDcannabidiol
CWCherry Wine
EOhemp essential oil
LODlimit of detection
LOQlimit of quantitation
QCquality control
RSDrelative standard deviation
SHS-GC-MSstatic headspace gas chromatography–mass spectrometry
Δ9-THCdelta-9-tetrahydrocannabinol

References

  1. Rehman, M.; Fahad, S.; Du, G.; Cheng, X.; Yang, Y.; Tang, K.; Liu, L.; Liu, F.-H.; Deng, G. Evaluation of hemp (Cannabis sativa L.) as an industrial crop: A review. Environ. Sci. Pollut. Res. 2021, 28, 52832–52843. [Google Scholar] [CrossRef] [PubMed]
  2. Cerino, P.; Buonerba, C.; Cannazza, G.; D’Auria, J.; Ottoni, E.; Fulgione, A.; Di Stasio, A.; Pierri, B.; Gallo, A. A review of hemp as food and nutritional supplement. Cannabis Cannabinoid Res. 2020, 6, 19–27. [Google Scholar] [CrossRef] [PubMed]
  3. Oomah, B.D.; Busson, M.; Godfrey, D.V.; Drover, J.C.G. Characteristics of hemp (Cannabis sativa L.) seed oil. Food Chem. 2002, 76, 33–43. [Google Scholar] [CrossRef]
  4. Johnson, L.; Malone, M.; Paulson, E.; Swider, J.; Marelius, D.; Andersen, S.; Black, D. Potency and safety analysis of hemp delta-9 products: The hemp vs. cannabis demarcation problem. J. Cannabis Res. 2023, 5, 29. [Google Scholar] [CrossRef]
  5. Jin, D.; Dai, K.; Xie, Z.; Chen, J. Secondary metabolites profiled in cannabis inflorescences, leaves, stem barks, and roots for medicinal purposes. Sci. Rep. 2020, 10, 3309. [Google Scholar] [CrossRef]
  6. Zheljazkov, V.D.; Noller, J.S.; Maggi, F.; Dale, R. Terpenes and cannabinoids yields and profile from direct-seeded and transplanted CBD-Cannabis sativa. J. Agric. Food Chem. 2022, 70, 10417–10428. [Google Scholar] [CrossRef]
  7. Benelli, G.; Pavela, R.; Petrelli, R.; Cappellacci, L.; Santini, G.; Fiorini, D.; Sut, S.; Dall’Acqua, S.; Canale, A.; Maggi, F. The essential oil from industrial hemp (Cannabis sativa L.) by-products as an effective tool for insect pest management in organic crops. Ind. Crops Prod. 2018, 122, 308–315. [Google Scholar] [CrossRef]
  8. Nissen, L.; Zatta, A.; Stefanini, I.; Grandi, S.; Sgorbati, B.; Biavati, B.; Monti, A. Characterization and antimicrobial activity of essential oils of industrial hemp varieties (Cannabis sativa L.). Fitoterapia 2010, 81, 413–419. [Google Scholar] [CrossRef] [PubMed]
  9. Ascrizzi, R.; Iannone, M.; Cinque, G.; Marianelli, A.; Pistelli, L.; Flamini, G. “Hemping” the drinks: Aromatizing alcoholic beverages with a blend of Cannabis sativa L. flowers. Food Chem. 2020, 325, 126909. [Google Scholar] [CrossRef]
  10. Pieracci, Y.; Ascrizzi, R.; Terreni, V.; Pistelli, L.; Flamini, G.; Bassolino, L.; Fulvio, F.; Montanari, M.; Paris, R. Essential oil of Cannabis sativa L: Comparison of yield and chemical composition of 11 hemp genotypes. Molecules 2021, 26, 4080. [Google Scholar] [CrossRef]
  11. Sharmeen, J.B.; Mahomoodally, F.M.; Zengin, G.; Maggi, F. Essential oils as natural sources of fragrance compounds for cosmetics and cosmeceuticals. Molecules 2021, 26, 666. [Google Scholar] [CrossRef]
  12. Fiorini, D.; Scortichini, S.; Bonacucina, G.; Greco, N.G.; Mazzara, E.; Petrelli, R.; Torresi, J.; Maggi, F.; Cespi, M. Cannabidiol-enriched hemp essential oil obtained by an optimized microwave-assisted extraction using a central composite design. Ind. Crops Prod. 2020, 154, 112688. [Google Scholar] [CrossRef]
  13. Mead, A. The legal status of cannabis (marijuana) and cannabidiol (CBD) under U.S. law. Epilepsy Behav. 2017, 70, 288–291. [Google Scholar] [CrossRef] [PubMed]
  14. Benelli, G.; Pavela, R.; Lupidi, G.; Nabissi, M.; Petrelli, R.; Ngahang Kamte, S.L.; Cappellacci, L.; Fiorini, D.; Sut, S.; Dall’Acqua, S.; et al. The crop-residue of fiber hemp cv. Futura 75: From a waste product to a source of botanical insecticides. Environ. Sci. Pollut. Res. 2018, 25, 10515–10525. [Google Scholar] [CrossRef] [PubMed]
  15. Bertoli, A.; Tozzi, S.; Pistelli, L.; Angelini, L.G. Fibre hemp inflorescences: From crop-residues to essential oil production. Ind. Crops Prod. 2010, 32, 329–337. [Google Scholar] [CrossRef]
  16. Sommano, S.R.; Chittasupho, C.; Ruksiriwanich, W.; Jantrawut, P. The cannabis terpenes. Molecules 2020, 25, 5792. [Google Scholar] [CrossRef]
  17. Booth, J.K.; Bohlmann, J. Terpenes in Cannabis sativa—From plant genome to humans. Plant Sci. 2019, 284, 67–72. [Google Scholar] [CrossRef]
  18. Chatow, L.; Nudel, A.; Nesher, I.; Hayo Hemo, D.; Rozenberg, P.; Voropaev, H.; Winkler, I.; Levy, R.; Kerem, Z.; Yaniv, Z. In vitro evaluation of the activity of terpenes and cannabidiol against human coronavirus E229. Life 2021, 11, 290. [Google Scholar] [CrossRef]
  19. Micalizzi, G.; Vento, F.; Alibrando, F.; Donnarumma, D.; Dugo, P.; Mondello, L. Cannabis sativa L.: A comprehensive review on the analytical methodologies for cannabinoids and terpenes characterization. J. Chromatogr. A 2021, 1637, 461864. [Google Scholar] [CrossRef]
  20. Capetti, F.; Rubiolo, P.; Mastellone, G.; Marengo, A.; Sgorbini, B.; Cagliero, C. A sustainable approach for the reliable and simultaneous determination of terpenoids and cannabinoids in hemp inflorescences by vacuum assisted headspace solid-phase microextraction. Adv. Sample Prep. 2022, 2, 100014. [Google Scholar] [CrossRef]
  21. Shapira, A.; Berman, P.; Futoran, K.; Guberman, O.; Meiri, D. Tandem Mass Spectrometric Quantification of 93 Terpenoids in Cannabis Using Static Headspace Injections. Anal. Chem. 2019, 91, 11425–11432. [Google Scholar] [CrossRef] [PubMed]
  22. Cajigas, J.C.; Gokool, V.A.; Holness, H.K.; Furton, K.G.; DeGreeff, L.E. Method development for an untargeted HS-SPME-GC–MS analysis of terpenes and cannabinoids for the geographical sourcing of Marijuana. Talanta Open 2024, 9, 100300. [Google Scholar] [CrossRef]
  23. Afshar Mogaddam, M.R.; Mohebbi, A.; Pazhohan, A.; Khodadadeian, F.; Farajzadeh, M.A. Headspace mode of liquid phase microextraction: A review. Trends Anal. Chem. 2019, 110, 8–14. [Google Scholar] [CrossRef]
  24. Deng, H.; He, R.; Huang, R.; Pang, C.; Ma, Y.; Xia, H.; Liang, D.; Liao, L.; Xiong, B.; Wang, X.; et al. Optimization of a static headspace GC-MS method and its application in metabolic fingerprinting of the leaf volatiles of 42 citrus cultivars. Front. Plant Sci. 2022, 13, 1050289. [Google Scholar] [CrossRef]
  25. Cox, A.O.; Daw, R.C.; Mason, M.D.; Grabenauer, M.; Pande, P.G.; Davis, K.H.; Wiley, J.L.; Stout, P.R.; Thomas, B.F.; Huffman, J.W. Use of SPME-HS-GC–MS for the analysis of herbal products containing synthetic cannabinoids. J. Anal. Toxicol. 2012, 36, 293–302. [Google Scholar] [CrossRef]
  26. Latimer, G.W., Jr. AK-1Guidelines for Dietary Supplements and Botanicals. In Official Methods of Analysis of AOAC International; Latimer, G.W., Jr., Ed.; Oxford University Press: Oxford, UK, 2023. [Google Scholar] [CrossRef]
  27. Schmid, R.; Heuckeroth, S.; Korf, A.; Smirnov, A.; Myers, O.; Dyrlund, T.S.; Bushuiev, R.; Murray, K.J.; Hoffmann, N.; Lu, M.; et al. Integrative analysis of multimodal mass spectrometry data in MZmine 3. Nat. Biotechnol. 2023, 41, 447–449. [Google Scholar] [CrossRef]
  28. Pang, Z.; Lu, Y.; Zhou, G.; Hui, F.; Xu, L.; Viau, C.; Spigelman, A.F.; MacDonald, P.E.; Wishart, D.S.; Li, S.; et al. MetaboAnalyst 6.0: Towards a unified platform for metabolomics data processing, analysis and interpretation. Nucleic Acids Res. 2024, 52, W398–W406. [Google Scholar] [CrossRef]
  29. Ilias, Y.; Rudaz, S.; Mathieu, P.; Christen, P.; Veuthey, J.L. Extraction and analysis of different Cannabis samples by headspace solid-phase microextraction combined with gas chromatography-mass spectrometry. J. Sep. Sci. 2005, 28, 2293–2300. [Google Scholar] [CrossRef]
  30. Czégény, Z.; Nagy, G.; Babinszki, B.; Bajtel, Á.; Sebestyén, Z.; Kiss, T.; Csupor-Löffler, B.; Tóth, B.; Csupor, D. CBD, a precursor of THC in e-cigarettes. Sci. Rep. 2021, 11, 8951. [Google Scholar] [CrossRef]
  31. Ibrahim, E.A.; Wang, M.; Radwan, M.M.; Wanas, A.S.; Majumdar, C.G.; Avula, B.; Wang, Y.H.; Khan, I.A.; Chandra, S.; Lata, H.; et al. Analysis of terpenes in Cannabis sativa L. using GC/MS: Method development, validation, and application. Planta Med. 2019, 85, 431–438. [Google Scholar] [CrossRef]
  32. Hatton, C.K. Beyond sports-doping headlines: The science of laboratory tests for performance-enhancing drugs. Pediatr. Clin. N. Am. 2007, 54, 713–733. [Google Scholar] [CrossRef] [PubMed]
  33. Radwan, M.M.; Chandra, S.; Gul, S.; ElSohly, M.A. Cannabinoids, Phenolics, Terpenes and Alkaloids of Cannabis. Molecules 2021, 26, 2774. [Google Scholar] [CrossRef] [PubMed]
  34. Hanuš, L.O.; Hod, Y. Terpenes/Terpenoids in Cannabis: Are They Important? Med. Cannabis Cannabinoids 2020, 3, 25–60. [Google Scholar] [CrossRef] [PubMed]
  35. Surendran, S.; Qassadi, F.; Surendran, G.; Lilley, D.; Heinrich, M. Myrcene—What Are the Potential Health Benefits of This Flavouring and Aroma Agent? Front. Nutr. 2021, 8, 699666. [Google Scholar] [CrossRef]
  36. Francomano, F.; Caruso, A.; Barbarossa, A.; Fazio, A.; La Torre, C.; Ceramella, J.; Mallamaci, R.; Saturnino, C.; Iacopetta, D.; Sinicropi, M.S. β-Caryophyllene: A Sesquiterpene with Countless Biological Properties. Appl. Sci. 2019, 9, 5420. [Google Scholar] [CrossRef]
  37. Allenspach, M.; Steuer, C. α-Pinene: A never-ending story. Phytochemistry 2021, 190, 112857. [Google Scholar] [CrossRef]
  38. Calzolari, D.; Magagnini, G.; Lucini, L.; Grassi, G.; Appendino, G.B.; Amaducci, S. High added-value compounds from Cannabis threshing residues. Ind. Crops Prod. 2017, 108, 558–563. [Google Scholar] [CrossRef]
  39. Zheljazkov, V.D.; Maggi, F. Valorization of CBD-hemp through distillation to provide essential oil and improved cannabinoids profile. Sci. Rep. 2021, 11, 19890. [Google Scholar] [CrossRef]
Figure 1. Optimization of the SHS-GC-MS method for representative terpenes and cannabinoids, illustrating the effect of extraction temperature (A) and extraction time (B). Panel A was performed at an extraction time of 5 min, and panel B was performed at an extraction temperature of 200 °C. Results are presented as mean ± SD (n = 3). Note: a–c: different superscripted letters in the same column indicate significant differences (p < 0.05), and ns indicates a non-significant difference, based on Tukey’s multiple comparison test.
Scipharm 93 00027 g001
Figure 2. +EI TIC (MS) chromatogram of the standard mixture of terpenes and cannabinoids at 100 µg/mL (A) and hemp essential oil at 50 mg/mL obtained from the HRDI2 strain (B), HRDI5 strain (C), Charlotte’s Angel (CA) strain (D), and Cherry Wine (CW) strain (E).
Scipharm 93 00027 g002
Figure 3. Principal component analysis (PCA) score plot (A), PCA loading plot (B), and PCA biplot of the top 30 discriminating compounds (C) derived from the GC dataset of four hemp essential oils (EOs) obtained from the inflorescences of HRDI2, HRDI5, Charlotte’s Angel (CA), and Cherry Wine (CW). All plots were generated using MetaboAnalyst 6.0.
Scipharm 93 00027 g003
Figure 4. Hierarchical clustering dendrogram and heatmap analysis of four EOs derived from the inflorescences of HRDI2, HRDI5, Charlotte’s Angel (CA), and Cherry Wine (CW) conducted using Ward’s method with the Euclidean distance. The heatmap visualizes the top 40 compounds with the highest variation among the samples, with color contrast representing their relative abundance. This analysis was performed using MetaboAnalyst 6.0.
Scipharm 93 00027 g004
Table 1. Identification and quantification parameters for terpenes and cannabinoids analyzed by SHS-GC-MS, including retention time windows, chemical formulas, exact masses, and selected ions used for quantification and qualification.
CompoundTime Window (min)FormulaExact MassesQuantification Ion (m/z)Qualifier Ions (m/z)
α-pinene3.0–5.8C10H16136.139343, 91, 93, 121
camphene3.0–5.8C10H16136.139343, 91, 93, 121
β-pinene5.8–6.3C10H16136.139369, 91, 92, 93
myrcene5.8–6.3C10H16136.136969, 91, 92, 93
delta-3-carene6.3–7.3C10H16136.139367, 91, 93, 121
α-terpinene6.3–7.3C10H16136.1312167, 91, 93, 121
(+)-limonene6.3–7.3C10H16136.136767, 91, 93, 121
cis-β-ocimene6.3–7.3C10H16136.139167, 91, 93, 121
γ-terpinene6.3–7.3C10H16136.139367, 91, 93, 121
terpinolene7.3–7.8C10H16136.1312171, 93, 121, 136
Linalool7.3–7.8C10H18O154.149371, 93, 121, 136
Fenchol7.8–8.1C10H18O154.149359, 93, 121
(−)-isopulegol8.1–8.4C10H18O154.1412143, 57, 71, 121
tridecane8.1–8.4C13H28184.225743, 57, 71, 121
(−)-terpinen-4-ol8.4–9.0C10H18O154.1411159, 93, 111, 121
α-terpineol8.4–9.0C10H18O154.149359, 93, 111, 121
β-caryophyllene9.5–10.2C15H24204.19133133, 161, 189
α-humulene10.2–10.5C15H24204.199380, 93, 121, 147
(−)-guaiol11.2–11.8C15H26O222.2016159, 79, 121, 161
(−)-caryophyllene oxide11.2–11.8C15H24O220.187959, 79, 121, 161
(−)-α-bisabolol11.8–12.4C15H26O222.206969, 105, 119
CBD15.0–23.0C21H30O2314.22231231, 299, 310, 314
Δ9-THC15.0–23.0C21H30O2314.22299231, 299, 310, 314
Table 2. Validation parameters for the SHS-GC-MS method, including retention times (RT), linearity (r2), limits of detection (LOD), limits of quantification (LOQ), %RSD of intra- and inter-day precision, and %recovery for terpenes and cannabinoids in hemp essential oils (EO).
CompoundLOD
(µg/mL)
LOQ
(µg/mL)
RT
(min)
r2Regression Equation%RSDAverage % Recovery
Intraday (n = 3)Interday (n = 9)Spiked (µg/mL)
Standard (µg/mL)Standard (µg/mL)
0.88200.88200.8820
α-pinene0.0250.15.200.998y = 0.0109x − 0.00032.01.65.28.413.65.996.588.788.8
camphene0.0250.15.600.9982y = 0.0071x − 0.00032.71.54.95.111.29.695.3103.896.6
β-pinene0.0250.16.000.9981y = 0.0105x − 0.0013.26.01.36.812.44.587.5105.9101.5
myrcene0.10.56.110.9977y = 0.005x − 0.00172.27.61.67.313.16.786.8106.787.3
delta-3-carene0.0250.16.300.9993y = 0.0099x − 0.002310.94.50.811.612.69.7104.8111.7111.4
α-terpinene0.10.56.510.9977y = 0.0027x − 0.00025.26.13.512.410.36.288.7101.698.4
(+)-limonene 0.10.56.600.9971y = 0.004x − 0.00043.45.30.913.76.45.197.890.4100.6
cis-β-ocimene0.10.56.840.997y = 0.009x − 0.00155.44.71.212.612.110.192.496.0101.0
γ-terpinene0.10.57.070.9968y = 0.0043x − 0.00057.25.62.410.95.43.5103.4111.895.1
terpinolene0.10.57.400.9964y = 0.0033x − 0.00043.05.00.38.04.73.387.890.097.6
linalool0.10.57.600.9988y = 0.0034x − 0.00154.25.05.59.510.24.385.1103.595.9
fenchol0.10.57.900.9963y = 0.001x − 0.00028.91.29.48.713.97.490.4106.2100.4
(−)-terpinen-4-ol0.10.58.500.9984y = 0.0041x − 0.00172.03.54.17.87.85.686.396.788.0
α-humulene0.0250.110.340.9985y = 0.0096x − 0.0012.54.65.38.88.85.5100.5102.093.4
(−)-guaiol0.10.511.450.9948y = 0.0048x − 0.00150.811.07.88.38.65.295.287.690.3
(−)-caryophyllene oxide0.10.511.560.995y = 0.0022x − 0.00042.36.81.16.58.37.7101.194.792.5
(−)-α-bisabolol0.10.511.930.9941y = 0.0029x − 0.00130.85.66.511.812.64.093.1115.596.9
820408204082040
(−)-isopulegol0.518.230.9972y = 0.0014x − 0.00137.86.42.57.78.73.198.394.2104.1
α-terpineol0.518.710.9946y = 0.0041x − 0.00153.85.23.64.33.73.886.999.196.0
β-caryophyllene0.5110.030.9985y = 0.0025x + 0.00223.65.90.69.87.04.7104.397.493.8
CBD1516.400.9939y = 0.003x − 0.01438.72.73.810.25.33.6106.294.787.7
Δ9-THC1517.260.9975y = 0.0006x − 0.00132.57.03.14.313.48.0100.089.2113.3
Table 3. Quantitative analysis of 20 terpenes and 2 cannabinoids in essential oils (EOs) from four hemp strains (HRDI2, HRDI5, CA, and CW), determined by SHS-GC-MS. Data are presented as mean ± standard deviation (%w/w, n = 3). ND = not detected; BQL = below the quantification limit.
CompoundAverage %w/w ± SD, n = 3
HRDI2HRDI5CACW
α-pinene2.35 ± 0.78 1.65 ± 0.040.99 ± 0.20 5.08 ± 0.98
camphene0.05 ± 0.000.12 ± 0.020.23 ± 0.000.24 ± 0.00
β-pinene0.92 ± 0.37 0.63 ± 0.010.53 ± 0.10 1.35 ± 0.31
myrcene15.35 ± 1.802.84 ± 0.047.00 ± 1.542.38 ± 0.54
delta-3-careneND0.10 ± 0.000.15 ± 0.020.03 ± 0.00
α-terpinene0.01 ± 0.000.08 ± 0.000.13 ± 0.020.14 ± 0.02
(+)-limonene0.15 ± 0.04 0.38 ± 0.012.71 ± 0.59 1.18 ± 0.28
cis-β-ocimene2.65 ± 0.960.10 ± 0.010.21 ± 0.040.14 ± 0.03
γ-terpineneND0.06 ± 0.010.05 ± 0.010.13 ± 0.02
terpinoleneND0.33 ± 0.010.71 ± 0.150.11 ± 0.02
linalool0.43 ± 0.100.16 ± 0.011.57 ± 0.300.42 ± 0.08
fencholNDND0.62 ± 0.100.24 ± 0.07
(−)-isopulegolNDNDNDND
(−)-terpinen-4-ol0.01 ± 0.000.03 ± 0.000.14 ± 0.010.11 ± 0.01
α-terpineolND0.07 ± 0.000.37 ± 0.060.50 ± 0.11
β-caryophyllene4.07 ± 1.191.03 ± 0.077.69 ± 1.5511.34 ± 2.78
α-humulene1.24 ± 0.560.32 ± 0.042.13 ± 0.453.43 ± 0.77
(−)-guaiolNDND0.55 ± 0.042.28 ± 0.53
(−)-caryophyllene oxide0.67 ± 0.230.11 ± 0.032.02 ± 0.501.12 ± 0.22
(−)-α-bisabolol0.38 ± 0.06 0.19 ± 0.000.71 ± 0.131.66 ± 0.39
CBDBQL0.01 ± 0.00ND0.75 ± 0.14
Δ9-THCNDNDNDND
Disclaimer/Publisher’s Note: The statements, opinions and data contained in all publications are solely those of the individual author(s) and contributor(s) and not of MDPI and/or the editor(s). MDPI and/or the editor(s) disclaim responsibility for any injury to people or property resulting from any ideas, methods, instructions or products referred to in the content.

