Article

In Vitro and In Silico Screening Analysis of Artabotrys sumatranus Leaf and Twig Extracts for α-Glucosidase Inhibition Activity and Its Relationship with Antioxidant Activity

1
Department of Pharmacy, Faculty of Pharmacy, Indonesia University, Depok 16424, Indonesia
2
Department of Pharmacy, Faculty of Health Sciences, Pelita Harapan University, Tangerang 15811, Indonesia
3
Chemistry Research Centre, National Research and Innovation Agency (BRIN), PUSPITEK, Serpong 15314, Indonesia
4
Department of Pharmaceutical Chemistry, Kulliyah of Pharmacy, International Islamic University Malaysia, Kuantan 25200, Malaysia
5
Research Center for Plant Conservation, Botanic Gardens, and Forestry, National Research and Innovation Agency (BRIN), Cianjur 43253, Indonesia
*
Author to whom correspondence should be addressed.
Sci. Pharm. 2023, 91(1), 2; https://doi.org/10.3390/scipharm91010002
Submission received: 6 November 2022 / Revised: 11 December 2022 / Accepted: 15 December 2022 / Published: 22 December 2022

Abstract

:
Artabotrys sumatranus is one of the Artabotrys species, which lives in Sumatera, Java, and Borneo in Indonesia. No research has been found related to its activity. The objective of this study was to explore the potential of A. sumatranus leaf and twig extracts as the source of an anti-diabetic agent through the α-glucosidase inhibition mechanism, as well as the relationship between the antioxidant and the α-glucosidase inhibition activities in these extracts. Ethanol extracts from leaf and twig A. sumatranus were subjected to several assays: total phenolic content, total flavonoid content, antioxidant activity using DPPH (2,2-diphenyl-1-picrylhydrazyl), radical scavenging activity, and FRAP (ferric reducing antioxidant power) analysis, as well as α-glucosidase inhibition. Later, GC-MS (gas chromatography-mass spectrometer) and LC-MS/MS (liquid chromatography-mass spectrometer/mass spectrometer) analysis were conducted to identify the compounds inside the extracts. The identified compounds were tested for potential α-glucosidase inhibition activity using a molecular docking simulation. As a result, the A. sumatranus leaf extract showed more potential than the twig extract as α-glucosidase inhibitor and antioxidant agent. In addition, from the comparison between the measured quantities, it can be deduced that most of the α-glucosidase active compounds in the A. sumatranus are also antioxidant agents. Several active compounds with a high affinity to α-glucosidase inhibition were identified using the molecular docking simulation. It was concluded that A. sumatranus twig and leaf extracts seem to be potential sources of α-glucosidase inhibitors.

1. Introduction

Diabetes is a global health disorder which is marked by hyperglycemia and glucose intolerance, caused by a defective insulin function, defective insulin secretion, or both [1]. In the long term, diabetes can cause cardiovascular disease, kidney malfunction, and neuropathy [2]. One of the effective ways to cure diabetes type 2 is to inhibit α-glucosidase, an enzyme that catalyzes starch hydrolysis to simple sugars, so that the level of glucose in the blood can be maintained [3].
Not only to cure diabetes, inhibitors of α-glycosidase also have an effect on polysaccharide metabolism, glycoprotein processing, and cellular interaction, thus broadening the potential of α-glucosidase inhibitors as a treatment candidate for anti-viral diseases [4] and cancer [5]. Several α-glucosidase inhibitor synthetic drugs, such as acarbose, miglitol, and voglibose, have side effects in the gastrointestinal (GI) tract such as abdominal discomfort, flatulence, and diarrhea. These side effects are caused by the carbohydrates which are not absorbed, and thus remain in the gut. Later on, the bacteria will digest the carbohydrates in the colon, which then produces gas [6,7]. Nevertheless, an α-glucosidase inhibitor can be used in a patient who is not tolerating other anti-diabetic agents because it is absorbed poorly, and its action is topical in the gut [8]. An α-glucosidase inhibitor is the first-line drug to treat a newly diagnosed type 2 diabetes patient [9].
Antioxidant activity can also help in the treatment of diabetes by inhibiting the deterioration of pancreatic β-cells caused by oxidative stress [10,11]. Defective insulin secretion from pancreatic β-cells can induce the most prevalent type of diabetes: diabetes mellitus type 2 [12]. It is therefore interesting to see whether there is a correlation between antioxidant activity and the α-glucosidase inhibitor.
Many research studies have explored antioxidant and α-glucosidase inhibitors from natural compounds [3,13,14]. The antioxidant compounds are mainly the phenolic and flavonoids groups [15], while α-glucosidase comes from different classes of secondary metabolites. For example, mangiferin and rutin belong to the flavonoid group [16,17], whereas 3-oxolupenal, which is isolated from Nuxia oppositifolia, is a lupane-type triterpenes [18]. Vasicine and vasicinol are examples of alkaloid compounds, which can inhibit alpha glucosidase [19], while procyanidin A2 is one of the α-glucosidase inhibitors from the tannin group [20]. Kotalanol, one of the strongest α-glucosidase inhibitors from plants, with an IC50 0,58 µg/mL [21,22], is a thiosugar sulfonium. The largest secondary metabolite class which contains α-glucosidase inhibitor compounds is the terpenes (the class of around 33% natural α-glucosidase inhibitors) [3].
Artabotrys is one of the biggest genera belonging to Annonaceae. It has more than 100 species in tropical Asia and Africa [23,24]. The plants of the Artabotrys genus are climbers, with characteristic inflorescence hooks [24]. Some Artabotrys plants are used as ethnomedicinals in several places; for example, the roots and stems of Artabotrys suaveolens are used as emmenagogues in the Philippines [25]. Despite the large number of varieties and the many ethnobotanical pharmaceutical uses, there has been only one study to explore the possibilities of using this genus as an anti-diabetic agent. This was done by Mohan et al. [26] on the methanol leaf extract of A. suaveolens. Most of the research on this genus was conducted to find its potential as anticancer [5,27,28,29] and anti-bacterial agents [25,30,31].
A. sumatranus is one of the Artabotrys species which lives in Sumatera, Java, and Borneo in Indonesia [24]. Until now, there has been no information regarding the phytochemical and biological activities in A. sumatranus. Therefore, the goal of this research was to explore the potential of this plant, especially the leaf and twig, as an α-glucosidase inhibitor, and its relationship with antioxidant activity.

2. Materials and Methods

2.1. Materials

Leaves and twigs of A. sumatranus (collection number C2009090117) were harvested from the collection of the Cibodas Botanical Garden in Cianjur (West Java, Indonesia). The collection was originally taken from the National Park Mount Leuser (latitude 03°50′02.9″ N and longitude 97°31′17.2″ E) in Aceh, Indonesia and was collected by Iyung and Wiguna Rahman.
The reagents used were ethanol (Smart Lab, Tangerang, Indonesia), Folin–Ciocâlteu (Merck, Darmstadt, Germany), sodium carbonate (Merck, Darmstadt, Germany), aluminum chloride (Smart Lab, Tangerang, Indonesia), gallic acid (Merck, Darmstadt, Germany), quercetin (Merck, Darmstadt, Germany), sodium acetate (Loba Chemie, Mumbai, India), 1,1-diphenyl-2-picrylhydrazyl (Smart Lab, Tangerang, Indonesia), ferric chloride hexahydrate (FeCl3.6H2O) (Merck, Darmstadt, Germany), 2,4,6-Tris(2-pyridyl)-s-triazine or TPTZ (Sigma, St. Louis, MI, USA), hydrochloride acid (HCl) (Smart Lab, Tangerang, Indonesia), ferrous sulphate heptahydrate (FeSO4.7H2O) (Merck, Darmstadt, Germany), acetic acid (Merck, Darmstadt, Germany), ascorbic acid (Merck, Darmstadt, Germany), α-glucosidase from Saccharomyces cerevisiae (Sigma, EC 232-604-7, St. Louis, MI, USA), p-nitrophenyl α-d-glucopyranoside (Sigma, St. Louis, MI, USA), disodium hydrogen phosphate (Na2HPO4) (Merck, Darmstadt, Germany), sodium dihydrogen phosphate monohydrate (NaH2PO4) (Merck, Darmstadt, Germany), dimethyl sulfoxide (DMSO) (Merck, Darmstadt, Germany), sodium carbonate (Na2CO3) (Merck, Darmstadt, Germany), and distilled water.
The equipment used was: a freeze dryer (Alpha 1-2 LDplus Martin Christ, Osterode am Harz, Germany), rotary evaporator (Heidolph Hei-Vap Core, Schwabach, Germany), vortex (Reax Top Heidolph, Schwabach, Germany), incubator (Memmert IN55, Schwabach, Germany), UV spectrophotometer for α-Glucosidase Inhibition Assay (Thermo Fischer Scientific Varioskan Flash, Madison, WI, USA), UV spectrophotometer for other assays (Thermo Scientific Orion Aquamate 8000, Madison, WI, USA), gas chromatography—mass spectrometer (Agilent 7890B GC and 5777A MSD, St Clara, CA, USA) equipped with a capillary column (30 m × 250 µm × 0.25 µm, Agilent, type 19091S-433, St Clara, CA, USA), LC-MS-MS (Waters Acquity UPLC I-Class and XEVO G2-XS QTof, USA), and computer (Lenovo Legion 7, China) with the specifications AMD Reizen 7 5800H, RAM 32 GB, and graphic card NVIDIA GeForce RTX 3060, St. Clara, CA, USA.
The software used were Autodock version 4.2.6 and AutoDock tools version 1.5.7.

2.2. Extraction of Artabotrys sumatranus

The leaves and twigs were separated; each of them was dried by using a freeze dryer (Alpha 1-2 LDplus, Martin Christ), powdered, and macerated in ethanol solvent (1:5), for 2 × 24 h at room temperature. The process was repeated twice. After maceration, the ethanol extract was then filtered, and the ethanol was evaporated using a rotary evaporator (Heidolph Hei-Vap Core) at 45 °C. The extracts obtained were then frozen and kept at −20 °C until further analysis.

2.3. α-Glucosidase Inhibition Assay

This assay was performed according to Dewi et al., (2014) [32]. The 0.1 M phosphate buffer was made by mixing 3.59 g Na2HPO4, which was diluted in 100 mL distilled water, with 1.39 g NaH2PO4, which was also diluted in 100 mL distilled water. NaH2PO4 was added until pH 7.0 was obtained. After that, distilled water was added until the total volume was 200 mL. Later, 250 µL of 5 mM P-nitrophenil-α-D-glucopyranoside (PNPG) solution was mixed with 495 µL of 0.1M phosphate buffer (pH 7.0), and then was added to a reaction tube, which was filled with a 5 µL sample in DMSO with different concentrations. The solution was mixed homogenously and was incubated for 5 min at 37 °C. After that, 250 µL α-glucosidase (0.062 unit) was added and the solution was incubated for 15 min at 37 °C. To stop the reaction, 1mL of 0.2 M Na2CO3 was added. The absorbance was measured using a UV spectrophotometer (Thermo Fischer Scientific Varioskan Flash) at λ = 400 nm. PNPG and phosphate buffer were used as controls and quercetin as the positive control. The blank was DMSO. The absorbance reading of the blank was set to be zero. The percentage of α-glucosidase inhibition activity was calculated using:
%   I n h i b i t i o n = A b s   c o n t r o l A b s   s a m p l e A b s   c o n t r o l × 100 %
This assay was conducted with several concentrations in triplicate to get the IC50 value.

2.4. 2,2-Diphenyl-1-Picrylhydrazyl (DPPH) Radical Scavenging Activity Assay

This method was conducted based on González-Palma et al., (2016) [33], with some modifications. The samples were dissolved in ethanol and then mixed homogenously using the vortex. Then, 1 mL of DPPH 0.175 mM was added to 0.8 mL of the sample in the tube, and the mixture was vortexed until homogenous. The resulting sample mixture was incubated at room temperature in the dark for 30 min, and the absorbance was measured using the UV spectrophotometer (Thermo Scientific Orion Aquamate 8000) at λ = 517 nm. DPPH and ethanol were used as controls and ascorbic acid as the positive control. The blank used was ethanol. The absorbance reading of the blank was set to be zero. The antioxidant activity was expressed in the percentage of DPPH reduction by the calculation:
%   r e d u c t i o n   D P P H = A b s   c o n t r o l A b s   s a m p l e A b s   c o n t r o l × 100 %
This assay was conducted for several concentrations in triplicate to get the IC50 value.

2.5. Ferric Reducing Antioxidant Power (FRAP) Assay

The assay was performed based on Tomasina et al., (2012) [34] and Wiliantari et al., (2022) [35], with some modifications. For this assay, several types of Ferric Reducing Antioxidant Power (FRAP) solutions were needed: FRAP-1 to be used to make the standard calibration curve and FRAP-2 to be used with the extract samples and blank control.
The steps to make the FRAP-1 solution were as follows. First, the 10 mM TPTZ solution was prepared by dissolving 0.31 g TPTZ in 100 mL 40 mM HCl. Second, the acetate buffer, 300 mM (pH 3.6), was prepared by dissolving 0.16 g of sodium acetate in 100 mL of 0.28 M acetic acid. The pH level could be adjusted to reach 3.6 by adding 1 M HCl or NaOH. Third, 20 mM FeCl3 solution was prepared by dissolving 0.135 g FeCl3 in 25 mL distilled water. The FRAP-1 solution was made by mixing TPTZ (2,4,6-tri(2-pyridyl)-1,3,5-triazine) solution, distilled water, and acetate buffer (pH 3.6) with ratio 1:1:10.
To make the standard calibration curve, 1.68 mL of the FRAP-1 solution was added to 0.07 mL FeSO4.7H2O with different concentrations in distilled water. The mixture was vortexed until homogenous and incubated at 37 °C in the dark for 30 min. The absorbance of this mixture was then measured using the UV spectrophotometer (Thermo Scientific Orion Aquamate 8000) at λ = 593 nm. For the standard calibration curve, to nullify the effect of the FRAP-1 color, a blank (blank-1) was used, which was a mixture of 1.68 mL FRAP-1 and 0.07 mL distilled water (since the FeSO4.7H2O was dissolved in distilled water), and its absorbance was measured in the same way as for the FRAP-1 and FeSO4 mixture. The difference between the absorbance of the mixture of FRAP-1 and FeSO4.7H2O, and the absorbance of blank-1 were plotted against the concentration of FeSO4.7H2O to make the standard calibration curve.
For the FRAP-2 solution, the TPTZ and buffer solutions were prepared as for the FRAP-1 solution. The difference is in the composition. The FRAP-2 solution was a mixture between TPTZ (2,4,6-tri(2-pyridyl)-1,3,5-triazine) solution, FeCl3 solution, and acetate buffer (pH 3.6) with a ratio of 1:1:10.
To measure the samples (extract solution in ethanol with different concentrations), 1.68 mL of the FRAP-2 solution was added to a 0.07 mL sample, then the mixture was vortexed until homogenous and incubated at 37 °C in the dark for 30 min. The absorbance of this mixture was then measured using the UV spectrophotometer (Thermo Scientific Orion Aquamate 8000) at λ = 593 nm. The blank used for this sample measurement (blank-2), to nullify the effect of FRAP-2 color, was made by adding FRAP-2 solution to 0.07 mL ethanol (since the extract was dissolved in ethanol). The absorbance of blank-2 was measured in the same way as the mixture of FRAP-2 and sample. The difference between the absorbance of the mixture of the FRAP-2 and the sample and the absorbance of the blank-2 was recorded for different concentrations of extract.
The antioxidant activity was expressed as mM equivalents of Fe2+, or ferric ion equivalent antioxidant activity (FeEAc). The equivalency was obtained by using the standard calibration curve and comparing the concentration of FeSO4.7H2O with the concentration of extract for the same absorbance difference to the blanks. Ascorbic acid was used as the positive control, which was treated in the same way as the sample (replacing the sample with ascorbic acid). The result of the FRAP method can be reported in Fe2+ mol/g extract (similar to the units used in [36,37]), which can be computed using the following formula:
Fe 2 + mol g = v s 1000 × y i c x i × 1 1000
Here y i is the concentration of Fe2+ equivalent in mM; x i is the mass of the extracts in g (computed from the extract concentration in ppm); v s is the tested sample volume in mL; and c is the intercept value of the regression line between the concentration of the Fe2+ equivalent in mM and the mass of the extracts in ppm.
For this assay, all the experiments were conducted in triplicate.

2.6. Total Phenolic Content

The total phenolic content was determined using the Folin–Ciocalteu method [38], with some modification. A 0.2 mL of sample was added to 1 mL of 10% Folin–Ciocalteu solution, vortexed until homogenous, and then incubated for 6 min at 25 °C. Later, the process was continued by adding 0.8 mL of saturated Na2CO3 to the test tube. The solution was mixed homogenously using the vortex and incubated in the dark for 30 min at room temperature. The absorbance was measured at λ = 765 nm using the UV spectrophotometer (Thermo Scientific Orion Aquamate 8000). The total phenolic content was shown as milligrams of the gallic acid equivalent per gram of extract. The standard curve, which shows the relationship between the absorbance and concentration of the gallic acid, was made by replacing the sample with gallic acid. By using the regression line on the standard curve, and comparing the concentrations of gallic acid and extract for the same absorbance, the equivalent gallic acid concentration for a given extract concentration was obtained. The total phenolic content is shown as milligrams of the gallic acid equivalent per gram of extract (similar to the units used in [39,40]). This value was obtained by using the following formula:
mg   GAE g = 1 n i = 1 n y i c   x i × 1000
where y i is the equivalent concentration of gallic acid in ppm for the sample i ; x i is the concentration of the extract sample i ; n is the number of samples; and c is the intercept value of the regression line between the equivalent concentration of gallic acid in ppm and the extract concentration in ppm. The value of milligrams of gallic acid equivalent per gram of extract is an estimate of the gradient of the regression line. All the experiments were conducted in triplicate.

2.7. Total Flavonoid Content

This assay was performed based on Chang et al., (2002) [41], with modification. A 0.5 mL sample was added to 1.5 mL of ethanol, 0.1 mL of 10% aluminum chloride, 0.1 mL of 1M sodium acetate, and 2.8 mL of distilled water. The mixed solution was vortexed and incubated at room temperature for 30 min and the absorbance was measured at maximum wavelength (434 nm) with the UV Spectrophotometer (Thermo Scientific Orion Aquamate 8000). The standard curve was made by replacing the sample with quercertin. The blank was created by replacing the sample with ethanol. All the experiments were conducted in triplicate.
The total flavonoid content result was expressed as milligrams of quercetin equivalent per gram of extract (similar to the units used in [39,42]). This value was obtained by using a similar formula to the total phenolic content, but now y i is the concentration of quercetin equivalent (QE) in ppm, and c is the intercept value of the regression line between the quercetin acid equivalent in ppm and the extract concentration in ppm. Analogous to the total phenolic content, the value of milligrams of quercetin equivalent per gram of extract is an estimate of the gradient of the regression line.

2.8. Gas Chromatography—Mass Spectrometry (GC-MS) Analysis

The leaf and twig extracts of A. sumatranus were analyzed on the gas chromatography—mass spectrometer (Agilent 7890B GC and 5777A MSD), equipped with a capillary column (30 m × 250 µm × 0.25 µm, Agilent, type 19091S-433), set in the EI mode, at 70 eV. The temperature range of the oven was 40–300 °C. Helium was used as the carrier gas, and the volume of the injection was 1µL. The identification of the compounds was made by comparing the spectra to the NIST 2017 library. The derivatization of the sample was made using BSTFA (N,O-Bis(trimethylsilyl)trifluoroacetamide).

2.9. Liquid Chromatography—Mass Spectrometry (LC-MS-MS) Analysis

Each ethanol extract of the leaf and twig of A. sumatranus was analyzed using liquid chromatography mass spectrometer/mass spectrometer or LC-MS-MS (Waters Acquity UPLC I-Class and XEVO G2-XS QTof). One microliter of the sample was injected into the LC-MS-MS column using the gradient solvent (0.1% formic acid in water and 0.1% formic acid in acetonitrile). The column used C18 2.1 × 50 mm with a 1.7 μm particle size. The machine was set to scan from m/z 100 to m/z 1200 in the electron spray ionization (ESI) mode. The data obtained were processed by using the UNIFI software (Waters Corporation, Milford, MA, USA).

2.10. Docking Study

The α-glucosidase structure was taken from the PBD (https://www.rcsb.org/, accessed on 1 May 2022) using a 3A4A model. The missing atoms from the 3A4A model were recreated using Swiss Model (https://swissmodel.expasy.org, accessed on 1 May 2022). This 3A4A structure was used as the receptor. The ligand structures were obtained from the ZINC (https://zinc.docking.org, accessed on 1 May 2022) and PubChem (https://pubchem.ncbi.nlm.nih.gov/, accessed on 1 May 2022) databases. The receptor and ligand were prepared using AutoDock tools version 1.5.7, and the docking simulation was conducted using AutoDock version 4.2.6. [43], run on a computer with the following specifications: AMD Reizen 7 5800H, RAM 32 GB, and graphic card NVIDIA GeForce RTX 3060. In the simulation, the receptor was treated as a rigid object. The algorithm used in the simulation was the Lamarckian Genetic Algorithm (GA) with the following parameters: the number of GA runs was 100; the population size was 300; and the maximum number of evaluations was 2,500,000 for the ligands having a number of torsions fewer than 10, and 25,000,000 for those having a number of torsions greater than 10; this minimized the default scoring function of AutoDock 4.2.6. This default scoring function was an empirical approximation of the binding energy. The docking simulation was done on a rectangular grid of 126 × 126 × 126 with a grid size of 0.55 Å. The center of the rectangular grid was placed at the coordinate (21.301, −3.222, 18.662). In this way, the docking grid covered the whole receptor structure. These settings were verified by conducting a docking simulation with the native ligand of the 3A4A structure, which was GLC (obtained from PDB database). The docking result with the native ligand showed that the docking simulation could produce a docking result with RMSD 0.66 Å compared to the crystallography results.

3. Results and Discussion

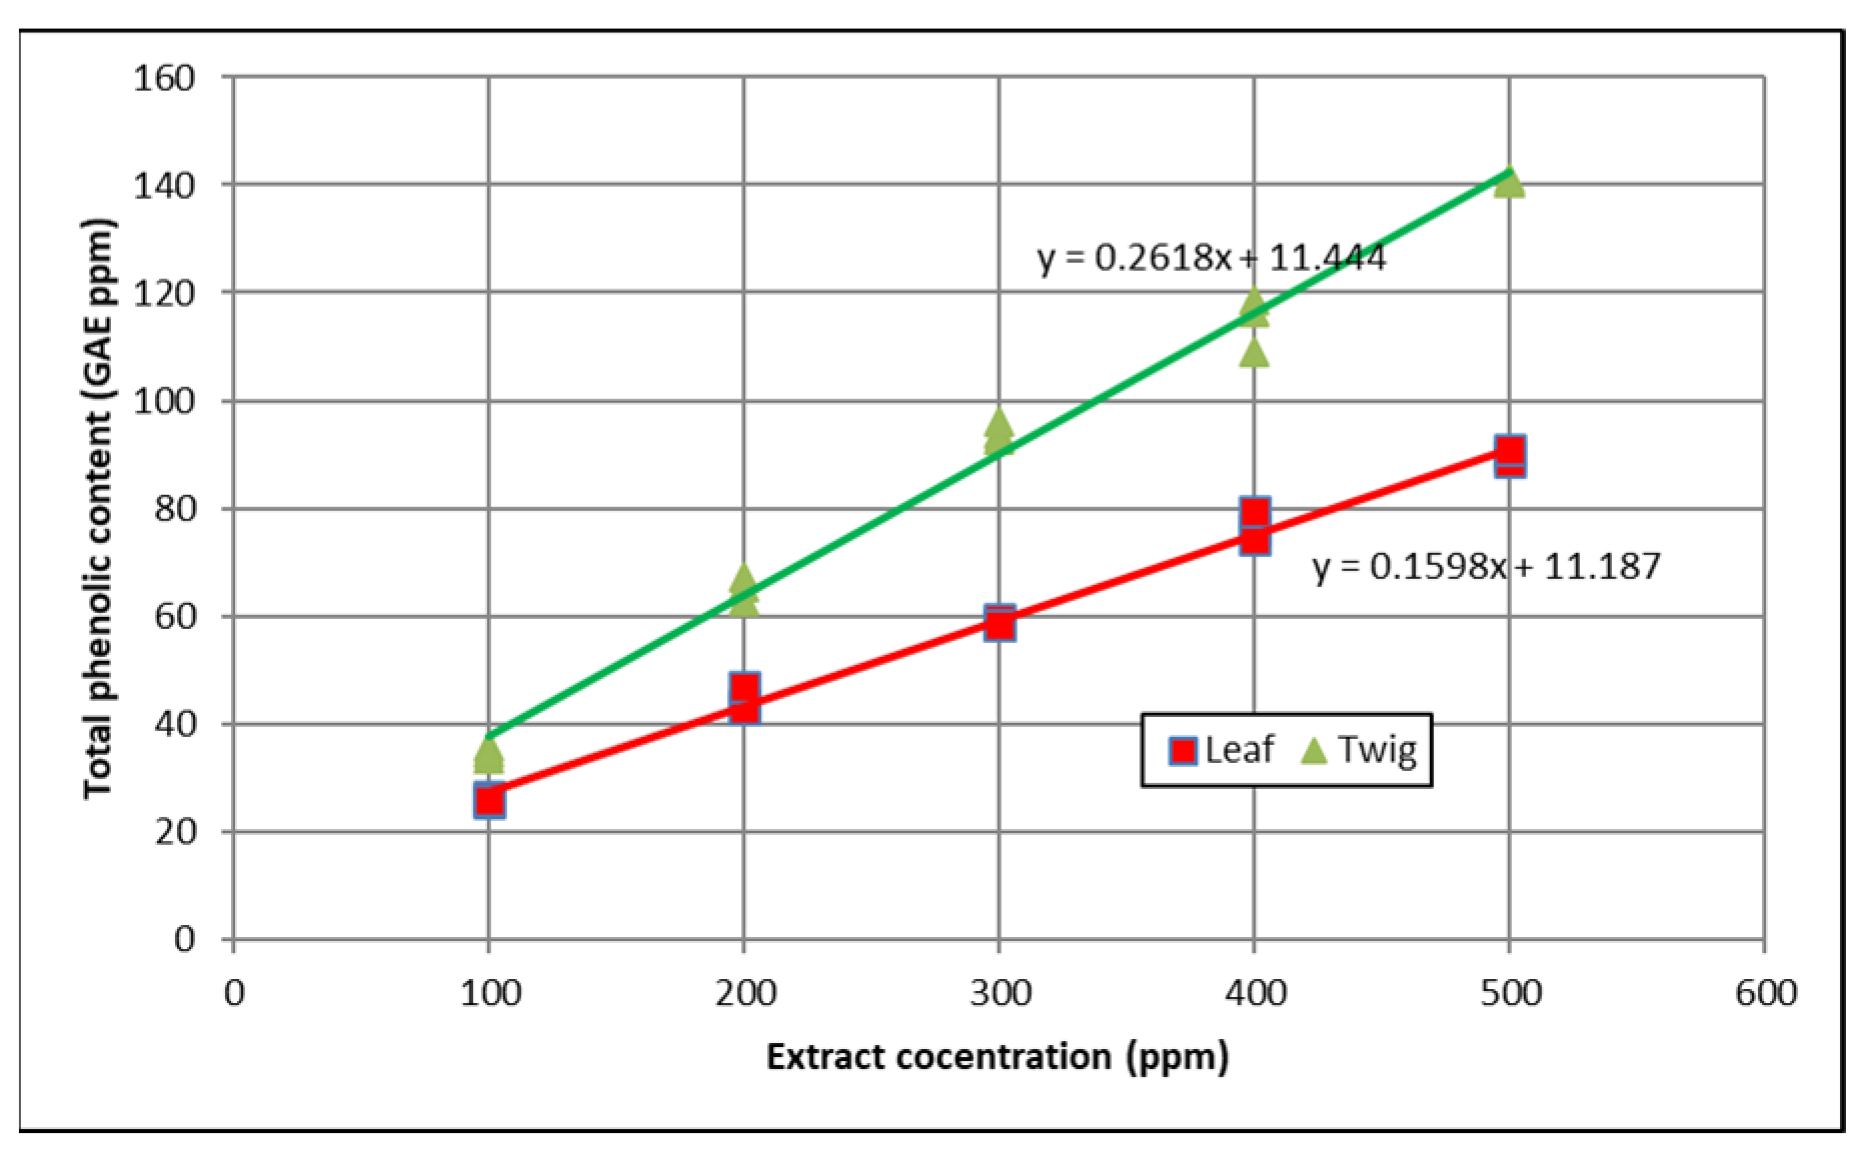
3.1. Total Phenolic Content

The total phenolic content of the A. sumatranus leaf and twig ethanol extracts were 158.738 ± 8.615 mg GAE/g extract and 258.996 ± 17.462 mg GAE/g extract, respectively. It can also be confirmed in Figure 1 that the total phenolic content of the twig extract was higher than that of the leaf extract.
In the calculation of mg, the GAE/g must first be subtracted by the intercept value of the regression lines in Figure 1 to correct the bias (see Section 2.6). The bias appeared because the calibration regression line of the gallic acid concentration (R2 = 0.991, see Figure S1) had a non-zero intercept.

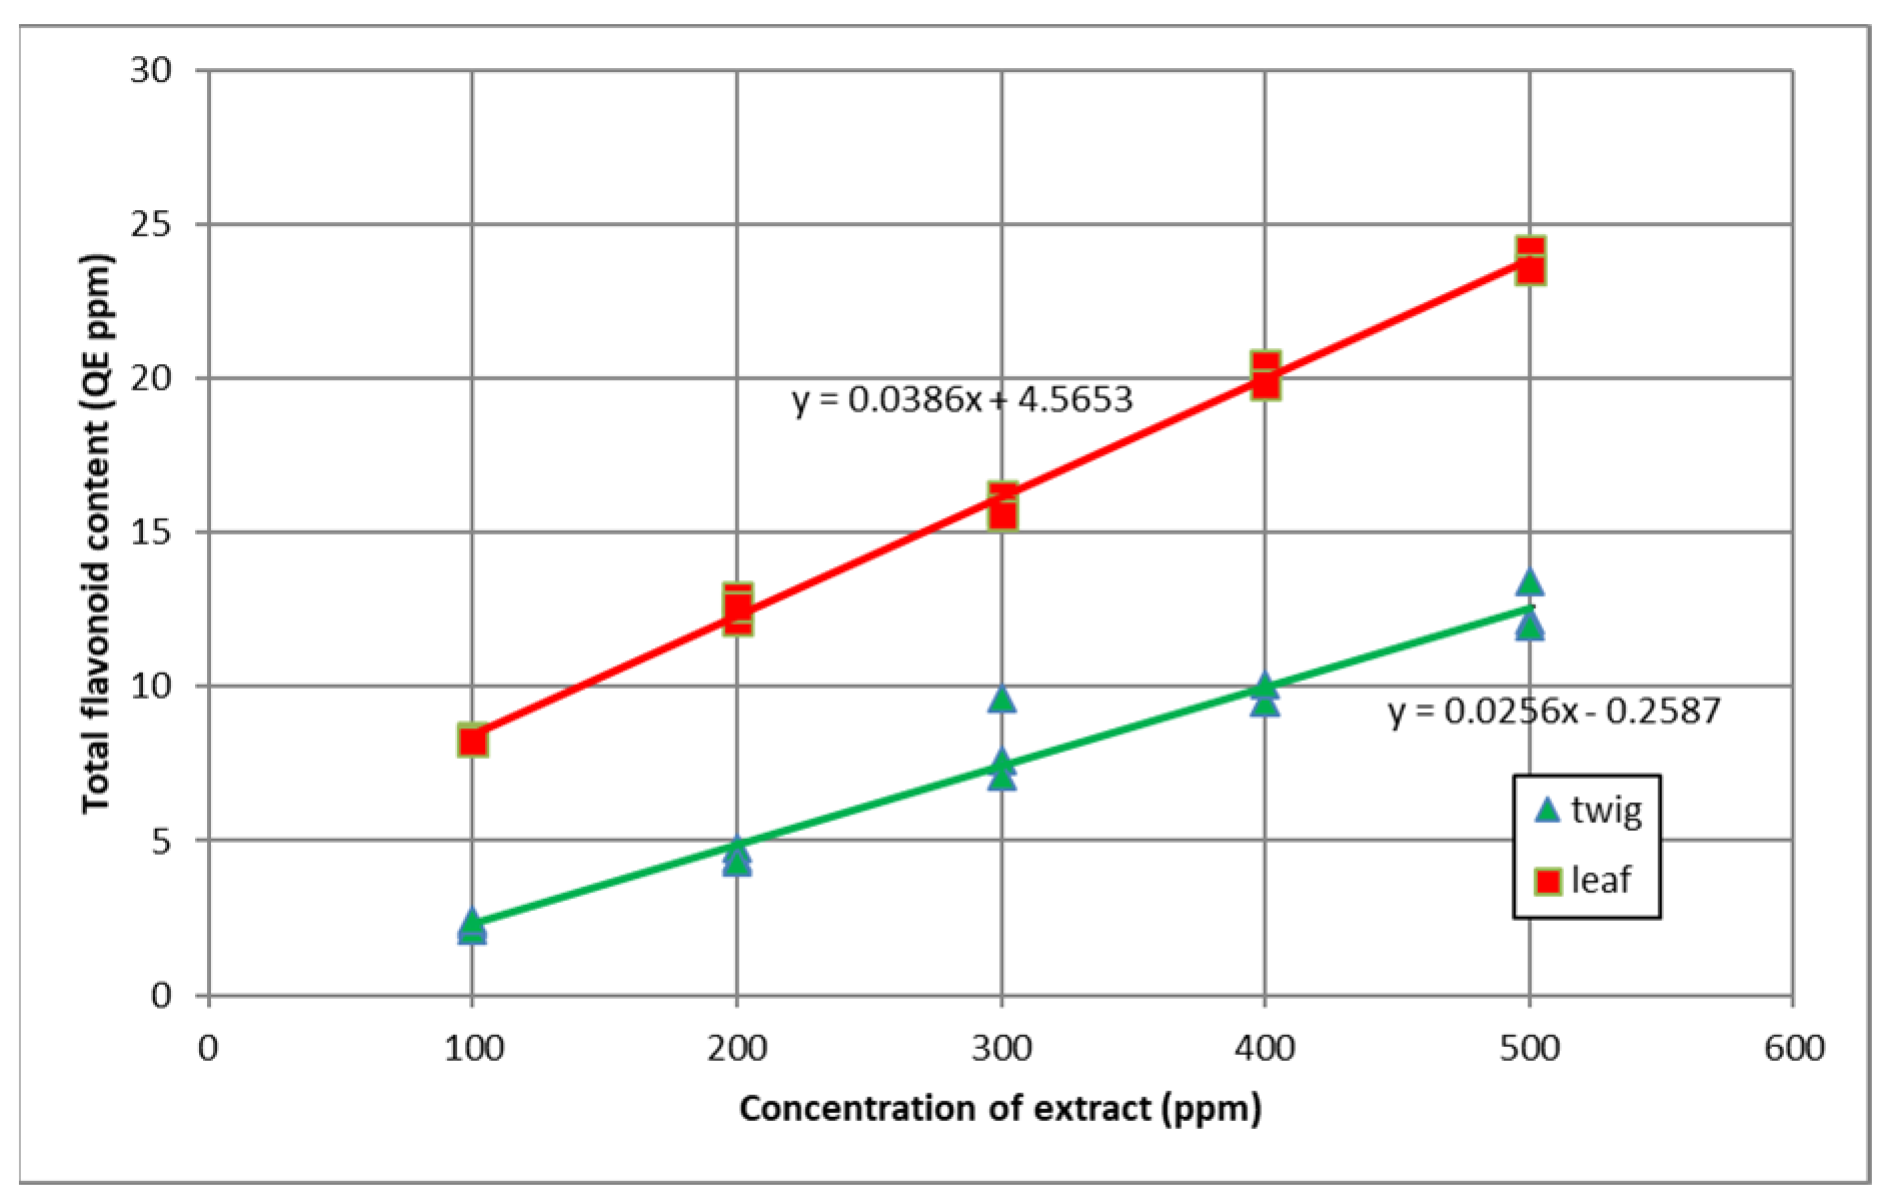
3.2. Total Flavonoid Content

The total flavonoid content of the A. sumatranus leaf and twig ethanol extracts were 38.521 ± 1.440 mg QE/g extract and 25.553 ± 2.394 mg QE/g extract, respectively. The graphs in Figure 2 confirm that the total flavonoid content of the twig extract was lower than that of the leaf extract. Considering the results of the total phenolic content in Section 3.1, it can be concluded that a large proportion of the phenolic compound in the twig extract was not flavonoid.
As in the total phenolic content, the calculation of the total flavonoid content must also be corrected for bias by subtracting the intercept values of the regression lines in Figure 2 from the respective values of the quercetin acid equivalent concentration of the twig and leaf extracts (see Section 2.7). The reason is similarly based on the non-zero intercept value of the calibration regression line of the quercetin equivalent concentration (R2 = 0.998, see Figure S2)

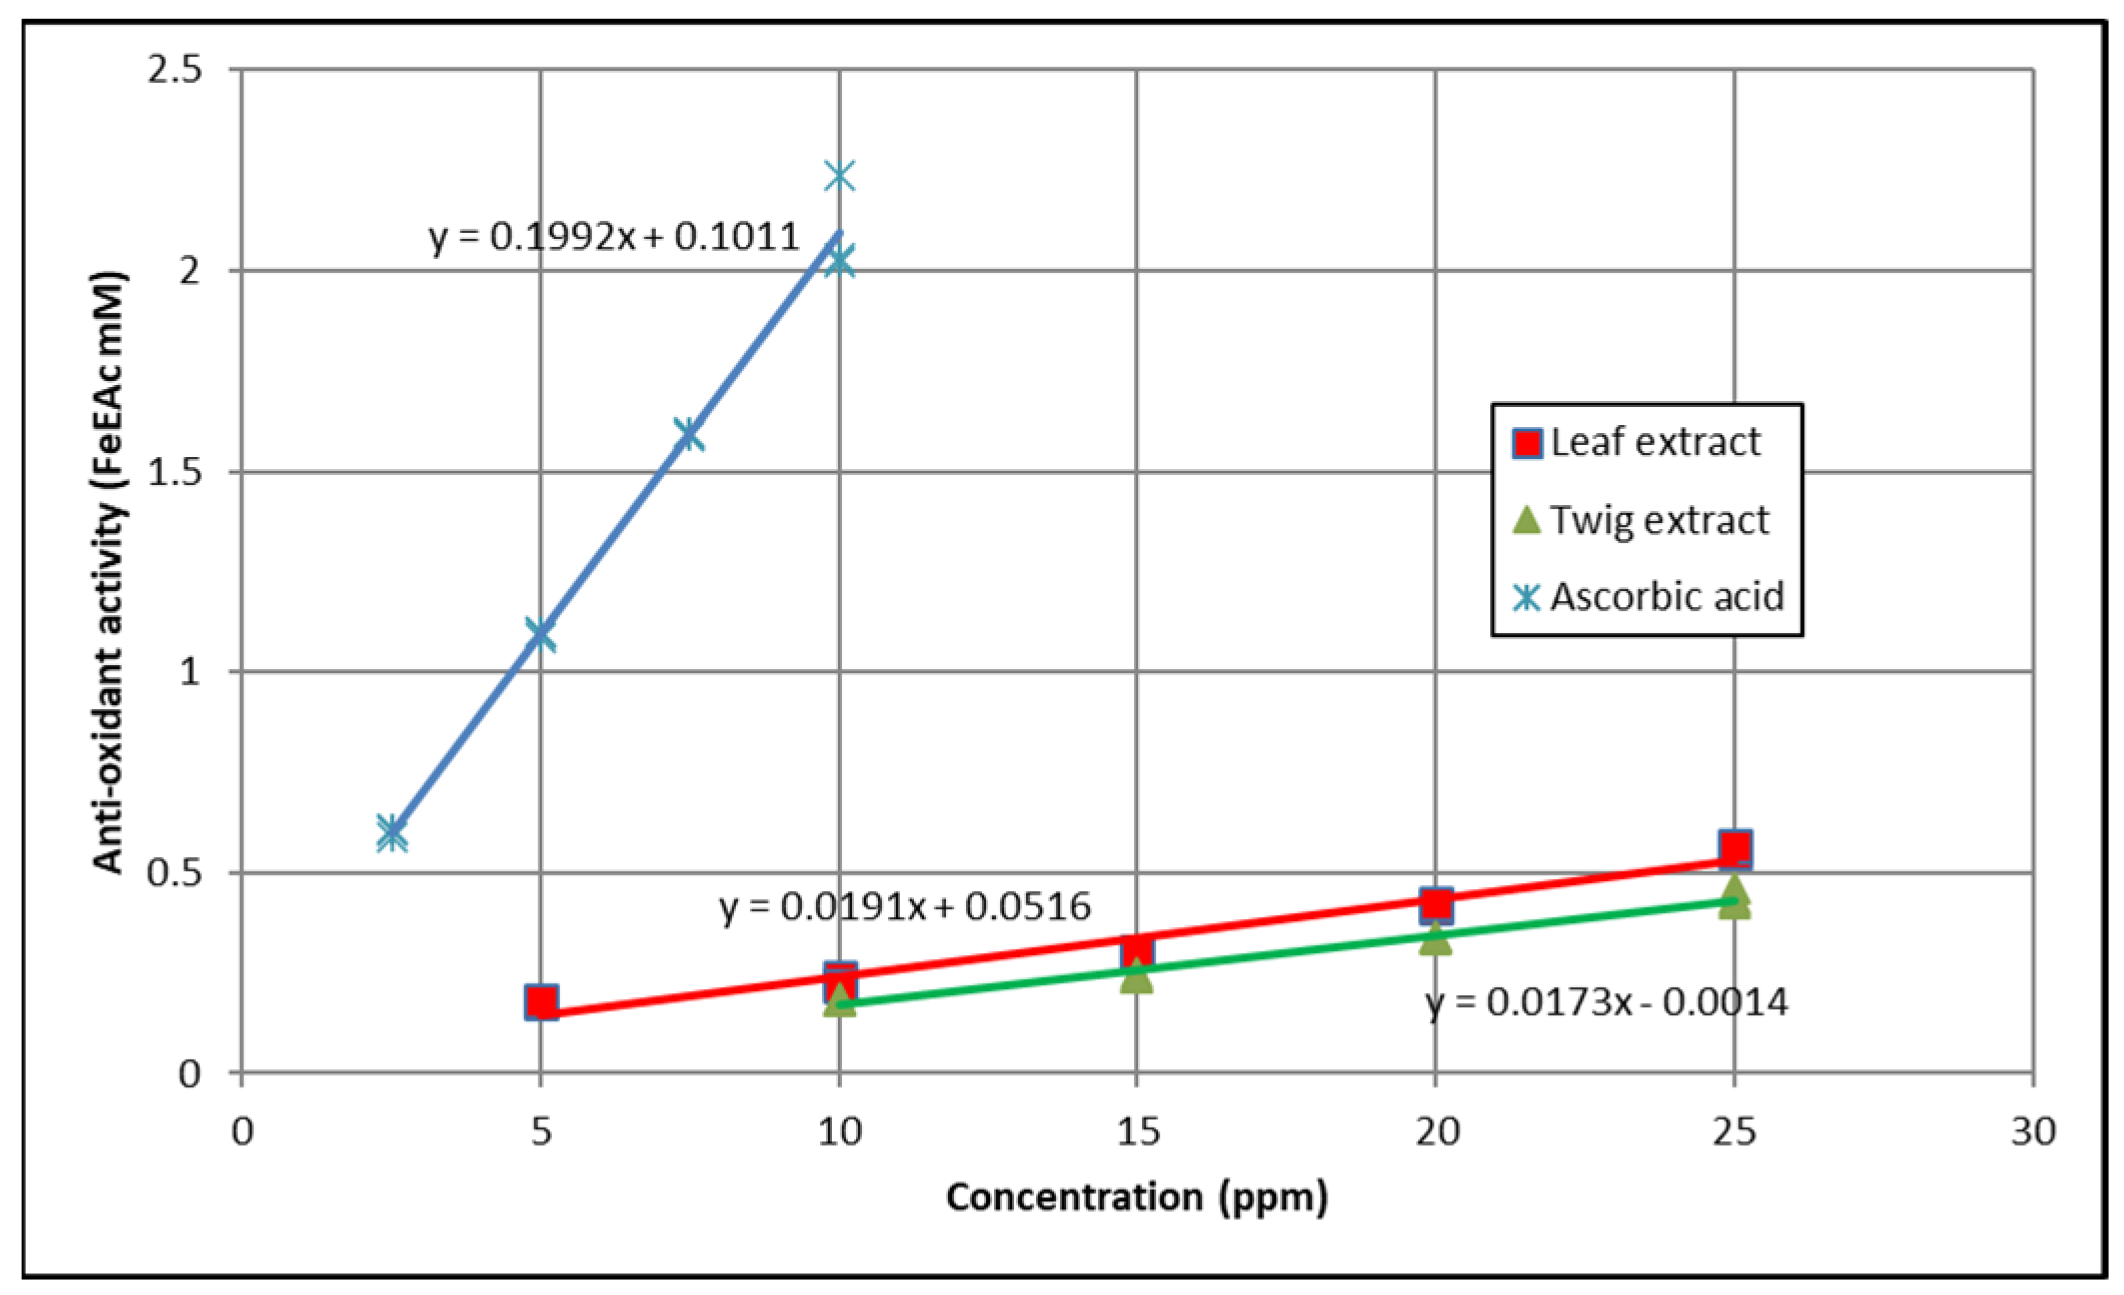
3.3. Ferric Reducing Antioxidant Power (FRAP)

The antioxidant activities of the leaf and twig ethanol extracts of A. sumatranus measured using the FRAP method were 0.0197 ± 0.0033 Fe2+ mol/g extract and 0.0173 ± 0.0009 Fe2+ mol/g extract, respectively. These values are quite small compared to the measured value for ascorbic acid, which was 0.1992 ± 0.0056 Fe2+ mol/g. The subtraction of the regression line intercept in the calculation of Fe2+ mol/g (see Section 2.5) was made to remove the bias, which appeared due to the non-zero intercept of the calibration regression line of the FRAP (R2 = 0.992, see Figure S3).The comparison of the antioxidant activities in the ferric ion equivalent antioxidant activity (FeEAc) in mM can be seen in Figure 3, which verifies that the rate of increase in antioxidant activity of the leaf extract was a little bit higher than the twig extract, but both extracts had a lower rate of increase of antioxidant activities compared to ascorbic acid.

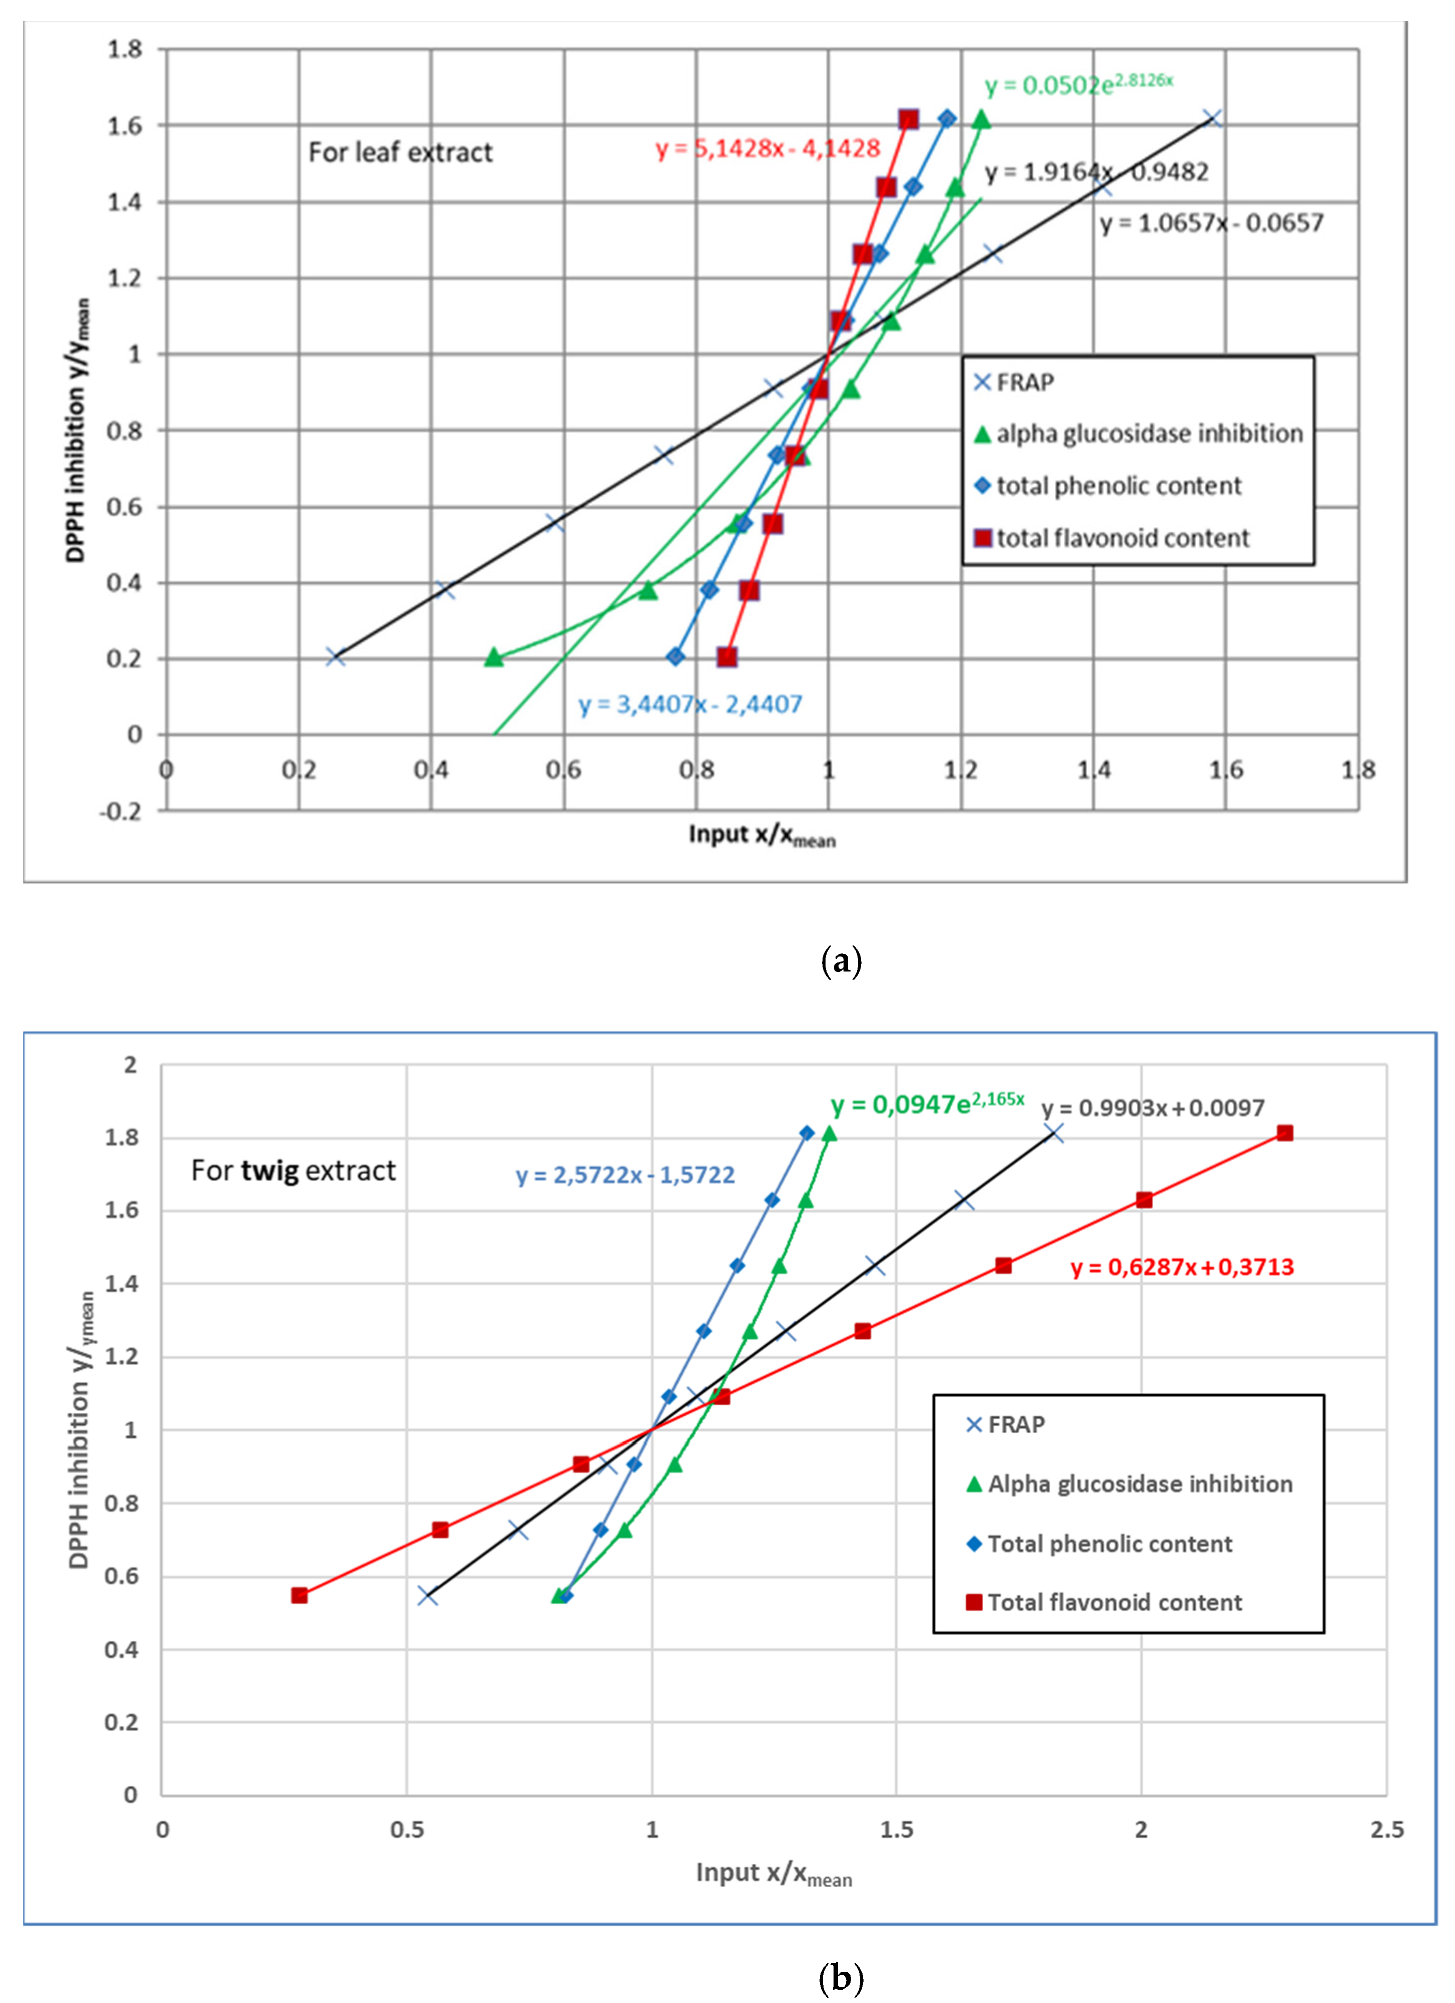
3.4. 2,2-Diphenyl-1-Picrylhydrazyl (DPPH) Radical Scavenging Activity

The antioxidant activities were also measured using a DPPH assay in this research. The results were presented as the IC50 of the DPPH inhibition: 17.186 ppm for the leaf extract and 19.547 ppm for the twig extract. For comparison, the IC50 of the ascorbic acid measured in this experiment was 10.604 ppm (60.17 µM). These values were obtained from the regression line of the percentage of DPPH inhibition with respect to the concentration in ppm, as shown in Figure 4. The respective R2 values of the regression lines for the different entities were 0.993 (leaf extract), 0.993 (twig extract), and 0.980 (ascorbic acid).
These DPPH results confirmed the conclusion of the FRAP assay results in Section 3.3. The antioxidant activity of the twig extract was lower than that of the leaf extract. Both extracts had lower antioxidant activities compared to the ascorbic acid. Nevertheless, considering the values of the IC50, both extracts were quite strong antioxidant agents in comparison with the known strong antioxidant, ascorbic acid. The FRAP results also showed that the rate of increase in antioxidant activities for both extracts was lower than for ascorbic acid, making it harder to increase the inhibition of DPPH. This can also be seen in the lower gradient of the regression lines for the extracts in Figure 4, compared to the one for ascorbic acid.

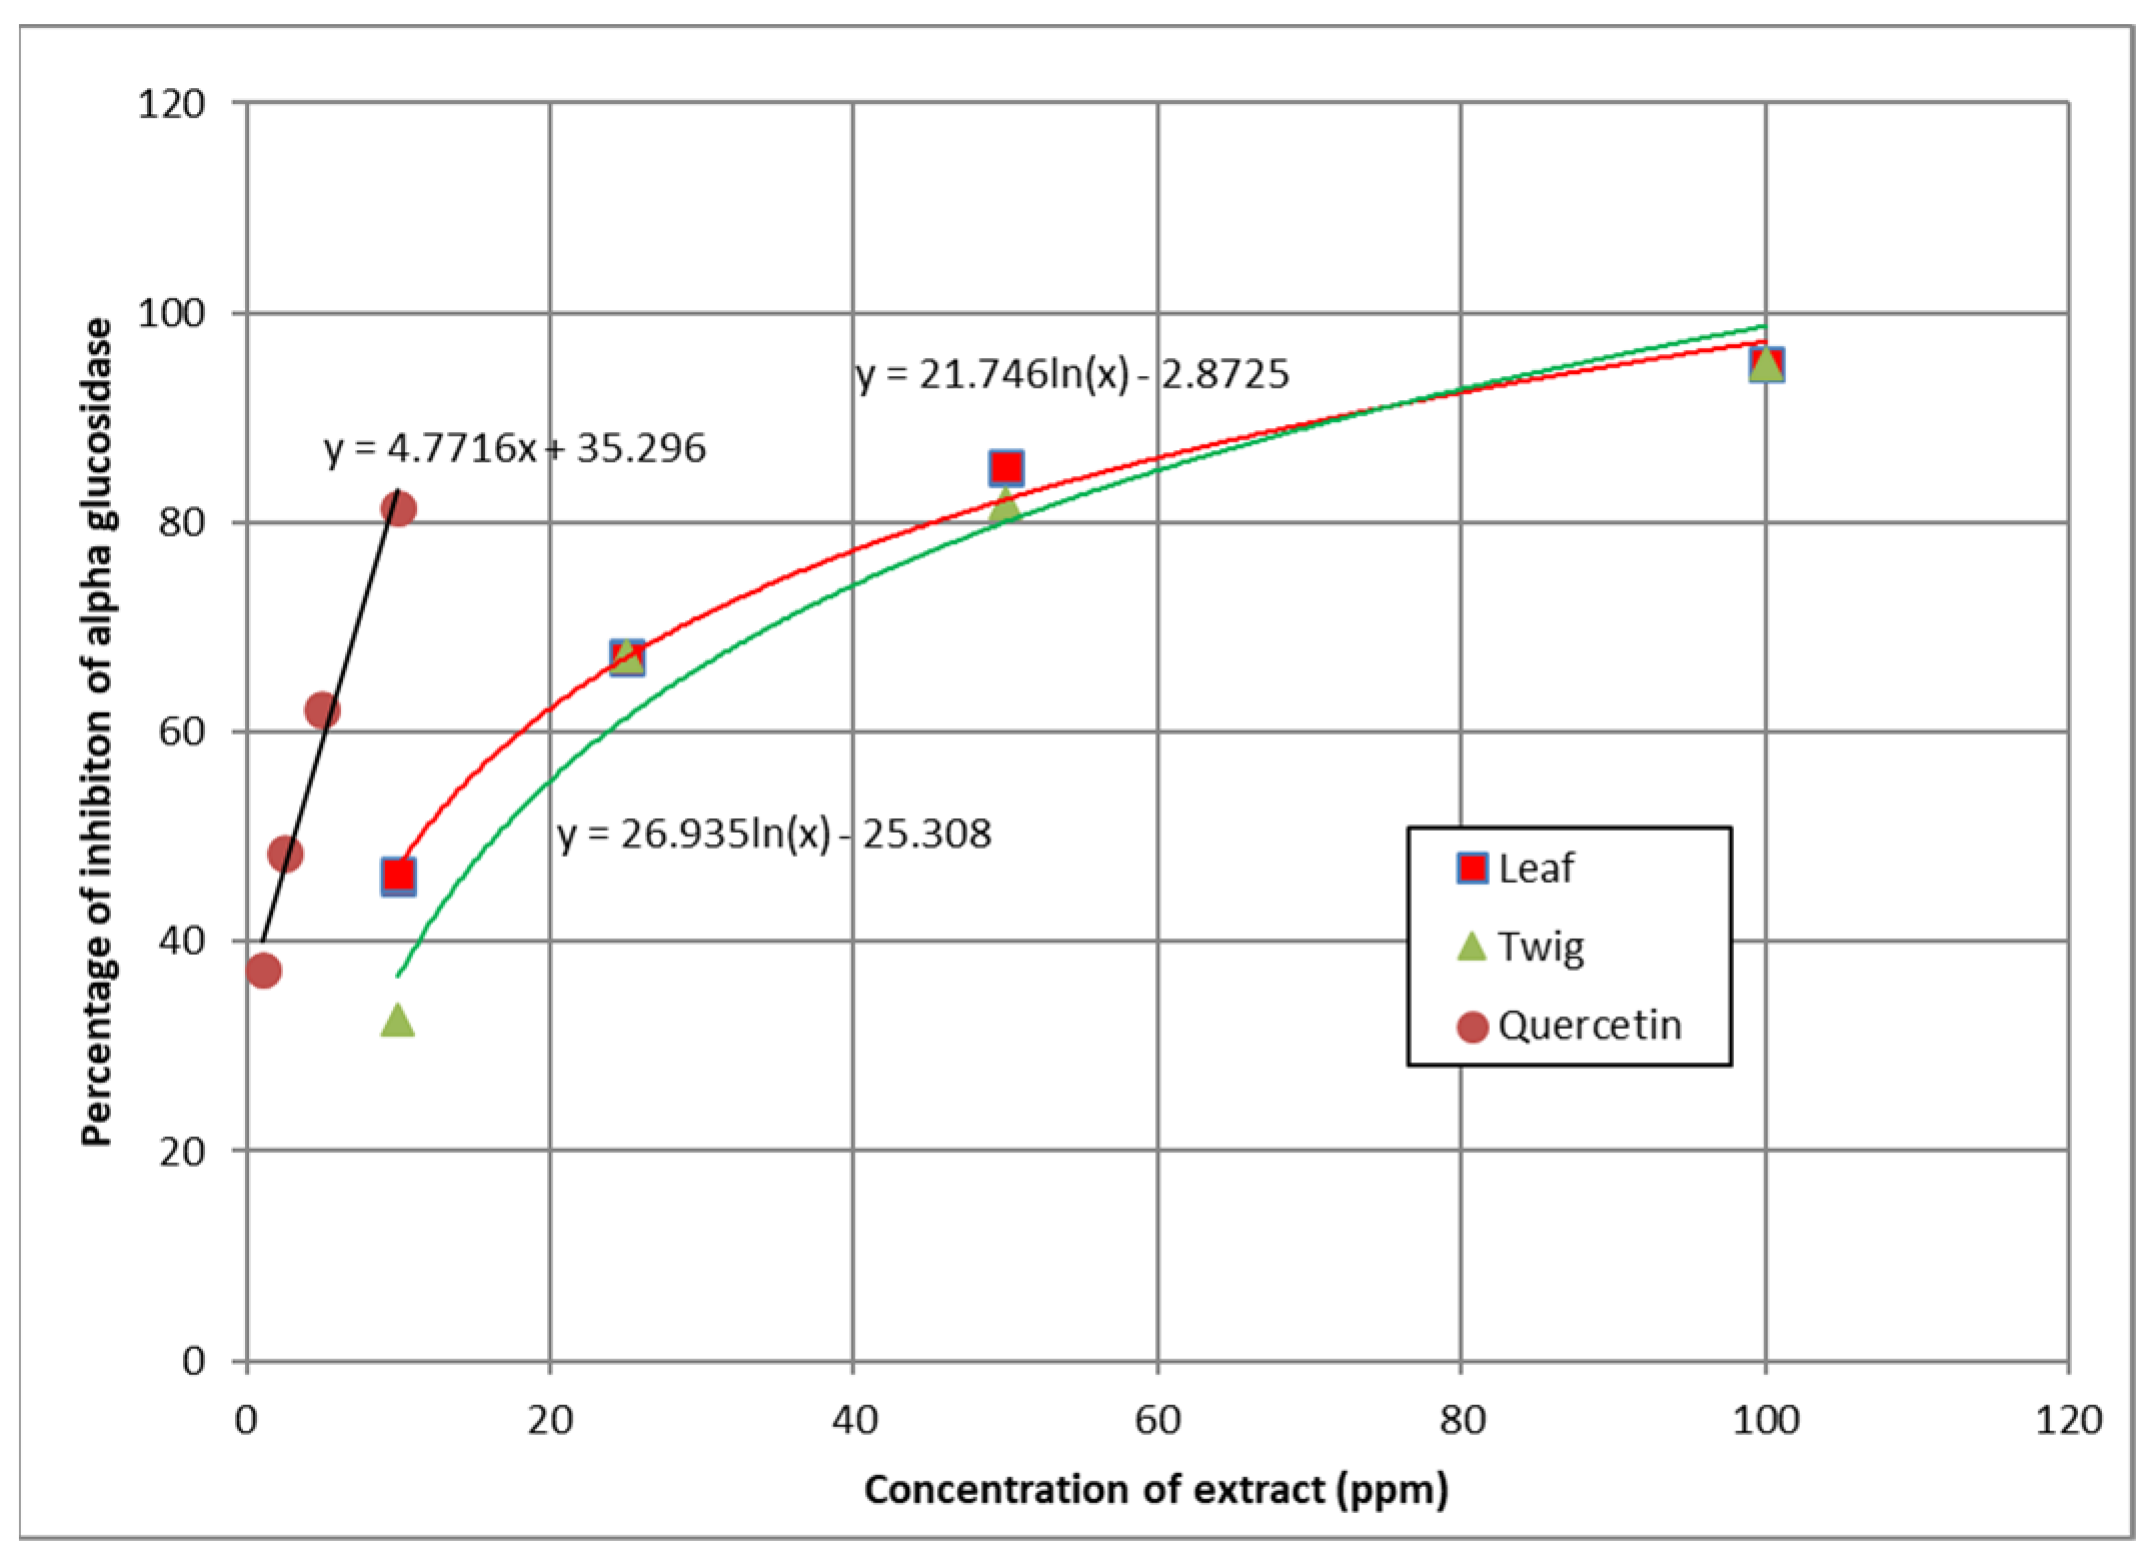
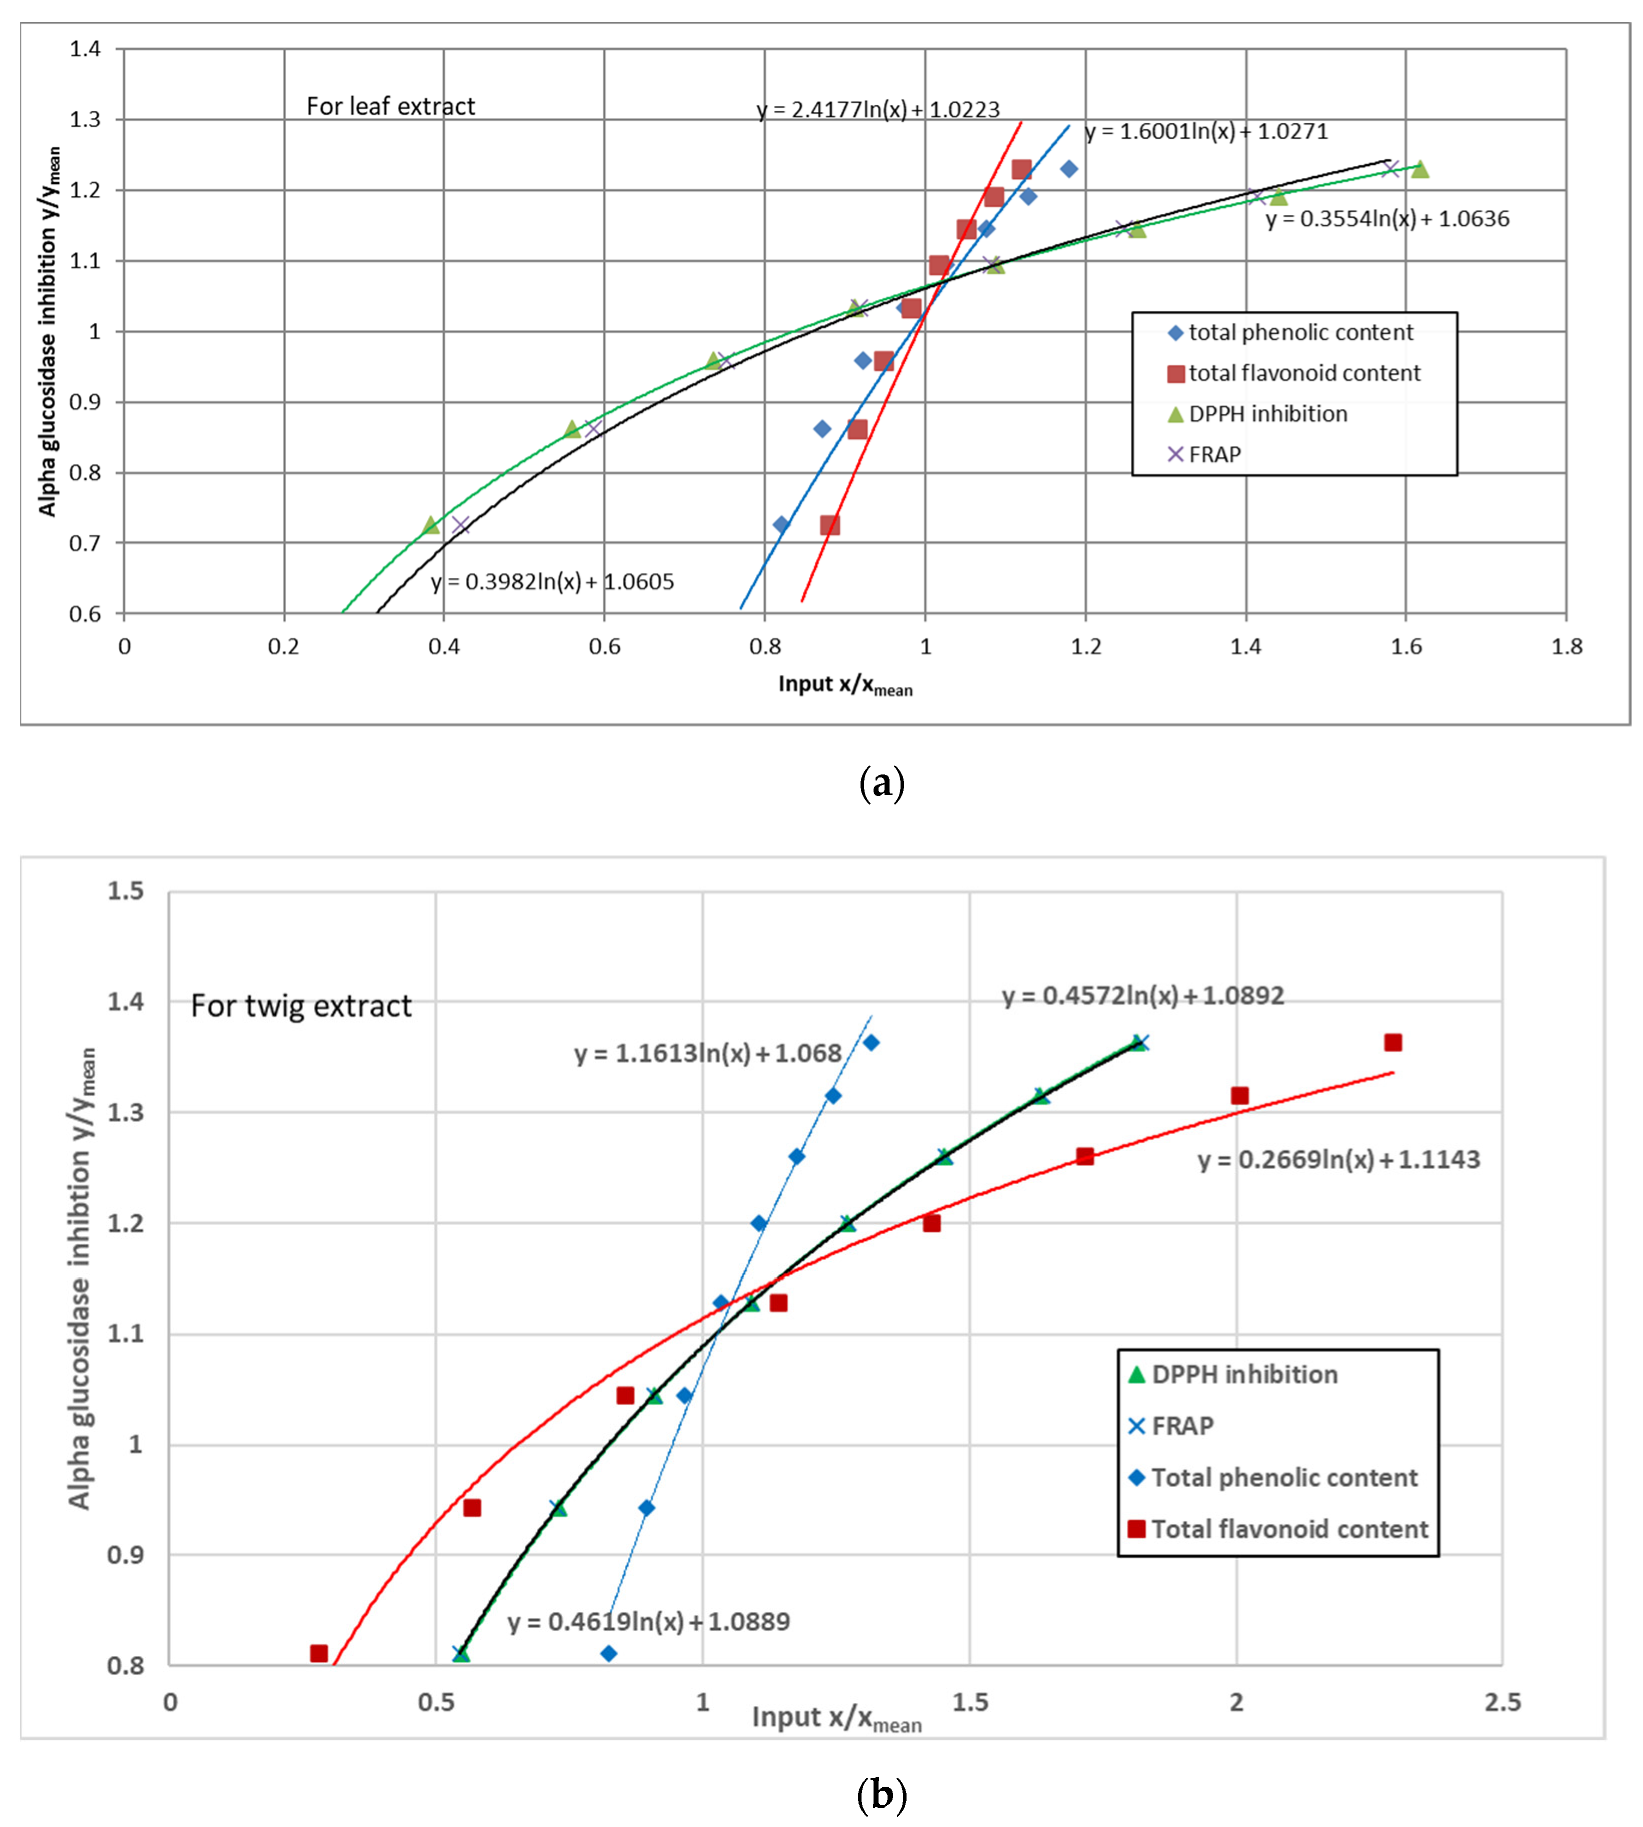
3.5. α-Glucosidase Inhibition

The α-glucosidase inhibition activity of the leaf and twig ethanol extracts is shown in Figure 5. From the figure, it can be seen that the IC50 value of the leaf (11.375 ppm) was smaller than the twig (16.378 ppm). This shows that the leaf ethanol extract was stronger than that of the twig. Nevertheless, the IC50 of both the leaf and twig ethanol extracts were weaker than the positive reference, quercetin (3.082 ppm or 10.19 µM).
As can be seen in Figure 5, the data for the leaf and twig extracts are both approximated by logarithmic regression lines, which better fit the data than linear regression lines (R2 for the logarithmic regression lines for the leaf and twig extracts are 0.990 and 0.969, respectively). The data for the positive reference, quercetin, was approximated with the linear regression line (R2 = 0.980), which has a better fit than the logarithmic regression line for this case. These regression lines were used to compute the IC50 values.

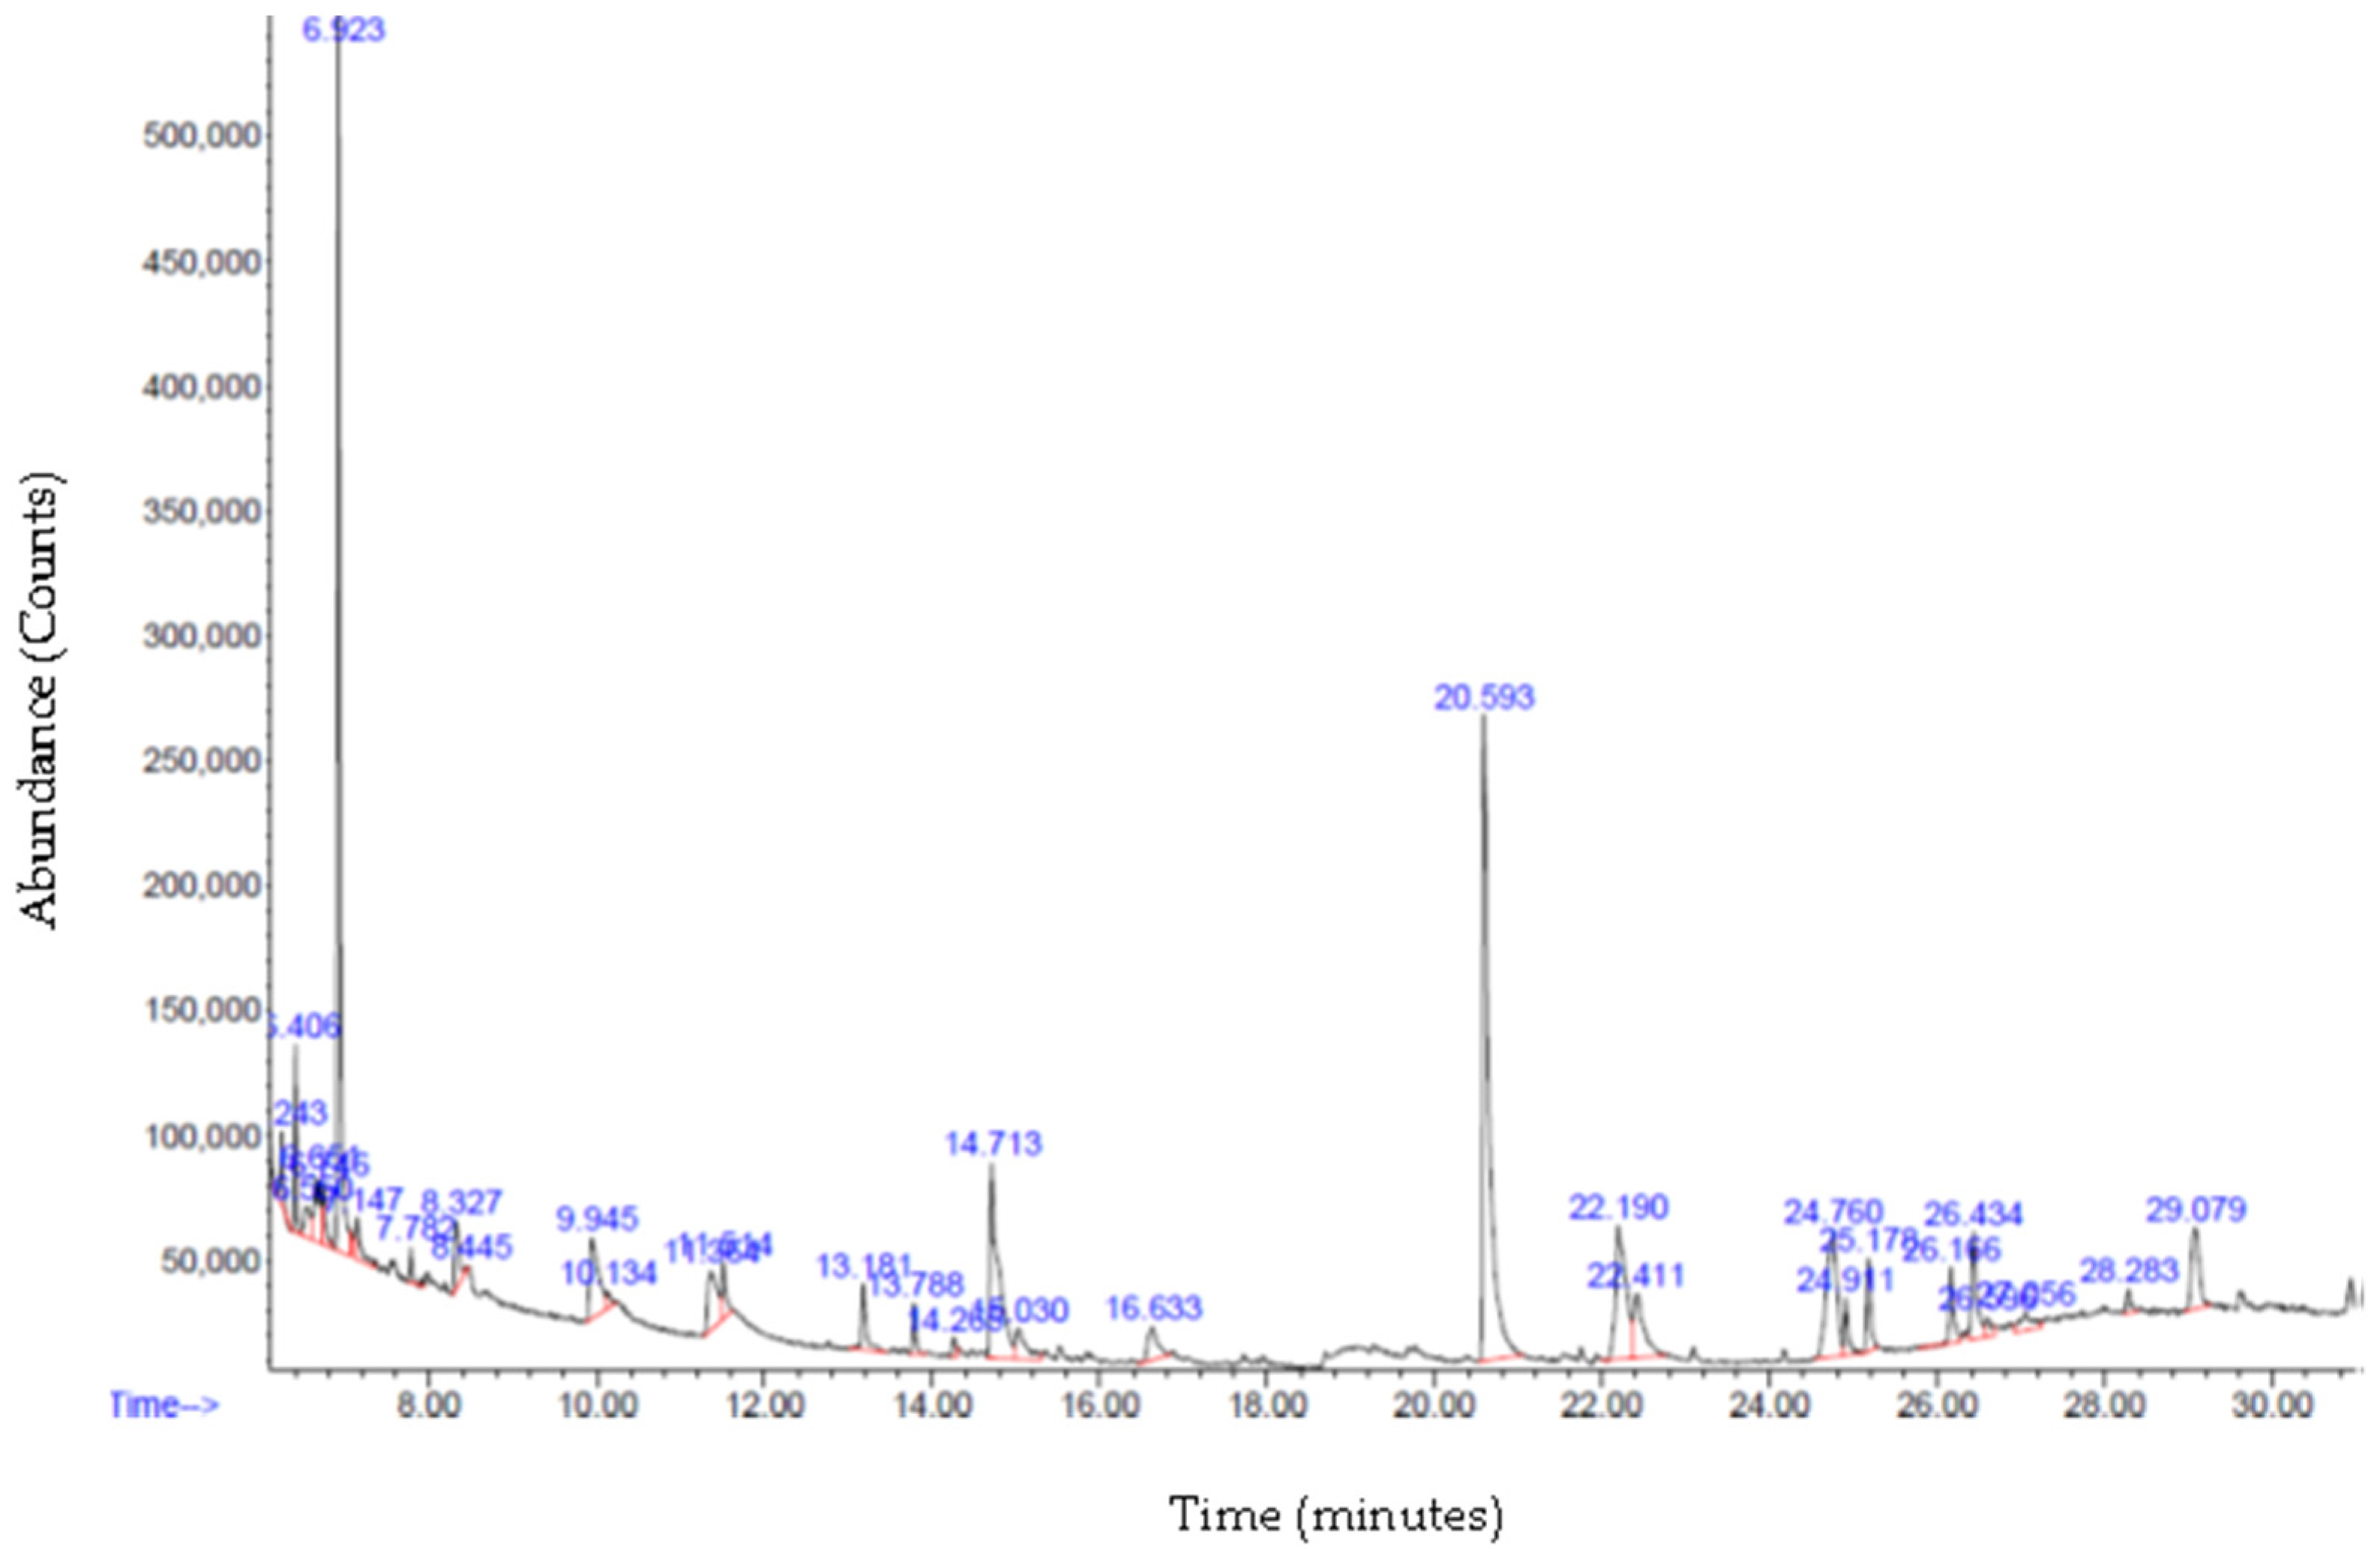
3.6. Gas Chromatography—Mass Spectrometry (GC-MS) Analysis

From the GC-MS, several compounds were identified from the twig ethanol extract, as can be seen in Figure 6 and Table 1. Based on the peak area, it can be deduced how much of the compound is available in the twig extract. However, this list of compounds is not yet exhaustive. These were just the compounds which could be identified using the database linked to the GC-MS machine and software. Similar lists for the identified compounds in the leaf ethanol extract using GC-MS can be seen in Figure 7 and Table 2.
Most of the compounds found in the twig and leaf extracts using GC-MS were from the terpenoid group except anthracene, 9,10-dihydro-9,9,10-trimethyl, a phenolic compound (in the twig extract), and 7,9-Di-tert-butyl-1-oxaspiro(4,5)-deca-6,9-diene-2,8-dione, a flavonoid compound (in the leaf extract).

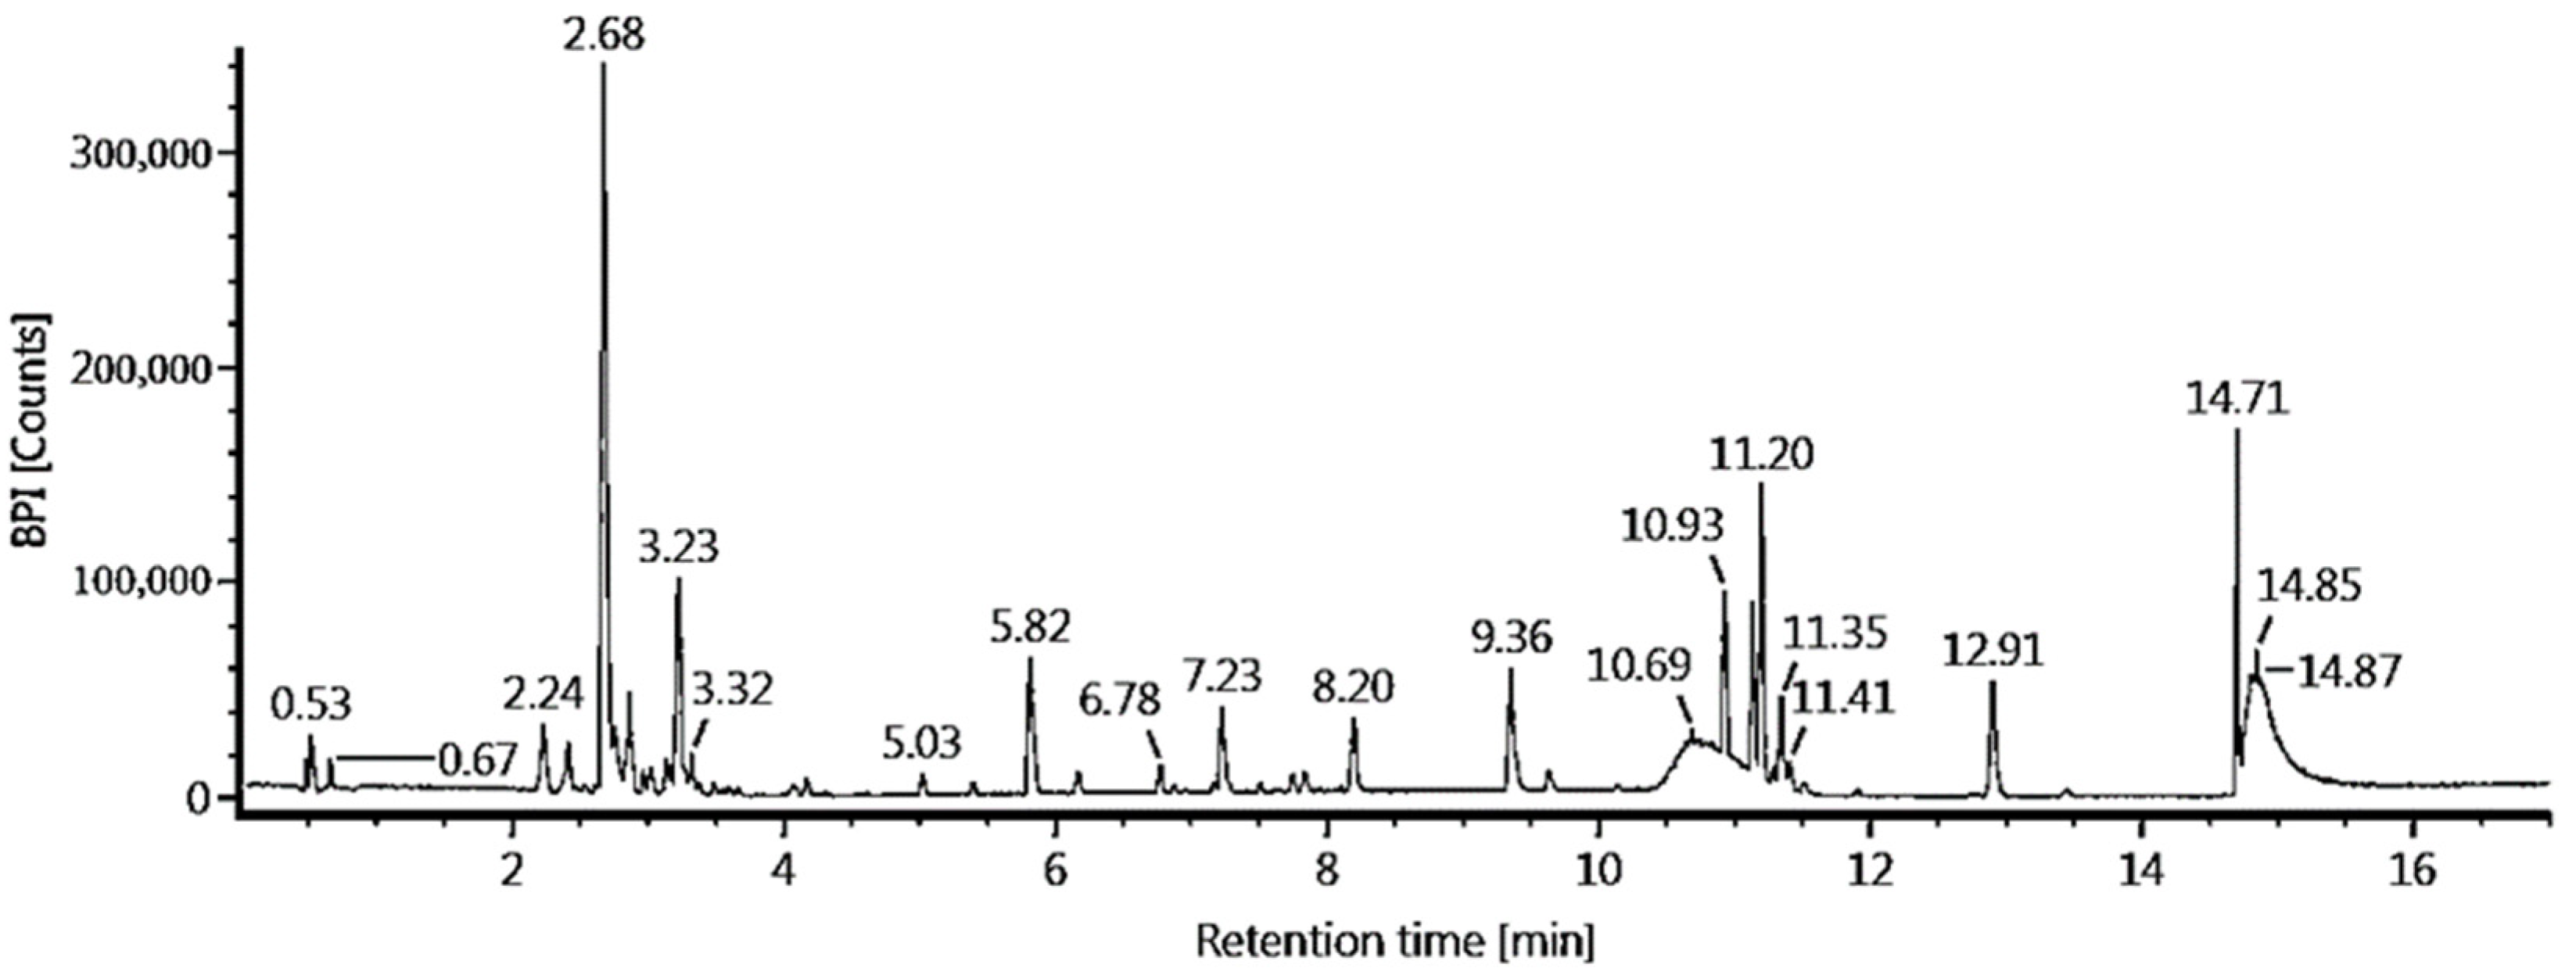
3.7. Liquid Chromatography—Mass Spectrometry (LC-MS/MS) Analysis

Compared to the GC-MS (see Table 1 and Table 2), the identified compounds in the leaf and twig ethanol extracts of A. sumatranus from the LC-MS/MS results (see Table 3 and Figure 8, as well as Table 4 and Figure 9, respectively) had a higher molecular weight (MW). This was expected since the compounds identified in GC-MS were volatile, which usually have low molecular weights. This list was, of course, not exhaustive.
Some of the compounds identified in the LC-MS/MS were from the flavonoid groups, such as mangiferin and neomangiferin, in both the leaf and twig extracts. By observing the response, it could be deduced that mangiferin was the most abundant identified compound from the LC-MS-MS results for both the twig and leaf extracts, but it was more abundant in the leaf than in the twig extract. Neomangiferin was more abundant in the twig extract than in the leaf extract. For the leaf extract, there was another flavonoid compound identified, which was kaempferol 7-O-α-L-rhamnoside. The other identified compounds in the leaf and twig extracts, using the LC-MS-MS analysis, were mostly from the triterpenoid group.

3.8. Molecular Docking Results

The molecular docking simulations for all the identified compounds from both the GC-MS and LC-MS-MS were conducted to find out whether these compounds have the potential to become α-glucosidase inhibitors. Here, the ligands were the identified compounds, while the receptor was the α-glucosidase enzyme. The results are shown in Table 5.

4. Discussion

Since the samples taken for the different quantities could not have the same concentrations (due, for example, to the too-small measurement result values, e.g., the absorbance, making it unreliable), the comparison between the measured quantities (total phenolic content, total flavonoid content, antioxidant activity (DPPH and FRAP methods), and α-glucosidase inhibition) could not be conducted using a simple Pearson correlation. Therefore, to compare the different quantities, first, the regression lines, which were made between the measured quantities and the extract concentration (see Figure 1, Figure 2, Figure 3, Figure 4 and Figure 5), were used to compute the measured quantities of the extract concentrations in the range of 5 ppm to 50 ppm, in increments of 5 ppm. Then, for the extract concentrations, the regression lines between the α-glucosidase inhibition, as the output (y axis), and the rest of the measured quantities, as inputs (x axis), were made to identify which measured quantities had the strongest relationship to α-glucosidase inhibition (see Figure 10). To remove the scaling factor, the quantities were divided by their respective mean values. Similar plots were also made with DPPH inhibition (Figure 11) to find out which measured quantities had the strongest influence on the DPPH inhibition. For α-glucosidase inhibition, the regression lines were made with a logarithmic scale, since the α-glucosidase inhibition data are rather curved (see Figure 5). For the DPPH, the linear regression lines were a good fit to the data (see Figure 11), except when α-glucosidase inhibition is the input, due the same reason as above.
From Figure 10a, for the leaf extract, the factors that had the strongest relationship to α-glucosidase inhibition (had the largest gradients) were the total flavonoid content and total phenolic content. The antioxidant activity had a weaker relationship to the α-glucosidase inhibition, both for the FRAP and DPPH results. Interestingly, for the twig extract (Figure 10b), only the total phenolic content had a strong relationship to the α-glucosidase inhibition. The FRAP and DPPH results for the twig extract showed a similar relationship to the α-glucosidase inhibition as for the leaf extract, stronger than that of the total flavonoid content. From these results, it could be deduced that the phenolic and flavonoid compounds in the leaf extracts were likely to have α-glucosidase inhibition activity. For the twig extract, the phenolic compounds were likely to be active, while the flavonoids were probably not. It also seemed that the antioxidant agent did not necessarily have a strong α-glucosidase inhibition in both the leaf and twig extracts.
On the other hand, by observing Figure 11a, it could be deduced that, for the leaf extract, the total phenolic content, total flavonoid content, and α-glucosidase inhibition had a strong relationship to the DPPH results. The FRAP results had a gradient near 1, implying that the FRAP and DPPH were similar (one-to-one), which was expected since the FRAP and DPPH methods measured the same quantity. For the twig extract (see Figure 11b), the strong factors in the DPPH result were only the total phenolic content and α-glucosidase inhibition, while the total flavonoid content had a weaker relationship. The FRAP and DPPH results showed the same, nearly one-to-one, relationship as for the leaf extract. These results imply that the phenolic and flavonoid compounds in the leaf extract were likely active as antioxidant agents. It also seems that the active compounds for α-glucosidase inhibition in the leaf extract were also active as antioxidants. This result was not the same for the twig extract, where the active antioxidants are likely phenolic compounds, not flavonoid compounds. However, the inhibitor of α-glucosidase in the twig extract has a good chance to also have antioxidant activity, as with the leaf extract.
The activity potential as an α-glucosidase inhibitor increases as the binding energy becomes more negative, and the inhibition constant decreases. High-affinity binding can be defined as having an inhibition constant K i ,     250 nM or binding energy −9 kcal/mol [44]. As can be seen in Table 5, the seven highest potential compounds that can be classified as having a high affinity to α-glucosidase are neomangiferin, kaempferol-7-O-α-L-rhamnoside, asperuloside, mangiferin, moupinamide, 9-O-Pivaloyl-N-acetylcolchinol, and stigmastan 3,6-dione. Some of these compounds have been verified by previous researchers as α-glucosidase inhibitors: neomangiferin and mangiferin [45], kaempferol-7-O-α-L-rhamnoside [46], asperuloside [47], and moupinamide [48]. The activity of 9-O-Pivaloyl-N-acetylcolchinol and stigmastan 3,6-dione to inhibit α-glucosidase has not yet been verified. Stigmastan was identified elsewhere as one of the compounds in an extract that showed good α-glucosidase inhibition [49], but has not yet been tested as a single compound.
Interestingly, some of the verified α-glucosidase inhibitor compounds (neomangiferin and mangiferin [45], kaempferol-7-O-α-L-rhamnoside [49], asperuloside [50], and moupinamide [51]) have also been shown to exhibit antioxidant activities. Whereas 9-O-Pivaloyl-N-acetylcolchinol and stigmastan 3,6-dione have not yet been verified before as antioxidant agents, stigmastan has been mentioned elsewhere as one of the compounds in an extract with good antioxidant activity [52]. This seems to corroborate the deduction made above: the α-glucosidase inhibitors in the leaf and twig ethanol extracts were likely also antioxidant agents. This relationship seems to be observed in other plants, such as in the research by Sekhon-Loodu and Rupasinghe (2019) [10], which found the correlation between α-glucosidase inhibition and antioxidant activity in Myrica gale and Rhodiola rosea extracts; and in similar findings by Pieczykolan, et al., (2021) [53], who conducted the research on Aerva lanata (L.) Juss.
The other deductions could not yet be convincingly verified, since the list of identified compounds is not yet exhaustive. Nevertheless, from the list in Table 5, some of the compounds are flavonoids: neomangiferin, kaempferol-7-O-α-L-rhamnoside, mangiferin, and 7,9-Di-tert-butyl-1-oxaspiro(4,5)deca-6,9-diene-2,8-dione. These are compounds with high and medium activities, shown in Table 5. By comparing these compounds with Table 1, Table 2, Table 3 and Table 4, it can be seen that more of these flavonoids were found in the leaf extract than in the twig. This seems to support the deduction above that more flavonoids in the leaf extract were inhibitors of α-glucosidase than in the twig. Since all flavonoids are also phenolic compounds, the above deduction—that the phenolic compounds in the leaf extract were likely to be active—seems to be corroborated. Nevertheless, the deduction that, in the twig extract, only the phenolics compounds tend to be active while the flavonoids are not, seems not to be supported, since there were flavonoids which were active in the twig extract, although there was one phenolic compound found in the twig extract but not in the leaf extract, anthracene (but its activity as an α-glucosidase inhibitor was not very strong). Perhaps the deduction could still be supported if more compounds in the twig extract were identified.

5. Conclusions

In Vitro and in silico analyses of A. sumatranus leaf and twig ethanol extracts showed their potential as α-glucosidase inhibitors, although the activity was caused by different group of compounds. It seems that both phenolic and flavonoid compounds contribute to the activity of α-glucosidase inhibition in both the leaf and twig ethanol extracts. The comparisons between the antioxidant and α-glucosidase inhibition activities also indicated that the compounds with a high affinity to α-glucosidase were likely to have antioxidant activity, too. The molecular docking analysis on the LC MS/MS data showed that the major compound in both extracts with the highest affinity to α-glucosidase was neomangiferin.

Supplementary Materials

The following supporting information can be downloaded at: www.mdpi.com/article/10.3390/scipharm91010002/s1, Figure S1: Calibration curve of gallic acid equivalent (GAE) for total phenolic content; Figure S2: Calibration curve of quercetin equivalent (QE) for total flavonoid content; Figure S3: Calibration curve of iron (II) sulphate.

Author Contributions

D.R. performed the experiment and wrote the manuscript; B.E. designed the experiment and reviewed the article; M.H. and M.I.S. collected the samples, conducted the LC-MS/MS and GC-MS analyses, and reviewed the article; A.K. reviewed the article. All authors have read and agreed to the published version of the manuscript.

Funding

This research was funded by Pelita Harapan University through internal grant number P-03-FIKes/XII/2021.

Institutional Review Board Statement

Not applicable.

Informed Consent Statement

Not applicable.

Data Availability Statement

Not applicable.

Acknowledgments

We thank the Cibodas Botanical Garden for providing the samples, the National Research and Innovation Institutes for the study funding through the Degree by Research Scholarship, the Advanced Characterization Laboratories Serpong at the National Research and Innovation Institute, and the Pharmaceutical Biology Laboratory at Pelita Harapan University for the research facilities, as well as scientific and technical support.

Conflicts of Interest

The authors declare no conflict of interest.

References

  1. Wei, J.; Tian, J.; Tang, C.; Fang, X.; Miao, R.; Wu, H.; Wang, X.; Tong, X. The influence of different types of diabetes on vascular complications. J. Diabetes Res. 2022, 2022, 3448618. [Google Scholar] [CrossRef] [PubMed]
  2. Padhi, S.; Kumar, A.; Behera, A. Biomedicine & pharmacotherapy type II diabetes mellitus: A review on recent drug based therapeutics. Biomed. Pharmacother. 2020, 131, 110708. [Google Scholar] [CrossRef] [PubMed]
  3. Dirir, A.M.; Daou, M.; Yousef, A.F.; Yousef, L.F. A review of alpha-glucosidase inhibitors from plants as potential candidates for the treatment of type-2 diabetes. Phytochem. Rev. 2021, 21, 1049–1079. [Google Scholar] [CrossRef] [PubMed]
  4. Mehta, A.; Zitzmamann, N.; Rudd, M.P.; Bock, M.T.; Dwek, A.R. Alpha glucosidase inhibitors as potential broad based anti-viral agents. FEBS Lett. 1998, 430, 17–22. [Google Scholar] [CrossRef] [Green Version]
  5. Zhao, Y.; Wang, Y.; Lou, H.; Shan, L. Alpha-glucosidase inhibitors and risk of cancer in patients with diabetes mellitus: A systematic review and meta-analysis. Oncotarget 2017, 8, 81027–81039. [Google Scholar] [CrossRef] [PubMed] [Green Version]
  6. Khwaja, N.U.D.; Arunagirinathan, G. Efficacy and cardiovascular safety of alpha glucosidase inhibitors. Curr. Drug Saf. 2021, 16, 122–128. [Google Scholar] [CrossRef] [PubMed]
  7. Krentz, A.J. Evolution of glucose-lowering drugs for type 2 diabetes: A new era of cardioprotection. In Nutritional and Therapeutic Interventions for Diabetes and Metabolic Syndrome; Elsevier Inc.: Amsterdam, The Netherlands, 2018; pp. 429–454. ISBN 9780128120194. [Google Scholar]
  8. Rosa, M.M.; Dias, T. Commonly used endocrine drugs. Handb. Clin. Neurol. 2014, 120, 809–824. [Google Scholar] [CrossRef]
  9. Hossain, M.A.; Pervin, R. Current antidiabetic drugs. In Nutritional and Therapeutic Interventions for Diabetes and Metabolic Syndrome; Elsevier Inc.: Amsterdam, The Netherlands, 2018; pp. 455–473. ISBN 9780128120194. [Google Scholar]
  10. Sekhon-Loodu, S.; Rupasinghe, H.P.V. Evaluation of antioxidant, antidiabetic and antiobesity potential of selected traditional medicinal plants. Front. Nutr. 2019, 6, 53. [Google Scholar] [CrossRef]
  11. Ibrahim, M.A.; Koorbanally, N.A.; Islam, M.S. Antioxidative activity and inhibition of key enzymes linked to type-2 diabetes (α-glucosidase and α-amylase) by Khaya senegalensis. Acta Pharm. 2014, 64, 311–324. [Google Scholar] [CrossRef] [Green Version]
  12. Galicia-Garcia, U.; Benito-Vicente, A.; Jebari, S.; Larrea-Sebal, A.; Siddiqi, H.; Uribe, K.B.; Ostolaza, H.; Martín, C. Pathophysiology of type 2 diabetes mellitus. Int. J. Mol. Sci. 2020, 21, 6275. [Google Scholar] [CrossRef]
  13. Kumar, S.; Narwal, S.; Kumar, V.; Prakash, O. α-glucosidase inhibitors from plants: A natural approach to treat diabetes. Pharmacogn. Rev. 2011, 5, 19–29. [Google Scholar] [CrossRef] [PubMed] [Green Version]
  14. Anwar, H.; Hussain, G.; Mustafa, I. Antioxidants from natural sources. In Antioxidants in Foods and Its Application; IntechOpen: London, UK, 2018; pp. 3–28. [Google Scholar] [CrossRef] [Green Version]
  15. Rasheed, A.; Fathima Abdul Azeez, R. A review on natural antioxidants. In Traditional and Complementary Medicine; IntechOpen: London, UK, 2019. [Google Scholar] [CrossRef] [Green Version]
  16. Cedeño, H.; Espinosa, S.; Andrade, J.M.; Cartuche, L.; Malagon, O. Novel flavonoid glycosides of quercetin from leaves and flowers of Gaiadendron punctatum G.Don (Violeta de Campo), used by the saraguro community in Southern Ecuador, inhibit alpha glucosidase enzyme. Molecules 2019, 24, 4267. [Google Scholar] [CrossRef] [PubMed] [Green Version]
  17. Mosihuzzman, M.; Naheed, S.; Hareem, S.; Talib, S.; Abbas, G.; Khan, S.N.; Choudhary, M.I.; Sener, B.; Tareen, R.B.; Israr, M. Studies on α-glucosidase inhibition and anti-glycation potential of Iris loczyi and Iris unguicularis. Life Sci. 2013, 92, 187–192. [Google Scholar] [CrossRef]
  18. Alqahtani, A.S.; Hidayathulla, S.; Rehman, M.T.; Elgamal, A.A.; Al-Massarani, S.; Razmovski-Naumovski, V.; Alqahtani, M.S.; El Dib, R.A.; Alajmi, M.F. Alpha-amylase and alpha-glucosidase enzyme inhibition and antioxidant potential of 3-oxolupenal and katononic acid isolated from Nuxia oppositifolia. Biomolecules 2020, 10, 61. [Google Scholar] [CrossRef] [PubMed] [Green Version]
  19. Gao, H.; Huang, Y.N.; Gao, B.; Li, P.; Inagaki, C.; Kawabata, J. Inhibitory effect on α-glucosidase by Adhatoda vasica Nees. Food Chem. 2008, 108, 965–972. [Google Scholar] [CrossRef]
  20. Sheikh, Y.; Chanu, M.B.; Mondal, G.; Manna, P.; Chattoraj, A.; Chandra Deka, D.; Chandra Talukdar, N.; Chandra Borah, J. Procyanidin A2, an anti-diabetic condensed tannin extracted from Wendlandia glabrata, reduces elevated G-6-Pase and mRNA levels in diabetic mice and increases glucose uptake in CC1 hepatocytes and C1C12 myoblast cells. RSC Adv. 2019, 9, 17211–17219. [Google Scholar] [CrossRef] [Green Version]
  21. Yoshikawa, M.; Murakami, T.; Yashiro, K.; Matsuda, H. Kotalanol, a potent alpha glukosidase inhibitor with thiosugar sulfonium sulfate structure, from antidiabetic Ayurvedic medicine Salacia reticulata. Chem. Pharm. Bull. 1998, 46, 1339–1340. [Google Scholar] [CrossRef] [Green Version]
  22. Yoshikawa, M.; Nishida, N.; Shimoda, H.; Takada, M.; Kawahara, Y.; Matsuda, H. Polyphenol constituents from Salacia Species: Quantitative analysis of mangiferin with α-glucosidase and aldose reductase inhibitory activities. Yakugaku Zasshi 2001, 121, 371–378. [Google Scholar] [CrossRef]
  23. Hung, N.H.; Dai, D.N.; Dung, D.M.; Giang, T.T.B.; Thang, T.D.; Ogunwande, I.A. Chemical composition of essential oils of Artabotrys petelotii Merr., Artabotrys intermedius Hassk., and Artabotrys harmandii Finet & Gagnep. (Annonaceae) from Vietnam. J. Essent. Oil-Bear. Plants 2014, 17, 1105–1111. [Google Scholar] [CrossRef]
  24. Chen, J.; Eiadthong, W. New species and new records of Artabotrys (Annonaceae) from peninsular Thailand. PhytoKeys 2020, 151, 67–81. [Google Scholar] [CrossRef]
  25. Chong, J.Y.; Rajagopal, M.; Chandramanthi, S.; Ashok Kumar, B.; Sasikala, C.; Geethanjali, K. Evaluation of antibacterial activity against multidrug resistant (MDR) bacteria by the fractions of Artabotrys suaveolens (Blume). Curr. Trends Biotechnol. Pharm. 2020, 15, 262–269. [Google Scholar] [CrossRef]
  26. Mohan, S.K.; Veeraraghavan, V.P.; Balakrishna, J.P.; Rengasamy, G.; Rajeshkumar, S. Antidiabetic activity of methanolic extract of Artabotrys suaveolens Leaves in 3T3-L1 cell line. J. Pure Appl. Microbiol. 2020, 14, 573–580. [Google Scholar] [CrossRef] [Green Version]
  27. Kwan, T.K.; Shipton, F.; Nor Azman, N.S.; Hossan, S.; Jin, K.T.; Wiart, C. Cytotoxic aporphines from Artabotrys crassifolius. Nat. Prod. Commun. 2016, 11, 389–392. [Google Scholar] [CrossRef] [Green Version]
  28. Liu, Y.P.; Tang, J.Y.; Hua, Y.; Lai, L.; Luo, X.L.; Zhang, Z.J.; Yin, W.Q.; Chen, G.Y.; Fu, Y.H. Bioactive polyoxygenated seco-cyclohexenes from Artabotrys hongkongensis. Bioorg. Chem. 2018, 76, 386–391. [Google Scholar] [CrossRef]
  29. Wen, Q.; Liu, Y.P.; Yan, G.; Yang, S.; Hu, S.; Hua, J.; Yin, W.Q.; Chen, G.Y.; Fu, Y.H. Bioactive eudesmane sesquiterpenes from Artabotrys hongkongensis Hance. Nat. Prod. Res. 2020, 34, 1687–1693. [Google Scholar] [CrossRef]
  30. Nyandoro, S.S.; Joseph, C.C.; Nkunya, M.H.H.; Hosea, K.M.M. New antimicrobial, mosquito larvicidal and other metabolites from two Artabotrys species. Nat. Prod. Res. 2013, 27, 1450–1458. [Google Scholar] [CrossRef]
  31. Tan, K.K.; Khoo, T.J.; Rajagopal, M.; Wiart, C. Antibacterial alkaloids from Artabotrys crassifolius Hook.f. & Thomson. Nat. Prod. Res. 2015, 29, 2346–2349. [Google Scholar] [CrossRef]
  32. Dewi, R.T.; Tachibana, S.; Darmawan, A. Effect on α-glucosidase inhibition and antioxidant activities of butyrolactone derivatives from Aspergillus terreus MC751. Med. Chem. Res. 2014, 23, 454–460. [Google Scholar] [CrossRef]
  33. González-Palma, I.; Escalona-Buendía, H.B.; Ponce-Alquicira, E.; Téllez-Téllez, M.; Gupta, V.K.; Díaz-Godínez, G.; Soriano-Santos, J. Evaluation of the antioxidant activity of aqueous and methanol extracts of Pleurotus ostreatus in different growth stages. Front. Microbiol. 2016, 7, 1099. [Google Scholar] [CrossRef] [Green Version]
  34. Tomasina, F.; Carabio, C.; Celano, L. Analysis of two methods to evaluate antioxidants. Biochem. Mol. Biol. Educ. 2012, 40, 266–270. [Google Scholar] [CrossRef]
  35. Wiliantari, S.; Iswandana, R.; Elya, B. Total polyphenols, total flavonoids, antioxidant activity and inhibition of tyrosinase enzymes from extract and fraction of Passiflora ligularis Juss. Pharmacogn. J. 2022, 14, 660–671. [Google Scholar] [CrossRef]
  36. Irshad, M.; Zafaryab, M.; Singh, M.; Rizvi, M.M.A. Comparative analysis of the antioxidant activity of cassia fistula extracts. Int. J. Med. Chem. 2012, 2012, 157125. [Google Scholar] [CrossRef] [Green Version]
  37. Budiarso, F.S.; Elya, B.; Hanafi, M.; Limengan, A.H.; Rahmasari, R. Antioxidant activity of methanol fractions stem bark of Kayu Sarampa (Xylocarpus moluccensis (Lam.) M. Roen)). Pharmacogn. J. 2021, 13, 1694–1701. [Google Scholar] [CrossRef]
  38. Chavan, J.J.; Gaikwad, N.B.; Kshirsagar, P.R.; Dixit, G.B. Total phenolics, flavonoids and antioxidant properties of three Ceropegia species from Western Ghats of India. South African J. Bot. 2013, 88, 273–277. [Google Scholar] [CrossRef] [Green Version]
  39. Rahim, N.A.; Roslan, M.N.F.; Muhamad, M.; Seeni, A. Antioxidant activity, total phenolic and flavonoid content and LC–MS profiling of leaves extracts of Alstonia angustiloba. Separations 2022, 9, 234. [Google Scholar] [CrossRef]
  40. Molole, G.J.; Gure, A.; Abdissa, N. Determination of total phenolic content and antioxidant activity of Commiphora mollis (Oliv.) Engl. Resin. BMC Chem. 2022, 16, 48. [Google Scholar] [CrossRef]
  41. Chang, C.C.; Yang, M.H.; Wen, H.M.; Chern, J.C. Estimation of total flavonoid content in propolis by two complementary colometric methods. J. Food Drug Anal. 2002, 10, 178–182. [Google Scholar] [CrossRef]
  42. Aryal, S.; Baniya, M.K.; Danekhu, K.; Kunwar, P.; Gurung, R.; Koirala, N. Total phenolic content, flavonoid content and antioxidant potential of wild vegetables from Western Nepal. Plants 2019, 8, 96. [Google Scholar] [CrossRef]
  43. Morris, G.M.; Ruth, H.; Lindstrom, W.; Sanner, M.F.; Belew, R.K.; Goodsell, D.S.; Olson, A.J. Software news and updates AutoDock4 and AutoDockTools4: Automated docking with selective receptor flexibility. J. Comput. Chem. 2009, 30, 2785–2791. [Google Scholar] [CrossRef] [Green Version]
  44. Morris, A.S.C.; Denham, A.S.; Bassett, H.H.; Curby, W.T. Differences between high- and low-affinity complexes of enzymes and non-enzymes. J. Med. Chem. 2008, 51, 6432–6441. [Google Scholar] [CrossRef]
  45. Wang, J.; Lou, Z.; Zhu, Z.; Chai, Y.; Wu, Y. A Rapid high-performance liquid chromatographic method for quantitative analysis of antidiabetic-active components in Anemarrhena asphodeloides rhizomes. Chromatographia 2005, 61, 633–636. [Google Scholar] [CrossRef]
  46. Chen, H.; Ouyang, K.; Jiang, Y.; Yang, Z.; Hu, W.; Xiong, L.; Wang, N.; Liu, X.; Wang, W. Analysis of the ethanol extracts of Chimonanthus nitens Oliv. leaves and their inhibitory effect on alpha -glucosidase activity. Int. J. Biol. Macromol. 2017, 98, 829–836. [Google Scholar] [CrossRef]
  47. Koia, J.H.; Shepherd, P. The potential of anti-diabetic rākau rongoā (Māori herbal medicine) to treat type 2 diabetes mellitus (T2DM) mate huka: A review. Front. Pharmacol. 2020, 11, 935. [Google Scholar] [CrossRef]
  48. Fan, P.; Terrier, L.; Hay, A.; Marston, A.; Hostettmann, K. Fitoterapia antioxidant and enzyme inhibition activities and chemical profiles of Polygonum sachalinensis F.Schmidt ex Maxim (Polygonaceae). Fitoterapia 2010, 81, 124–131. [Google Scholar] [CrossRef]
  49. Xie, J.H.; Dong, C.J.; Nie, S.P.; Li, F.; Wang, Z.J.; Shen, M.Y.; Xie, M.Y. Extraction, chemical composition and antioxidant activity of flavonoids from Cyclocarya paliurus (Batal.) Iljinskaja leaves. Food Chem. 2015, 186, 97–105. [Google Scholar] [CrossRef]
  50. Manzione, M.G.; Martorell, M.; Sharopov, F.; Ganesh, N.; Venkatesh, N.; Kumar, A.; Valere, P.; Fokou, T.; Pezzani, R. Phytochemical and pharmacological properties of asperuloside, a systematic review. Eur. J. Pharmacol. 2020, 883, 173344. [Google Scholar] [CrossRef]
  51. Wang, Y.H. Traditional uses and pharmacologically active constituents of dendrobium plants for dermatological disorders: A review. Nat. Products Bioprospect. 2021, 11, 465–487. [Google Scholar] [CrossRef]
  52. Khan, K.; Firdous, S.; Ahmad, A.; Fayyaz, N.; Rasheed, M.; Faizi, S. GC-MS profile of antimicrobial and antioxidant fractions from Cordia rothii roots. Pharm. Biol. 2016, 54, 2597–2605. [Google Scholar] [CrossRef]
  53. Pieczykolan, A.; Pietrzak, W.; Gawlik-Dziki, U.; Nowak, R. Antioxidant, anti-inflammatory, and anti-diabetic activity of phenolic acids fractions obtained from Aerva lanata (L.) Juss. Molecules 2021, 26, 3486. [Google Scholar] [CrossRef]
Figure 1. Total phenolic content of leaf and twig ethanol extract in GAE (gallic acid equivalent) ppm.
Scipharm 91 00002 g001
Figure 2. The total flavonoid content of leaf and twig ethanol extract in QE (quercetin equivalent) ppm.
Scipharm 91 00002 g002
Figure 3. Ferric ion equivalent antioxidant activity (FeEAc) of leaf and twig ethanol extracts in ppm.
Scipharm 91 00002 g003
Figure 4. Percentage of free radical-scavenging capacities of leaf and twig ethanol extract in ppm measured in DPPH assay.
Scipharm 91 00002 g004
Figure 5. Percentage of α-glucosidase inhibition of leaf and twig ethanol extracts in ppm.
Scipharm 91 00002 g005
Figure 6. Gas Chromatography—Mass Spectrometry result of Artabotrys sumatranus twig extract.
Scipharm 91 00002 g006
Figure 7. Gas Chromatography—Mass Spectrometry result of Artabotrys sumatranus leaf extract.
Scipharm 91 00002 g007
Figure 8. Liquid Chromatography—Mass Spectrometry/Mass Spectrometry result of Artabotrys sumatranus leaf extract (BPI = Base Peak Intensity).
Scipharm 91 00002 g008
Figure 9. Liquid Chromatography—Mass Spectrometry/ Mass Spectrometry result of Artabotrys sumatranus twig extract (BPI = Base Peak Intensity).
Scipharm 91 00002 g009
Figure 10. Comparison between α-glucosidase inhibition and several measured quantities: total phenolic content, total flavonoid content, DPPH (2,2-diphenyl-1-picrylhydrazyl) inhibition, and FRAP (ferric reducing antioxidant power) stated in in ferric ion equivalent antioxidant activity, for leaf extract (a) and twig extract (b).
Scipharm 91 00002 g010
Figure 11. Comparison between DPPH (2,2-diphenyl-1-picrylhydrazyl) radical scavenging activity and several measured quantities: FRAP (ferric reducing antioxidant power), stated in in ferric ion equivalent antioxidant activity, α-glucosidase inhibition, total phenolic content, and total flavonoid content, for leaf extract (a) and twig extract (b).
Scipharm 91 00002 g011
Table 1. Identified compounds from GC-MS analysis of twig extract.
R/TCompoundFormulaMWPeak Area%
14.708Naphthalene decahydro-4a-methyl-1-methylene-7- (1-methylethenyl)-, [4aR-trans]C15H24204.48.8280
24.7659-O-Pivaloyl-N-acetylcolchinolC25H31NO6441.56.9491
29.075Anthracene, 9,10-dihydro-9,9,10-trimethylC17H18222.323.25
15.035ZonareneC15H24204.41.7401
13.183CopaeneC15H24204.41.598
13.787CaryophylleneC15H24204.40.915
26.592N-Methyl-1-adamantaneacetamideC13H21NO207.310.59
14.266Lavandulyl isobutyrateC15H24204.40.3354
Note: R/T = retention time, MW = molecular weight.
Table 2. Identified compounds from GC-MS analysis of leaf extract.
R/TCompoundFormulaMWPeak Area%
19.2957,9-Di-tert-butyl-1-oxaspiro(4,5)
deca-6,9-diene-2,8-dione
C17H24O3276.44.07
7.990D- LimoneneC10H16136.22.29
21.274OctacosaneC28H58394.81.09
17.014OctadecaneC18H38254.51.03
Note: R/T = retention time, MW = molecular weight.
Table 3. Identified compounds from LC-MS/MS analysis for leaf extract.
R/TCompoundFormulaObserved MWAdductResponse
2.68MangiferinC19H18O11423.09+H, +Na443421
3.23Kaempferol 7-O-α-L-rhamnosideC21H20O10433.11+H157434
12.91Stigmastan-3,6-dioneC29H48O2429.4+H108634
2.24NeomangiferinC25H28O16585.15+H, +Na100578
2.87AsperulosideC18H22O11437.1+Na88206
Note: R/T = retention time, MW = molecular weight.
Table 4. Identified compounds from LC-MS/MS analysis for twig extract.
R/TCompoundFormulaObserved MWAdductResponse
2.67MangiferinC19H18O11423.09+H, +Na374611
9.36Trichosanic acidC29H48O2279.23+H212382
2.21NeomangiferinC25H28O16585.15+H, +Na193055
12.91Stigmastan-3,6-dioneC29H48O2429.4+H162276
4.07MoupinamideC21H20O10433.11+H70497
Note: R/T = retention time, MW = molecular weight.
Table 5. Binding energy and inhibition constants values for ligand binding to α-glucosidase.
No.CompoundFree Binding Energy (kcal/mol) Inhibition   Constant   ( K i )
1Neomangiferin−16.271.18 pM
2Kaempferol-7-O-α-L-rhamnoside−12.86372.97 pM
3Asperuloside−12.39829.30 pM
4Mangiferin−12.231.08 nM
5Moupinamide−10.6116.65 nM
69-O-Pivaloyl-N-acetylcolchinol−10.0245.40 nM
7Stigmastan 3,6-dione−9.6584.60 nM
87,9-Di-tert-butyl-1-oxaspiro(4,5)
deca-6,9-diene-2,8-dione
−8.98262.18 nM
9Trichosanic acid−7.811.89 μM
10N-Methyl-1-adamantaneacetamide−7.672.40 μM
11Anthracene, 9,10-dihydro-9,9,10-trimethyl−7.622.59 μM
12Naphthalene decahydro-4a-methyl-1-methylene-7- (1-methylethenyl)-, [4aR-trans]−7.513.10 μM
13Copaene−7.344.18 μM
14Zonarene−7.155.78 μM
15(β-)Caryophyllene−7.006.12 μM
16Lavandulyl isobutyrate−6.6712.93 μM
17D limonene−5.7263.83 μM
18Octadecane−5.5388.13 μM
Disclaimer/Publisher’s Note: The statements, opinions and data contained in all publications are solely those of the individual author(s) and contributor(s) and not of MDPI and/or the editor(s). MDPI and/or the editor(s) disclaim responsibility for any injury to people or property resulting from any ideas, methods, instructions or products referred to in the content.

