Article

Antioxidant and Hepatoprotective Effect of Cajanus cajan in N-Nitrosodiethylamine-Induced Liver Damage

by
Emeka Eze Joshua Iweala
1,*,
Winifred Osa Evbakhavbokun
1 and
Emmanuel Ndubisi Maduagwu
2
1
Department of Biochemistry, Covenant University, Ota PMB 1023, Ogun State, Nigeria
2
Department of Biochemistry, Chrisland University, Abeokuta 110213, Ogun State, Nigeria
*
Author to whom correspondence should be addressed.
Sci. Pharm. 2019, 87(3), 24; https://doi.org/10.3390/scipharm87030024
Submission received: 6 May 2019 / Revised: 15 June 2019 / Accepted: 20 June 2019 / Published: 6 September 2019

Abstract

:
N-Nitrosodiethylamine (NDEA) is a nitrosamine derivative with carcinogenic and mutagenic properties which can be found in tobacco smoke, meat and various food products. This study examined the antioxidant and hepatoprotective potential of Cajanus cajan (C. cajan) with respect to hepatotoxicity in male Wistar rats. Administration of NDEA induced hepatotoxicity at 200 mg/kg while C. cajan was administered (200, 400 and 800 mg/kg) for 28 days. NDEA-induced hepatotoxicity significantly (p ≤ 0.05) increased alanine aminotransferase (ALT), aspartate aminotransferase (AST) and malondialdehyde (MDA) and significantly (p ≤ 0.05) decreased reduced glutathione (GSH), albumin (ALB), glutathione S-transferase (GST), catalase (CAT) and superoxide dismutase (SOD). C. cajan-treated groups were seen to have significantly (p ≤ 0.05) decreased ALT and AST and significantly (p < 0.05) increased ALB, GST, GSH, SOD and CAT. The NDEA-treated group also showed a marginal increase in body weight and a significant (p ≤ 0.05) increase in liver weight. The C. cajan treated groups showed a significant (p ≤ 0.05) increase and decrease respectively in body and liver weights. Histopathological changes also substantiated NDEA-induced hepatotoxicity and the hepatoprotective effect of C. cajan on the liver. The results indicate that C. cajan has the potential to ameliorate NDEA-induced hepatotoxicity.

1. Introduction

N-Nitrosodiethylamine (NDEA), a nitrosamine compound is a popular hepatotoxin and carcinogen causing liver damage [1]. They can be found in industrial processes, foodstuffs such as meat and milk, pharmaceuticals and tobacco smoke [2]. Elevated concentrations of NDEA ranging from 4.8 µg/kg are present in corn bread and 10–20 µg/kg in sausages, seafood and cheese [3]. NDEA leads to cellular injury and oxidative stress, which is a condition caused by generation of reactive oxygen species (ROS) and imbalance in the ratio of antioxidants to free radicals [4]. ROS are toxic byproducts of cellular metabolism which affects the growth and development of the cell and its ability to survive. Free radicals produced by Cytochrome P-450 monooxidase system augment oxidative stress by the generation of superoxide anions and H2O2 [5]. NDEA leads to fibrosis and tumors in the liver of rats through the activation of Cytochrome P-450 enzymes [6]. Liver being the major site for metabolic biotransformation of NDEA, generation of ROS can lead to oxidative stress, causing damage to the liver [7]. These ethyl radicals and other reactive radicals interact with DNA which leads to mutations, increase in blood markers such as AST and ALT, decrease in oxidative stress markers such as GST, CAT, SOD, MDA and GSH and also lead to neoplastic transformation in tissues of the liver [8,9]. Therefore, to maintain cellular integrity, it is important to have an efficient chemical or ROS scavenger system to target the free radicals and xenobiotic-metabolizing enzymes. Various animal studies proved that increased intake of plant products with high antioxidant properties are linked to decrease in the development of liver diseases and different types of cancers [10].
Cajanus cajan (L.) Millsp is a member of the family Leguminosae which is commonly known as ‘Pigeon pea’ or ‘Congo pea’. Chemical constituents and antioxidant activities have shown C. cajan leaves to be high in flavonoids, stibenes, saponins and alkaloids [11]. Genistin and Genistein isoflavonoids gotten from the roots have antioxidant property [12]. Cajanol which is an isoflovanone has anticancer activity [13]. Four essential compounds which include orientin, vitexin, cajaninstilbene acid and pinostrobin gotten from the leaves have antioxidant properties (13). Studies have shown the hepatoprotective potential of methanol extract of C. cajan on CCl4 induced hepatotoxicity [14]. The aim of this present work was to examine the hepatoprotective activity of ethanol extract of C. cajan leaf against NDEA-induced hepatotoxicity so in future an efficient formulation could be produced or developed which will be specific for imparting hepatoprotection.

2. Materials and Methods

2.1. Chemicals

N-Nitrosodiethylamine was obtained from Sigma chemical company, USA. The drug, Silymarin was purchased from Micro Labs and other chemicals/reagents were of analytical grade, supplied by Merck (India).

2.2. Animals

Apparently healthy male albino Wistar rats (n = 35) weighing 150–200 g body weight were bought from the Institute of Advanced Medical Research and Training (IAMRAT) Animal House, University College Hospital (UCH), Ibadan, Oyo State, Nigeria and then housed in cages and fed ad libitum with rat chows and distilled water under a 12 h light/dark cycle at room temperature. All experimental procedures were approved by Covenant University Health Research Ethics Committee (CHREC/015/2019).

2.3. Collection and Preparation of Plant Extract

The leaves of C. cajan were obtained in June, 2018 from a market in Sango, Ogun State, Nigeria and properly identified and authenticated by a qualified taxonomist. They were plucked from their branches, washed and air dried at room temperature (26 °C) for four weeks. The air-dried leaves of C. cajan was pulverized using electric blender which yielded 349.1 g and was soaked in 80% ethanol (600 g) for 72 h in two successive extractions. It was then sieved out using muslin cloth and cotton wool. The extract was concentrated using Rotary evaporator at 50 °C and water bath at 40 °C to obtain a yield of 32 g semi-solid crude substance.

2.4. Experimental Design

Albino Wistar rats were used due to their genetic characteristics with man. Male albino Wistar rats (thirty five) were separated randomly into seven groups consisting of five animals each in different cages. Rats were acclimatized for two weeks. Group A served as the control and received no treatment. Group B was the negative control and was given intraperitoneal injection (i.p.) of only NDEA mixed in saline at 200 mg/kg. The dose of NDEA was chosen on the basis of previous studies where a dose of 200 mg/kg weight was shown to initiate hepatotoxicity, carcinogenicity and produced necrosis in the liver of experimental animals [15]. Group C, D and E were given i.p. of NDEA at 200 mg/kg followed by oral intubation of C. cajan extract at doses of 200, 400 and 800 mg/kg respectively, Group F was the positive control and received i.p of NDEA followed with a standard drug, Silymarin at 50 mg/kg, Group G was given by oral intubation of C. cajan extract at 800 mg/kg only. The experiment lasted for 28 days.

2.5. Measurement of Body Weight

The initial body weights of the rats were weighed on the first day of the experiment and the final body weights were measured on the day of sacrifice using a weighing balance and the unit expressed in grams (g).

2.6. Collection of Blood and Liver Tissue

Blood obtained from the animals through cardiac puncture was put into heparinized tubes and spun at 3500 rpm for 15 min to obtain the plasma used for biochemical analyses [16]. The liver was quickly excised, washed in cold saline and then separated into two pieces; one piece was stored in 10% buffered formalin solution at room temperature for histopathological studies and the second was preserved at −30 °C for oxidative stress and antioxidant analysis.

2.7. Measurement of Liver Weight

After sacrificing the rats, their livers were excised and weighed using a weighing balance and the unit expressed in grams (g).

2.8. Preparation of Liver Homogenate

Liver homogenate was prepared by a standard method [17]. After weighing, the liver (1 g) was minced and suspended in cold phosphate buffer (pH 7.4) that contained 0.024 M EDTA and then homogenized on ice. The homogenate obtained was centrifuged for ten minutes at 7000 rpm and the supernatant used for determination of SOD, CAT, MDA, GST and GSH.

2.9. Measurement of ALT and AST Activity

AST and ALT were measured using commercial Randox diagnostic kits according to the instructions of the manufacturer. A spectrophotometer was used for measuring the absorbance at 546 nm and unit expressed in U/L. For AST, 0.5 mL of reagent 1 containing (100 mmol/L of phosphate buffer, 100 mmol/L of L-aspartate and 2 mmol/L of α-oxoglutarate) and 0.1 mL of distilled water was pipetted into the reagent blank test tube while 0.1 mL of the sample and 0.5 mL of the reagent 1 was pipetted into the sample test tube. The mixtures were incubated for 30 min at 37 °C. Then, 0.5 mL of reagent 2 containing (2 mmol/L of 2,4-dinitrophenylhydrazine) was added to the reagent blank and sample test tubes and allowed to stand for 20 min at 20–25 °C. 5.0 mL of sodium hydroxide was then added to both tubes and absorbance of sample against reagent blank was read after 5 min. For ALT, 0.5 mL of solution R1 containing (100 mmol/L of phosphate buffer, 200 mmol/L of L-alanine and 2.0 mmol of α -oxoglutarate) and 0.1 mL of distilled water was pipetted into the reagent blank tube while 0.1 mL of the sample and 0.5 mL of solution R1 was pipetted into sample tube. The mixtures were incubated for 30 min at 37 °C. Then, 0.5 mL of solution R2 containing (2.0 mmol/L of 2, 4-diitrophenylhydrazine) was added and allowed to stand for 20 min at 20–25 °C. 5.0 mL of sodium hydroxide was then added to both tubes. Absorbance of the sample against the reagent blank was read after 5 min.

2.10. Measurement of Albumin (ALB)

Albumin was measured using commercial Randox diagnostic kits according to the instructions of the manufacturer. Absorbance at 578 nm was measured using a spectrophotometer and the unit expressed in g/dL.

2.11. Measurement of Reduced Glutathione (GSH)

Measurement of GSH was carried out as described by [18]. 250 µL of liver homogenate was put into 2000 µL of 0.08N H2SO4 in a tube and carefully mixed. After ten minutes at room temperature, 250 µL tungstate solutions (300 mM of sodium tungstate and 100 mM EDTA) were added to precipitate the protein. The tube was stoppered and the mixture was shaken for five minutes. The stopper was removed and the suspension kept for some minutes to prevent formation of crust. The suspension was centrifuged at 860× g for twenty minutes. 1000 µL of the clear extract was then pipetted into 1250 µL of 100 mM Tris buffer (pH 8.0) and 100 µL of DNTB (5, 5dithiobis-2-nitrobenzoic acid) reagent was added. The blank was prepared using 1000 µL water rather than liver homogenate. After 30–60 s, there was a color development and the optical density using a spectrophotometer was read at 412 nm.

2.12. Measurement of Glutathione S-Transferase (GST) Activity

GST activity was assayed according to a standard method [19]. 500 µL of liver homogenate was centrifuged for 3 min at 3000 rpm and then 250 µL of supernatant was taken and diluted 1:200 with distilled water. The sample tube contained 50 µL of homogenate, 25 µL of 10 mM GSH, 25 µL of 10 mM CDNB (1-Chloro-2,6-dinitrobenzene), 100 µL of 100mM phosphate buffer (pH 6.5) while the blank tube contained 25 µL of 10 mM GSH, 25 µL of 10 mM CDNB (1-Chloro-2,6-dinitrobenzene), 100 µL of 100mM phosphate buffer (pH 6.5) and 300 µL of HCl. Then, all tubes were incubated for 1 h at 30 °C. Incubation was followed by addition of 300 µL HCl to the sample. The absorbance was read at 340 nm for each sample against its blank.

2.13. Measurement of Superoxide Dismutase (SOD) Activity

SOD activity was measured using a standard procedure [20]. The spectrophotometer was adjusted to read zero using Tris-EDTA buffer. Control and sample test tubes were prepared. Control test tubes contained 500 µL of Tris-buffer, 25 µL distilled water and 500 µL of pyrogallol while sample test tubes contained 25 µL of homogenate, 500 µL of Tris-buffer and 500 µL of pyrogallol. The absorbance was read at 420 nm against Tris-EDTA buffer at zero time and after one minute of the addition of pyrogallol.

2.14. Measurement of Catalase (CAT) Activity

CAT activity was measured according to a standard procedure [21]. 250 µL of 50mM phosphate buffer (pH 7.0), 50 µL of homogenate and 200 µL distilled water were mixed and incubated for two minutes at 37 °C. The mixture was poured into a quartz cuvette. The reaction began by adding 250 µL of 30mM hydrogen peroxide to the cuvette. Sample absorbance was read against distilled water quickly at zero time (A1) and read again 240 nm after thirty seconds (A2).

2.15. Measurement of Malondialdehyde (MDA)

The procedure of [22] was used to measure MDA. 250 µL of liver homogenate was mixed with 500 µL stock solution (Stock solution was done by dissolving of 15% (weight/volume) Trichloracetic acid and 0.375% (Weight/Volume) Thiobarbituric acid and 0.25 mol/L HCl in 25 mL of distilled water). The mixture was heated in a water bath and kept for thirty minutes and after cooling, centrifugation for fifteen minutes at 2000 rpm was done and the clear supernatant was taken. For blank preparation, 500 µL concentrated HCl was made up to 1000 µL with distilled water. 250 µL of this reagent was then added to 500 µL of the stock. Absorbance at 535 nm was read against blank.

2.16. Histological Studies

Histological sections were prepared from paraffin blocks and stained with haematoxylin and eosin (H & E) to examine changes in the morphology of the cells [23].

2.17. Statistical Analysis

SPSS (Version 25) was used for all statistical analyses. Statistical significance was determined at p ≤ 0.05. Data was expressed as mean ± standard error of mean (SEM).

3. Results

3.1. Effect of Cajanus cajan on Body and Liver Weight

Table 1 shows the initial body weight, final body weight, liver weight and relative liver weight (liver/100 g body weight) of control and experimental groups of animals. The NDEA-treated group showed a significant decrease in final body weight and a significant (p ≤ 0.05) increase in liver weight in comparison to the control group. In the C. cajan treated and Silymarin groups, there were significant (p ≤ 0.05) increases in final body weight and significant (p ≤ 0.05) decreases in liver weight when compared to NDEA-treated group.

3.2. Effect of Cajanus cajan on Plasma AST and ALT

NDEA induction significantly (p ≤ 0.05) increased AST and ALT when compared to the control group (Table 2). C. cajan treated groups were seen to significantly (p ≤ 0.05) reduce ALT and AST to near normal levels when compared to the NDEA-treated group. This reduction was comparable with Silymarin.

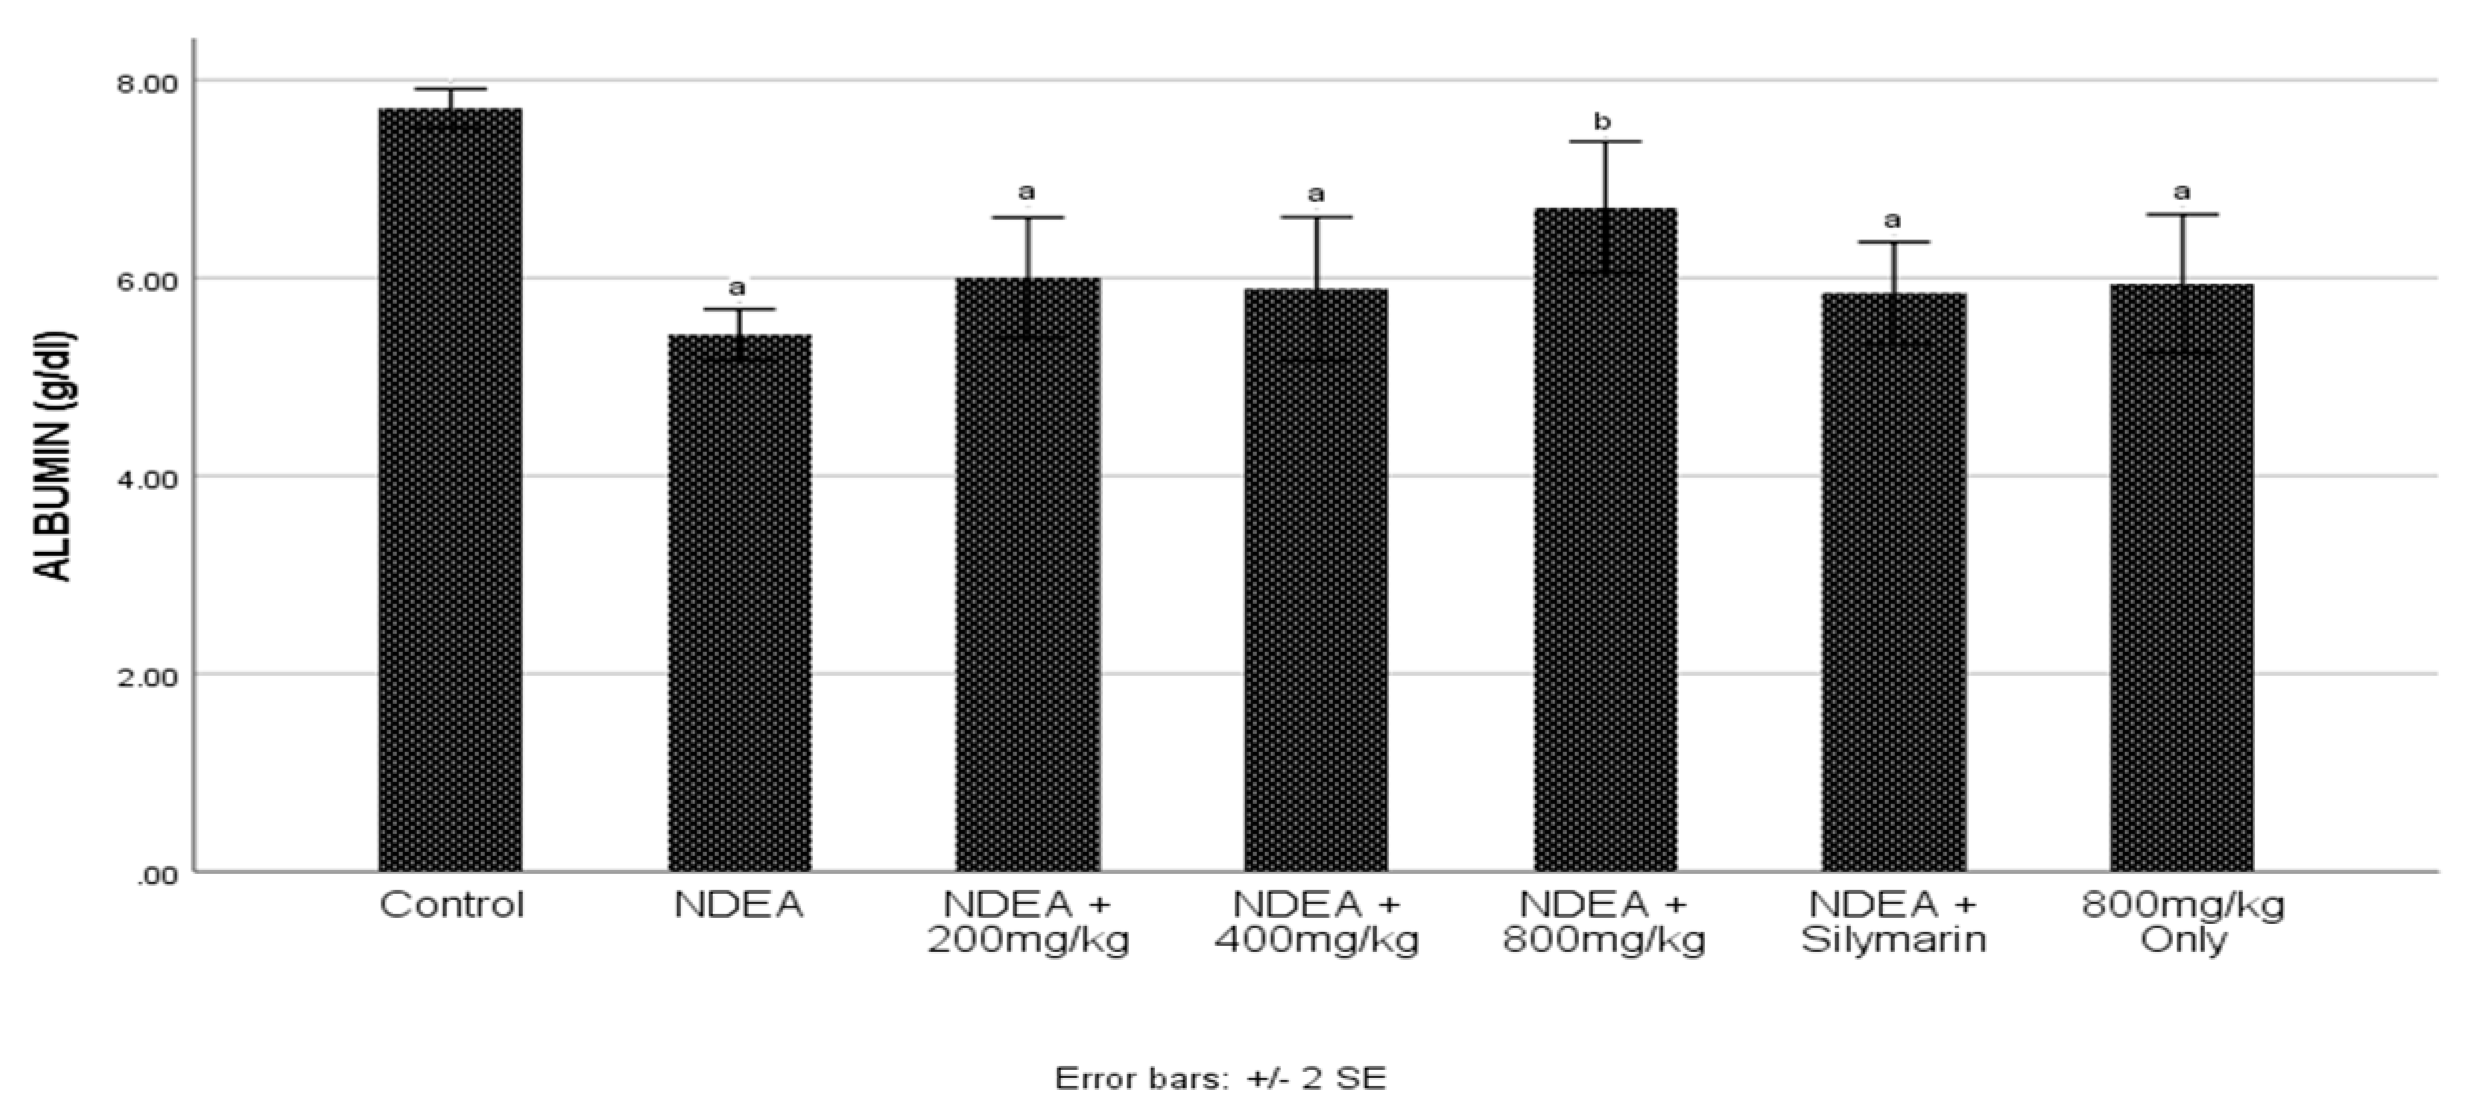
3.3. Effect of Cajanus cajan on Plasma Albumin

The NDEA-treated group had a significantly (p ≤ 0.05) reduced albumin when compared to control group (Figure 1). There was significantly (p ≤ 0.05) increased albumin in C. cajan treated and Silymarin group with 800 mg/kg being the highest when compared to the NDEA-treated group.

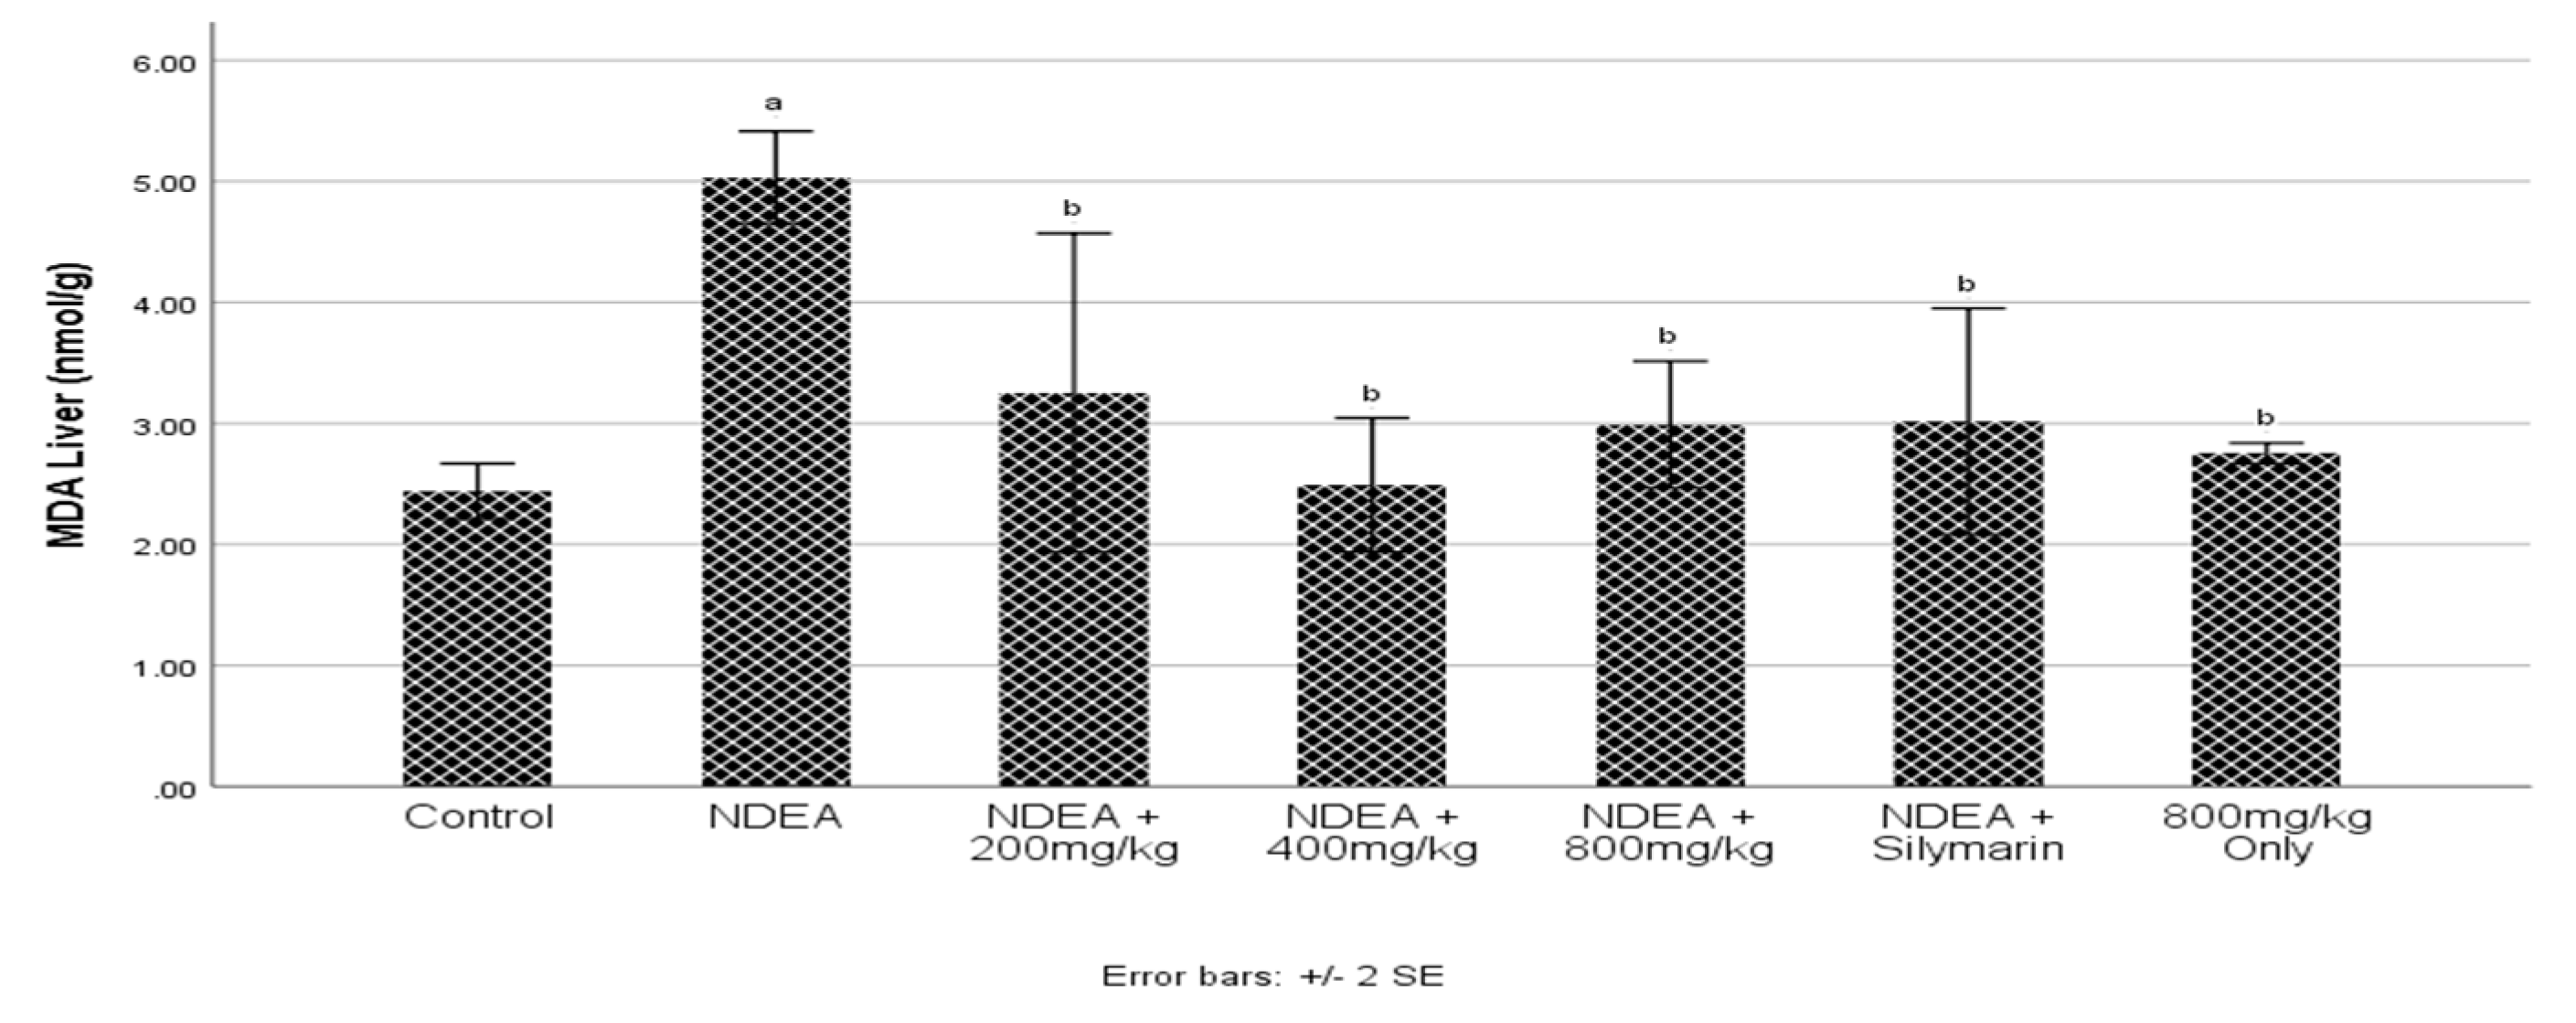
3.4. Effect of Cajanus cajan on Malondialdehyde (MDA)

Administration of NDEA significantly (p ≤ 0.05) increased MDA in the NDEA-treated group when compared to control group (Figure 2). Groups treated with C. cajan significantly (p ≤ 0.05) reduced MDA to near normal levels. Restoration of MDA was seen at dose 400 mg/kg when compared to the NDEA-treated group.

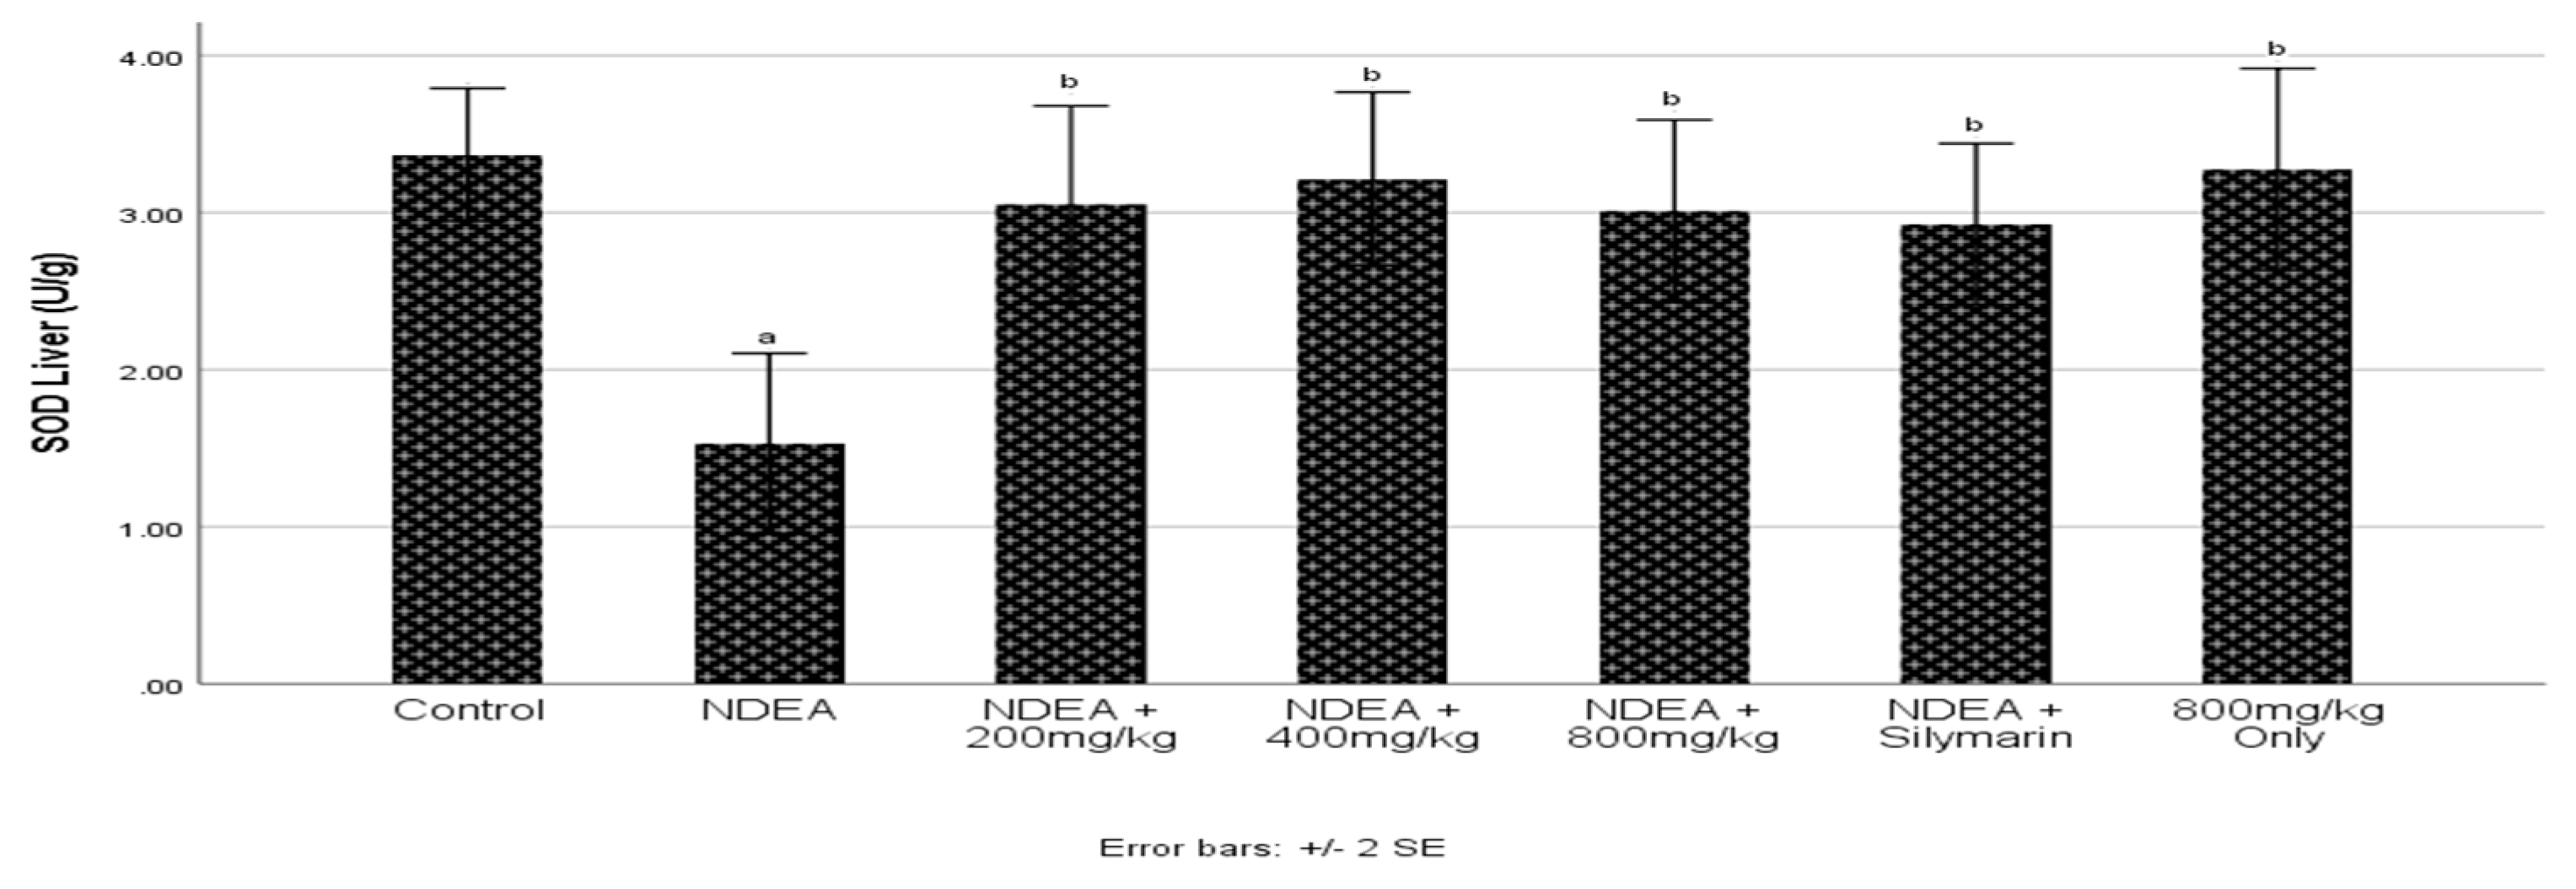
3.5. Effect of Cajanus cajan on Superoxide Dismutase (SOD) Activity

NDEA induction significantly (p ≤ 0.05) decreased SOD activity when compared to control group (Figure 3). Treatments with C. cajan and Silymarin significantly (p ≤ 0.05) increased SOD activity when compared to the NDEA-treated group.

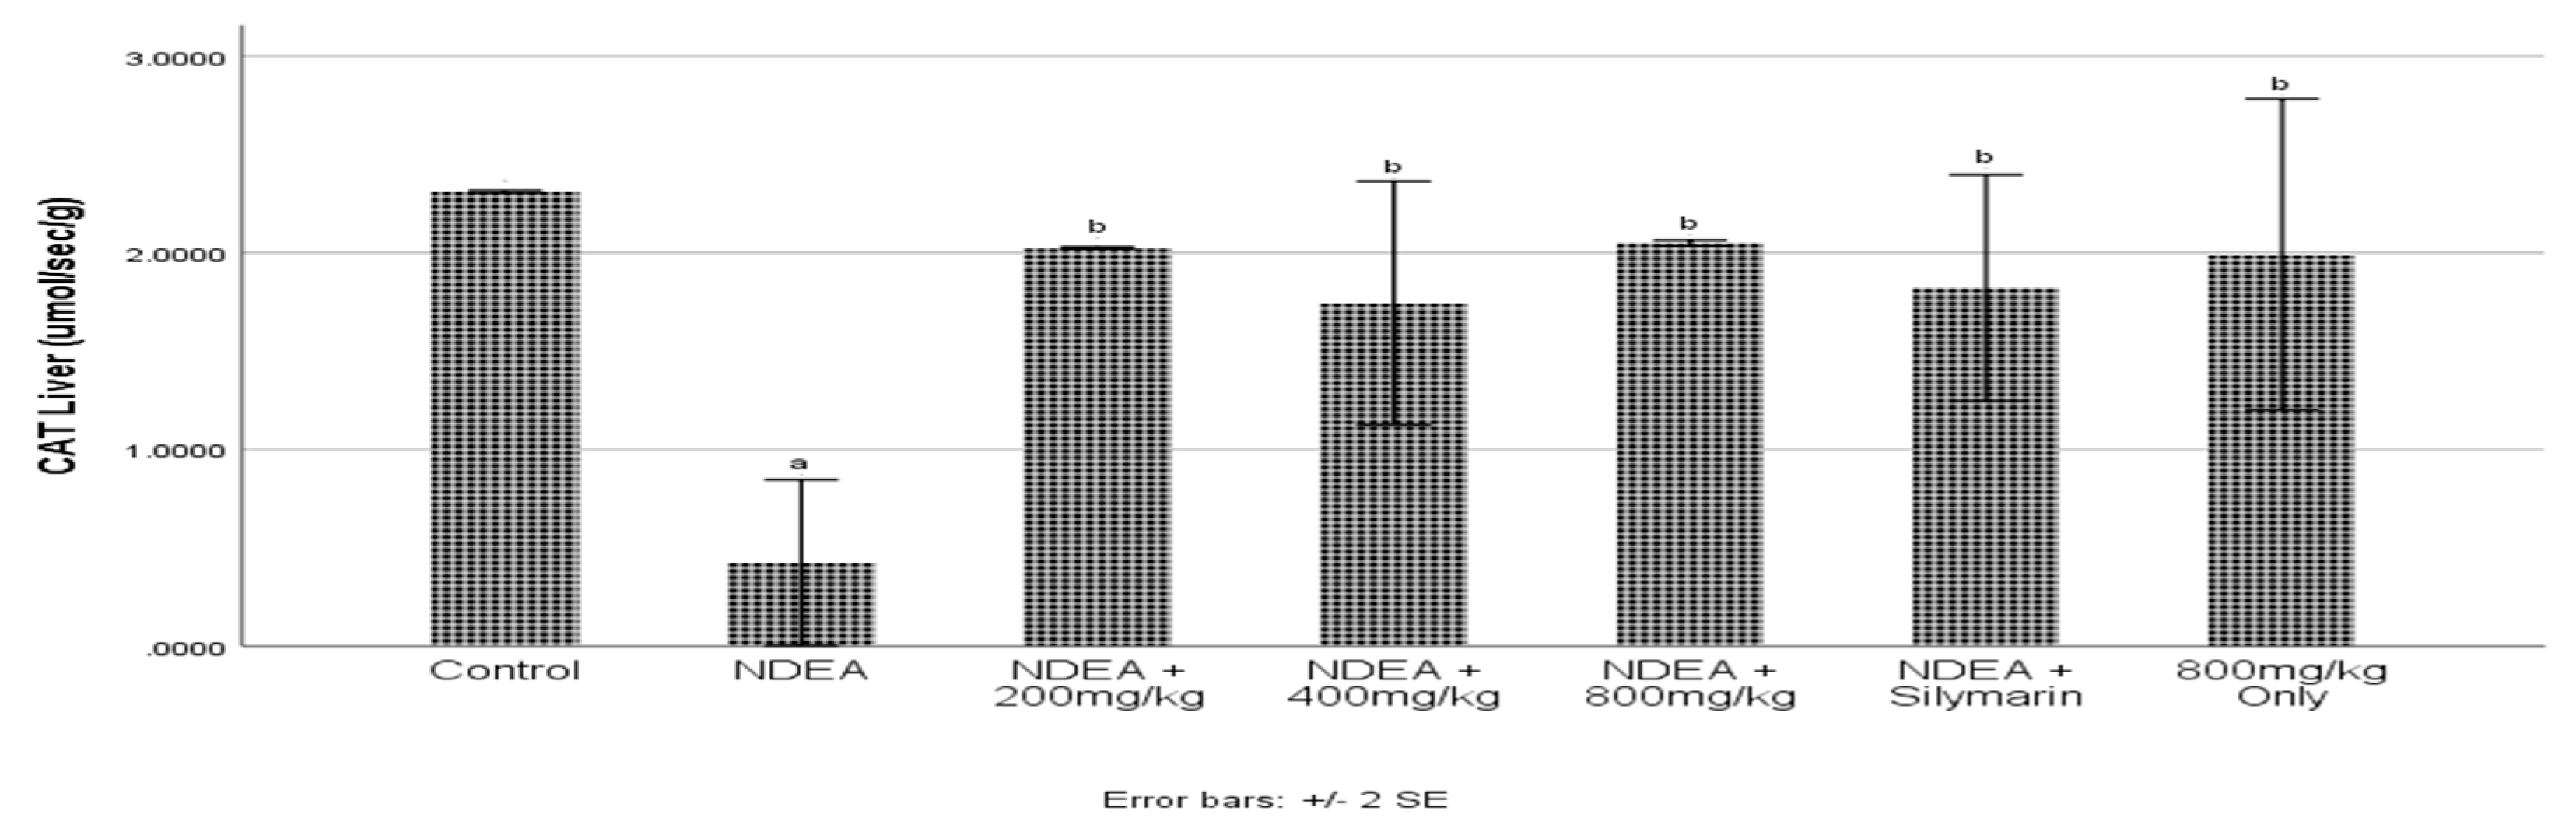
3.6. Effect of Cajanus cajan on Catalase Activity

NDEA significantly (p ≤ 0.05) decreased CAT activity when compared to the control group (Figure 4). Cajanus cajan treated and Silymarin group significantly (p ≤ 0.05) increased CAT activity. 800 mg/kg Cajanus cajan treated group being the highest was seen to cause a significant increase when compared to NDEA-treated group.

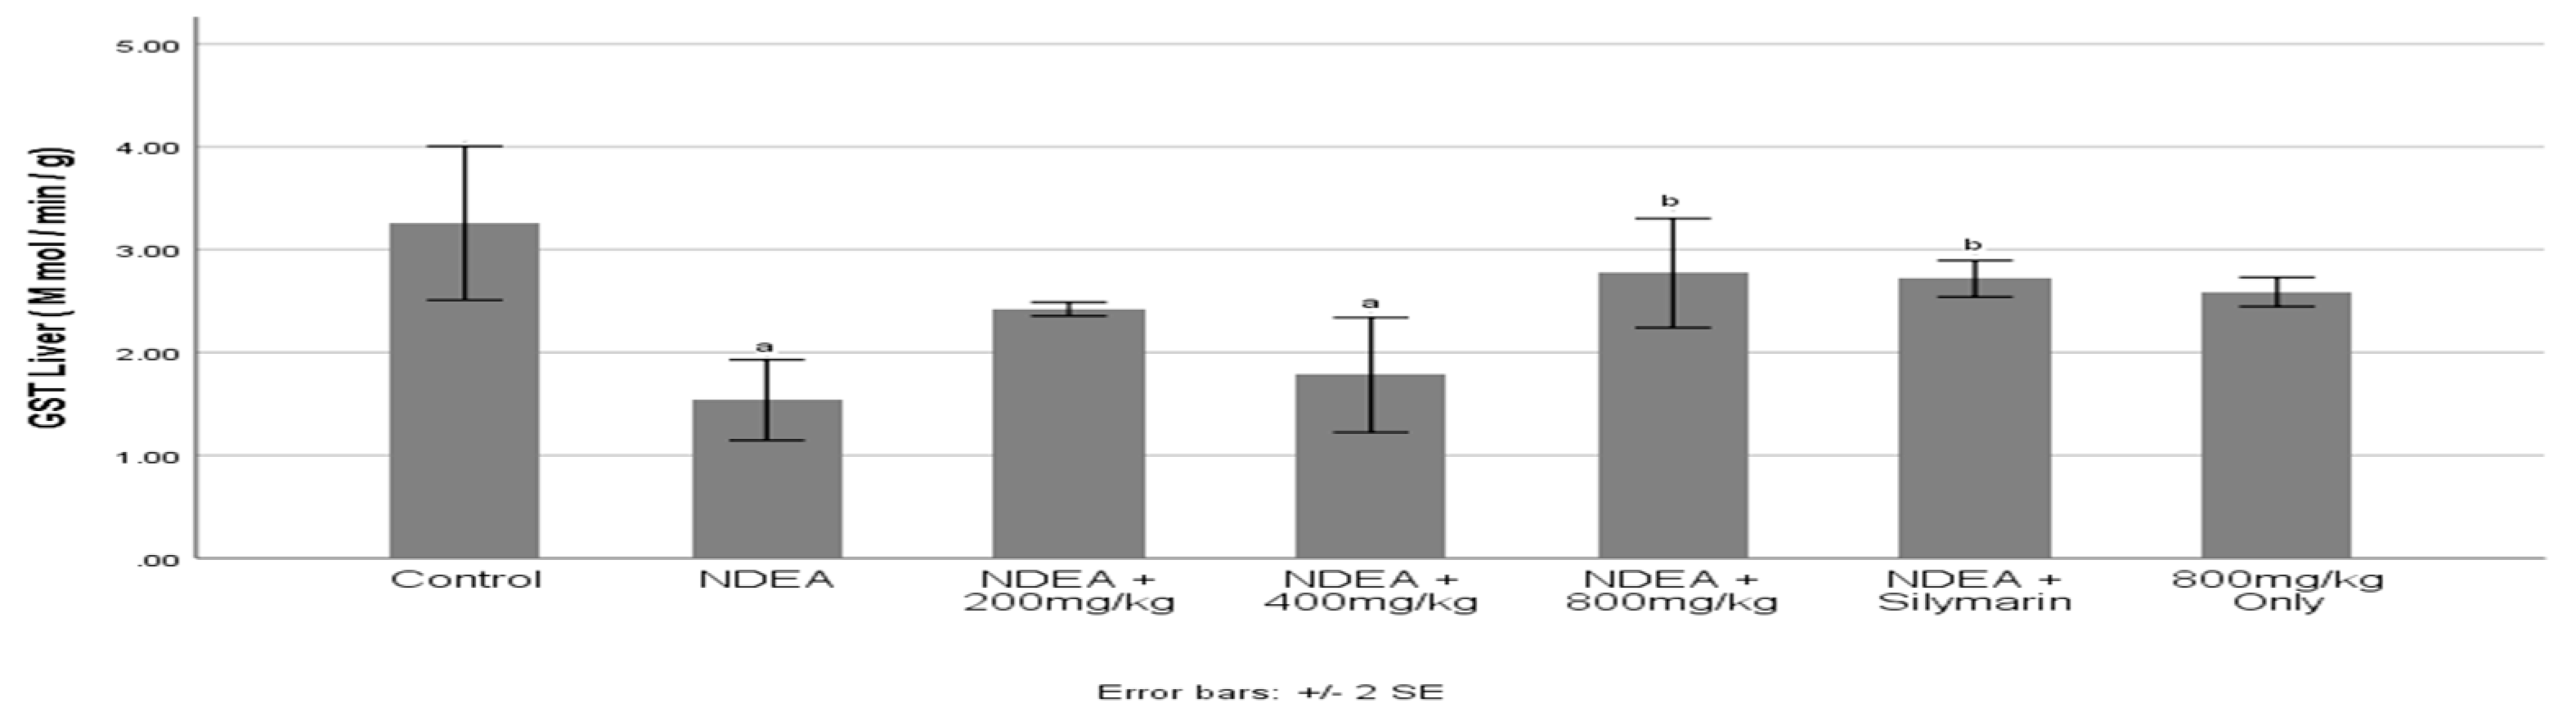
3.7. Effect of Cajanus cajan on Glutathione S-Transferase (GST) activity

NDEA induction significantly (p ≤ 0.05) decreased GST activity when compared to the control group (Figure 5). Treatment with C. cajan and Silymarin significantly (p ≤ 0.05) increased GST activity. 800 mg/kg Cajanus cajan treated group being the highest was seen to cause a significant increase when compared to the NDEA-treated group.

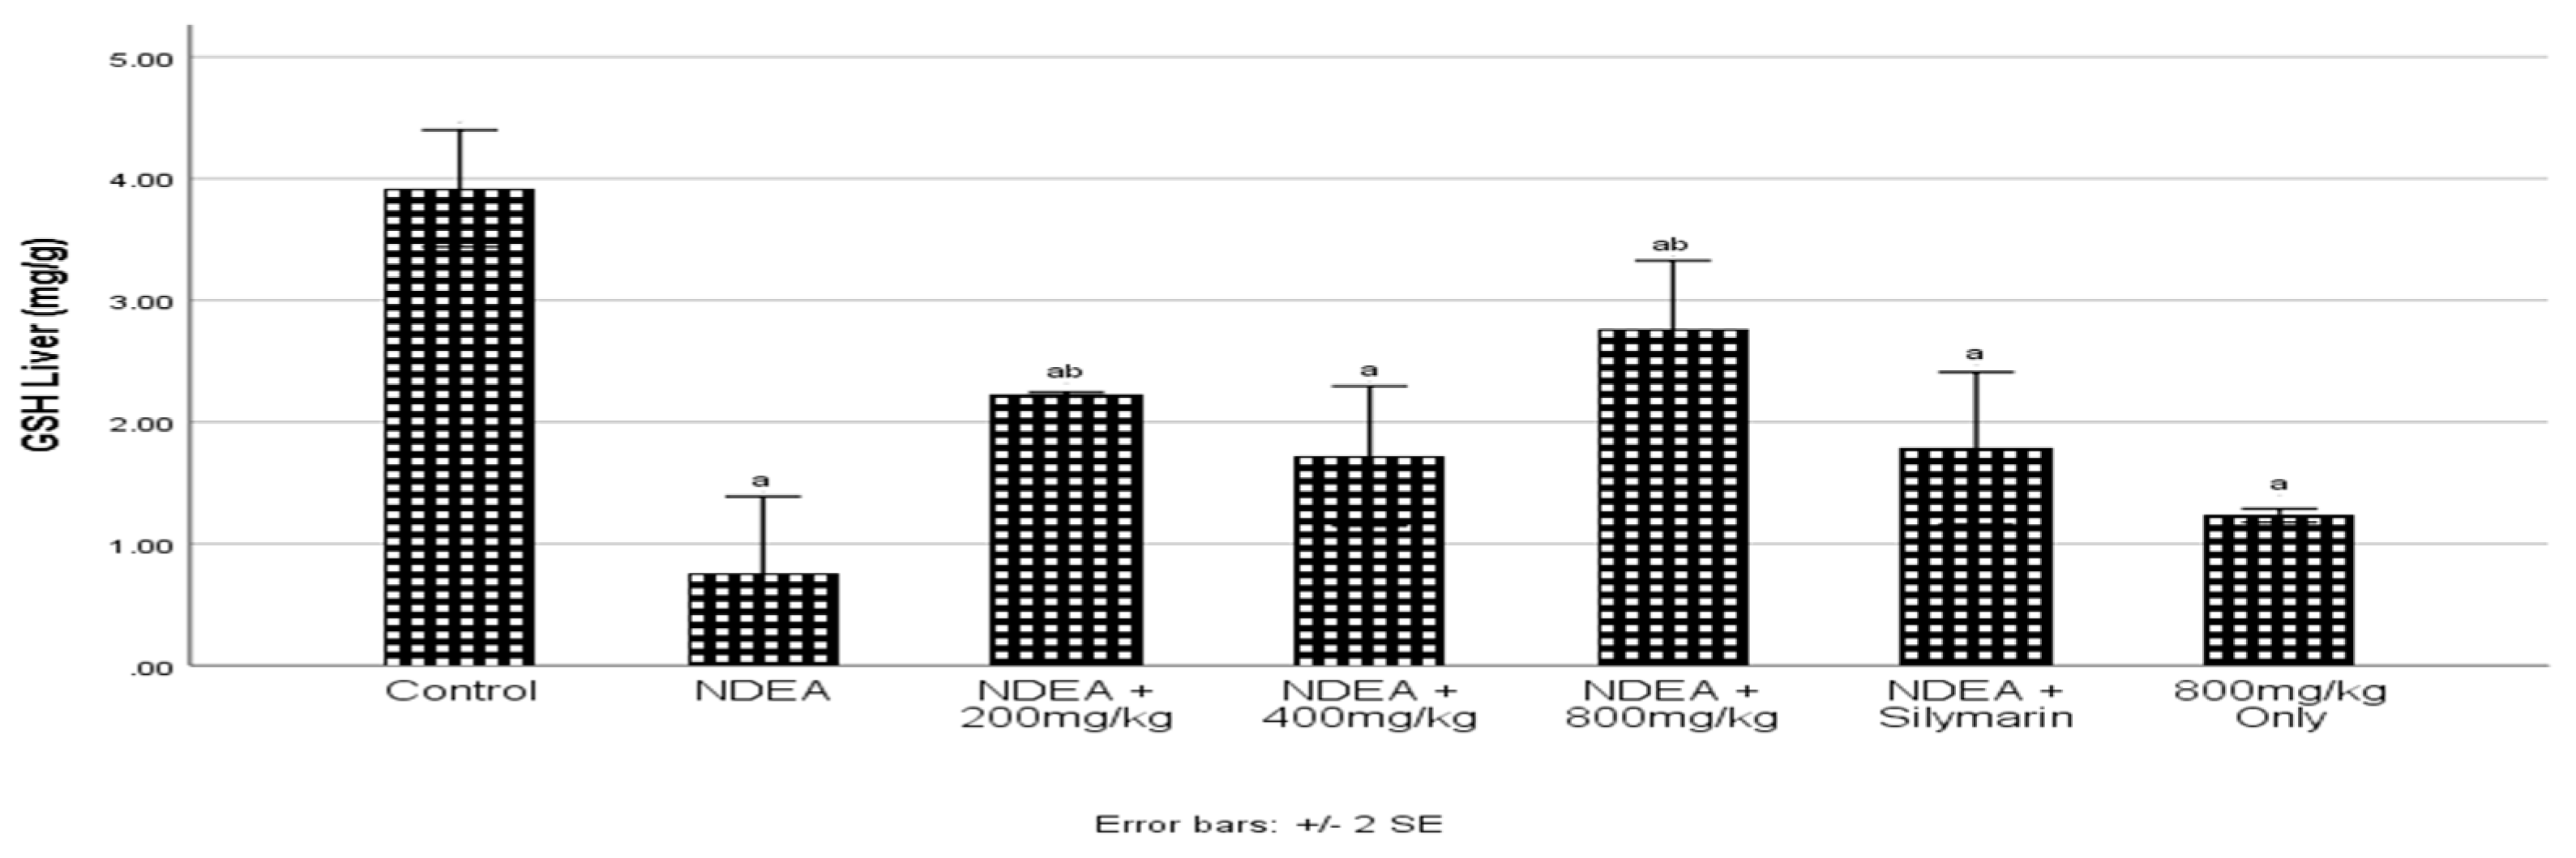
3.8. Effect of Cajanus cajan on Reduced Glutathione (GSH)

A significant (p ≤ 0.05) decrease of GSH was seen in the NDEA-treated group when compared to the control group (Figure 6). Treatment with Cajanus cajan significantly (p ≤ 0.05) increased GSH in all the groups. 800 mg/kg Cajanus cajan treated group being the highest was seen to cause a significant increase when compared to the NDEA-treated and control group. In the Silymarin group, which was used as a positive group, significant difference was seen when compared to the control group.

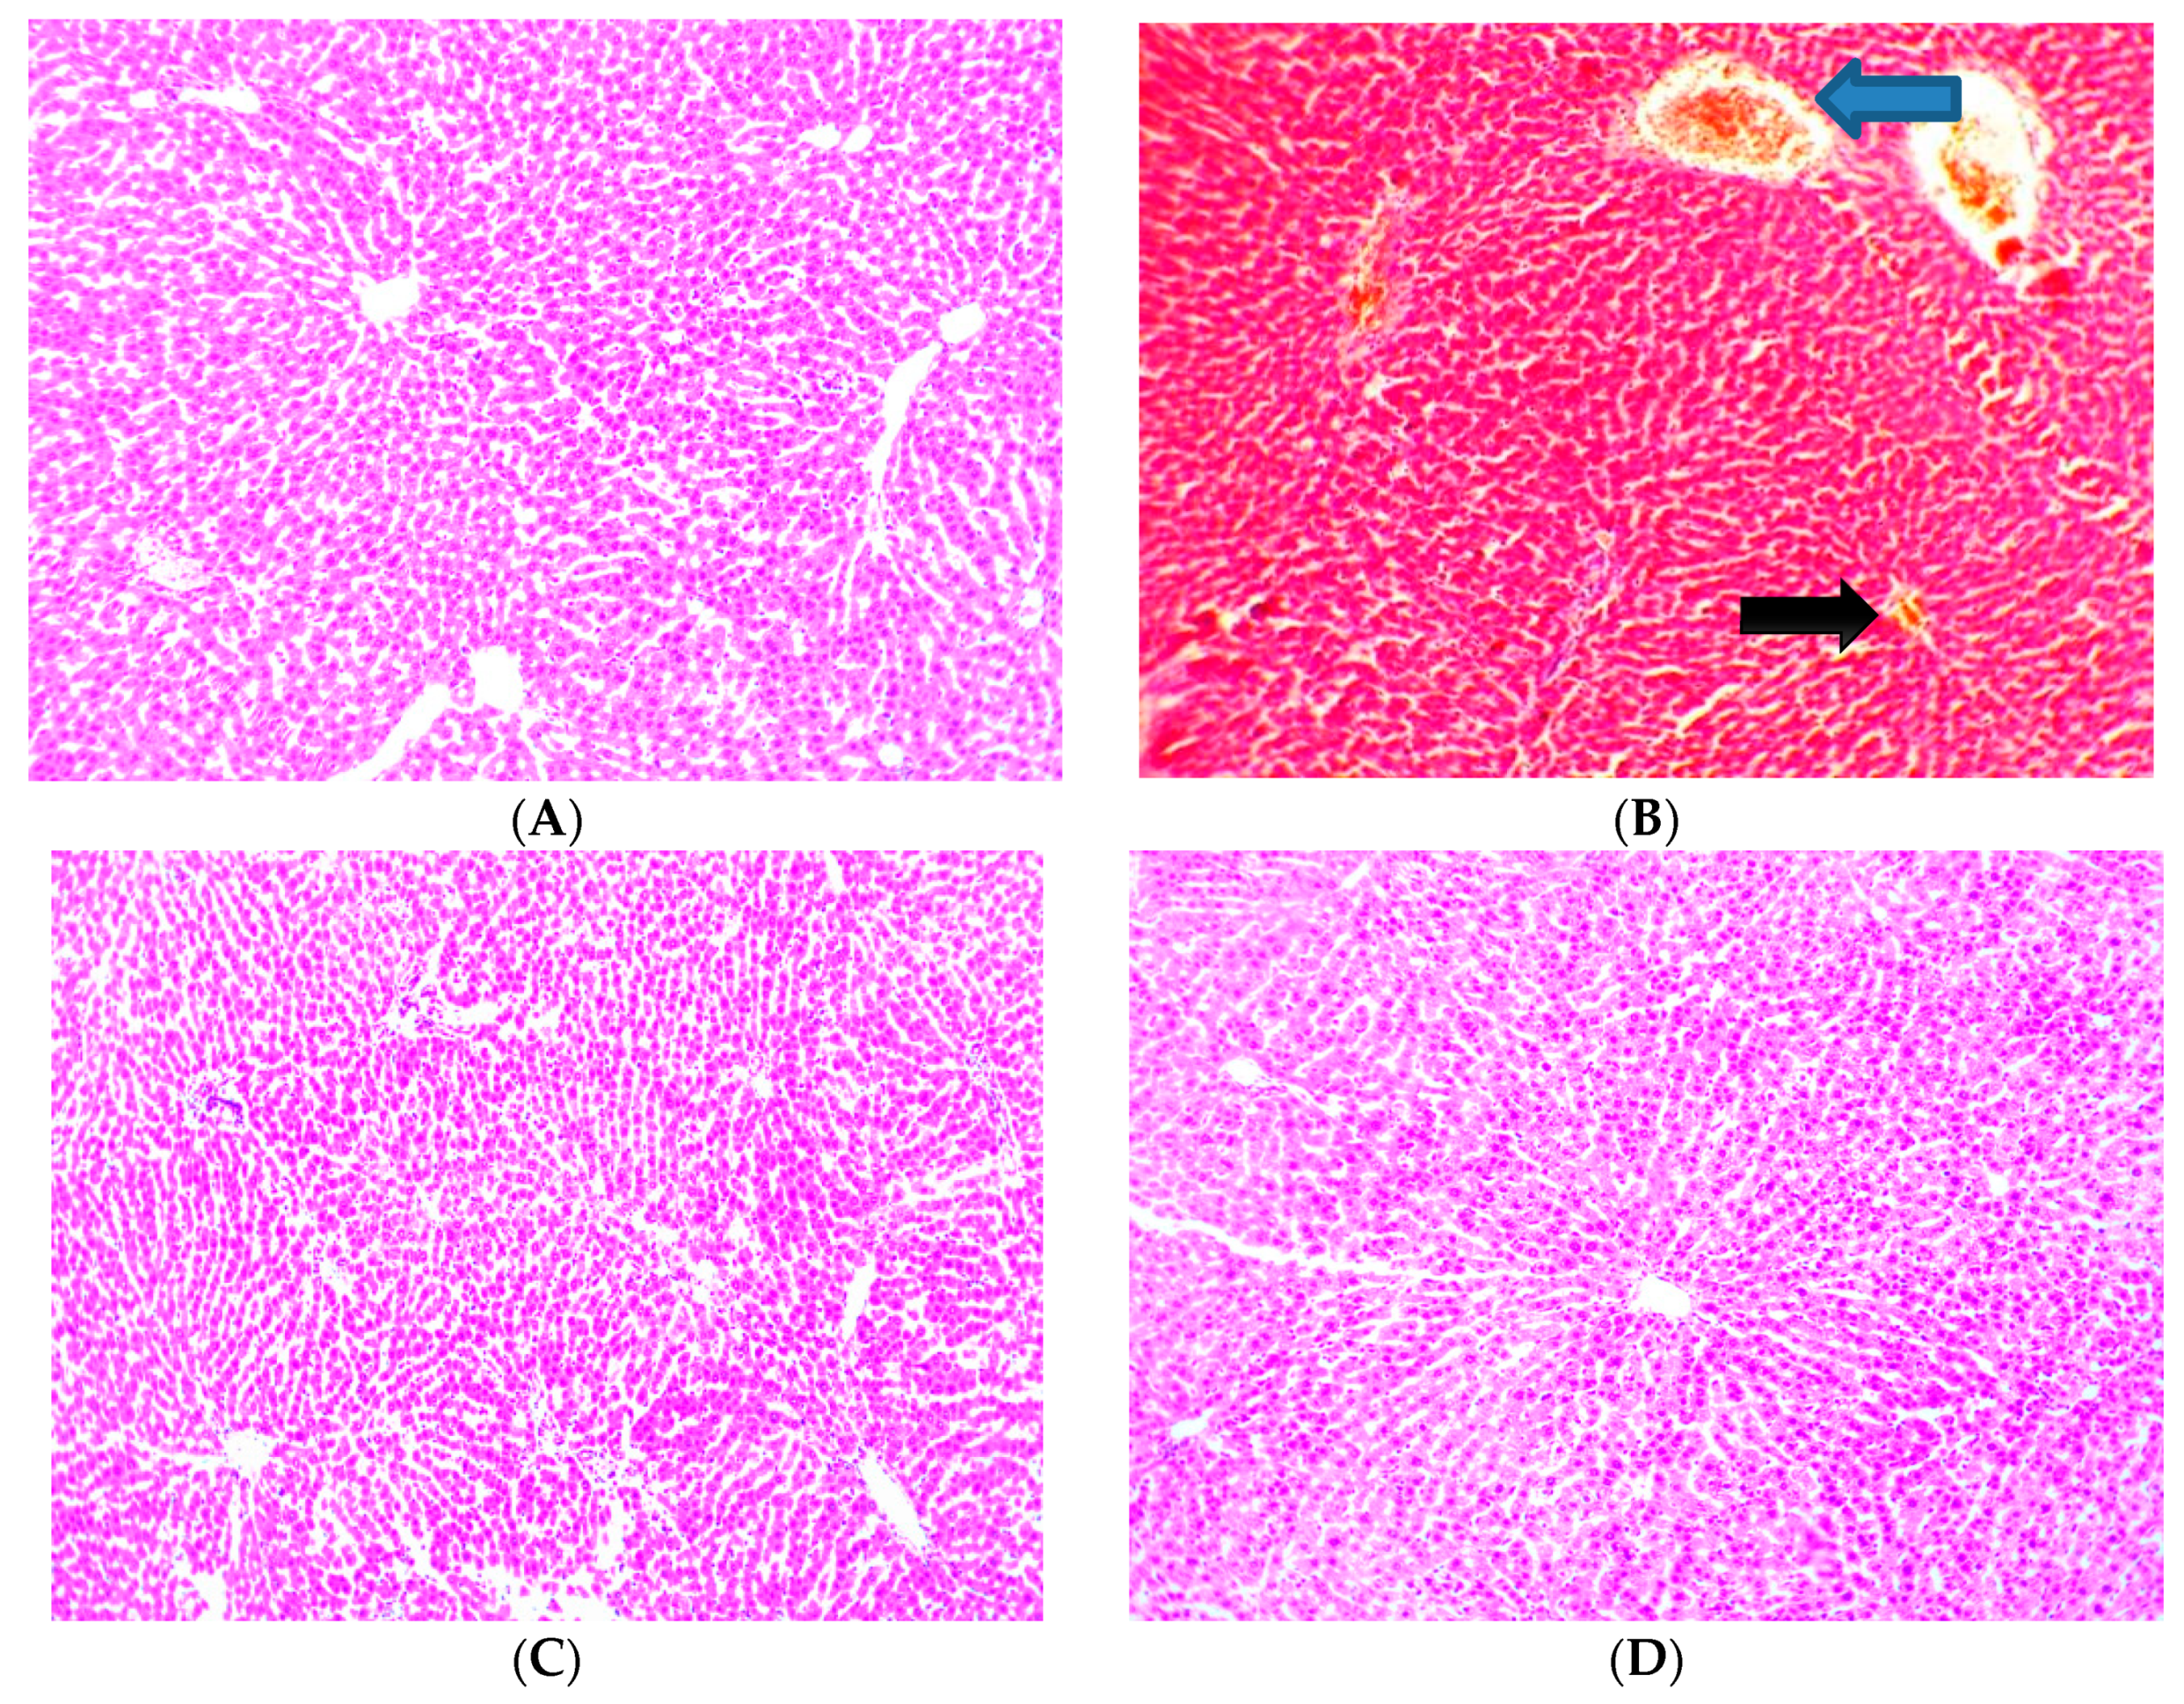
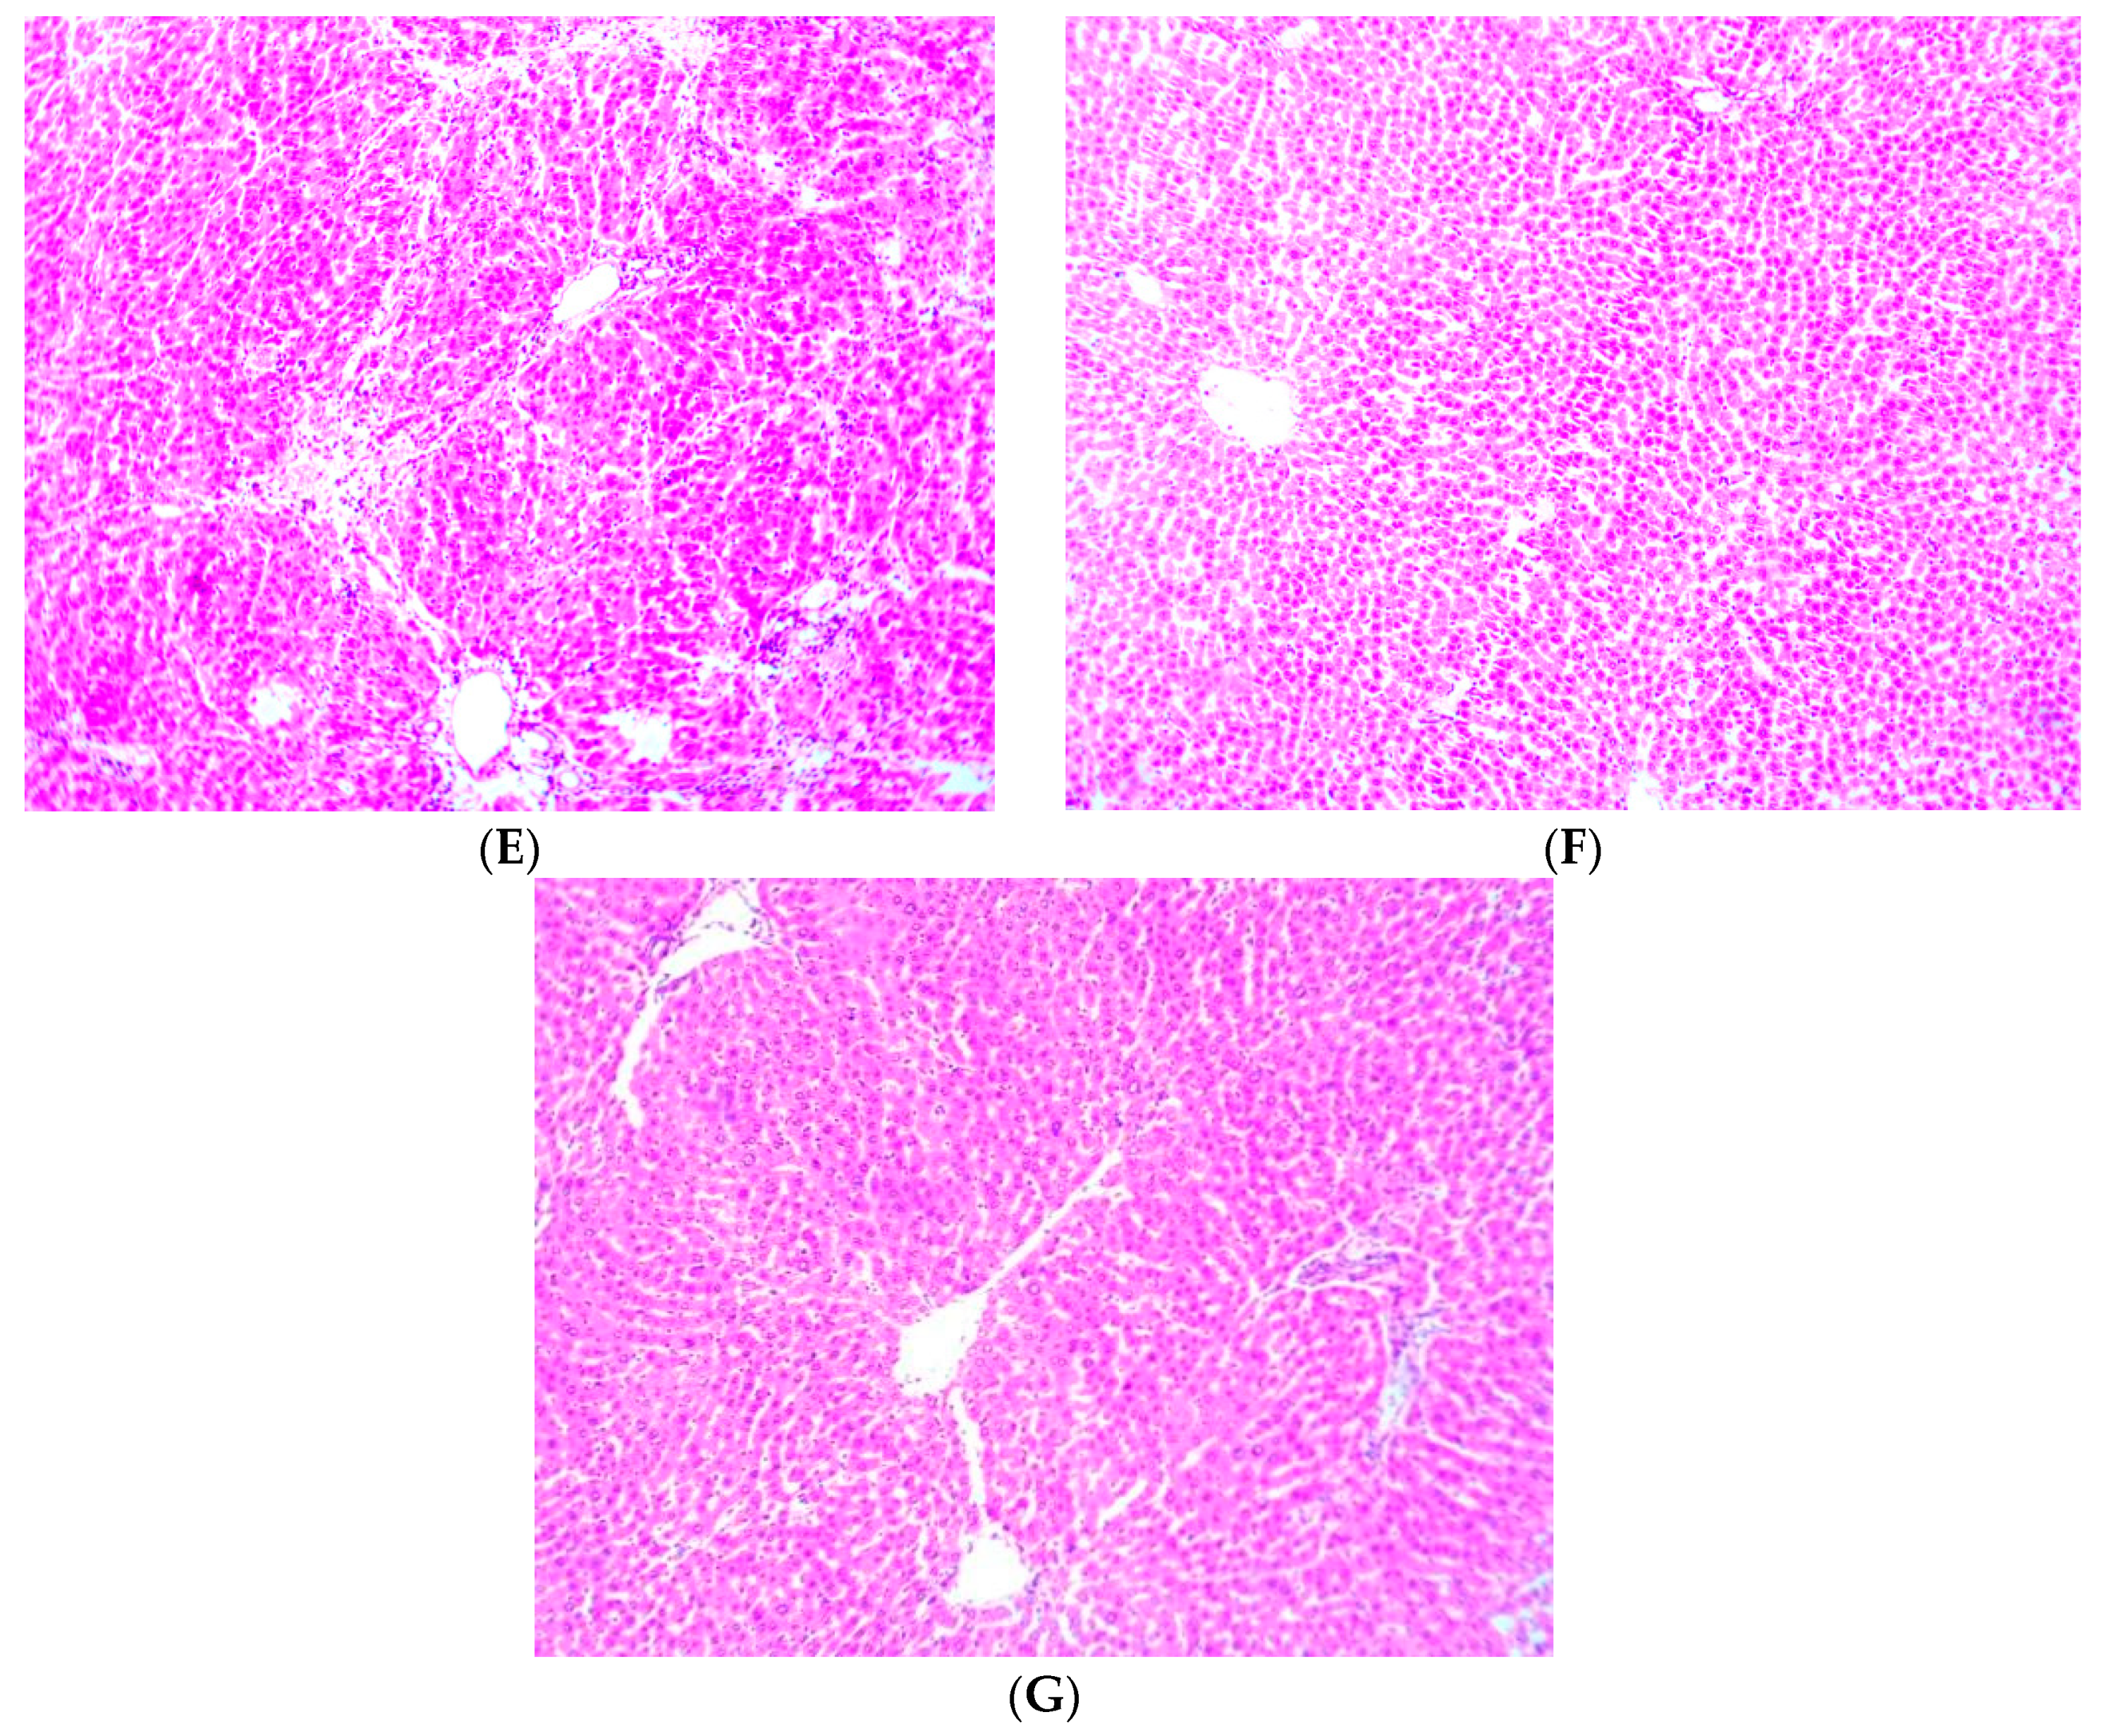
3.9. Effect of Cajanus cajan on Histological Features of the Liver

Figure 7 shows photomicrographs of the liver showing general structure, blood sinusoids (BS), central vein (CV), portal vein (PV) and the basophilic portion with nucleus and the acidophilic cytoplasm of the acinar cells. The control group showed normal architecture of the hepatocytes (Figure 7A). Administration of NDEA was seen to cause severe congestive hepatopathy (blue arrow) and sinusoidal dilation (black arrow) as shown in (Figure 7B). Hepatic damage was reduced by treatment with Cajanus cajan and Silymarin and the histological index of vacuolization, congestive hepatopathy and sinusoidal dilation were significantly decreased to some extent (Figure 7C–G).

4. Discussion

Hepatotoxicity means dysfunction of the liver due to an overload of chemicals and drugs that are toxic to the body. NDEA is known to produce ROS, which results in oxidative stress. It is known that DNA, lipids and proteins are the main targets of oxidative injury. Liver serves to filter out toxic substances from the bloodstream. When there are excessive chemicals filtering through the liver, it becomes overloaded and can lead to hepatotoxicity. The activities of particular enzymes are quickly changed in any sort of liver damage and transaminases are known to be vital markers of liver function. Their sensitively reflect the status of liver damage and also loss of functional integrity of the membrane [24]. In this present study, increased activities of marker enzymes were seen in the plasma and were signs of cellular damage due to administration of NDEA.
This study showed that NDEA induction significantly (p ≤ 0.05) increased plasma AST activity when compared to the control group. This finding is similar to another report [25]. Treatment with C. cajan significantly (p < 0.05) reduced ALT activity to almost normal levels when compared to NDEA-treated group. It has been proven that saponins show modulatory effects on transaminases in hepatocytes of rats against liver injury, which could be as a result of their antioxidant mechanism of action [26]. Therefore, Cajanus cajan, which contains saponins, may have stabilized the membrane integrity and prevented these enzymes’ leakage into blood circulation [27].
In this present study, NDEA induction significantly (p ≤ 0.05) increased plasma ALT activity when compared to the control group. There was a reduction of ALT activity in Cajanus cajan treated and Silymarin group when compared to the NDEA-treated group. This finding corresponds to a similar study [25]. This indicates the protective activity of C. cajan extract, revealing that C. cajan has the ability of protecting not only the structural integrity of the hepatocellular membrane but also NDEA-damaged cells. These buttress further that natural antioxidant molecules stabilize cell membrane depending on their degree of free radical scavenging capability [28].
Albumins are globular proteins made by the liver. It is the major constituent of total protein. From this present study, NDEA-treated group exhibited a significant (p ≤ 0.05) decrease in albumin when compared to the control group which may be due to reduction in hepatocyte number which results into reduced hepatic ability to synthesize protein [29]. This result is in agreement with a previous study [30] which indicated that NDEA-induced hepatic damage in experimental animals reduced their plasma albumin. There was a significantly (p ≤ 0.05) increased albumin in Cajanus cajan treated and Silymarin group indicating their protective roles against liver cell damage.
The oxidative stress biomarker activities were also investigated. These enzymes constitute the first line of cell antioxidant defense in a living system against free radicals [31].
Catalase is an enzyme that decomposes hydrogen peroxide to water and oxygen thereby enhancing acquisition of tolerance to oxidative stress as a form of cellular adaptive response [32]. It prevents the accumulation of free radicals in a living system. In this present study, NDEA significantly (p ≤ 0.05) reduced CAT activity as compared to the control group. Cajanus cajan treated groups with Silymarin significantly (p ≤ 0.05) increased CAT activity in comparison with the NDEA-treated group.
Superoxide dismutase (SOD) is a major step of defense in the antioxidant system against oxidative stress. It is widespread in nature and catalyzes a dismutation reaction of superoxide anion into oxygen and hydrogen peroxide. It catalyzes the destruction of superoxide radicals and its intermediates. In this present study, NDEA induction significantly (p ≤ 0.05) reduced liver SOD activity when compared to the control group which may be as a result of inhibition of SOD and CAT activity by superoxide radicals [33]. Treatments with C. cajan significantly (p ≤ 0.05) increased SOD activity to normal levels when compared to the NDEA-treated group.
These results correspond to a previous study [34]. Reduction of CAT and SOD activity in the NDEA-treated group may be as a result of enhanced ROS generation, which in turn overwhelmed the activities of these enzymes.
Glutathione-S-transferases (GST) catalyze conjugation of reduced glutathione (GSH) to xenobiotic substrates for detoxification purposes. In this present study, NDEA induction significantly (p ≤ 0.05) decreased liver GST activity when compared to the control group thereby buttressing the observed susceptibility of the hepatocytes to oxidative damage. This finding is similar to a previous report [35]. Cajanus cajan treated groups and Silymarin significantly increased (p ≤ 0.05) GST activity with 800 mg/kg being the highest. This increase can be as a result of changing the tissue redox system by scavenging free radicals and enhancing the antioxidant status in the liver during NDEA hepatotoxicity.
Reduced glutathione (GSH) is a vital natural occurring antioxidant [33], which functions in maintaining the normal state of the cells and also counteract ROS in order to reduce oxidative stress [36]. In this present study, NDEA significantly (p ≤ 0.05) decreased GSH in the NDEA-treated group when compared to the control group. For treatment with Cajanus cajan, a significant increase in GSH was seen in all groups with 800 mg/kg dose as the highest. In the Silymarin group, which was used as a positive group, there was significant difference with the control group. However, Silymarin has been shown to maintain GSH homeostasis in the system [37]. This can be the reason for increased glutathione levels seen during Silymarin treatment. The result of this research corresponds to a previous study [38], suggesting that tissue antioxidant status being affected by NDEA is probably because of reduced synthesis or elevated inhibition of GSH synthesis. The increase in Cajanus cajan treated groups indicated antioxidant protective properties and suggest Cajanus cajan has a high ability of elevating glutathione [28].
Malondialdehyde mediated by free radical is responsible for cell membrane destruction. Elevated Malondialdehyde was reported during NDEA-induced hepatotoxicity and hepatocarcinogenesis [39]. In this present study, in line with this finding, there was a significant (p ≤ 0.05) increase in Malondialdehyde (MDA) in the NDEA-treated group when compared to the control group. However, groups treated with Cajanus cajan and Silymarin displayed a significant (p ≤ 0.05) reduction in MDA when compared to NDEA-treated group. Observed reductions are presumably due to its ability to scavenge hydroxyl and peroxyl radicals [40]. Restoration was seen in Cajanus cajan treated 400 mg/kg group and it reflects its antioxidant properties which is similar to a previous report [28]. Silymarin’s effect may also be due to its ability to scavenge ROS.
From this study, the hepatoprotective effect of C. cajan was substantiated further by the histopathological studies. The NDEA-treated group showed severe vascular congestion of blood sinusoids and congestive hepatopathy via NDEA administration. This result corresponded with a previous study [41], which observed that NDEA induced several changes in liver structure such as fibrosis, cirrhosis and hepatocarcinoma. It could also be explained that NDEA intoxication showed its toxic nature through generation of ROS. Cajanus cajan treated and Silymarin group showed reduction in deformities such as congestive hepatopathy and sinusoidal dilation. Thus C. cajan exhibited its nontoxic nature and recovered the normal architecture of the hepatocytes which may be as a result of counteracting ROS by a direct or indirect manner.

5. Conclusions

From this study, conclusions can be made that the ethanol extract of Cajanus cajan contains hepatoprotective and antioxidant activity with respect to NDEA-induced liver toxicity in rats, which can be due to its free radical scavenging and also antioxidant properties. Various reports have shown that alkaloids, flavonoids, steroids and triterpenoids have a protective effect on the liver as a result of their antioxidant properties. These phytochemicals are present in Cajanus cajan and may be responsible for its protective effect in NDEA-induced hepatotoxicity. Further studies should be carried out to analyze differences in enzyme activities on the various pathways or target cells, and in different animal and in vitro models.

Author Contributions

Conceptualization, E.E.J.I. and E.N.M.; methodology, E.E.J.I and W.O.E.; software, W.O.E.; validation, E.E.J.I., W.O.E. and E.N.M.; formal analysis, W.O.E.; investigation, W.O.E.; resources, E.E.J.I and W.O.E.; data curation, E.E.J.I.; writing—original draft preparation, W.O.E.; writing—review and editing, E.E.J.I.; visualization, E.E.J.I.; supervision, E.E.J.I. and E.N.M.; project administration, E.E.J.I.; funding acquisition, E.E.J.I.

Funding

The APC was funded by Covenant University Center for Research, Innovation and Discovery (CUCRID).

Conflicts of Interest

The authors declare no conflicts of interest. The funders had no role in the design of the study; in the collection, analyses, or interpretation of data; in the writing of the manuscript, or in the decision to publish the results.

References

  1. Tricker, A.; Pfundstein, B.; Theobald, E.; Preussman, R.; Spiegenhalder, B. Mean daily intake of volatile N-nitrosamines from foods and beverages in West Germany. Food Chem. Toxicol. 1989, 29, 29–32. [Google Scholar]
  2. Shank, C. Toxicology of N-nitroso compounds. Toxicol. Appl. Pharm. 1975, 31, 729–732. [Google Scholar] [CrossRef]
  3. Lijinsky, W. N-Nitroso compounds in the diet. Mutat. Res. Genet. Toxicol. Environ. Mutagenes. 1999, 443, 129–138. [Google Scholar] [CrossRef]
  4. Bartsch, H.; Hietanen, E.; Malaveille, C. Carcinogenic nitrosamines: Free radical aspects of their action. Free Rad. Biol. Med. 1989, 7, 637–644. [Google Scholar] [CrossRef]
  5. Farber, J.; Gerson, R. Mechanisms of cell injury with hepatotoxic chemicals. Pharmacol. Rev. 1984, 36, 71–85. [Google Scholar]
  6. George, J.; Rao, K.R.; Stern, R.; Chandrakasan, G. Dimethylnitrosamine-induced liver injury in rats: The early deposition of collagen. Toxicology 2001, 156, 129–138. [Google Scholar] [CrossRef]
  7. Gey, K.F. Prospects for the prevention of free radical disease, regarding cancer and cardiovascular disease. Br. Med. Bull. 1993, 49, 679–699. [Google Scholar] [CrossRef] [Green Version]
  8. Arul, D.; Subramanian, P. Inhibitory effect of naringenin (citrus flavonone) on N-nitrosodiethylamine induced hepatocarcinogenesis in rats. Biochem. Biophys. Res. Commmun. 2013, 434, 203–209. [Google Scholar] [CrossRef]
  9. Singh, M.; Kaur, P.; Sandhir, R.; Kiran, R. Protective effects of vitamin E against atrazine-induced genotoxicity in rats. Mutat. Res. 2008, 654, 145–149. [Google Scholar] [CrossRef]
  10. Valko, M.; Leibfritz, D.; Moncol, J.; Cronin, M.; Mazur, M.; Telser, J. Free radicals and antioxidants in normal physiological functions and human disease. Int. J. Biochem. Cell. Biol. 2007, 39, 44–84. [Google Scholar] [CrossRef]
  11. Zu, Y.; Fu, Y.; Liu, W.; Hou, L.; Kong, Y. Simultaneous determination of four flavonoids in pigeon pea (Cajanus cajan) leaves using RP-LC. Chromatographia 2006, 63, 499–505. [Google Scholar] [CrossRef]
  12. Zhang, D.; Zhang, S.; Zu, Y.; Fu, Y.; Kong, Y.; Gao, Y. Negative pressure cavitation extraction and antioxidant activity of genistein and genistin from the roots of pigeon pea [Cajanus cajan (L.) Millsp.]. Sep. Purif. Technol. 2010, 74, 261–270. [Google Scholar] [CrossRef]
  13. Lu, L.M.; Zu, Y.; Fu, Y.; Zhang, S.; Yao, L.; Efferth, T. Cajanol, a novel anticancer agent from Pigeon pea roots, induces apoptosis in human breast cancer cells through a ROS-mediated mitochondrial pathway. Chem. Biol. Interact. 2010, 188, 151–160. [Google Scholar] [CrossRef]
  14. Ahsan, R.; Islam, M. In vitro antibacterial screening and toxicological study of some useful plants (Cajanus cajan). Eur. J. Sci. Res. 2009, 41, 227–232. [Google Scholar]
  15. Ito, N.; Imaida, K.; Hasegawa, R.; Tsuda, H. Rapid bioassay methods for carcinogens and modifiers of hepatocarcinogenesis. Crit. Rev. Toxicol. 1989, 19, 385–415. [Google Scholar]
  16. Iweala, E.; Ogidigo, J. Prostate Specific Antigen, Antioxidant and Hematological Parameters in Prostatic Rats Fed Solanum macrocarpon Leaves. Asian J. Biol. Sci. 2015, 8, 30–41. [Google Scholar] [CrossRef]
  17. Singh, B.N.; Singh, B.R.; Sarma, B.K.; Singh, B. Potential chemoprevention of N-nitrosodiethylamine-induced hepatocarcinogenesis by polyphenolics from Acacia nilotica bark. Chem. Biol. Int. 2009, 181, 20–28. [Google Scholar] [CrossRef]
  18. Prins, H.; Loos, J. Biochemical methods in red cell genetics. Eur. J. Pharm. 1969, 129, 122–125. [Google Scholar]
  19. Habig, W.H.; Pabst, J.; Fleischner, G.; Gatmaitan, Z.; Arias, M.; Jakoby, B. The identity of glutathione S-transferase with ligandin, a major binding protein of liver. Proc. Natl. Acad. Sci. USA 1974, 71, 3879–3882. [Google Scholar] [CrossRef]
  20. Stevens, M.; Obrosova, I.; Cao, X.; Van, C.; Greene, D. Effects of DLα-lipoic acid on peripheral nerve conduction, blood flow, energy metabolism, and oxidative stress in experimental diabetic neuropathy. Diabetes 2000, 49, 1006–1015. [Google Scholar] [CrossRef]
  21. Bock, P.; Kramer, R.; Pavelka, M. Peroxisomes and related particles. Cell Biol. Monog. 1980, 7, 44–74. [Google Scholar]
  22. Ohkawa, H.; Ohishi, N.; Yagi, K. Assay for lipid peroxides in animal tissues by thiobarbituric acid reaction. Anal. Biochem. 1979, 95, 351–358. [Google Scholar] [CrossRef]
  23. Bancroft, J.; Gamble, M. Theory and Practice of Histological Techniques. Eur. J. Sci. Res. 2002, 38, 302–310. [Google Scholar]
  24. Zimmerman, J. The adverse effects of drugs and other chemicals on the liver. Sep. Purif. Technol. 1978, 91, 121–133. [Google Scholar]
  25. Ahmad, A.; Maheshwari, V.; Ahmad, A.; Saleem, R.; Ahmad, R. Observation of esterase-like-albumin activity during N’-Nitrosodimethylamine induced hepatic fibrosis in a mammalian model. Maced. J. Med. Sci. 2012, 5, 55–61. [Google Scholar] [CrossRef]
  26. Miyao, H.; Ara, O.; Udayma, M.; Kinji, J.; Mahara, T. Kaikosaponin III and soyasaponin I, major triterpene saponins of Abrus cantoniensis, act on GOT and GPT influence on transamination elevation of rat liver cells concomitantly exposed to eclipse for one hour. Planta Med. 1998, 9, 65. [Google Scholar]
  27. Pawar, R.; Gopalakrishnan, C.; Bhutani, K. Dammarane triterpene saponin from Bacopa monniera as the superoxide inhibitor in polymorphonuclear cells. Planta Med. 2001, 67, 752–754. [Google Scholar] [CrossRef]
  28. Oluseyi, A.; Moshood, O. Hepatoprotective effect of Cajanus cajan on tissue defense system in D-galactosamine-induced hepatitis in rats. Turk. J. Biochem. 2011, 36, 237–241. [Google Scholar]
  29. Wahid, A.; Vijay, R.; Satish, B. Hepatoprotective activity of hydroalcoholic extract leaves of Alocassie indica. Ind. J. Exp. Biol. 2009, 47, 816–821. [Google Scholar]
  30. Zeashan, H.A.; Amresh, G.A.; Satyawan, S.B.; Venkateswara, Q. Hepatoprotective activity of Amaranthusspinosus in experimental animals. Food Chem. Toxicol. 2008, 46, 3417–3421. [Google Scholar] [CrossRef]
  31. Amresh, G.; Kant, R.; Zeashan, H.; Gupta, R.; Rao, V.; Singh, P. Gastro protective effects of ethanolic extract from Cissampelos pareira in experimental animals. J. Nat. Med. 2007, 61, 323–328. [Google Scholar] [CrossRef]
  32. Sankaran, M.; Vadivel, A.; Thangam, A. Curative effect of garlic on alcoholic liver disease patients. J. Biol. Sci. 2010, 3, 147–152. [Google Scholar]
  33. Meister, A.; Anderson, E. Glutathione. Annu. Rev. Biochem. 1983, 52, 711–760. [Google Scholar] [CrossRef]
  34. Bansal, A.K.; Trivedi, R.; Soni, G.; Bhatnagar, D. Hepatic and renal oxidative stress in acute toxicity of N-nitrosodiethylamine in rats. Ind. J. Exp. Biol. 2000, 38, 916–920. [Google Scholar]
  35. Kweon, S.; Park, K.A.; Choi, H. Chemopreventive effect of garlic powder diet in diethylnitrosamine-induced rat hepatocarcinogenesis. Life Sci. 2003, 73, 2515–2526. [Google Scholar] [CrossRef]
  36. Yu, P. Cellular defense against damage from reactive oxygen species. Physiol. Rev. 1994, 74, 136–162. [Google Scholar] [CrossRef]
  37. Fraschini, F.; Demartini, G.; Esposti, D. Pharmacology of silymarin. Clin. Drug. Investig. 2002, 22, 51–65. [Google Scholar] [CrossRef]
  38. Adaramoye, Y.; Adeyemi, U. Effect of kolaviron, a biflavonoid complex from Garcinia kola seeds, on ethanol-induced oxidative stress in liver of adults Wistar rats. J. Med. Food 2009, 12, 584–590. [Google Scholar] [CrossRef]
  39. Jeyabal, P.V.; Syed, M.B.; Venkataraman, M.; Sambandham, J.; Sakthisekaran, A. Apigenin inhibits oxidative stress-induced macromolecular damage in N-nitrosodiethylamine (NDEA)-induced hepatocellular carcinogenesis in Wistar albino rats. Mol. Carcinog. 2005, 44, 11–20. [Google Scholar] [CrossRef]
  40. Horie, T.; Awazu, S.; Itakura, Y. Identified diallyl polysul-fides from an aged garlic extract which protects the membranes from lipid peroxidation. Planta Med. 1992, 58, 468–469. [Google Scholar] [CrossRef]
  41. Junnila, M.; Rahko, A.; Sukura, A. Reduction of carbon tetrachloride induced hepatotoxic effects by oral administration of betaine in male Han-Wistar rats. Vet. Pathol. 2000, 37, 231–238. [Google Scholar] [CrossRef]
Figure 1. Effect of Cajanus cajan on albumin. Values are expressed as mean ± SEM; a Values differ significantly from control group; b Values differ significantly from the NDEA-treated group.
Scipharm 87 00024 g001
Figure 2. Effect of Cajanus cajan on malondialdehyde (MDA). Values are expressed as mean ± SEM; a Values differ significantly from the control group; b Values differ significantly from NDEA-treated group.
Scipharm 87 00024 g002
Figure 3. Effect of Cajanus cajan on superoxide dismutase (SOD) activity. Values are expressed as mean ± SEM; a Values differ significantly from the control group; b Values differ significantly from the NDEA-treated group.
Scipharm 87 00024 g003
Figure 4. Effect of Cajanus cajan on catalase activity. Values are expressed as mean ± SEM; a Values differ significantly from control group; b Values differ significantly from NDEA-treated group.
Scipharm 87 00024 g004
Figure 5. Effect of Cajanus cajan on Glutathione S-transferase (GST) activity. Values are expressed as mean ± SEM; a Values differ significantly from the control group; b Values differ significantly from the NDEA-treated group.
Scipharm 87 00024 g005
Figure 6. Effect of Cajanus cajan on reduced glutathione. Values are expressed as mean ± SEM; a Values differ significantly from the control group; b Values differ significantly from the NDEA-treated group.
Scipharm 87 00024 g006
Figure 7. Histology showing control and experimental groups. Group (A); Served as the control animals (B); Animals receiving NDEA (200 mg/kg) (C); Animals receiving NDEA + Cajanus cajan (200 mg/kg) (D); Animals receiving NDEA + Cajanus cajan (400 mg/kg) (E); Animals receiving NDEA + Cajanus cajan (800 mg/kg) (F) Animals receiving NDEA + Silymarin (50 mg/kg) (G) Animals receiving Cajanus cajan (800 mg/kg) only.
Scipharm 87 00024 g007aScipharm 87 00024 g007b
Table 1. Effect of Cajanus cajan on the body and liver weight.
GroupsTreatmentInitial Body Weight (g)Final Body Weight (g)Liver Weight (g)Relative Liver Weight (Liver/100 g b.w)
AControl168 ± 12.90198 ± 10.727.08 ± 0.243.58 ± 0.11
BNDEA 160 ± 14.0 a170 ± 11.60 a9.93 ± 0.44 a5.98 ± 0.36 a
CNDEA + 200 mg/kg166 ± 11.49 b182 ± 13.24 b8.16 ± 0.35 b4.48 ± 0.25 b
DNDEA + 400 mg/kg164 ± 12.46 b 185 ± 13.26 b7.55 ± 0.26 b4.19 ± 0.16 b
ENDEA + 800 mg/kg163 ± 11.47189 ± 13.29 b7.04 ± 0.22 b4.01 ± 0.13 b
FNDEA + Silymarin161 ± 11.41186 ± 15.08 b7.58 ± 0.11b3.91 ± 0.25 b
G800 mg/kg Only167 ± 11.06195 ± 11.386.97± 0.353.57 ± 0.13
Values are expressed as mean ± SEM; a Values differ significantly from control group; b Values differ significantly from NDEA-treated group.
Table 2. Effect of Cajanus cajan on plasma AST and ALT activity.
GroupsTreatmentALT (U/L)AST (U/L)
AControl69.73.38 ± 5.19106.67 ± 5.47
BNDEA 124.73 ± 22.06 a227.15 ± 25.5 a
CNDEA + 200 mg/kg109.23 ± 8.39 b180.34 ± 8.25 b
DNDEA + 400 mg/kg98.34 ± 6.81 b145.05 ± 6.75 b
ENDEA + 800 mg/kg74.86 ± 5.63 b112.87 ± 5.80 b
FNDEA + Silymarin90.59 ± 6.77 b132.12 ± 5.96 b
G800 mg/kg Only70.33 ± 5.22109 ± 5.76 b
Values are expressed as mean ± SEM; a Values differ significantly from the control group; b Values differ significantly from NDEA-treated group.

