Abstract
This paper presents the results of the study on the venture capital (VC) market development drivers in small countries with underdeveloped VC markets. Based on the literature content analysis, the authors developed a comprehensive list of factors influencing VC market status. The relevance of the factors in countries with small, underdeveloped VC markets was studied between experts involved in shaping Latvian VC market. The study revealed that all factors (in total 73) delivered from the literature influence the VC market in the countries such as Latvia. Sixty-three factors have an impact above moderate, and providing public funding for VC funds is only one of the factors. The results highlight the importance of the shift from the typical public support approach of providing VC managers with funding to the government involvement in also shaping other conditions necessary for VC market self-sufficiency development. Based on the study, the authors propose a conceptual model for further public support design. The model has three dimensions of meta factor groups (VC market participants, environment, embedded characteristics). It is necessary to evaluate and, if possible, provide public support in each of the meta-factors’ groups. The authors propose to use the model and the list of impactful factors as tools for further governmental support for VC.
1. Introduction
Companies with stable income, a proven track record, and assets pledge to have access to various sources of capital [1]. Nevertheless, new ventures, especially high-tech and/or those with high growth potential, usually lack these features and often are not eligible for typical funding such as bank loans [2]. It is well-known [3,4] that for such companies, venture capital (VC) is the most appropriate financial instrument to use. It is also admitted that as a result of VC investments, a higher level of R&D, innovation [5,6,7], productivity, and employment [8,9,10,11] is achieved.
Despite the rarely disputed VC beneficial effects, it is widespread only in the US [3]. VC market’s development elsewhere is only moderate [12]. Therefore, governments in many countries try to foster VC market activity. The European Union (EU) alone has many policy documents in regards to VC [13] and also, over several decades, has contributed a significant amount of money to support VC funds [14].
There is no common opinion on how to cultivate VC investments. The existing research on the VC market activity drivers is contradicting. Some studies conclude that it is more important to increase the supply of the VC [15]. In contrast, others propose to increase demand for the VC [16,17]. There are also studies that provide evidence that an increase in one of the market sides leads to an increase in the other side [18,19]. Additionally, the opposite is true—the scarcity of VC supply may be a reason for decreased demand for VC [19] as entrepreneurs fearing the high competition for VC money will not seek it.
To the best of the authors’ knowledge, the countries involved in attempts to have benefits from VC investments do not have comprehensive policies to develop a VC market. There are just sporadic efforts to provide public funding for VC funds or encourage entrepreneurs to use VC.
The EU countries for their economic development can use resources from European structural funds (SF). A particular country can determine how the funds a country is eligible for will be used: as grants, guarantees, loans, or VC investments. Starting from the 2007–2013 planning period [20], there has been a shift from grants to repayable financial instruments and VC as part of them. As result, many EU countries within each planning period deploy part of the available money from SF, providing inflow to local VC fund managers. Over the period of 2007–2020, governmental agencies provided EUR 20.4 billion to VC funds in the EU [21] (calculations by the authors). In 2020 alone, EUR 3.55 billion or 23% of the newly raised committed capital of European VC funds came from governmental agencies. Public contributions to support VC funds are made not only by each EU member state (mostly from SF resources). The EU also supports VC funds by centrally managed interventions directly designed and developed by the European Commission (EC).
The amount of necessary public support for VC funds is determined based on ex-ante assessments about existing market gaps. The methodology for assessing market gaps will be described in the next session, but in essence, assessments are performed based on expert opinions, and there is no possibility to obtain quantitative data to reflect a silent demand [16] for VC.
The target of SF programs is to broaden SMEs access to finance and support innovation and employment. The development of a country’s VC market is not an aim of SF programs. As a result, even increasing VC supply with public resources, the SF programs do not have a deliberative intention to develop VC markets.
The same applies to other entrepreneurship support programs. Evaluations of them are performed at a single program on the isolation level [15,16,22] and not designing/measuring the total impact on the organic growth of the VC market. For example, there is a general understanding between policymakers that sufficient demand for VC is necessary to have successful VC fund operations. Therefore, countries also support the creation of new innovative enterprises and awareness of entrepreneurs about VC [23], but these activities are vaguely connected with public support for VC supply.
Dependency on public support in many countries, even after long-term public support [24], could signal severe deficiencies in the design of interventions.
Public finance theory states that government interventions are exceptional measures that may be used if they generate positive externalities to society [25] and do not distort the market [3]. In addition, transaction cost economics emphasizes the importance of including the costs of implementation in the expected benefit calculus from the interventions [26].
As public support is limited in time measure and its implementations costs should be weighed against benefits, it would be necessary to influence the VC market as a whole, not just its parts.
There are numerous studies regarding VC and factors influencing it. Most of these studies were conducted in countries with developed and stable economies. A comprehensive overview of the studies is absent. Additionally, analysis of differences between countries with longer VC history and those with shorter is missing. Therefore, the article aims to:
- define what VC market status that a government should help to achieve is;
- make a content analysis of the factors influencing VC activity and differentiate if necessary between factors related to developed VC markets and underdeveloped ones;
- propose a conceptual model for self-sustainable VC market development.
The article is organized as follows: the next section introduces the literature review of VC market status characteristics and existing ideas about development of the market. The third section describes the research design. The results of the study are presented in the fourth section. Section five outlines the main conclusions and discussion.
2. Literature Review
Numerous studies have looked at the development of venture capital markets and their determinants.
What is venture capital? Invest Europe, the association representing VC on the European level defines it as “a type of private equity focused on companies… with innovative ideas for a product or service.” The British Private Equity & Venture Capital Association’s definition emphasizes the critical feature of VC target companies—their high growth potential [27]. Some sources use the term private equity to refer to both private equity (PE) and VC, while others use venture capital to refer to both: VC and PE. The difference between VC and PE is in the stages of companies they finance. VC funds (VCFs) invest in companies in the first stages of their development. In turn, PE funds focus on later stages when companies have stabilized their operations and are looking for a way to develop further or provide capital to buy out the companies. The term VC in the studies usually has a close meaning to the upper mentioned. It excludes PE stages related to relatively mature companies’ companies (rescue/turnaround, buyout and growth). The stages of VC widely accepted by VC industry players and mostly by the researchers (authors’ observations and interviews) are:
- Seed: Funding provided before the investee company has started mass production/distribution with the aim to complete research, product definition, or product design, also including market tests and creating prototypes. This funding will not be used to start mass production/distribution.
- Start-up: Funding provided to companies, once the product or service is fully developed, to start mass production/distribution and to cover initial marketing. Companies may be in the process of being set up or may have been in business for a shorter time but have not sold their product commercially yet. The destination of the capital would be mostly to cover capital expenditures and initial working capital.
- Later-stage financing: Financing provided for an operating company, which may or may not be profitable. Later-stage venture tends to be financing into companies already backed by VCs.
To characterize desirable VC market status, several terms are used in the literature (Table 1).

Table 1.
Terms used to describe VC market desirable status.
To conclude, based on the existing studies (Table 1), the desirable VC market status that governments should help to achieve could be characterized as follows:
- there is balance of demand for such capital and supply;
- the market is capable of financing the riskiest companies: those in the earliest stages of their development and high-tech ventures (without tangible assets for collaterals and stable income), and it provides strong support for them;
- there is a sufficiently good quality pipeline of investible businesses for VCFs;
- the market has reached critical mass for further organic growth without public support.
Further in the study, the authors will use the term self-sustaining VC market, meaning a market with all four above-mentioned features. This term is preferred because the other terms in Table 1 characterize the capabilities of the market notwithstanding their dependency on public support. A self-sustaining VC market is a market with all these capabilities but without the necessity for further public support for its activity [3].
2.1. How to Measure the Self-Sustainability Point?
The proposal of some authors [12] is to define the market’s tangible portion of a country’s GDP as a goal. Nevertheless, there is no exact amount that could be regarded as sufficient % of GDP. Other authors [28] propose to use the VC market in US as a benchmark. The annual VC investment rate by the US local VC funds during the latest decades was 0.31% of GDP [31]. For comparison, the highest annual average (2015–2019) for VC investments as % of GDP in Europe was in Luxemburg, 0.15%, while there were countries with 0.003% of GDP ([32] (authors’ calculations).
Table 2 lists the VC market activity’s measurements used in the studies and by the market participants.
Table 2.
VC market activity measurements.
There are two different approaches regarding which funds should be included in the statistics. If the measurements are performed by the industry statistics approach, then all investments by current country’s fund managers notwithstanding the location of the portfolio companies are included [21]. By the market statistics approach, all VC investments in a particular country’s portfolio companies notwithstanding the funds’ location are aggregated. As many countries have small internal markets, their VC funds tend and even are advised [24] to invest in a broader region as their establishment country. Therefore, when analyzing VC supply-side development, the industry statistic providing information about local VC fund investments is used often.
The results of the measurements for statistical reasons are compared between countries. Nevertheless, there is no opinion about what exact number could be defined as a point where self-sustaining position is reached. Instead, the self-sustaining point is defined as the point where there is no gap between supply and demand.
2.2. How to Measure the Market Gap?
The gap is measured based on expert opinions [16,29]. Even in more mature VC markets, the gap exists, but for only part of the VC investment stages—the earliest ones [16]. Therefore, the gap should be estimated not only as a total number but also for each VC stage.
No special quantitative technique for measuring the gap is used as a result of difficulties in measuring demand for VC. The reason for it is so-called “silent demand” [16]—the demand that becomes apparent only when VC is available and information about it reaches entrepreneurs.
As part of its Common Provisions Regulation for SF, European Commissions had set an obligation for member states to make gap assessments. Nevertheless, there are no specific rules on how to do it, just suggestions to use good practices in the field. Three tools advised to use by European Investment Fund (EIF), the most experienced and impactful player of European VC market [14], are (1) existing data, (2) surveys and stakeholders interviews, and (3) peer analysis [37]. By peer analysis is meant the countries or regions that share similar characteristics in their SME base and population and desirably also in industry sectors. From a demand perspective, all these tools just give a basis for the trials to quantify a financing gap, but results cannot be seen as robust. As acknowledged by EIF [37], only in regards to the VC supply can these tools provide reasonably robust rankings.
2.3. How Can a Country Activate VC Market?
There are a lot of studies regarding the development of the VC market. They suggest that the typical approach of providing VC managers with public funding is not sufficient to develop a VC market. The VC market status depends on vast set of determinants. Very frequently measured factors are M&A activity, innovation level, investor protection level, labour regulation, bribery and corruption level, tax burden, unemployment rate, export level, GDP growth, VC ecosystem development, including business angels’ activity, worldwide trends including economic shocks, and leading industries [34,38]. The latest trend is acknowledging that cultural features prevailing in the region and, as a result, formal and informal institutions’ characteristics are important determinants of VC market development [13,39,40].
The determinants identified in the studies could be grouped into three major groups: 1. factors influencing VC supply, 2. factors influencing VC demand, and 3. factors influencing VC market activity in total. There are disagreements between authors regarding boosting which side of the market (supply or demand) is more important for its development. Some authors conclude [16,17] that VC market development policies have been most effective in countries that acted through demand side measures. At the same time, others [15] provide evidence suggesting that supply side support is more appropriate. A relieving message comes the from studies that found that an increase in any of the market sides leads to an increase in the other side [18,19]. Additionally, there are many recommendations from the researchers on how particular policies have to be improved [41,42]. Nevertheless, researchers have acknowledged that government VC support schemes for a particular side of the market could not be viewed in isolation [29,43], and there is a necessity to create complementary policies.
Another way to group the factors is by their relevance to a particular group of countries. There is agreement between authors [34,44] that drivers of VC activity could be different in the countries with different development stages. Additionally, determinants can vary between VC stages [3]. In addition, studies indicate that the factors are interdependent [12,34]. As a result, VC activity varies between seemingly very similar countries [34].
In order to have a comprehensive list of the factors influencing the VC market, the authors performed a content analysis of the studies researching the VC market. The conceptual model for self-sustainable VC market development was created on the results of the content analysis and expert validations of the factors’ relevance. The next section describes the methodology of the research.
3. Materials and Methods
The research had the following steps:
- Content analysis of the literature:
- -
- regarding VC supply determinants
- -
- regarding VC demand determinants
- -
- regarding VCists and entrepreneurs matching determinants.
- Consolidation of the factors for supply, demand, and matching.
- Survey of VC market experts’ opinion regarding the importance of the factors in small countries with underdeveloped VC markets.
- Constructing a conceptual model for VC market activity development.
To determine the factors influencing VC market development, a content analysis of the literature was conducted. As most of the studies researched a particular side of the market, the analysis was performed in three steps. The first step was identifying factors influencing VC supply. The search terms were Venture Capital and Supply. The second step was finding factors influencing VC demand. The search terms were Venture Capital and Demand. The third step was determining factors influencing the match between entrepreneurs and VC funds. The search terms were entrepreneur opinion and VC, entrepreneur openness and VC, and willingness to partner.
Web of Science was used to find relevant studies. Due to the massive number of studies related to VC supply and demand and rapidly evolving research regarding VC, the search scope was limited to the latest studies (2016–2020), the studies cited in them, and the studies related to the Latvian VC market as an example of an underdeveloped market. The matching factors’ studies scope was not limited to the latest studies as the number of them was not so high.
An analysis of codes and categories identified in different VC industry regions by maturity was also performed. The selection of countries belonging to the mature VC industry was made based on the results of previous research [3,12]. As countries with a mature VC industry, the US, the UK, and Germany were counted. Theoretical studies were counted as studies from countries with mature VC industries because of the proportion of VC located in these countries [32].
Separate categories regarding each of the market side determinants were developed during content analysis. Some of the categories appeared in two or all three content analysis. As result, consolidation of the factors for supply, demand, and matching was performed. The factors were grouped into three metagroups and twelve factor groups. The metagroups were formed based on an analogy with Williamson’s [45] levels of institutions: governing informal rules and placement of the region (embedded factors), rules set by formal institutions and environment created (environment), and actors of the market (VC market players). The meta-factor group “VC market participants” had three factor groups: q11 factors related to VC firms, q12 factors related to investors in VC funds, and q13 factors related to entrepreneurs. The meta-factor group “environment” had six factor groups: q21 legal environment; q22 government policies; q 23 infrastructure; q24 environment for innovation; q25 resources; and q26 macroeconomic conditions. Meta-factor group “embedded factors” had three factor groups: q31 geographical location; q32 culturally determined social norms; and q33 reputation of a particular country. Respondents were asked to rate the possible subfactors influence on the following market dimensions: 1. supply side of the VC market; 2. demand for VC; 3. total VC activity (measured as VC investments).
The results of the content analyses’ consolidation were used to develop the questionnaire with closed-end questions for experts to rate the factors influencing VC market development in the countries with underdeveloped markets. The appropriateness of the survey instead of using quantitative market data to reach the study goal is justified by the limited availability of longitudinal and systematic data regarding the countries with underdeveloped VC markets and that as a result of limited number of underdeveloped markets’ participants, any new entrant or significant exit substantially distorts the market data. As per the theory, qualitative research is recommended to account for real-world contextual conditions [46], which was important in studying the factors in countries with specific features. The qualitative research also is widely used by reputable VC market development experts such as Lerner J. [47], Harding R. [16], Migendt M. [48], and Baldock [49] and in other studies related to the small countries with unmatured VC markets [23].
Minor regrouping of the subfactors in the questionnaire was performed, and some subfactors were divided into smaller units after the test trial of the questionnaire. Thirty-one persons influential in the Latvian VC market were approached by direct emails with a link to the questionnaire in Google Drive to fill. A total of 22 of the approached provided answers to the questionnaire. The survey was carried out in May–June 2021. Considering the complicated structure of the questionnaire (several dimensions for rating a subfactor), most of the respondents chose to fill the questionnaire during a personal interview with the authors, thus providing the possibility besides quantitative rankings to collect some qualitative data.
The experts were chosen based on the example from similar studies [50] and Latvian Private Equity and Venture Capital Association data as being deeply involved in the VC market in Latvia and knowing all significant participants of the market. The experts approached were:
- VC fund managers representatives
- All VC fund managers registered or permanently active in Latvia were approached—in total 9. 8 from 9 provided answers to the questionnaire.
- Public agencies responsible for VC programs in Latvia/Baltics representatives
- Latvian public agency’s ALTUM representatives in charge of VC programs were approached. All three approached provided answers. Additionally, three representatives of EIF in charge of VC and Private Equity programs in Baltic States were approached. EIF is one of the most important players in the EU venture capital market managing European Commission VC programs [14]. All three representatives from EIF provided answers. The representative from the European Bank for Reconstruction and Development in charge of VC market programs in Baltic States approached did not provide the answers.
- Policymakers in charge of VC programs
- Representatives from the Latvian Finance Ministry and Ministry of Economics in charge of the country’s VC policy (three in total) did not fill the questionnaire. Latvian Bank representative involved in Capital Market development issues provided answers.
- Limited partners or investors in VC funds
- From few institutional investors in VC funds (five pension funds), four were approached. Three of them provided answers.
- Representatives of start-up community or serial entrepreneurs
Seven persons deeply involved in shaping Latvian start-up ecosystem were approached. Three of them responded that they do not feel to be equipped with enough knowledge to respond to the questionnaire (Similar situation was observed in the earlier study of Latvian VC industry [50]). Four of the approached ones responded.
Some of the respondents marked several responded groups to which they belong. Some of the respondents from public agencies, policymakers, and LPs groups were not active in that position at the time of the questionnaire but previously had substantial role in these capacities. Table 3 provides a summary of the respondents.
Table 3.
Respondents of the questionnaire.
The respondents were asked to rate the impact of the subfactors using a Likert scale (1–5), a “5” indicating a very strong influence and “1”—no influence. To determine the internal consistency of the results, the importance of the factors, and their correlations, the data were analyzed using Statistical Package for the Social Sciences 26.
Based on VC market determinants analysis results, the authors propose a conceptual model for further public design. The results of the research are described in the next section.
4. Results
4.1. Content Analysis of the Literature Regarding Factors Influencing VC Supply
Twenty-nine factors influencing VC supply were identified from the studies. Three factors out of twenty-nine (informal or intangible institutions; technology innovations; alternative investments for LPs opportunities) were not found in the studies related to the mature markets. The missing factors in the mature markets were contra-intuitive. Therefore, an additional search in other databases was performed. During the additional search, it was approved that the factors “informal or intangible institutions” [12,35] and “technology innovations” [51,52] are also important in mature markets. The factors’ group “alternative investments for LPs opportunities” in mature markets is an organic part of the category “investment returns”, but it is not the case in the unmatured markets. The difference between mature markets and unmatured ones in this respect is that most of the VC fund managers in mature markets have had several funds, and their investment returns from the previous funds are known. In many unmatured markets, fund managers are new, their fund cycles have not been closed, and investment returns are unknown. Therefore, comparing returns from investments in VC funds and public markets is close to impossible in unmatured markets. As a result, for mature markets’ investors, the comparison between public markets and VC investments is important, but for unmatured markets’ investors, the lack of attractive investment opportunities could be the main reason for investing in VC funds.
Thirteen of the factors were found in the studies concerned unmatured markets.
All factors are listed in Table 4, mentioning the frequency of their appearance in the Web of Science studies.
Table 4.
The factors influencing VC supply.
The factors were divided into three metagroups: 1. VC market players; 2. environment, and 3. embedded factors. The factors’ affiliations to a particular metagroup are visible from Figure 1.
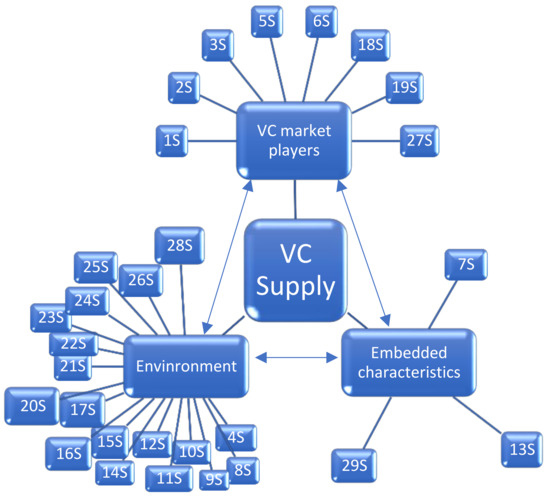
Figure 1.
Factors influencing VC supply, their metacategories, and interconnections.
4.2. Content Analysis of the Literature Regarding Factors Influencing VC Demand
Twenty-nine factors influencing VC demand were identified in the studies. All factors are listed in Table 5, mentioning the frequency of their appearance in the Web of Science studies.
Table 5.
The factors influencing VC demand.
The factors were divided into the same metacategories as the supply determinants: 1. VC market players; 2. environment, and 3. embedded factors. The demand factors’ affiliation to a particular metacategory is visible from Figure 2.
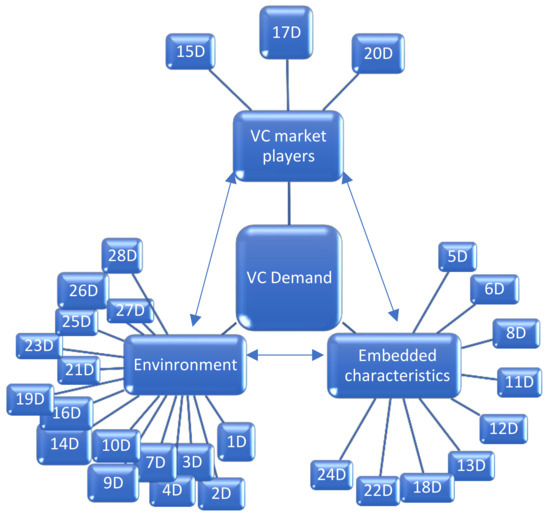
Figure 2.
Factors influencing VC demand, their metacategories, and their interconnections.
The same as for the supply determinants, the authors kept all categories (even those that were not discovered in the studies regarding unmatured VC markets) for further research.
4.3. Content Analysis of the Literature Regarding Factors Influencing Venture Capitalists (VCists) and Entrepreneurs Matching Possibilities
Eleven factors influencing whether VCists and entrepreneurs seek out and begin cooperating were developed after analysis. Table 6 shows the frequency of the categories. The list of the sources and complete methodology for the matching determinants are described in the authors’ previous article [44].
Table 6.
The factors influencing cooperation between venture capitalists and entrepreneurs.
The analysis revealed a substantial difference between the significance of factors in countries with mature and underdeveloped VC markets. The analysis by region presented in Table 5 suggests that the lack of awareness about VC, both in general and in detail, is the main factor in underdeveloped VC markets preventing entrepreneurs from approaching VCs. This has not been found to be the case in more mature markets. In countries with a developed VC industry, the leading factors discouraging cooperation are “VCs characteristics” followed by “communication between VCs and entrepreneurs”.
4.4. The Consolidation of the Factors for Supply, Demand, and Matching
The results of three separate content analysis of the factors for supply, demand, and matching revealed that most of the factors have a beneficial influence on several aspects of the market (supply, demand, and/or market activity in total). The consolidated results of the content analysis are provided in Supplementary Materials. The cell of the particular side of the market where a factor is a driver has an ascending arrow in it. Some of the factors as provided in Table S1 have varied influence—they can be either drivers or barriers depending on the other circumstances.
4.5. The Questionnaire for Experts
Sixty subfactors with a potentially beneficial effect on VC market status were discovered from the literature content analysis (Table S1). The list of the subfactors was used to develop the questionnaire for experts to rate the factors influencing VC market development in the countries with underdeveloped markets. Minor regrouping of subfactors was performed, and some subfactors were divided in smaller units after the test trial of the questionnaire. As a result, the final questionnaire contained 73 subfactors. They were grouped in 12 factor groups and in three metacategories: (i) VC market participants, (ii) environment, and (iii) embedded characteristics.
The respondents were asked to rate the possible subfactors influence on each of the following: supply side of the VC market, demand for VC, and total VC activity (measured as VC investments). The factors were rated using a Likert scale (1–5). A “5” indicating a very strong influence and “1”—no influence.
The aim of the expert opinion collection was:
- to understand whether factors delivered from the studies are important in countries with underdeveloped VC markets and small internal markets (such as Latvia, for example);
- to determine to what degree each of them is important and what the correlations are between them.
Twenty-two experts in Baltic VC market issues provided answers for the questionnaire. The principal components analysis was performed with the results of the questionnaire. The rotated component matrix did not provide any meaningful outcome for regrouping the subfactors. Therefore, the authors kept the previous grouping of the subfactors in groups and metagroups.
The reliability of composite results of the survey is very high—above 0.9 by Cronbach’s alpha coefficient (Table 7).
Table 7.
Reliability statistics.
The results of the survey show that all factors delivered from the literature also have influence on the underdeveloped VC markets. The mean value of the vast majority of the is above moderate. To visualize the results, the box and whisker charts of the factors showing the distribution of the values into quartiles and highlighting the mean and outliers are provided further.
4.5.1. Metagroup “VC Market Players”
The values of the factors belonging to the metagroup “VC market players” are in Figure 3.
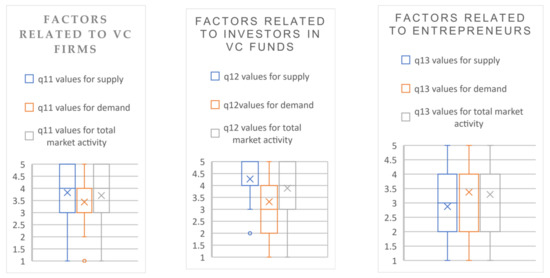
Figure 3.
Values of the factors belonging to the metacategory “VC market participants”.
The analysis shows that the characteristics of the VC firms have larger influence on the supply side and total market activity than demand. Nevertheless, the mean value for all dimensions (supply, demand, and total market activity) is high, and the bottom line of the first quartile for all dimensions is above the middle rating.
Further, the results of the study are explained on the subfactors level. Each factor consists of several subfactors, the weight of which experts were asked to rate. From the factors’ group, which are related to “VC firms”, several factors have a strong influence on the market (Table 8)—highlighted in green. Three factors have a below-moderate influence (highlighted in red), still only on one side of the market.
Table 8.
The subfactors related to VC firms’ weight.
The factors related to the “investors in VC funds” or limited partners (LPs), like the “factors related to VC firms”, have a larger influence on the supply and total market activity than the demand side (see Figure 3). As predicted, the influence on the supply is paramount, with the bottom line of the 1st quartile above “strong influence” and only one outlier at the level “little influence”. Nevertheless, the mean influence even on the demand side is above moderate. Analysis of the data on subfactors’ level (Table 9) shows that one subfactor has strong influence on all market sides— “existence of successful entrepreneurs from prior generations”. Other two subfactors have strong influence on the supply side, slightly below-moderate influence on the demand side, and above-moderate influence on the total market activity.
Table 9.
The subfactors related to investors in VC funds weight.
The last factor group belonging to the metagroup “VC market players” is “factors related to the entrepreneurs”. Figure 3 shows that according to the previous research, the subfactors from this group have a larger influence on the demand side and total market activity than supply. The total rating of the group would be even higher if not reduced from the values of the one subfactor, which was regarded as having little influence on all dimensions, particularly “male gender dominance between entrepreneurs”. The previous research has documented that VC funds’ portfolio companies selection is gender-biased, where male entrepreneurs have a larger possibility to attract investments [53]. Nevertheless, our survey does not support this is being valid, at least in the Latvian market. From the subfactors related to the entrepreneurs, one subfactor has a strong influence on all market sides (Table 10)—“high number of entrepreneurs seeking VC”. Two factors have little influence on all market sides: “high net worth of entrepreneurs seeking VC” and, as previously mentioned, “male gender dominance between entrepreneurs”. The low mean value for these two subfactors is in contradiction with previous research. Some studies suggest that high net worth of entrepreneurs is an advantage for receiving investments from VC funds [54]. Other factors have moderate influence on all market sides. An exception is “awareness of the added value from VC between entrepreneurs/potential entrepreneurs”, whose influence on the supply side is below moderate, but on the demand side, it is the opposite—strong. Additionally, the subfactor “technical or MBA education of entrepreneurs/potential entrepreneurs” weight is below moderate.
Table 10.
The subfactors related to the entrepreneurs.
4.5.2. Metagroup “Environment”
The values of the factors belonging to the metagroup “environment” are in Figure 4.
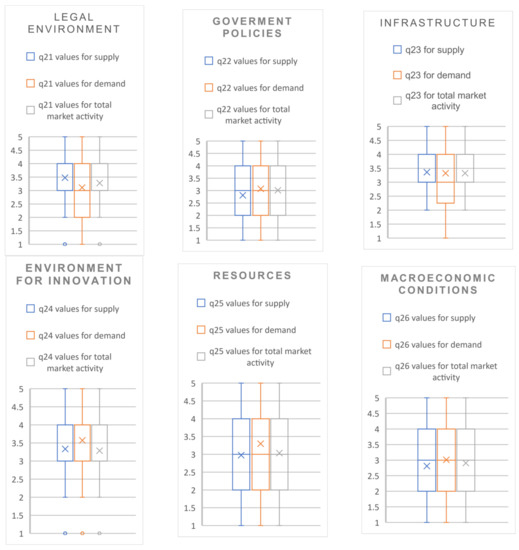
Figure 4.
Values of the factors belonging to the metagroup “environment”.
The analysis shows that “legal environment” has a larger influence on the supply side and total market activity than the demand. Nevertheless, the mean value for all dimensions (supply, demand, and total market activity) is above moderate.
Analysis of the legal environment group on subfactors’ level reveals that most of the subfactors related to that group (Table 11) have moderate or above influence. The subfactors “internationally harmonized and stable regulation for securities, bankruptcy, labor, and tax” and “broad limits for VC funds” have a strong influence on the supply side. Several subfactors have a below-moderate influence on the demand side. Reduced labor regulation has a below-moderate influence on the total market activity.
Table 11.
The subfactors related to legal environment.
The impact of the group “government policies” (Figure 4) is very similar for all dimensions—with equal quartiles, median, and min and max values and very similar mean value around “moderate influence”.
Analysis of the group on the subfactor level reveals that, similarly, the same impact on the group level is unevenly spread between different factors. The subfactors of this group in general have below-moderate influence on the supply side of the market. An exception is the provision of public funding for VC funds, which has a strong influence on the supply side and the market activity in total (Table 12). On the opposite side, on the demand side, the provision of public funding has a below-moderate influence, but other factors have a higher influence than on the supply side. Unexpectedly, the subfactor “similarity between domestic and foreign policy” has a below-moderate influence on all market sides. The previous research considers [55] a greater similarity between domestic and foreign policy incentives as a driver for cross-border investments, which as per VC firms’ characteristics analysis (Table 8) has a high beneficial influence on the market, especially on the supply side.
Table 12.
The subfactors related to government policies.
The group “infrastructure” mean value (Figure 4) is similar for all dimensions. Nevertheless, the 1st quartile bottom line for the demand is closer to the “little influence” value, but for the supply and total market, it is “moderate influence”.
Analysis of the group on the subfactor level reveals that most of the subfactors have similar influence on all dimensions, seen in Table 13. Two subfactors (q23_1 and q23_11) have below-moderate influence on all market dimensions. The low rating of the q23_11 “existence of alternative IPO and listing regulations for SMEs with less-stringent standards” contradicts the previous research [56]. During interviews with the experts, many of them said that they do not see the local stock exchange as an exit route for the VC funds from their portfolio companies. As a result, regulation of the local stock exchange is not so important. “High development of ICT industry” has a strong influence on all market sides. “Developed VC ecosystem with consultants and business angels” has a strong influence on the supply and demand side and very close to strong on market activity. Other factors have moderate or close to moderate influence.
Table 13.
The subfactors related to infrastructure.
The impact of the group “environment for innovation” (Figure 4) is similar for all dimensions—with equal quartiles, median, min and max values, and outliers. The mean value also is similar for all—above moderate with the highest score for the demand.
Analysis of the group on the subfactor level reveals that most of the subfactors related to the environment for innovation have moderate influence (Table 14). Nevertheless, “High level of technology innovation” has strong influence on the demand side and close to strong on other dimensions. However, “high level of state R&D investments” has below-moderate influence on the total market activity. The rating of state R&D investments being not high is unexpected based on previous studies regarding the importance of state R&D investments [57,58]. The relatively low rating for q24_4 during interviews with experts was explained by the opinion that sometimes the state with its support for R&D investments is crowding out private investors.
Table 14.
The subfactors related to the environment for innovation.
The impact of the group “resources” (Figure 4) is similar for all dimensions—with equal quartiles, median, and min and max values. The mean value is also similar, around moderate with the highest score for the demand.
Analysis of the group on the subfactor level reveals that most, surprisingly, but the subfactor “high diversity of economically active persons (nationality, gender)” mean value is below moderate in all dimensions (Table 15). Standard deviation is high in all dimensions, showing a high dispersity of different experts’ rankings for this factor. The “high student rate” ranking is also below moderate regarding the supply side and market activity. Only subfactor “availability of technically skilled entrepreneurs and personnel” is regarded as having high influence for the demand side and above moderate for other dimensions.
Table 15.
The subfactors related to the human resources.
The impact of the group “macroeconomic conditions” (Figure 4) is similar for all dimensions—with equal quartiles, median, and min and max values. The mean value also is similar, close, or equal to the moderate with the highest score for the demand.
Analysis of the group on the subfactor level reveals that from macroeconomic conditions (Table 16), only “high GDP growth rate” and “high export level” appear to be important. As regards unemployment, which per some authors’ opinion [59] could be a reason for starting a business, it does not appear to be important, at least, seriously impacting VC market in the countries such as Latvia. Nevertheless, as the relationships between self-employment and unemployment are nonlinear and fraught with complexity [60], the survey results do not contradict the previous research. Additionally, high interest rates are not a reason why VC attracts more interest. It could even seem that in periods of high interest rates, entrepreneurs could be more interested in VC; the studies, for example from USA, do not validate this conclusion [36].
Table 16.
The subfactors related to the macroeconomic conditions.
4.5.3. Metagroup “Embedded Characteristics”
The values of the factors belonging to the metacategory “embedded characteristics” are in Figure 5.
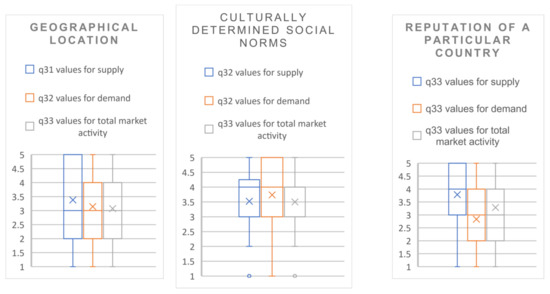
Figure 5.
Values of the factors belonging to the metacategory “embedded characteristics”.
The analysis (Figure 5) show that the mean value of the factor group “geographical location” for all dimensions (supply, demand, and total market activity) is above moderate, with the highest value for the supply. Additionally, min, max, and median values for all dimensions are the same. Nevertheless, the data of the supply are a litle bit skewed and as result 3rd quartile upper line reaches the highest possible rating, while for the demand and total market activity, it is on the “strong impact” level.
Analysis of the group on the subfactor level (Table 17) reveals that all subfactors’ mean value is fluctuating around moderate values. “Close location of a particular place to the country’s core economical regions” has a slightly below-moderate influence on the total market activity. During interviews, the experts explained that as Latvia is small, the location of nearly any place could be regarded as close to the core economical regions—thus, this subfactor is not so important in small countries such as Latvia. The subfactor’ “close location to the countries with high VC activity” value is closer to strong than moderate for the impact on the supply side.
Table 17.
The subfactors related to the geographical location.
Both subfactors from the group “culturally determined social norms” (Table 18) have above moderate, close-to-high, influence on all dimensions market dimensions.
Table 18.
The subfactors related to the human resources.
The subfactors from the group “reputation of a particular country” (Table 19) have close-to-high impact on the supply side. These factors are not so important for the demand side. Especially, “lack of restrictions/warnings from international organizations” is rated below moderate from the demand side perspective. Both subfactors have above-moderate influence on total market activity.
Table 19.
The subfactors related to the reputation of a particular country.
4.5.4. Model of VC Market Activity Development Dimensions
The analysis of mean values of the factor groups and subfactors’ impact on the Latvian VC market shows that subfactors in each of the metagroups have influence. Some subfactors have higher influence than others; still, there are no factors without influence.
There is a strong positive correlation between the factors’ influence on the different market sides (supply, demand, and total market activity). The exception is factor q12, where correlation between the supply and demand side, and supply and total market activity is below middle and with no statistical significance. For factor q33, correlation between the supply and demand side is medium, and statistical significance calculated by Spearman coefficient is doubtful. The correlation was measured by Spearman and Pearson correlation coefficients to provide robustness of the conclusions. No substantial differences in the correlation coefficients were obtained by the two methods. The correlation tables are provided in the Supplementary Materials (Table S2).
Because of the positive correlation of the factors between all dimensions, the authors propose to estimate the factors’ importance based on their highest rating in any of the market sides. For example, the impact mean value for the factor “reputation of the particular country” for the supply side is 3.79, for the demand side it is 2.83, and for total market activity it is 3.29. The authors propose the total ranking between the factors and subfactors influence to base on the highest rating of the factor in any of the market sides—for “reputation of the particular country”, it would be 3.79.
In line with that assumption, the authors grouped all subfactors in the order of importance. The subfactors with mean value below moderate in all dimensions of the market were excluded from the list. The list is provided in Table 20.
Table 20.
Subfactors with substantial impact on the VC market listed in the order of importance.
After exclusion of the subfactors with little impact, there are 63 subfactors important for Latvian and similar countries’ VC market development. The number and structure of the factor groups (12) and the metagroups (3) are the same as after the literature analysis. The authors propose to see VC market activity development as in Figure 6.
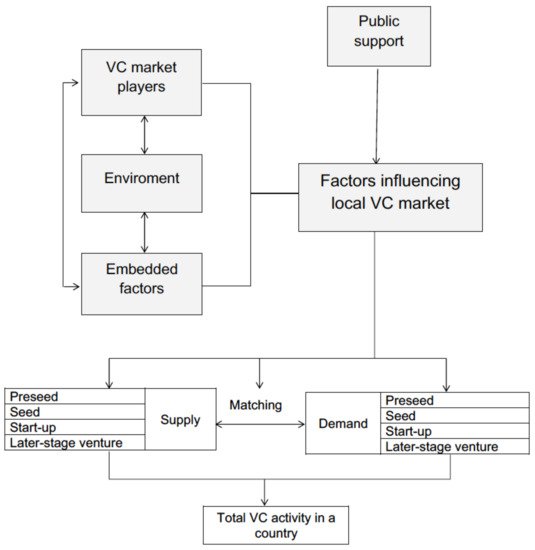
Figure 6.
Conceptual model of VC market activity development dimensions.
Public support to build a self-sustainable VC market should be provided on all metagroups and factor groups’ level, as in Figure 6. As public support is limited, it should concentrate on those subfactors from the particular group that revealed the largest influence on the market during the study (Table 20).
5. Discussion
The study revealed that 63 subfactors are important for VC market development in small countries with underdeveloped markets.
The most important subfactors from the factor group “factors related to VC firms” are “high investment returns of VC firms”; “existence of foreign VC firms in a market”; “high total amount of available capital from VC firms in a market”; “existence of publicly co-financed VC firms in a market”. The appearance of these factors as most important is not surprising. Previous studies [15,18,61,62] confirm the relevance of these factors in all VC markets, even more mature markets.
The most important subfactors from the factor group “factors related to investors in VC funds” are “diversified and robust institutional investor base” and “existence of successful entrepreneurs from prior generations”. This result is also consistent with previous studies [48,61].
The most important subfactors from the factor group “factors related to entrepreneurs” are “high number of entrepreneurs seeking VC” and “awareness of the added value from VC between entrepreneurs/potential entrepreneurs”. This finding is also unsurprising and consistent with previous studies [18,63].
The most important subfactors from the factor group “legal environment” are “internationally harmonized and stable regulation for securities, bankruptcy, labor, and tax” and “broad limits for VC funds (size of the investment; geography; focus; lifespan of the fund; risk profile)”. The first subfactor is found to also be important in mature markets [64]. The broad limits of VC funds are a recommendation constantly put forward by VC specialists [3] when advising the design of public support for VC programs.
The most important subfactors from the factor group “government policies” are “providing public funding for VC funds” and “programs encouraging entrepreneurship”. The importance of governmental inflows in VC funds and support with entrepreneurship encouragement programs is admitted by the previous studies [23,65].
The most important subfactors from the factor group “infrastructure” are “high development of ICT industry” and “developed VC ecosystem with consultants and business angels”. This finding is also in conformity with previous studies [57,62].
The most important subfactor from the factor group “environment for innovation” is “high level of technology innovation”. This subfactor is admitted to also be important for VC market in other unmatured markets [66]. Even open innovation is regarded as a vital part of innovativeness culture; the degree it is used in the VC industry has been vaguely researched before. Therefore, the design of this study based on the previous research did not lead to direct questions regarding open innovation and VC market interactions. The outcomes of the study show that innovativeness has above the moderate influence on all VC market sides. As increasing the innovativeness is one direction of letting the VC market approach the self-sustainability status, a separate study to explore the possibility of increasing dynamics between open innovation and VC market participants would be necessary.
The most important subfactor from factor group “resources” is “availability of technically skilled entrepreneurs and personnel”. Surprisingly, “high diversity of economically active persons (nationality, gender)” was not ranked as important in the study.
The subfactors from the factor group “macroeconomic conditions” are “high GDP growth rate” and “high export level”. These subfactors are also admitted to be important for VC market in previous studies [49,66].
From the factor group “geographical location”, as predicted by the previous studies [67], the factor “close location to the countries with high VC activity” is important. “Close location of a particular place to the country’s core economical regions” has only moderate importance, which could be explained by the small size of Latvia.
From the factor group “culturally determined social norms” “high level of risk and uncertainty toleration” and “tendency towards cooperation and trust” are both important.
From the factor group “reputation of a particular country” “public image of a particular country” is important. “Lack of restrictions/warnings from international organizations” is more important for the supply side than the demand side of the VC market.
The subfactors are grouped into twelve factor groups and three metagroups: (i) VC market participants; (ii) environment; (iii) embedded characteristics. In each of the factor groups and metagroups are subfactors with a strong impact on the VC market development. The results confirm the necessity stressed by other authors [3,68] to skip away from just providing public funding to VC funds to developing overarching governmental policy for the development of the self-sustainable VC market. The conceptual model of VC market activity development dimensions proposed by the authors and the subfactors with substantial impact list could be a useful tool for politicians for further governmental support design. The public support should be provided on all metagroups dimensions but focusing on the subfactors with the largest influence.
An additional study is necessary to evaluate the possibility for a government to influence the exposure of the subfactors. For example, the subfactors from the factors’ group “resources” are possible to influence by the government activities [69]. However, it would be doubtful if a government could change the subfactor’s “close location to the countries with high VC activity” exposure. For a particular market, collecting data on the performance of the degree to which the local government is using its possibility to influence the subfactors would be advisable. With such data importance, performance matrix analysis could be possible, and the results of it would provide clearer directions regarding which of the important subfactors are left out of the necessary attention and, in contrast, which subfactors could be disregarded.
Supplementary Materials
The following are available online at https://www.mdpi.com/article/10.3390/joitmc7040218/s1, Table S1: The factors influencing VC supply, demand and total market activity, Table S2: Correlations between factors exposure on the supply, demand side and matching.
Author Contributions
Conceptualization, N.L. and A.M.; methodology, A.M. and N.L.; validation, A.M.; investigation, A.M.; writing—original draft, A.M.; project administration, N.L.; supervision, N.L.; funding acquisition, N.L. All authors have read and agreed to the published version of the manuscript.
Funding
Funding: This paper was presented as a keynote speech of SOI 2021, and the publishing fee of this paper was funded by SOI 2021-1.
Institutional Review Board Statement
Not applicable.
Informed Consent Statement
Not applicable.
Data Availability Statement
Any data not provided in the article and supplementary materials can be requested by email to matisone.anita@gmail.com.
Conflicts of Interest
The authors declare no conflict of interest. The funders had no role in the design of the study; in the collection, analyses, or interpretation of data; in the writing of the manuscript; or in the decision to publish the results.
References
- Andrieu, A.P.; Groh, G. Entrepreneurs’ financing choice between independent and bank-affiliated venture capital firms. J. Corp. Financ. 2012, 18, 1143–1167. [Google Scholar] [CrossRef]
- Cassar, G. The financing of business start-ups. J. Bus. Ventur. 2004, 19, 261–283. [Google Scholar] [CrossRef]
- Lerner, J.; Moore, D.; Shepherd, S. A study of New Zealand’ s Venture Capital Market and Implications for Public Policy. 2005. Available online: www.lecg.com (accessed on 15 March 2021).
- Hellmann, M.; Puri, T. Venture capital and the professionalization of start-up firms: Empirical evidence. J. Financ. 2002, 57, 169–197. Available online: http://leeds-faculty.colorado.edu/Bhagat/VC-ProfessionalizationStartup.pdf (accessed on 15 March 2021). [CrossRef]
- Demirel, P.; Danisman, G.O. Eco-innovation and firm growth in the circular economy: Evidence from European small- and medium-sized enterprises. Bus. Strat. Environ. 2019, 28, 1608–1618. [Google Scholar] [CrossRef]
- Pinkow, F.; Iversen, J. Strategic Objectives of Corporate Venture Capital as a Tool for Open Innovation. J. Open Innov. Technol. Mark. Complex. 2020, 6, 157. [Google Scholar] [CrossRef]
- Lerner, J.; Nanda, R. Venture Capital’s Role in Financing Innovation: What We Know and How Much We Still Need to Learn. J. Econ. Perspect. 2020, 34, 237–261. [Google Scholar] [CrossRef]
- Bertoni, F.; Marti, J.; Reverte, C. The impact of government-supported participative loans on the growth of entrepreneurial ventures. Res. Policy 2019, 48, 371–384. [Google Scholar] [CrossRef]
- Lerner, J. The future of public efforts to boost entrepreneurship and venture capital. Small Bus. Econ. 2010, 35, 255–264. [Google Scholar] [CrossRef]
- Bilbao-Osorio, B.; Burkhardt, K.; Correia, A.; Deiss, R.; Lally, D.; Martino, R.; Rueckert, E.; Senczyszyn, D.; Criscuolo, C.; Veugelers, R.; et al. Science, Research and Innovation Performance of the EU 2018 Strengthening the Foundations for Europe’s Future European Commission Directorate-General for Research and Innovation Directorate A—Policy Development and Coordination. 2018. Available online: https://op.europa.eu/en/publication-detail/-/publication/16907d0f-1d05-11e8-ac73-01aa75ed71a1/language-en (accessed on 15 March 2021).
- Aulakh, S.; Thorpe, L.; BIS Equity Finance Programmes Qualitative Reviews of: A) UKHTF and b) The Bridges Fund. Ekogen Report to the Department for Business Innovation and Skills. 2011. Available online: https://assets.publishing.service.gov.uk/government/uploads/system/uploads/attachment_data/file/32220/11-1009-bis-equity-finance-qualitative-reviews-ukhtf-bridges.pdf (accessed on 15 March 2021).
- Grilli, L.; Mrkajic, B.; Latifi, G. Venture capital in Europe: Social capital, formal institutions and mediation effects. Small Bus. Econ. 2018, 51, 393–410. [Google Scholar] [CrossRef]
- European Commission. An SME Strategy for a Sustainable and Digital Europe; European Commission: Brussels, Belgium, 2020. [Google Scholar]
- European Court of Auditors. Centrally Managed EU Interventions for Venture Capital: In Need of More Direction. 2019. Available online: https://www.eca.europa.eu/en/Pages/DocItem.aspx?did=51616 (accessed on 15 March 2021).
- Hellmann, T.; Thiele, V. Fostering Entrepreneurship: Promoting Founding or Funding? Manag. Sci. 2019, 65, 2502–2521. [Google Scholar] [CrossRef]
- Harding, R. Plugging the knowledge gap: An international comparison of the role for policy in the venture capital market. Ventur. Cap. 2002, 4, 59–76. [Google Scholar] [CrossRef]
- Romain, A.; de la Potterie, B.V. The Determinants of Venture Capital: A Panel Data Analysis of 16 OECD Countries; Universite Libre de Bruxelles: Brussels, Belgium, 2004. [Google Scholar]
- Cipollone, A.; Giordani, P.E. Market frictions in entrepreneurial innovation: Theory and evidence. J. Econ. Behav. Organ. 2019, 163, 297–331. [Google Scholar] [CrossRef]
- Bertoni, F.; D’Adda, D.; Grilli, L. Self-selection of entrepreneurial firms in thin venture capital markets: Theory and empirical evidence. Strat. Entrep. J. 2019, 13, 47–74. [Google Scholar] [CrossRef]
- Wishlade, F.; Michie, R.; Familiari, G.; Schneiderwind, P.; Resch, A. Ex-Post Evaluation of Cohesion Policy Programmes 2007-13, Focusing on the European Regional Development Fund (ERDF) and Cohesion Fund (CF); Publications Office of the European Union: Luxembourg, 2016. [Google Scholar]
- Invest Europe. Private Equity Activity 2020. 2021. Available online: www.investeurope.eu (accessed on 20 May 2021).
- Giraudo, E.; Giudici, G.; Grilli, L. Entrepreneurship policy and the financing of young innovative companies: Evidence from the Italian Startup Act. Res. Policy 2019, 48, 103801. [Google Scholar] [CrossRef]
- Owen, R.; Mason, C. Emerging trends in government venture capital policies in smaller peripheral economies: Lessons from Finland, New Zealand, and Estonia. Strat. Chang. 2019, 28, 83–93. [Google Scholar] [CrossRef]
- Matisone, A.; Lace, N. The Impact of Public Interventions on Self-Sustainable Venture Capital Market Development in Latvia from the Perspective of VC Fund Managers. J. Open Innov. Technol. Mark. Complex. 2020, 6, 53. [Google Scholar] [CrossRef]
- Hyman, D.N. Public Finance: A Contemporary Application of Theory to Policy; Cengage Learning: Boston, MA, USA, 2010. [Google Scholar]
- Williamson, O.E. The New Institutional Economics: Taking Stock, Looking Ahead. J. Econ. Lit. 2000, 38, 595–613. [Google Scholar] [CrossRef]
- Boocock, M.; Woods, G. The evaluation criteria used by venture capitalists: Evidence from a UK venture fund. Int. Small Bus. J. 1997, 16, 36–57. [Google Scholar] [CrossRef]
- Ibrahim, D.M. Public or Private Venture Capital? Washingt. LAW Rev. 2019, 94, 1137–1174. Available online: https://digitalcommons.law.uw.edu/cgi/viewcontent.cgi?article=5077amp;=amp;context=wlramp;=amp;sei-redir=1amp;referer=https%253A%252F%252Fscholar.google.com%252Fscholar%253Fq%253Drelated%253AOWFTF994u20J%253Ascholar.google.com%252F%2526scioq%253DIbrahim%252C%252BD.%252B (accessed on 15 February 2021). [CrossRef]
- Baldock, R.; Mason, C. Establishing a new UK finance escalator for innovative SMEs: The roles of the Enterprise Capital Funds and Angel Co-Investment Fund. Ventur. Cap. 2015, 17, 59–86. [Google Scholar] [CrossRef]
- Da Rin, M.; Nicodano, G.; Sembenelli, A. Public policy and the creation of active venture capital markets. J. Public Econ. 2006, 9, 1699–1723. [Google Scholar] [CrossRef]
- Parhankangas, A. The economic impact of venture capital. In Handbook of Research on Venture Capital: Volume 2; Edward Elgar Pub: Cheltenham, UK, 2012; pp. 124–158. [Google Scholar]
- Invest Europe. Investing in Europe: Private Equity Activity 2019. 2020. Available online: https://www.investeurope.eu/search/?q=Private+Equity+Activity+2019 (accessed on 15 March 2021).
- Armour, J.; Cumming, D. The legislative road to Silicon Valley. Oxf. Econ. Pap. 2006, 58, 596–635. [Google Scholar] [CrossRef]
- Groh, A.P.; Wallmeroth, J. Determinants of venture capital investments in emerging markets. Emerg. Mark. Rev. 2016, 29, 104–132. [Google Scholar] [CrossRef]
- Li, Y.; Zahra, S.A. Formal institutions, culture, and venture capital activity: A cross-country analysis. J. Bus. Ventur. 2012, 27, 95–111. [Google Scholar] [CrossRef]
- Gompers, J.; Lerner, P.A. What drives venture capital fundraising? Natl. Bur. Econ. Res. 1998, 1998, w6906. [Google Scholar]
- Kraemer-eis, H.; Lang, F. Guidelines for SME Access to Finance Market Assessments. 2014. Available online: http://www.eif.org/news_centre/publications/eif_wp_22_gafma_april14_fv.pdf (accessed on 20 May 2021).
- Jeng, L.A.; Wells, P.C. The determinants of venture capital funding: Evidence across countries. J. Corp. Finance 2000, 6, 241–289. [Google Scholar] [CrossRef]
- Johansson, J.; Malmström, M.; Wincent, J.; Parida, V. How individual cognitions overshadow regulations and group norms: A study of government venture capital decisions. Small Bus. Econ. 2021, 56, 857–876. [Google Scholar] [CrossRef]
- Gantenbein, P.; Kind, A.; Volonté, C. Individualism and Venture Capital: A Cross-Country Study. Manag. Int. Rev. 2019, 59, 741–777. [Google Scholar] [CrossRef]
- Alperovych, Y.; Groh, A.; Quas, A. Bridging the equity gap for young innovative companies: The design of effective government venture capital fund programs. Res. Policy 2020, 49, 104051. [Google Scholar] [CrossRef]
- Lerner, J. Government Incentives for Entrepreneurship. In Government Incentives for Entrepreneurship. Working Paper 26884; National Bureau of Economic Research: Boston, MA, USA, 2020. [Google Scholar] [CrossRef]
- Wilson, K.E.; Silva, F. Policies for Seed and Early Stage Finance. In OECD Science, Technology and Industry Policy Papers; OECD: Paris, France, 2013. [Google Scholar] [CrossRef]
- Matisone, A.; Lace, N. Entrepreneurs’ and Venture Capitalists’ openness for cooperation: Barriers and drivers. In Proceedings of the IMCIC 2019—10th International Multi-Conference on Complexity, Informatics and Cybernetics, Orlando, FL, USA, 12–15 March 2019; Volume 1. [Google Scholar]
- Williamson, O.E. Transaction Cost Economics: How It Works; Where It is Headed. De Econ. 1998, 146, 23–58. [Google Scholar] [CrossRef]
- Yin, R.K. Qualitative Research from Start to Finish, 2nd ed.; The Guilford Press: New York, NY, USA, 2016. [Google Scholar]
- Lerner, J.; Leamon, A.; Garcia-Robles, S. Best Practice in Creating a Venture Capital Ecosystem. 2015, p. 100. Available online: http://www.ttaturkey.org/upload/articles-useful-links/Best_Practices_Creating_VC_Ecosystem.pdf (accessed on 15 March 2021).
- Migendt, M.; Polzin, F.; Schock, F.; A Täube, F.; Von Flotow, P. Beyond venture capital: An exploratory study of the finance-innovation-policy nexus in cleantech. Ind. Corp. Chang. 2017, 26, 973–996. [Google Scholar] [CrossRef]
- Baldock, R. An assessment of the business impacts of the UK’s Enterprise Capital Funds. Environ. Plan. C Gov. Policy 2016, 34, 1556–1581. [Google Scholar] [CrossRef]
- Prohorovs, A. Attraction of investments into venture capital and private equity funds of Latvi. Econ. Sci. Rural. Dev. Conf. Proc. 2013, 30, 1–9. [Google Scholar]
- Conti, A.; Thursby, M.; Thursby, J. Patents as signals for startup financing. J. Ind. Econ. 2013, 61, 592–622. [Google Scholar] [CrossRef]
- Hochberg, Y.V.; Serrano, C.J.; Ziedonis, R.H. Patent collateral, investor commitment, and the market for venture lending. J. Financ. Econ. 2018, 130, 74–94. [Google Scholar] [CrossRef]
- Alsos, G.A.; Ljunggren, E. The role of gender in entrepreneur–investor relationships: A signaling theory approach. Entrep. Theory Pract. 2017, 41, 567–590. [Google Scholar] [CrossRef]
- Coleman, J.; Cotei, S.; Farhat, C. The debt-equity financing decisions of US startup firms. J. Econ. Financ. 2016, 40, 1. [Google Scholar] [CrossRef]
- Hoppmann, J.; Vermeer, B. The double impact of institutions: Institutional spillovers and entrepreneurial activity in the solar photovoltaic industry. J. Bus. Ventur. 2020, 35, 105960. [Google Scholar] [CrossRef]
- Liu, T.; Cao, B.; Johan, J.; Leng, S. The real effect of liquidity provision on entrepreneurial financing: Evidence from a natural experiment in China. Eur. J. Financ. 2019, 25, 568–593. [Google Scholar] [CrossRef]
- Juha, S.; Kari, V. Development Trajectory of An Innovation-Based Environmental Technology Start-Up. Int. J. Innov. Econ. Dev. 2017, 3, 99–112. [Google Scholar] [CrossRef][Green Version]
- Jin, S.; Lee, K. The Government R&D Funding and Management Performance: The Mediating Effect of Technology Innovation. J. Open Innov. Technol. Mark. Complex. 2020, 6, 94. [Google Scholar] [CrossRef]
- Parker, S.C. The Economics of Self-Employment and Entrepreneurship; Cambridge University Press (CUP): Cambridge, UK, 2004. [Google Scholar]
- Audretsch, D.B.; Carree, M.A.; Thurik, A.R. Does Entrepreneurship Reduce Unemployment; Tinbergen Institute Discussion Paper No. 01-074/3; Tinbergen Institute: Amsterdam, The Netherlands, 2002; Available online: http://hdl.handle.net/10419/85927%0AStandard-Nutzungsbedingungen: (accessed on 5 March 2021).
- Harrison, R. Crossing the chasm: The role of co-investment funds in strengthening the regional business angel ecosystem. Small Enterp. Res. 2018, 25, 3–22. [Google Scholar] [CrossRef]
- Harrison, R.T.; Yohanna, B.; Pierrakis, Y. Internationalisation and localisation: Foreign venture capital investments in the United Kingdom. Local Econ. J. Local Econ. Policy Unit 2020, 35, 230–256. [Google Scholar] [CrossRef]
- Weigand, C. Beyond the finance paradigm: The entrepreneurial logic of financial resource acquisition from an effectuation perspective. J. Entrep. Ventur. 2019, 11, 440–460. [Google Scholar] [CrossRef]
- Lerner, J. Boulevard of Broken Dreams. Why Public Efforts to Boost Entrepreneurship and Venture Capital Have Failed-and What to Do about It; Princeton University Press: New York, NY, USA, 2009. [Google Scholar]
- Standaert, T.; Manigart, S. Government as fund-of-fund and VC fund sponsors: Effect on employment in portfolio companies. Small Bus. Econ. 2018, 50, 357–373. [Google Scholar] [CrossRef]
- Ning, Y.; Xu, G.; Long, Z. What drives the venture capital investments in China? Chin. Manag. Stud. 2019, 13, 574–602. [Google Scholar] [CrossRef]
- Prohorovs, A.; Pavlyuk, D. Analysis of Economic Factors Influencing Venture Capital Investment in European Countries. Soc. Res. 2013, 4, 33. [Google Scholar]
- Martin, R.; Berndt, C.; Klagge, B.; Sunley, P. Spatial Proximity Effects and Regional Equity Gaps in the Venture Capital Market: Evidence from Germany and the United Kingdom. Environ. Plan. A Econ. Space 2005, 37, 1207–1231. [Google Scholar] [CrossRef]
- Zaborovskaia, O.; Nadezhina, O.; Avduevskaya, E. The Impact of Digitalization on the Formation of Human Capital at the Regional Level. J. Open Innov. Technol. Mark. Complex. 2020, 6, 184. [Google Scholar] [CrossRef]
Publisher’s Note: MDPI stays neutral with regard to jurisdictional claims in published maps and institutional affiliations. |
© 2021 by the authors. Licensee MDPI, Basel, Switzerland. This article is an open access article distributed under the terms and conditions of the Creative Commons Attribution (CC BY) license (https://creativecommons.org/licenses/by/4.0/).