Abstract
This paper addresses the issue of catching and convergence at the level of firms, and investigates whether Korean firms tend to converge toward mature firms represented by the US firms in terms of their behavior and performance as well as firm-level innovations systems. It conducts regression analyses of several behavior and performance variables, using the data of the Korean and US firms during the 1990s, the 2000s, and 2010s. It finds some evidence of convergence, such that Korean firms become more profitability- rather than growth-oriented, borrowing and investing less, and thus being less indebted. However, they have not changed much in terms of their behavior toward firm values and dividend tendencies. Further analyses, using the patent-derived, innovation system variables, also confirm some aspects of convergence, compared with the early results, for which self-citations become significant and positive for firm values; furthermore, the variable of cycle time of technology is no longer significant for profitability, which is consistent with the results from the US firms. Meanwhile, changes in corporate governance associated with the rise of foreign shareholder are also shown to have resulted in higher profitability but insignificant change in firm values. An emerging conclusion is an ongoing but partially completed process of convergence.
1. Introduction
With its dramatic political and economic transformation since the end of colonial rule by Japan in 1945, Korea is now regarded as an exceptional latecomer country that has established itself as a full-fledged democratic market economy. However, this process has not been even in the sense that the country experienced decades of political authoritarianism and a government-led economy [1,2,3] as well as the 1997 financial crisis [4,5]. Korea’s achievement is often encapsulated in the term “catching up,” which is derived from Abramovitz’s seminal article [6], “Catching-up, forging ahead and falling behind.” If catching up is defined as closing the gap between the current state and the benchmark [7], Korea is an example of a successful catch up that joined a group of wealthy nations called the Organization for Economic Cooperation and Development (OECD) in 1996. It reached the income level of high-income countries, such as Japan or UK in PPP-based per capital incomes.
The country now faces serious challenges of growth slowdown, rapid aging, and rising income inequality between the rich and poor, which appear quite similar to the typical situations in advanced or mature economies. If these challenges become permanent features of Korea, then it signals the end of East Asian capitalism or ‘East Asian miracle’ [8], which is characterized by high growth and low inequality; instead, a convergence toward the Anglo–Saxon capitalism characterized by low growth and high inequality is anticipated [9]. Accordingly, the time has come to switch our focus from the past catch-up and post-catch-up frameworks to the new and futuristic focus on the convergence and divergence framework [5].
In this regard, one useful piece of literature is the perspective of Varieties of Capitalism (VoC) pioneered by Hall and Soskice [10]. It identifies several representative types of capitalism, such as liberal market economies (LMEs), coordinated market economies (CMEs), and mixed market economies (MMEs). If Korea can now be classified in the same group as the United States (US), United Kingdom (UK), or LMEs in terms of performance measures of economic growth and income inequality as Lee and Shin [9] verified by a cluster analysis, then this shocking result raises an important puzzle of how Korea can thus be classified despite the possible existing differences in its underlying institutions, such as national innovation systems, corporate governance, financial system, and the role and power of the government. Indeed, whereas several authors [11,12,13,14] have argued for some tendency of convergence, and observed that the changing external and internal circumstances have diminished the developmental states’ capacities to devise and execute coherent techno-industrial strategies, others argued that a continuity of East Asian capitalism remains in several aspects [15,16,17].
This potential mismatch or tension between underlying institutions and outcome variables (growth and income inequality) underscores the need to re-examine the continuity and change in capitalism in Korea. One reason explaining Korea’s ability to overcome the middle-income trap (MIT) and join the OECD is the increasingly high R & D investment that has existed since the mid-1980s [18], which highlights the importance of examining the country’s national innovation systems (NIS). NIS is a key concept in Schumpeterian economics, which posits that differences in such systems among countries tend to result in differences in innovation and economic performance. This concept is defined as the “elements and relationships, which may interact with the production, diffusion and use of new and economically useful knowledge” [19]. If NIS is considered a set of institutions related to innovation, then it can also be considered a part of diverse institutions that may underpin diverse types of capitalism or VoC.
Lee [18] investigated the major characteristics of the catch-up stage by comparing the NIS of South Korea and Taiwan with those of other developing and developed countries, verifying the link between the NIS and economic growth in terms of per capita income growth. In country-level empirical studies, Chapter 3 of Lee [18] and Lee et al. [20] demonstrate a significant correlation existing between having more patent applications in fields related to short cycle time of technologies (CTT) and a higher per capita income growth rate in East Asia. This pattern of unbalanced NIS and growth mechanism is in sharp contrast with a more balanced NIS and growth mechanism, which prevails in high-income countries with economic growth showing a positive correlation with a specialization in technologies with long CTT.
Most recently, Lee and Lee [21] confirm the changing nature of NIS in Korea and Taiwan since the 2000s or the post-catch-up stage, such that these two economies are moving away from sectors based on short-cycle technologies to sectors based on long-cycle technologies, trying to make their industry more balanced than before. Thus, their NIS is becoming similar to advanced or mature NIS characterized by all equally high values of knowledge localization, originality, technological diversification, de-concentration of assignees, and CTT. Their study thus verifies the so-called “detour” hypothesis, which posits that a successful catching-up economy executes a technological detour of initially specializing in short CTT sectors and later turning to challenging or long cycle technology-based sectors. This study also confirms a positive relationship between long cycle technologies and economic growth in Korea and Taiwan for the post-catch-up stages or since the 2000s.
The current study takes up the same issue of catching and convergence now at the level of firms, and investigates whether Korean firms tend to converge toward mature firms represented by the US firms. Convergence is analyzed in two dimensions. First, in terms of conventional accounting variables, the paper will ask whether the Korean firms tend to keep the old behavior of high growth with low profitability and firm values or now switch to emphasize profitability and firm values, as is the case with the US firms. Second, in terms of innovation system variables, it will verify whether the Korean firms continue to pursue a niche-based strategy for profitability by specializing in short CTT, or have stopped such strategy.
This question of convergence is important because firms are real entities in charge of actual innovation activities, and some correspondence is necessary between country- and firm-level patterns. In fact, the Korean firms led by the family-controlled conglomerates (chaebols) have gone through radical reforms in corporate governance as imposed by the International Monetary Fund (IMF) during the 1997 Asian financial crisis [22,23]. Relatedly, a major stem of the Korean corporate change that emerged after the crisis was the transplantation of global standards into the Korean economy, and the global standard which Korean companies had to accept at the time was largely a U.S.-based shareholder capitalism. Particularly, opening to foreign investment led to considerable exposure to the influence of foreign investment capital, especially the U.S. investment capital, which pursues shareholder value. For instance, shares of foreign stockholders skyrocketed from less than 3% to 40% in the post-crisis period, which implies the possibility of increasing voices of foreign investors in matters related to management decision-making [5,24]. Actually, Kim and Cho [24] confirms a negative relationship between the foreign shares and firm’s fixed investment.
Thus, this paper begins by first looking at conventional accounting variables to see if any significant change occurred over the period from the 1990s (pre-crisis) to the 2000s and 2010s. Thus, changes in Korean companies are evaluated through relative comparisons with the US firms. Second, and more importantly, this paper examines the change in firm-level innovation systems in Korea and investigates whether the Korean system is now converging to that of the US. In this analysis, the benchmark is the results in Chapter 5 of Lee [18] that the Korean firms tend to borrow more, invest more, and thus tend to grow faster but end up with low profitability and firm values than the US firms. Moreover, their innovation system in the 1990s was quite different from the US firms as Korean firms sought a niche-based strategy for profitability by specializing in short CTT, and their technological capability represented by self-citation is too low to be significantly affecting firm-values.
While various factors must have been involved during the transition in corporate Korea, this paper focuses on the innovation aspect of the firms. Then, the empirical analysis in this paper will confirm a thesis of “an ongoing but partially completed process of convergence.” Such pattern will be supported by showing that the Korean firms now borrow less, invest less, grow slowly, and thus achieve high profitability; however, their values in stock markets are not as high as those of the US firms, and it finds no significant linkage between (short or long) CTT and firm profitability but a significant linkage from higher self-citation to firm values, which is the pattern of the US firms in the 1990s according to Chapter 5 of Lee [18].
In what follows, Section 2 provides some more discussions of the related literature and hypothesis for the empirical analysis. Section 3 discusses the method for econometric analysis and the data for the analysis. Section 4 presents the results of the regression analyses of the convergence in terms of the account variables, such as investment ratio, borrowing tendency, and sales growth. Section 5 analyzes how the innovation system of Korean companies has changed since the 1990s as well as the effect of the innovation system variables on the performance of the companies. Section 6 presents a summary and concluding remarks.
2. From Catching Up to Convergence: The Literature and Hypothesis
2.1. Difference between the Catching-Up Firms and the Advanced/Mature Firms
Penrose [25] proposed the resource-based view of firm growth, defining the firm as “a collection of resources bound together in an administrative framework, the boundary of which is determined by the area of ‘administrative coordination’ and ‘authoritative communication’.” Here, the word, resources, refers to competence or capabilities. In this theory, looking at the firm as a bundle of resources (or capabilities), performance and growth of firms depend on what kinds and how much of these diverse resources it commands and can utilize for its growth.
Taking the resource-based view of the firm [25], Mathews [26] conceptualizes firms from emerging or latecomer economies as “resource-poor late entrants.” The aspect of “resource-poor” implies that one of the most fundamental differences between firms in the advanced and in developing economies is that the former internally has diverse resources available from other firms or from the context, whereas the latter does not have these critical resources. Thus, the main task of the firms in developing economies is not only how to utilize the existing resources optimally but also to acquire the lacking resources and improve their availability over the course of the firm’s life [7]. Thus, profit is sought not only to distribute back to the shareholders, but, more importantly, to be used for further expansion of the firm’s resources. Alternately, accounting profitability might be lower owing to the additional “growth costs” borne by the firms from developing countries. Growth costs would include the costs spent to increase capabilities of workers, managers, R&D team, and brand power. This line of thought is consistent with a reasoning and verification in Lee [18] that the (Korean) firms from the latecomer or catching-up countries pursue more growth than short-run profitability, compared with the (US) firms in advanced economies which are more pressured to pursue profits to be redistributed to shareholders.
With regard to firms from the latecomer economies, another important strand of research has been done with focus on business groups. Defined as a collection of firms bound together by equity ties and often under centralized family ownership and control, business groups have been observed as more common in the latecomer economies, and their existence has been interpreted as a reflection of a high degree of market failure in their economies [27,28,29]. The empirical literature using the data of Korean firms finds that, in the 1990s, Korean Chaebols firms prioritized growth and profit stability over profit maximization, over-invested in low-return businesses, cross-subsidized the low-performing affiliates of their group, possessed greater debt capacity, and consequently enjoyed lower tax burdens in the 1990s; however, in the 2000s, they tend to show higher profitability by refraining from excessive investment, from cross-subsidizing, to be less indebted, and to pay comparable taxes [22,30]. Cheong et al. [31] observe that business groups have certain advantages, such as resource-sharing advantage [32], in financing new investment; thus, they verify that business group firms borrow more and invest more, leading to faster growth; their profit margin on sales is higher, but profits on investment may be lower than stand-alone firms.
While the majority of empirical research uses the data of firms from emerging economies, the work of Lee [18] is one of the first research works that directly use the data of both firms from an emerging economy (Korea) and advanced economy (US) and compares directly their differences. Chapter 5 of Lee [18] verifies, using the data of the 1990s, that the catching-up firms (Korean firms) tend to pursue sales growth by borrowing and investing more, while the advanced country firms (US firms) tend to pursue profitability and firm values in stock markets. The first task in the current paper is to test whether these differences between the Korean firms and US firms remain the same or have changed in more recent periods in the 2000s and 2010s. If the behavior and performance of the Korean firms have become more similar to that of the US firms, it signifies maturing and thus convergence of the catching-up firms toward the firms in advanced countries.
While some aspects of such change have been reported by Lee et al. [22] using the 2000s data, the current study provides a more updated and comprehensive analysis and evidence using the more recent data of the 2010s and also by looking at innovation variables. The next subsection will discuss further on this aspect, which is the second task of this paper as an updated replication of the analysis in Lee [18].
2.2. Convergence of Firm-Level Innovation Systems in Korea: CTT and Self-Citations
While the literature on innovation systems tends to focus on national or sectoral level, one can use the same variables measured at firm levels to analyze the firm-level innovation system as has been done in Chapter 5 of Lee [18]. Such extension is consistent with Schumpeterian theory of firms, discussed in Winter [33] and Nelson [34,35,36], that emphasizes the heterogeneity of firms and considers knowledge and imperfect learning as one source of inter-firm heterogeneity. Given such emphasis on the knowledge base or innovation systems of firms, this study follows Chapter 5 of Lee [18] to adopt several quantitative expressions of various aspects of the knowledge base of firms so that they may reveal the changing behavior and performance of the Korean firms. These knowledge-related variables are indicators of the nature of the knowledge pool each firm utilizes for its innovation and other activities. The property of the knowledge base thus relates to the firm-level innovation system underpinning the innovative activities of a firm.
In the current study, which focuses on catching-up firms, we deal with the aspects of knowledge that are shown to be markedly different between advanced and catching-up firms. This study follows Lee [18] to consider the following variables of the CTT, self-citation (intra-firm creation and diffusion of knowledge), technological diversification, and originality, to investigate the linkage from these variables to firm behavior and performance. Aldieri, et al. [37] also use the variable of technological diversification to find its impacts on firms’ technical efficiency. Among them, we are particularly interested in the first two variables.
The first focal variable is the variable of CTT, which can be defined as the average of the mean backward citation lag between citing and cited patents. Mean backward citation lag is the time difference between the application year of citing and cited patent [38]. A long cycle time means a lower speed of change in technology. A sector-level analysis by Park and Lee [39] finds that technological catch up tends to occur in sectors with shorter cycle time, whereas advanced countries tend to be dominant in long cycle technology- based sectors. The firm-level analysis in Lee [18] finds that catching-up firms tend to specialize more in short-cycle technologies, which also lead to higher profitability because short CTT means less need to rely on old stocks of knowledge of which the patent rights are owned and dominated by the incumbent. Accordingly, the latecomers may avoid direct competition and rivalry with incumbents and find niches to avoid competing in the same markets. In other words, the latecomer firms that tend to conduct innovation rely on more recent technologies than the incumbents.
Specifically, it was shown for the Korean and the U.S. companies in the 1990s that short CTT specialization had a significantly positive effect on Korean firms’ performance but not significant to the US firms because the US firms or advanced firms do not have to find a niche in such short CTT. Thus, if the Korean firms became similar in the 2000s or 2010 to the US firms and command more diverse patent folio in diverse sectors, their profitability would also be less affected by CTT as in the US firms. The empirical analysis in Section 4 will test this hypothesis.
The second focal variable is that of self-citations in the Korean firms. The ratio of self-citation at the sector level represents appropriability, namely, the capability to protect one’s innovations from being copied by others and thus monopolize profits from the innovation [40]. By contrast, self-citation at the firm level is the degree to which the innovation of a firm builds upon its accumulated knowledge pool. In general, the literature finds that the more advanced or older the firm is, the higher its patent self-citation ratio or that self-citation can be a measure of technological capabilities, which is confirmed by comparing Samsung with Sony [41] and Huawei with Ericsson [42]. Actually, Lee [18] finds that self-citation ratios are higher in the US firms than in Korean firms and they have a significantly positive effect on firm performance (firm values) in the US firms, whereas such was not the case for Korean companies. Then, if the Korean firms have become similar to the US firms over time, we may hypothesize that the self-citation ratio must have increased in the Korean firms and should have a significant impact on firm performance, particularly firm values.
In summary, the hypothesis can be summarized as follows: If Korean firms had entered the convergence phase in the 2000s or 2010s, the effect of CTT on corporate performance would be positive or insignificant, whereas it used to be negative in the 1990s. Next, whereas the self-citation ratio is insignificant to the performance of Korean companies in the 1990s, it is expected to be positive and significant since the 2000s or later.
3. Methodology and Data
3.1. Methodology
The empirical analysis aims to determine whether the Korean firms have been changing and converging the US firms over time in their behavior and performance indicators. The period of analysis is from 1990 to 2015, which is divided into three sub-periods. The period of the 1990s is represented by the period from 1990 to 1996, excluding the crisis period from 1997. The 2000s are represented by the period from 2001 to 2006, which is also after the recovery from the 1997 crisis and before the global financial crisis of the 2007–2008. The last sub-period is from 2009 to 2015 or after the global financial crisis.
To verify whether the Korean firms are converging to the US firms in terms of key financial variables (e.g., profitability, investment rates, sales growth, etc.) of Korean and the US firms, the following regression equation for each financial variable is estimated with similar model specifications as in Lee [18] and Cheong et al. [31]. Regression analysis is performed for each sub-period, such as the 1990s, 2000s, and 2010s, for the sample of firms including both Korean and the US firms:
Here, Ki is a dummy variable indicating whether a firm is a Korean company, Control is a set of control variables for each financial variable, Industry is a set of dummies based on 4-digit ISIC4 industrial classification code, and τ is year effect. Β captures the overall difference in dependent (performance) variable, y, between Korean and the US firms after controlling the basic firm-specific factors.
In the firm-level analysis about catching up and convergence in terms of the firm-level innovation systems, we follow the same specification in Chapter 5 of Lee [18] to replicate and compare the results. Basically, it is to explain the firm’s performance as a function of the knowledge-related firm characteristics variables (innovation systems variables) and other traditional, control variables as follows: Firm’s Performance variables = F (innovation-related variables, control variables).
Specifically, we analyze how the role of innovation variables in explaining several measures of firm’s performance, such as sales growth, profitability, and firm value, has changed over time. Performance variables are regressed for each sub-period with knowledge variables and control variables according to the equation below:
where INNOV is the innovation system variables, Control is the control variables tried in Chapter 5 of Lee [18], Ferris et al. [30], and Cheong et al. [31], Industry is the industrial dummy variable, and the year effect is captured by the variable of τt. In this part on the innovation system, regression using Equation (2) is carried out for the data of Korean firms, given that the results using the US firms for the 1990s reported in Chapter 5 of Lee [18] serve as the benchmark. In other words, the analysis is to examine the evolution of the innovation system of the Korean firms over time.
3.2. Data
3.2.1. Accounting/Financial Variables
The data used in the analysis are the financial data of Korean listed companies from 1990 to 2015 and have been downloaded from the database of KISVALUE (www.kisvalue.com; accessed on 10 January 2020) that provides annual information of companies listed on the two stock markets of Korea, namely, KOSPI and KOSDAQ. Meanwhile, the data of the US firms are downloaded from the COMPUSTAT North America database. Table 1 summarizes the definition of the key financial indicators to be analyzed.

Table 1.
Definition of key accounting variables.
For comparability over different time periods, firms existing in all three sub-periods were selected, and firms with at least three years of non-missing values of assets or sales data within each sub-period are selected. Some criteria for eliminating outliers are applied, following Hall et al. [43]; the following criteria are used to exclude the outlier that satisfies one of the following conditions: R & D to sales ratio is higher than 100%; gross income is negative; the ratio of operating income to sales is less than −100%; growth rates for gross income, operating income, sales and equity are higher than 10,000% in absolute value; Tobin’s Q (market to book) is higher than 100.
Although we use regression to control the effect of firm-specific characteristics, a huge difference exists between two countries’ firms in terms of size, age, and industry composition, among others. In addition, the size of the US sample is much bigger than the Korean sample. Thus, constructing a comparable US firm sample with the Korean one is needed for proper analysis. Therefore, in this analysis, we construct a U.S. sample using the propensity score matching method [44], following the method of Chari [45]. In applying this method, the propensity score for each firm in each sub-period is calculated first, so that the sample ends up including the similar firms in terms of size and public age that produce similar propensity score values. In each industry, the US firms which have the closest propensity score to the Korean counterpart are selected into the U.S. sample. The nature of this kind of sample matching and its results are summarized in the Appendix A Table A1 including the number of the sample firms in three sub-periods. Thus, depending on regressions either in Section 3 or Section 4, and the sub-period, the sizes of the two country sample firms vary.
3.2.2. Patent Data and Patent-Citation Driven Variables
US Patent Office data are used to generate variables related to knowledge base or innovation systems at the firm level in the US and Korea. For the patent data from 1990 to 2006, the two sets of data are used, which are available freely and explained well in Jaffe and Trajtenberg [38]. The first set is available at the NBER website (http://www.nber.org/patents/; accessed on 10 May 2020) with detailed explanations that are based on Hall et al. [43], and Jaffe and Trajtenberg [38]. This database comprises patents registered from 1963 to 1999, and citation data from 1975 to 1999. The database includes the information such as patent number, grant year, grant date, application year (starting in 1967), country and state (if in the United States) of first inventor, assignee identifier if patent was assigned (starting in 1969), assignee type (individual, corporate or government; foreign or domestic), main US patent classes among 417 technological sectors/classes, six categories and 36 sub-categories, and the number of claims (starting in 1975). It also provides direct measurement of several knowledge variables, such as originality, generality, mean citation lags (which can be used to calculate CTT), self-citation ratios, and so on. The second set of patent data is the updated version of the first one. The data period is from 1976 to 2006, and they are available at the NBER website (https://sites.google.com/site/patentdataproject/Home; accessed on 10 May 2020). For the data from 2007 to 2015, USPTO bulk data were downloaded from the web site of the USPTO (https://bulkdata.uspto.gov/; accessed on 15 August 2020) and processed to calculate firm-level variables. To merge these data with the accounting variables of firms, the name of the patent assignees should be matched with the name of the company in accounting data. The matching codes available at the NBER database are utilized for the US company, and the Korean firms are manually matched by compiling information such as the company name and domestic patent data.
Based on this matching, the final sample for regression analysis includes all those firms that have at least one patent per year during the periods. Then, using the associated firm-level variables of technological diversity, originality, self-citation ratio, and cycle time variables are created. Depending on regressions and sub-period, the sizes of the sample Korean firms vary; roughly, the ranges are approximately 140–150 firms for the 1990s and close to 800 firms in the 2000s and 2010s.
4. Convergence in Conventional Financial Variables
4.1. Convergence or over-Shooting in Debt, Investment, Profitability, and Growth Rates
4.1.1. Investment Rates
In Figure 1, the average annual and sub-period investment rates of Korean and US companies are shown. In the 1990s, the investment ratio of Korean companies was higher than that of US companies. However, in the 2000s and 2010s, the investment rate of Korean companies becomes lower than that of the US firms.
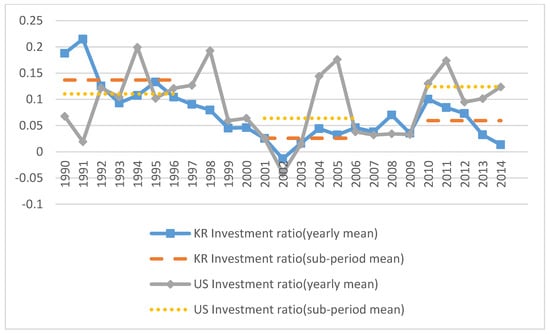
Figure 1.
Comparison of investment ratio.
Then, the regression analysis in Table 2 confirms that these changing trends are valid even after considering the typical control variables. Given that the regressions are run using the data set combining the US and Korean firms, the coefficient of the Korean dummy which takes the value of 1 for the Korean firms captures the difference in the US and Korean firms.
Table 2.
Comparison of investment ratio by regression.
According to the regression analysis, in the 1990s, the investment ratio of Korean companies was significantly higher than that of the U.S. companies. However, no significant difference exists in the investment ratio between Korean and US companies in the 2000s and 2010s. This finding supports the hypothesis that the gap in investment rates has narrowed, which is indicative of convergence in this aspect.
4.1.2. Debt Ratio
The graph of the average annual and sub-period debt ratio of Korean and American companies is shown as Figure 2. In the 1990s, the debt ratio of Korean companies was higher than that of the US companies. Whereas the debt ratio of the US companies remained nearly constant with a slight decrease after the mid-2000s, that of Korean companies has declined sharply since 1997, showing a lower level than that of the US companies in the 2000s and 2010s. Regression results are shown in Table 3, which supports the hypothesis that the debt ratio of Korean companies, which was previously higher than that of the US firms, has since decreased to be similar to or even lower than that of the US firms.
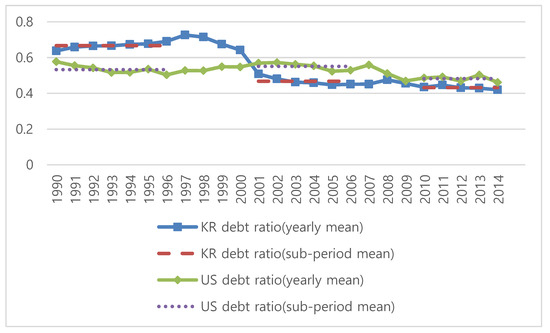
Figure 2.
Comparison of debt ratio.
Table 3.
Comparison of debt ratio by regression.
4.1.3. Sales Growth
The graph in Figure 3 shows the average annual and sub-period sales growth rates for Korean and US companies. The growth rate of Korean companies’ sales in the 1990s was relatively higher than that of the US companies. However, it has become lower than that of the US companies in the 2000s and 2010s. The results from the regression as shown in Table 4 are basically consistent with the relative trends shown by the graph.
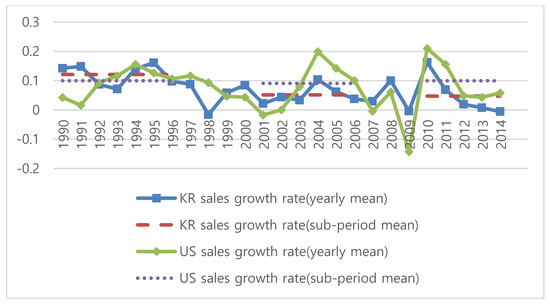
Figure 3.
Comparison of sales growth rate.
Table 4.
Comparison of sales growth rate by regression.
4.1.4. Profitability
The graph of the average annual and sub-period profitability (ROS, ROA) of Korean and US companies is shown in Figure 4. Profitability of Korean companies has improved since the 1990s and has become much higher than before. In contrast, the profitability of the US companies has decreased, and has ended up lower than that of the Korean firms in the 2000s and 2010s. The following regression analyses shown in Table 5 also draw the same conclusions. In other words, no difference existed between the US and Korean firms in the 1990s in terms of their profitability. However, in the 2000s and 2010s, profit rates of the Korean firms became higher than those of the US firms.
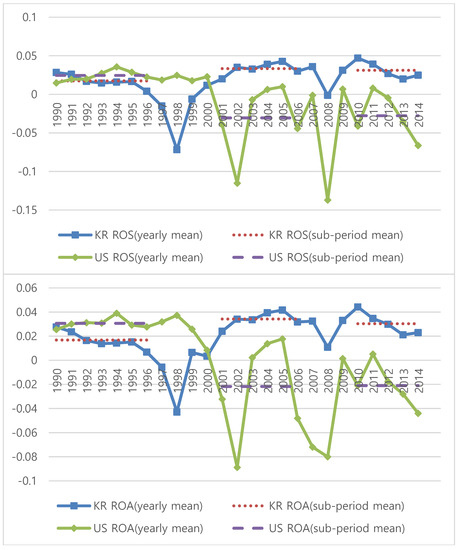
Figure 4.
Comparison of profitability (ROS, ROA).
Table 5.
Comparison of profitability (ROS, ROA) by regression.
4.2. No Convergence in Firm Values
Figure 5 shows the trends of the average Tobin-Q representing the values of the firms for Korea and the US in their annual and sub-period values. Evidently, the values of the Korean firms were lower than those of the US in the 1990s, and the gap has persisted over the 2000s and 2010s. Then, the regression analysis of the determinants of the firm values in Table 6 produces consistent results, with the coefficients of the Korean dummy significantly negative throughout the three sub-periods. The results suggest the continuation of the so-called Korea-discount in the firm valuation which may reflect various factors, including issues of corporate governance and the military threat from the North, among others.
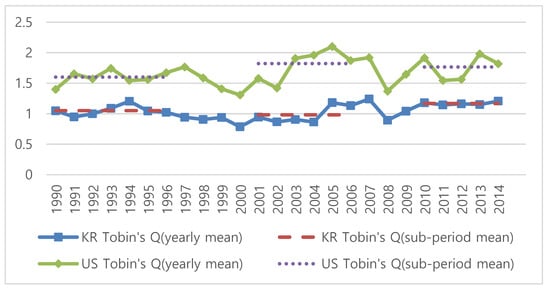
Figure 5.
Comparison of firm value (Tobin’s Q).
Table 6.
Comparison of firm values (Tobin’s Q) by regression.
One of these factors may include the practices in dividend payments, and low payment has been regarded as one factor responsible for the Korea-discount in the literature. However, when we check the trends of the dividend payout ratio for each year and three sub-periods for Korean and the US firms, the relative gaps between the two countries’ ratios are inconsistent but changeable, showing ups and down depending on the periods. Although not shown here either, regression analyses also produce changeable results, with the Korean coefficients either positive in the 1990s or negative in the 2010s, which are difficult to interpret.
4.3. Discussion
The analysis in this section first shows that the Korean companies in the 1990s showed higher debt, investment, and growth rates than those of the US firms, which are consistent with the hypothesized behavior of the catching-up firm [18]. Nonetheless, since then or in the 2000s and 2010, the Korean firms’ behavior has changed dramatically, to borrow less (lower debt ratio) than the US firms, invest at similar rates as the US firms, and then grow slowly than the US firms. In profitability, the Korean firms used to correspond to lower or similar rates as the US firms in the 1990s, but, in the 2000s and 2010s, those of the Korean firms became even higher than those of the US firms.
This fact suggests a radical change in behavior of the Korean firms or convergence toward the Anglo-Saxon style of firm behavior and may even be interpreted as a kind of over-shooting by the Korean firms in their reform efforts since the 1997 financial crisis toward the shareholder capitalism. In other words, the Korean firms now borrow less, invest less, and thus grow slowly while achieving high profitability, which signifies some divergence from the typical behavior of latecomer firms proposed by Mathews [26] and Ferris et al. [30].
However, interestingly, this convergence is not completed in terms of the dividend policy and the firm values, such that no robust evidence proves that the Korean firms pay more or equal dividends in the most recent period (2010s) than the US firms, and that the value of the Korean firms tends to remain significantly lower than that of the US firms.
5. Upgrading and Convergence in Innovation Systems of the Korean Firms
5.1. Trends of Key Innovation Variables
This sub-section looks at the trend of key innovation system variables of the Korean firms since the 1990s. Overall trends can be seen clearly from Figure 6, Figure 7 and Figure 8. First, Figure 6 shows that the average number of patents filed by each firm has shown steady and rapid increases since the 1990s, from less than 50 per firm in the early 1990s to more than 150 per firm in the 2000s and around 2010; the numbers since 2010 decreased due to the so-called truncation problems such that patents are applied but not yet granted. Second, Figure 7 shows that the average ratio of self-citations has also increased quickly from less than 2% in the early 1990s to approximately 8% by the mid-2010s. As discussed in Lee [18] and Joo et al. [42], high self-citation represents one aspect of strong technological capabilities. Actually, the level of 8% in the 2010s is somewhat close to the average level (12%) of the US firms in the 1990s according to the information in Lee [18]. Thus, this increasing number of patents per firm and increasing trend of self-citations reflect increasing levels of technological capabilities of the Korean firms over time.
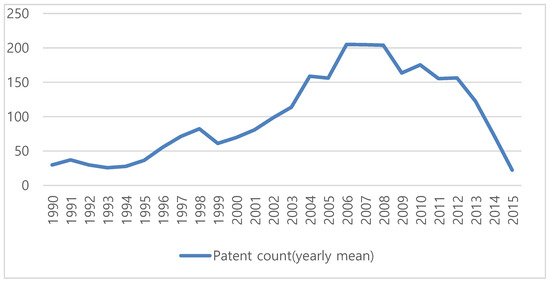
Figure 6.
Average patent count of Korean firms.
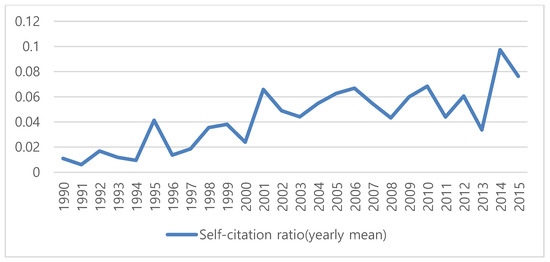
Figure 7.
Average self-citation ratio of Korean firms.
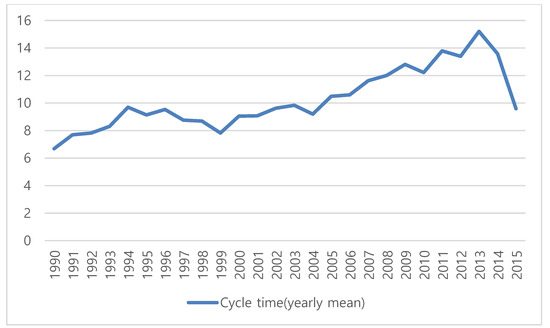
Figure 8.
Average cycle time of Korean firms.
Third, Figure 8 show the trends of the average CTT of the Korean firms. It has increased from 6 or 7 years in the early 1990s to around 12 years in the 2010s although some changes have occurred in the recent years. Overall, it indicates that the Korean firms have substantially reduced the degree of former specialization into short CTT-based sectors. The nearly double increase over the period of time can be considered a big change, although it might also reflect the overall trend of CTT over time and over nationality of firms, as analyzed in Lee and Lee [46].
Table 7 presents the average values of key innovation variables of the firms and their change over time in the three sub-periods, 1990s, 2000s, and 2010s. No substantial change over time was shown on the average values of HH index representing technological specialization (or inverse of diversification) and originality. By contrast, the statistically significant changes over time are confirmed with regard to the two focal variables of self-citations and CTT. The subsequent regression analyses also show that these two variables are the main drivers of changes affecting performance and behavior of the Korean firms and their innovations.
Table 7.
Trends of the innovation variables over the three sub-periods.
5.2. Growth, Profitability, and Firm Values
5.2.1. Growth
Table 8 presents the results of regression analysis linking sales growth to key innovation and other explanatory variables over the three different periods. An emerging story from the table is no substantial change from the previous results in Lee [18]. In other words, firms’ growth represented by sales growth continues to be largely explained by investment (proxied by capital expenditure to sales ratio in the table), whereas self-citations are not yet significant in contrast to its significance in the US firm results reported in) Lee [18]. A new result of positive significance of technological diversity (or negative significance of technological concentration) is opposite to the US firms in the 1990s in terms of its sign; in the US firms, technological concentration is shown to be positively related to sales growth [18]. In addition, in the 1990s, the firms with low capital-labor ratio were shown to grow fast according to the results with the US firms [18], whereas it is still not the case in the Korean firms even in the 2010s according the results in Table 8.
Table 8.
Regression results of sales growth rate on innovation variables.
5.2.2. Profitability
Table 9 shows the regression results for the two measures of firm profitability (ROS, ROA). The variable of the CTT is noteworthy and important. The CTT is shown to be negative and significant in the 1990s but insignificant in the 2010s. In other words, the results for the 1990s are a replication of the results for the Korean firms in Lee [18], but the results for the 2010s have become similar to the results for the US firms reported in Lee [18] for the US firms in the 1990s. An interpretation is that the Koreans have stopped their early strategy of focusing on short CTT for niche-based profitability in 2010. This understanding is what we have hypothesized as one aspect of convergence of the Korean firms toward the US firms. The results that the variables of self-citations are insignificant as a determinant of firm growth are also consistent with the US firm results reported in Lee [18].
Table 9.
Regression results of profitability on innovation variables.
5.2.3. Firm Values
Table 10 shows the regression results for the determinants of firm values measured by Tobin’s Q. The results are interesting with regard to the key innovation variable of self-citation. The variable of self-citation ratio is shown to be positive and significant in the 2010s but not significant at all in the 1990s or 2000s. The former part for the 2000s is an exact replication of Lee [18] for the 1990s, whereas the latter part for the 2010s is consistent with the results for the 1990s US firms reported in Lee [18]. The fact that the self-citation ratio shows a positive effect on Korean firm value in the 2010s is indicative of convergence of the Korean firms toward the US firms in terms of its level of technological capabilities measured by self-citations and their importance in firm values.
Table 10.
Regression results of firm value on innovation variables.
Another important result is that the variable of originality has finally become significant in the 2010s, which is consistent with the fact that a higher degree of combination of knowledge from diverse fields is becoming important in the period of the 4th industrial revolution or industry 4.0.
5.2.4. Role of the Foreign Shareholders and Robustness
Thus far, we have analyzed the role of the innovation-related variables on the possibility of convergence, which is also an effort to replicate and compare with the results in Lee [18]. However, another source of convergence is the change in corporate governance associated with the increase of foreign shareholders as discussed in Section 1 and Section 2. Thus, we have run additional regressions with this variable of foreign shareholders added into the models. The results for the 2010s are provided in Table 11; the results for other periods are also available upon request but omitted here to save space. To handle the issue of possible endogeneity of explanatory variables and to show robustness, the results with the GMM estimations are also provided apart from the panel fixed and OLS estimation. Only those results consistent over both panel and GMM can be considered as robust. In this regard, the results about key interest variables, such as CTT and self-citations, remain robust; there is no significance of CTT in profitability and significance of self-citations in firm vales. Now, the role of foreign shareholders is shown to contribute to a higher profitability (ROA), whereas its impacts on firm values are insignificant. These results are indicative of some role by the foreign shareholders in moving the Korean firms toward the global standard or Anglo-Saxon model of corporate governance emphasizing profitability.
Table 11.
Firm performance with the variable of foreign ownership in the 2010s: OLS, fixed effects and GMM results.
5.3. Discussion: A Partial Convergence?
The overall picture emerging from the analysis in this section is again a thesis of ongoing but not-yet-finished convergence of the Korean firms toward the US firms, which is consistent with the conclusion from the preceding section (Section 4) analyzing conventional accounting variables. Whereas marked increase in self-citations and CTT occurred over time in the Korean firms, such trends were not that clear-cut in technological diversification and originality. Thus, the linkage from innovation variables to profitability and firm values in Korea has now become similar to that in the US in the 1990s, which can be considered as an important aspect of convergence and also a deviation from the typical pattern of catching-up firms discussed in Chapter 5 of Lee [18]. In the meantime, the mechanism of firms’ sales growth in Korea remains somewhat different from that in the US. Moreover, the role of foreign shareholders is shown to be important in profitability but not in firm-values, which is also consistent with the idea of a partial convergence or Korean-specificity associated with the so-called Korea discount in stock markets.
6. Summary and Concluding Remarks
This paper addresses the issue of convergence of latecomer firms toward firms in advanced economy, with the Korean and US firms representing latecomers and advanced firms, respectively. Convergence is analyzed in two dimensions, namely, in terms of conventional accounting variables and innovation system variables. In this analysis, the benchmark is the results in Chapter 5 of Lee [18] that the Korean firms tend to borrow more, invest more, and thus grow faster but end up with low profitability and firm values than the US firms, and that their innovation system is quite different from the US firms as Korean firms seek a niche-based strategy for profitability by specializing in short CTT, and their technological capability represented by self-citation is too low to be significantly affecting firm-values.
An emerging conclusion from the empirical analysis in this paper is a “partially completed and clear tendency toward convergence.” In terms of the first dimension of convergence in conventional accounting variables, the Korean firms are shown to now borrow less, invest less, grow slowly, and thus achieve high profitability. However, their firm values appreciated by stock markets are not as high as those of the US firms. In the second dimension of convergence in innovation systems, the paper finds some important evidence of convergence, such as no significant linkage between (short or long) CTT and firm profitability and a significant linkage from higher self-citation to firm values. This new pattern is exactly the same pattern found in the US firms by Lee [18], which is a reflection of an increasing level of technological capabilities of the Korean firms and is indicative of convergence in the innovation system of Korean firms. The unfinished part comes from the finding that, although the Korean firms are shown to be diversifying into non-short CTT-based sectors, their growth mechanism is still shown to have not changed much, still relying on fixed investment associated with high capital–labor ratio than technological capability associated with self-citations.
The story of firm-level changes in Korea analyzed in this paper is consistent with a country-level finding by Lee and Lee [21] that economic growth (per capita income) of Korea is now positively associated with long CTT of the country, as Korea is now moving toward long CTT-based sectors, such as bio medicines and products and high-tech materials and components. Given that the overall level of CTT in Korea (9 years) remains way shorter than that of Germany (12 years) (Figure 1A in [21]), the shift toward long CTT continues to be an ongoing process. Interestingly, this gap between Korea and Germany is consistent with their gap in per capita GDP in PPP terms, such that that of Korea has now reached the level of Japan or 70% of the US, whereas that of Germany is approximately 85% of the US according to the more recent data from IMF released in 2021.
Author Contributions
Conceptualization, writing, and funding acquisition are by K.L., whereas formal analysis of data, tables and figures are by B.I. All authors have read and agreed to the published version of the manuscript.
Funding
This paper was presented as a keynote speech of SOI 2021, and the publishing fee of this paper was funded by SOI 2021-1.
Institutional Review Board Statement
Not applicable.
Informed Consent Statement
Not applicable.
Acknowledgments
An earlier version of this paper was presented at the SOI:tmC conference, July 2021. The authors would like to thank the editor of this journal and three anonymous referees for useful comments and feedback. This work is supported by the Laboratory Program for Korean Studies through the Ministry of Education of the Republic of Korea and Korean Studies Promotion Service of the Academy of Korean Studies (AKS-2018-LAB-1250001).
Conflicts of Interest
The authors declare no conflict of interest.
Appendix A
Table A1.
Firm size and age before and after propensity score matching.
Table A1.
Firm size and age before and after propensity score matching.
| Variables | Before /After | Sub-Period1: 1990–1996 | Sub-Period2: 2001–2006 | Sub-Period3: 2010–2015 | ||||||
|---|---|---|---|---|---|---|---|---|---|---|
| KR | US | KR-US | KR | US | KR-US | KR | US | KR-US | ||
| Sales | Before | 635.1 | 1352.2 | −717.1 ** | 429.3 | 2056.6 | −1627.3 ** | 564.8 | 3010.3 | −2445.5 ** |
| After | 469.7 | 456.1 | 13.6 | 443.1 | 559.2 | −116 ** | 550.5 | 588.0 | −37.6 | |
| Asset Total | Before | 752.1 | 1569.1 | −816.9 ** | 458.4 | 2573.6 | −2115.2 ** | 669.6 | 3972.4 | −3302.8 ** |
| After | 549.7 | 401.6 | 148 ** | 485.4 | 518.1 | −32.7 | 629.5 | 582.3 | 47.2 | |
| Firm Age | Before | 12.1 | 18.1 | −6.1 ** | 12.5 | 20.1 | −7.6 ** | 15.5 | 25.3 | −9.8 ** |
| After | 12.1 | 12.7 | −0.6 ** | 13.2 | 13.2 | 0 | 15.9 | 14.9 | 0.9 ** | |
| No. of Firms | Before | 504 | 4652 | 1062 | 4061 | 1282 | 2934 | |||
| After | 307 | 463 | 954 | 3830 | 1101 | 389 | ||||
Notes: KR = Korea; Unit = million US dollars; Firm age = years after the initial public offering. ** p < 0.01, * p < 0.05.
Table A2.
Descriptive statistics of variables used in regressions comparing the US and Korean firms.
Table A2.
Descriptive statistics of variables used in regressions comparing the US and Korean firms.
| Part A. Descriptive Statistics Used in Investment Ratio Regression | ||||||
|---|---|---|---|---|---|---|
| Variable | Definition | Obs | Mean | SD | Min | Max |
| Investment ratio | (physical capitalt − physical capitalt−1)/physical capitalt−1 | 5461 | 0.112 | 0.508 | −0.988 | 18.297 |
| log(Tobin’s Q) | log(Tobin’s Q) | 5461 | −0.095 | 0.339 | −1.531 | 1.722 |
| Industry average log(Tobin’s Q) | log(industry, year mean of Tobin’s Q) | 5461 | 0.024 | 0.191 | −0.630 | 1.057 |
| ROA | Operating income on Total Asset | 5461 | 0.055 | 0.058 | −1.204 | 0.421 |
| Foreign ownership | Year end stock holding ratio of foerign investors | 5461 | 0.079 | 0.140 | 0 | 4.53 |
| Part B. Descriptive Statistics Used in Debt Ratio Regression. | ||||||
| Variable | Definition | Obs | Mean | SD | Min | Max |
| Debt to asset ratio | Total liability/total assets | 5462 | 0.533 | 0.209 | 0.011 | 2.183 |
| log(total asset) | log(total assets) | 5462 | 5.594 | 1.506 | 1.509 | 12.008 |
| ROS | Operating income to sales | 5462 | 0.064 | 0.083 | −1.227 | 0.869 |
| Capex to sales ratio | Increase in fixed assets/sales | 5462 | 0.017 | 0.115 | −2.916 | 1.381 |
| Part C. Descriptive Statistics Used in Sales Growth Rate Regression | ||||||
| Variable | Definition | Obs | Mean | SD | Min | Max |
| Sales growth rate | log(sales)t − log(sales)t−1 | 5415 | 0.062 | 0.217 | −4.611 | 0.900 |
| log(sales) | log(sales) | 5415 | 5.432 | 1.516 | 1.489 | 11.973 |
| log(age) | log(firm age) | 5415 | 3.593 | 0.393 | 1.609 | 4.771 |
| debt ratio | total liabilities/total assets | 5415 | 0.539 | 0.214 | 0.026 | 3.280 |
| current ratio | current assets/current liabilities | 5415 | 1.646 | 2.201 | 0.080 | 96.004 |
| Capex to sales | Increase in fixed assets/sales | 5415 | 0.018 | 0.109 | −2.916 | 1.381 |
| log(capital labor ratio) | log(tangible assets/emp.) | 5415 | −2.766 | 1.209 | −7.197 | 1.528 |
Table A3.
Descriptive statistics of variables in regressions with innovation variables.
Table A3.
Descriptive statistics of variables in regressions with innovation variables.
| Variable | Mean | Median | Std. | Min. | Max. | Obs |
|---|---|---|---|---|---|---|
| Sales growth | 0.092 | 0.092 | 0.316 | −4.611 | 3.220 | 1778 |
| ROS | 0.073 | 0.075 | 0.131 | −0.975 | 0.695 | 1778 |
| ROA | 0.066 | 0.061 | 0.089 | −1.727 | 0.418 | 1778 |
| Tobin’s Q | 1.363 | 1.080 | 1.071 | 0.268 | 12.939 | 1536 |
| Self-citation | 0.035 | 0.000 | 0.104 | 0.000 | 1.000 | 1778 |
| Cycle time | 10.731 | 9.882 | 5.295 | −1.000 | 35.000 | 1682 |
| Foreign Ownership | 0.135 | 0.072 | 0.163 | 0.000 | 0.930 | 1751 |
| Log(age) | 3.167 | 3.296 | 0.692 | 1.099 | 4.745 | 1778 |
| Log(sales) | 6.122 | 6.020 | 2.096 | −0.730 | 11.973 | 1778 |
| Log(total assets) | 6.358 | 6.075 | 1.996 | 0.744 | 12.037 | 1778 |
| log(capital labor ratio) | −2.307 | −2.363 | 1.064 | −6.457 | 1.058 | 1750 |
| Tangible ratio | 0.340 | 0.333 | 0.164 | 0.001 | 0.903 | 1777 |
| Debt to asset ratio | 0.494 | 0.488 | 0.518 | 0.005 | 16.919 | 1778 |
| Investment ratio | 0.086 | 0.049 | 0.431 | −9.422 | 3.851 | 1777 |
References
- Amsden, A.H. Asia’s Next Giant: South Korea and Late Industrialization; Oxford University Press: New York, NY, USA, 1992. [Google Scholar]
- Johnson, C. MITI and the Japanese Miracle: The Growth of Industrial Policy: 1925–1975; Stanford University Press: Palo Alto, CA, USA, 1982. [Google Scholar]
- Wade, R. Governing the Market: Economic Theory and the Role of Government in East Asian Industrialization; Princeton University Press: Princeton, NJ, USA, 1990. [Google Scholar]
- Chang, S.-J. Financial Crisis and Transformation of Korean Business Groups: The Rise and Fall of Chaebols; Cambridge University Press: Cambridge, UK, 2003. [Google Scholar]
- Lee, K.; Shin, H.-C.; Lee, J. From Catch-up to Convergence? Recasting the Trajectory of Capitalism in South Korea. Korean Stud. 2020, 44, 54–79. [Google Scholar] [CrossRef]
- Abramovitz, M. Catching-up, forging ahead, and falling behind. J. Econ. History. 1986, 46, 385–406. [Google Scholar] [CrossRef]
- Malerba, F.; Lee, K. An evolutionary perspective on economic catch-up by latecomers. Ind. Corp. Chang. 2021. [CrossRef]
- World Bank. The East Asian Miracle: Economic Growth and Public Policy; Oxford University Press: New York, NY, USA, 1993. [Google Scholar]
- Lee, K.; Shin, H.-C. Varieties of Capitalism and East Asia: Long-Term Evolution, Structural Change, and the End of East Asian Capitalism. Struct. Chang. Econ. Dyn. 2021, 56, 431–437. [Google Scholar] [CrossRef]
- Hall, P.A.; Soskice, D. An Introduction to Varieties of Capitalism. In Varieties of Capitalism; Oxford University Press (OUP): New York, NY, USA, 2001; pp. 1–68. [Google Scholar]
- Jayasuriya, K. Beyond institutional fetishism: From the developmental to the regulatory state. New Political Econ. 2005, 10, 381–387. [Google Scholar] [CrossRef]
- Kang, N. Globalisation and Institutional Change in the State-Led Model: The Case of Corporate Governance in South Korea. New Political Econ. 2010, 15, 519–542. [Google Scholar] [CrossRef]
- Pirie, I. The Korean Developmental State: From Dirigisme to Neo-Liberalism; Routledge: New York, NY, USA, 2007. [Google Scholar]
- Wong, J. Betting on Biotech: Innovation and the Limits of Asia’s Developmental State; Cornell University Press: London, UK, 2011. [Google Scholar]
- Dalton, B.; Rama, M.D. Understanding the rise and decline of shareholder activism in South Korea: The explanatory advantages of the theory of Modes of Exchange. Asia Pac. Bus. Rev. 2016, 22, 468–486. [Google Scholar] [CrossRef]
- Kalinowski, T. Crisis management and the diversity of capitalism: Fiscal stimulus packages and the East Asian (neo-)developmental state. Econ. Soc. 2015, 44, 244–270. [Google Scholar] [CrossRef]
- Thurbon, E. Developmental Mindset: The Revival of Financial Activism in South Korea; Cornell University Press: Ithaca, NY, USA, 2016. [Google Scholar]
- Lee, K. Schumpeterian Analysis of Economic Catch-Up: Knowledge, Path-Creation, and the Middle-Income Trap; Cambridge University Press: Cambridge, UK, 2013. [Google Scholar]
- Lundvall, B.A. National Systems of Innovation: Toward a Theory of Innovation and Interactive Learning; Frances Pinter: London, UK, 1992. [Google Scholar]
- Lee, K.; Lee, J.; Lee, J. Variety of national innovation systems (NIS) and alternative pathways to growth beyond the middle-income stage: Balanced, imbalanced, catching-up, and trapped NIS. World Dev. 2021, 144. [Google Scholar] [CrossRef]
- Lee, J.; Lee, K. Catching-up national innovations systems (NIS) in China and post-catching-up NIS in Korea and Taiwan: Verifying the detour hypothesis and policy implications. Innov. Dev. 2021, 1–25. [Google Scholar] [CrossRef]
- Lee, K.; Kim, J.Y.; Lee, O. Long-term evolution of the firm value and behavior of business groups: Korean chaebols between weak premium, strong discount, and strong premium. J. Jpn. Int. Econ. 2010, 24, 412–440. [Google Scholar] [CrossRef]
- Choo, K.; Lee, K.; Ryu, K.; Yoon, J. Changing Performance of Business Groups over Two Decades: Technological Capabilities and Investment Inefficiency in Korean Chaebols. Econ. Dev. Cult. Chang. 2009, 57, 359–386. [Google Scholar] [CrossRef]
- Kim, A.; Cho, M. Types of foreign investors, dividend and investment policy: An empirical study of Korean firms. J. Strateg. Manag. 2008, 11, 25–42. [Google Scholar]
- Penrose, E.T. The Theory of the Growth of the Firm, 1st ed.; Oxford University Press: New York, NY, USA, 1959. [Google Scholar]
- Mathews, J.A. Competitive advantages of the latecomer firm. Asia Pac. J. Manag. 2002, 19, 467–488. [Google Scholar] [CrossRef]
- Goto, A. Business groups in a market economy. Eur. Econ. Rev. 1982, 19, 53–70. [Google Scholar] [CrossRef]
- Khanna, T.; Yafeh, Y.P. Business Groups in Emerging Markets: Paragons or Parasites? J. Econ. Lit. 2007, 45, 331–372. [Google Scholar] [CrossRef] [Green Version]
- Leff, N.H. Industrial Organization and Entrepreneurship in the Developing Countries: The Economic Groups. Econ. Dev. Cult. Chang. 1978, 26, 661–675. [Google Scholar] [CrossRef]
- Ferris, S.P.; Kim, K.A.; Kitsabunnarat, P. The costs (and benefits?) of diversified business groups: The case of Korean chaebols. J. Bank. Financ. 2003, 27, 251–273. [Google Scholar] [CrossRef]
- Cheong, K.S.; Choo, K.; Lee, K. Understanding the behavior of business groups: A dynamic model and empirical analysis. J. Econ. Behav. Organ. 2010, 76, 141–152. [Google Scholar] [CrossRef]
- Chang, S.J.; Hong, J. Economic performance of group-affiliated companies in Korea. Acad. Manag. J. 2000, 43, 429–448. [Google Scholar]
- Winter, S.G. Toward a neo-Schumpeterian theory of the firm. Ind. Corp. Chang. 2006, 15, 125–141. [Google Scholar] [CrossRef] [Green Version]
- Nelson, R.R. Why do firms differ, and how does it matter? Strat. Manag. J. 1991, 12, 61–74. [Google Scholar] [CrossRef]
- Nelson, R.R. Economic Development from the Perspective of Evolutionary Economic Theory. Oxf. Dev. Stud. 2008, 36, 9–21. [Google Scholar] [CrossRef]
- Nelson, R.R. What enables rapid economic progress: What are the needed institutions? Res. Policy 2008, 37, 1–11. [Google Scholar] [CrossRef]
- Aldieri, L.; Makkonen, T.; Vinci, C.P. Environmental knowledge spillovers and productivity: A patent analysis for large international firms in the energy, water and land resources fields. Resour. Policy 2020, 69, 101877. [Google Scholar] [CrossRef]
- Jaffe, A.B.; Trajtenberg, M. Patents, Citations, and Innovations: A Window on the Knowledge Economy; MIT Press: Cambridge, MA, USA, 2002. [Google Scholar]
- Park, K.H.; Lee, K. Linking the technological regime to the technological catch-up. Ind. Corp. Chang. 2006, 15, 715–753. [Google Scholar] [CrossRef]
- Trajtenberg, M.; Henderson, R.; Jaff, A. University versus corporate patens: A window on the basicness of invention. Econ. Innov. New Technol. 1997, 5, 19–50. [Google Scholar] [CrossRef]
- Joo, S.H.; Lee, K. Samsung’s Catch-up with Sony: Analysis with patent data. J. Asia Pac. Econ. 2010, 15, 271–287. [Google Scholar] [CrossRef]
- Joo, S.H.; Oh, C.; Lee, K. Catch-up strategy of an emerging firm in an emerging country: Analysing the case of Huawei vs. Ericsson with patent data. Int. J. Technol. Manag. 2016, 72, 19–42. [Google Scholar] [CrossRef]
- Hall, B.H.; Foray, D.; Mairesse, J. Pitfalls in Estimating the Returns to Corporate R & D Using Accounting Data. 2007. Available online: http://eml.berkeley.edu/~bhhall/papers/HallForayMairesse07_rndreturns_.pdf (accessed on 15 June 2019).
- Abadie, A.; Drukker, D.; Herr, J.L.; Imbens, G.W. Implementing Matching Estimators for Average Treatment Effects in Stata. Stata J. Promot. Commun. Stat. Stata 2004, 4, 290–311. [Google Scholar] [CrossRef] [Green Version]
- Chari, A.; Chen, W.; Dominguez, K.M. Foreign Ownership and Firm Performance- Emerging Market Acquisitions in the United States. IMF Econ. Rev. 2012, 60, 1–42. [Google Scholar] [CrossRef] [Green Version]
- Lee, J.; Lee, K. Is the fourth industrial revolution a continuation of the third industrial revolution or something new under the sun? Analyzing technological regimes using US patent data. Ind. Corp. Chang. 2021, 30, 137–159. [Google Scholar] [CrossRef]
Publisher’s Note: MDPI stays neutral with regard to jurisdictional claims in published maps and institutional affiliations. |
© 2021 by the authors. Licensee MDPI, Basel, Switzerland. This article is an open access article distributed under the terms and conditions of the Creative Commons Attribution (CC BY) license (https://creativecommons.org/licenses/by/4.0/).