Abstract
This study collected literature on augmented reality (AR) from academic and patent databases to plot the historic development trajectory of AR and forecast its future research and development trends. A total of 3193 and 13,629 papers were collected from academic and patent databases, respectively. First, a network was established using references from the academic literature; main path analysis was conducted on this reference network to plot the overall development trajectory. Subsequent cluster and word cloud analyses revealed the following five major groups of AR research topics: AR surgical navigation applications, AR education applications, AR applications in manufacturing, AR applications in architecture, and AR applications in visual tracking. Subsequently, the relationships between the overall development trajectory and the five AR research topics were compared. Next, the title and abstract of AR-related academic and patent papers were subjected to text mining to identify keywords with a high frequency of occurrence. The results can provide a reference for industry, government, and academia when planning future development strategies for the AR field. This research adopted an integrated analysis procedure to plot the trajectory of AR technology development and applications successfully and effectively, predict future patent research and development directions and produce technological forecasts.
1. Introduction
The term virtual reality was first used in the French playwright Antonin Artaud’s 1958 book. He referred to theater as a virtual reality in which fictitious worlds are presented as reality to the audience. With this definition, many popular story-telling techniques could have also been considered as forms of virtual reality. Virtual reality (VR) is a simulated experience that can be similar to or completely different from the real world. Applications of virtual reality include entertainment (e.g., video games) and education (e.g., medical or military training). Other distinct types of VR-style technology include augmented reality and mixed reality. The term augmented reality (AR) was first proposed by Professor Ronald Azuma [1] from the University of North Carolina. The three features of AR are that it combines the real and virtual domains, is interactive in real time, and is registered in 3D. AR systems are constructed using three types of technology, namely displays, tracking, and calibration [2]. Since 1968, AR applications have been used in various fields, including AR collaboration, which facilitates human–machine interaction to improve the work performance of users. AR glasses are used in the medical or industrial field to enhance visual effects for aiding those with impaired vision or logistics personnel who must quickly select orders. Research on AR head-mounted displays has explored the technical problems and application scope of such displays. AR markers, which are categorized as visible and invisible markers, are implemented in systems to label their locations for their subsequent control and use. Since 2010, AR technology has become increasingly mature, and the number of academic papers and patents related to AR technology has increased considerably. Technological advancement and decreases in the costs of relevant technology have also increased the feasibility of AR applications. Pokemon Go, an AR mobile game, has become highly popular since 2016. AR mobile platforms that have been developed for Facebook and the Apple ARKit have considerably increased the public’s exposure to AR technology. The year 2017 was considered the beginning of the AR era. Since then, the number of AR applications has progressively increased each year. The number of AR software and hardware users has also increased and is expected to exceed 10 billion in 2021, when the market value of AR applications is expected to exceed US$60 billion. Because of the increasing maturity of information and communication technology, AR products have attracted the attention of customers worldwide. Digi-Capital predicted that by 2020, the global revenue of AR hardware and software products will reach US$120 billion (Figure 1) and that of virtual reality (VR) products will reach US$3 billion. The size of the AR market will be four times that of the VR market, which indicates the importance of AR market development [3].
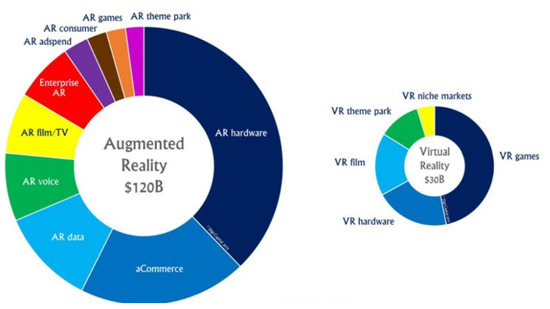
Figure 1.
Worldwide Augmented Reality (AR) and Virtual Reality (VR) revenue in 2020 [3].
Scholars have conducted multiple literature reviews on AR research. However, most of these reviews have focused solely on a specific AR technology or application. Moreover, the limitations of the analysis methods used by these scholars have led to relatively few papers being reviewed. Consequently, the results of the aforementioned reviews cannot be generalized to every AR application. Although the aforementioned scholars have identified several development trends, the overall development trajectory of AR technology warrants further exploration. In this study, a comprehensive review of AR technology and applications was performed to identify the overall development trajectory and emerging research topics on AR.
We further apply text mining to the title and abstract of all literature to identify the most commonly mentioned terms for representing the most interesting research topics. After applying main path analysis and cluster analysis to the citation network of the academic literature, we explore the overall development trajectory of the VR and broad VR research from the Web of Science database. Literature reviews of virtual reality have only focused on specific aspects. This paper comprehensively reviews and analyzes prior studies in the context of virtual reality. Five subfields were identified: Surgical simulation, Rehabilitation, Exposure therapy, Manufacturing applications, and Cognition. The new research themes from Scopus database exclude the same subfields and include new applications: mobile AR, VR in product development, and VR in brain study. Themes in academic literature and patent literature are identified and the time lag between them, ranging from 0 to 6 years [4]. Our contribution, compared to the previous literature that analysed related AR researc topics, excludes the same subfields, and include new applications: AR education applications, AR applications in architecture, and AR applications in visual tracking.
2. Literature Review
Scholars have studied AR in surgical navigation systems. Thumfart et al. [5] published 25 papers on the application of AR in surgical navigation and developed a database through research on the live tissues of iceman corpses that were fully preserved for 5300 years. During surgery, such a database can be linked to provide surgical guidance through real-time images. Regarding sinus and cranial base surgery, Freysinger et al. [6] published 11 papers related to the use of 3D navigation to reduce surgical risks. Kawamata et al. [7] published 11 papers on AR navigation applications for endoscopy operations. In such applications, 3D images captured in real situations are stacked and displayed in real time through an endoscope. The display of these images facilitates endoscopic surgery in narrow regions (e.g., between tumors). Liao et al. [8] published 11 papers related to the use of integral videography to display 3D images accurately on top of the patient for enabling surgical navigation. This method reduces the invasiveness of surgery and enhances surgical accuracy. Figl et al. [9] published 29 papers regarding the Varioscope™M5 AR head-mounted display. This display enables automatic calibration through eye-tracking control, and the calibration error is within 1% of the field of view. Kockro et al. [10] developed a surgical navigation system called DEX-Ray, in which 3D images are stacked and displayed to perform navigation; thus, this system allows users to gain a comprehensive understanding of anatomic structures and surgical goals. Overall, 50 studies of Kockro et al. [9] on DEX-Ray have been cited by other scholars. Mahvash et al. [11], in 10 papers, developed a neurosurgical AR system for projecting brain tumor images. This system can project virtual brain images directly onto the head or cranial bone of the patient in real time. Cabrilo et al. [12] published 42 papers on arteriovenous malformation surgery. In one of the cases, an AR neurosurgical navigation system was used to guide the operation of a patient with chordoma.
A total of 165 papers has been published on the application of AR in education. Ferrer-Torregrosa et al. [13] explored the use of the ARBOOK learning tool among students and determined that those who used this tool achieved higher scores in anatomy written examinations than those who did not. Akcayir et al. [14] published 62 papers on the effect of AR on university students’ laboratory skills and attitude and verified that AR effectively improves the laboratory skills of such students and helps them foster an active attitude. Akcayir and Akcayir [15] explored the use of AR in education environments and performed a review of 73 papers. They reported that the number of papers on AR applications in education is increasing. Most of these papers have concluded that AR can improve students’ academic performance. Jetter et al. [16] reviewed 122 papers on AR applications and indicated that these applications allow users to perform vehicle repair training as if they were in real-world situations. Rauschnabel et al. [17] published 78 papers on the analysis of user perception when using AR tools. They reported that users’ confidence in AR applications affects the rating of, and revenue generated from, such applications. Jeon et al. [18] explored AR localization and indicated that, when the lens of localization equipment cannot identify a marker because of the lighting conditions or the distance between the marker and the equipment, sound markers can be used as alternatives to image markers for tracking virtual targets.
The aforementioned literature reviews focused solely on the use of AR technology in specific fields and indicated that AR is commonly applied in the medical field. In particular, AR surgical navigation can be employed in various types of operation. The applications of AR in other fields, such as education and manufacturing, have begun to emerge since 2015. Although the aforementioned reviews provide considerable understanding regarding AR-related fields, they do not indicate the overall development trend of AR technology. Lee et al. [19] performed a literature review on VR-related papers between 1997–2016 to identify the development trend of VR technology. Liu et al. [20] defined the term “broad virtual reality,” which encompasses VR, AR, and mixed reality, and explored relevant literature in academic and patent databases to determine the past development trajectory and predict the future development trend of AR, VR, and mixed reality. A review of the aforementioned studies indicated that scholars have not provided a comprehensive view on AR-related literature, compiled a list of AR technologies that have been studied, or identified the development and market potential of AR. The determination of the overall development trajectory of AR can help supplement the gaps in AR-related research and identify the development potential and future research directions for AR.
3. Methodologies
This study adopted main path analysis, cluster analysis, and text mining to illustrate comprehensively the development trajectory of AR technology. In main path analysis, the citation relationships between papers were explored to examine the overall development trajectory. Next, cluster analysis was used to identify the main research topics. Finally, text mining was adopted to determine the frequency with which certain terms appeared in paper titles and abstracts. By using the aforementioned steps, the AR-related research focuses of scholars were determined.
3.1. Main Path Analysis
To explore complex citation networks, Hummon and Doreian [21] proposed main path analysis. They used the traversal count in main path analysis to describe the citation network of papers related to the development of DNA theories. In main path analysis, the citation relationships and node sequences are called search paths. Moreover, the weight of each citation relationship is calculated and quantified. The goal of this analysis is to identify the strongest citation relationship among a group of papers to determine the previous and future development trends of a research field. In a citation network, each paper represents a node. Moreover, papers that have been cited by other scholars but do not cite other papers are referred to as sources, from which knowledge propagates. By contrast, papers that cite other papers but have not been cited are referred to as sinks, which represent the end of knowledge propagation. Search algorithms are used to identify all possible paths between the sources and sinks of citation networks, and the traversal count between each pair of nodes is calculated. The path formed by the nodes with the highest traversal count is identified as the main path. The common indices used for path search are the search path link count, search path node pair, and search path count (SPC). Batagelj [22] asserted that of the aforementioned three indices, the SPC is the most accurate and involves the simplest calculation. Therefore, the present study used the SPC with Pajek, which is a famous social network analysis software program, to visualize the research results. Figure 2 illustrates the SPC of a simple citation network. The solid lines represent the main paths, which are determined through the following steps:
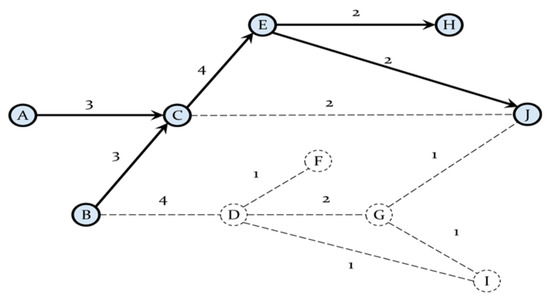
Figure 2.
Search path count (SPC) of a simple citation network.
- Select the link with the largest SPC value from the new nodes.
- Repeat Step 1 until the result reaches a sink.
Liu and Lu [23] adopted two types of main path, namely the global main path and the key-route main path, to gain insights into the phenomenon of knowledge diffusion [24]. Key-route main paths reveal information on the branching of theory development and indicate the process of paradigm shift. Numerous scholars have successfully used main path analysis and key-route main path analysis to review scientific or technical papers [25,26,27,28,29,30,31]. Yan et al. [32] used main path analysis to perform literature reviews in various fields, and Lu et al. [31] used main path analysis to perform a literature review on patent data.
3.2. The G-Index and H-Index
The h-index is a mixed quantification index proposed by Hirsch [33]. It can be used to evaluate the academic productivity and performance of researchers and serves as a meaningful scientific productivity indicator. The h-index indicates that an author has published h papers that have each been cited at least h times. The g-index is an academic paper impact index proposed by Egghe [34]. All the papers published by an author are sorted in descending order according to the number of times each paper is cited, and the g-index is calculated such that the top g articles have together received at least g2 citations. Because the g-index is squared, the g-index is more effective than the h-index in indicating the significance of a paper.
3.3. Edge-Betweenness Clustering
In cluster analysis, clusters with similar characteristics are identified from a set of raw data. Elements in the same cluster have highly similar characteristics, whereas those in different clusters differ notably. Therefore, the variance within a cluster is smaller than that between clusters. Various types of cluster analysis exist for different scenarios. To analyze citation networks, Girvan and Newman [35] proposed an edge-betweenness clustering approach, which involves separating large citation networks into multiple clusters. Modularity is used to determine the optimal clustering result. Edge-betweenness clustering is performed using the following procedures. First, the betweenness value of each link in a network is calculated. Next, the link with the largest betweenness value is deleted to calculate the modularity of the network. The aforementioned step is repeated by calculating the betweenness value of each link until all links are deleted. Finally, the clustering result for which the largest modularity value is obtained is the optimal clustering result.
3.4. Word Cloud
Text mining is a type of statistical analysis for examining textual content and extracting useful information as a reference for decision-making. In this study, the frequency of a keyword appearing in the titles and abstracts of papers was calculated to determine its importance in the AR field and to identify the main AR-related research topics in industry and academia during a specific period. A keyword was counted as appearing once in a paper regardless of its total frequency in the title or abstract of the paper. Prepositions, articles, or other terms irrelevant to AR technology were excluded. Wordle was used to visualize the text mining results in the form of a word cloud to facilitate the subsequent interpretation [36].
3.5. Growth Curve Analysis
S-shaped curves are often used to analyze time-series data. These curves illustrate the growth pattern of time-series data [37], assuming that the growth of scientific papers exhibits an S-shaped curve, which stops growing when the peak of the curve is reached. S-shaped curves comprise four stages, namely the sprouting, growing, maturing, and saturation stages; thus, these curves are also called growth curves. In this study, the growth curve was not used to analyze the market of a product [38]. Instead, this curve was used to analyze the growth of AR technology and the life cycle of AR development. The Loglet Lab software was used to analyze the accumulated number of papers in each year and to plot the most fitted S-shaped curve.
4. Data and Basic Statistics
4.1. Data
Papers related to AR technology research were collected from the Web of Science database. The keyword “Augmented Reality” was used to select papers to ensure that all the collected papers were relevant. The references, authors, publication years, journal names, journal issue numbers, and page numbers of 4173 papers were obtained. After erroneous data, such as blanks, garbled text, and anonymous authors, were excluded or combined, 3193 papers remained. Because the Web of Science database can numerically present the citation relationship between papers, this database is highly suitable for tracking the development trends of scientific fields.
Figure 3 presents the growth pattern of the 3193 AR-related papers published between 1994 and 2019. The results indicate that the cumulative number of published papers increased substantially in 2017 and exceeded 2500, which suggests that the AR field has developed progressively and received increasing attention since 2017. Regarding journal statistics, data on the journal name, publication period, and journal g-index and h-index were compiled. Regarding researcher statistics, data on the author name, publication period, and author g-index and h-index were compiled. Of the two indices used to assess the significance of a journal or author to the AR field, the g-index was employed as the primary indicator and the h-index was used as the secondary indicator for separately listing the top 20 influential journals and authors in the AR field.
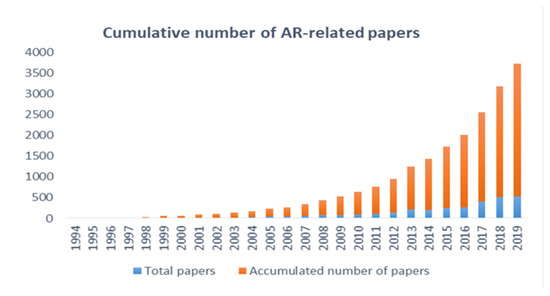
Figure 3.
Cumulative number of AR-related papers.
4.2. Growth Trend
The logistic growth model was used in this study. Loglet Lab was used to plot the growth trend of the AR field and predict its maturity period. The aforementioned software was also used to estimate the growth period, limit, and turning points. In Figure 4, the dashed line represents the estimated cumulative number of published papers. Moreover, the solid line and dots represent the actual cumulative number of published papers. The results revealed that 2020 was the inflection point of the growth curve. The curve was expected to enter the maturity period after 2030, when the maximum cumulative number of published papers would be approximately 7000. The results also indicated that, currently, the AR field is still in the growth period, about to reach the inflection point, and is 10 years away from the maturity period.
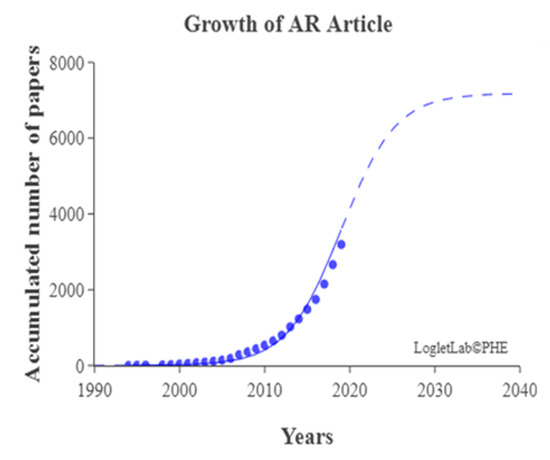
Figure 4.
Growth curve of the numbers of papers.
4.3. Journal Statistics
The g-index was used to identify the top 20 most influential journals. When two journals had the same g-index, they were ranked using the h-index (Table 1). Overall, the top-ranked journal was IEEE Transactions on Visualization and Computer Graphics, which focuses on computer science and software engineering and comprises 139 relevant papers (Table 1). The aforementioned journal also exhibited the highest g-index, which verifies its significance to the development of the AR field. The journals ranked from second to sixth were Automation in Construction, which focuses on architectural techniques; Computers & Education, which focuses on education research; Computers & Graphics-UK, which focuses on software engineering; Surgical Endoscopy and Other Interventional Techniques, which focused on surgical techniques; and Personal and Ubiquitous Computing, which focused on information engineering, respectively.

Table 1.
Top 20 most influential journals in the AR field.
The top 20 journals encompassed the fields of computer sciences, architectural techniques, education research, surgery, psychology, medical imaging, medical radiology, robotics, and manufacturing, with most of the journals covering the fields of computer sciences and medicine. As presented in Table 1, most AR-related papers were published after 2000, which indicated that AR technology began to receive the attention of scholars after this year. Notably, Multimedia Tools and Application, which focuses on computer sciences, information systems, and manufacturing, and the International Journal of Computer Assisted Radiology and Surgery, which focuses on surgery, biomedicine, and medical imaging, were ranked 10th and 12th, respectively, despite having higher numbers of relevant papers than the journals ranked from second to ninth. This result might be attributed to the low citation numbers of the aforementioned two journals
5. Results
5.1. Academic Literature and the Overall Development Trajectory of AR
The key-route main path was explored to determine the overall development trajectory of academic papers in the AR field and the main AR-related research topics investigated by academia. The results revealed that the main path mainly comprised research on AR tracking and localization. In Figure 5, the green dots represent the sources and the blue dots represent the sinks. Dots with thicker connecting lines indicate sources or sinks with greater influences. The code of each node is composed of the last name of the first author and the first letters of the last names of the coauthors, suffixing the year in which the paper was published. The key-route main path comprised 22 papers (Figure 5). The patterns among these 22 papers are briefly introduced in the following text.
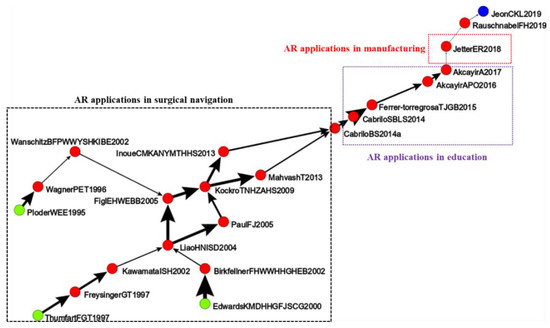
Figure 5.
Main path of AR development trajectory.
As displayed in the left section of Figure 5, the papers published between 1995 and 2014 were mostly regarding the application of AR simulators in surgical navigation. Specifically, these papers covered topics regarding training in dental implantation [38,39,40,41], facial surgery [42], nasal endoscopy [5,6,7], tumor surgery [43,44], and cerebral artery surgery [11,12]. AR surgical navigation simulators use 3D displays or head-mounted devices to display 3D images. The use of 3D displays improves surgical positioning accuracy and reduces surgical invasiveness [8,9,45]. AR technology enables physicians to obtain detailed understanding of the anatomic structure. Moreover, this technology can display 3D images that help surgeons locate surgical targets [10]. Therefore, AR medical simulators are crucial surgical navigation tools.
As depicted in the right half of Figure 5, the papers published between 2015 and 2017 indicated that AR applications in education can improve students’ anatomic knowledge [13], laboratory techniques [14], and learning ability [15]. In 2018, AR technology began to be applied in manufacturing, and scholars have asserted that this technology is applicable to vehicle repair training [16]. In 2019, two emergent AR applications appeared. Regarding mobile AR applications, scholars have attempted to understand how consumers rate interactive mobile AR applications and how these applications generate realistic perception, experiences, and presence [17]. Regarding AR applications in sound localization, when the lens of AR equipment cannot identify a marker because of lighting conditions or the distance between the marker and the equipment, immersive virtual sound localization functions can be used as alternatives to image markers for tracking and localizing virtual targets [18].
Early papers on AR were mostly related to AR surgical navigation (Figure 5). Papers on AR applications in other fields, including education, manufacturing, mobile applications, and sound localization, began to be published in late 2015. The following section describes AR applications in various fields on the basis of cluster analysis.
5.2. Academic Research Themes
An observation of the overall development trajectory revealed that the influential AR-related papers were mostly regarding medical AR applications. We also wished to examine the development of AR papers in other fields. Therefore, all the collected papers were divided into groups, and the titles of papers in each group were analyzed to create a word cloud. Each group was named on the basis of the papers that were most frequently cited in it. The cluster analysis results yielded five groups, each with more than 100 papers. Table 2 presents the research topic, number of papers, keywords, and word cloud of each identified group. In word cloud analysis, the statistics of all the titles and terms appearing in the papers of each group were compiled to create a word cloud. Of the five groups identified in this study, only one group was related to medical applications, namely AR surgical navigation. The remaining groups were unrelated to medicine and were related to education, manufacturing, architecture, and visual tracking applications. The five identified groups are described in detail in the following sections. To further explore each group, the papers in it were analyzed to calculate the SPC weight and plot the global main path. Accordingly, the main path of each group and related research direction could be identified (Figure 6, Figure 7, Figure 8, Figure 9 and Figure 10). The overall development trajectory was determined using a macro perspective to identify influential AR-related papers as well as relevant papers that referenced AR applications. Figure 4 indicates that the overall development trajectory primarily comprises medical AR applications. Subsequently, to understand how AR applications are used in other fields, a micro perspective and cluster techniques were employed to explore fields with greater numbers of AR papers (Figure 11), as described in the following section.
Table 2.
Themes, number of papers, keywords, word cloud and growth curve of each identified group.
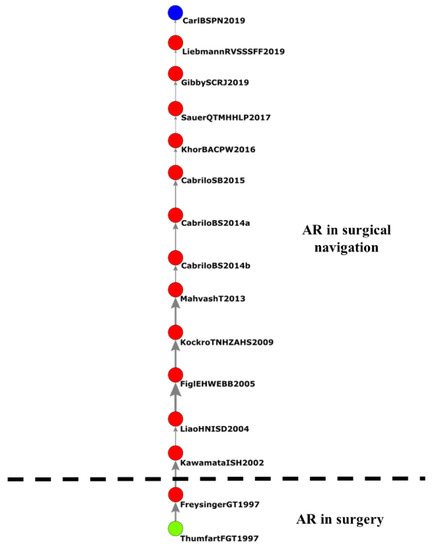
Figure 6.
Application of AR technology in surgical navigation.
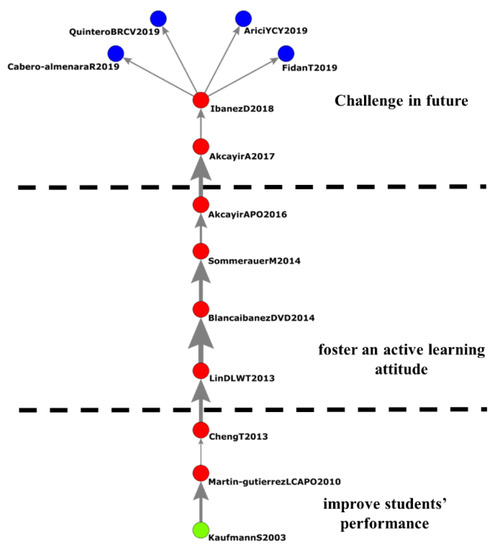
Figure 7.
Application of AR technology in education.
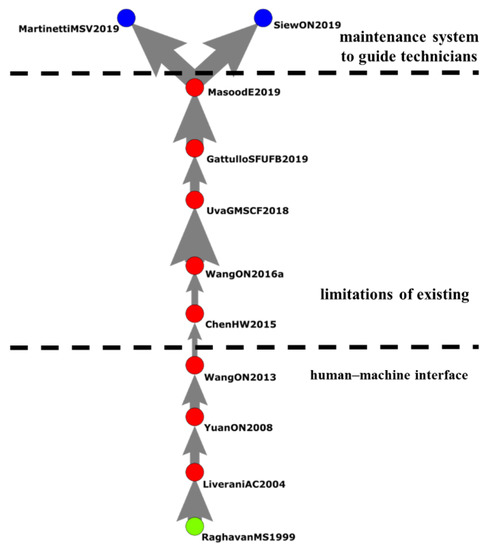
Figure 8.
Application of AR technology in manufacturing.
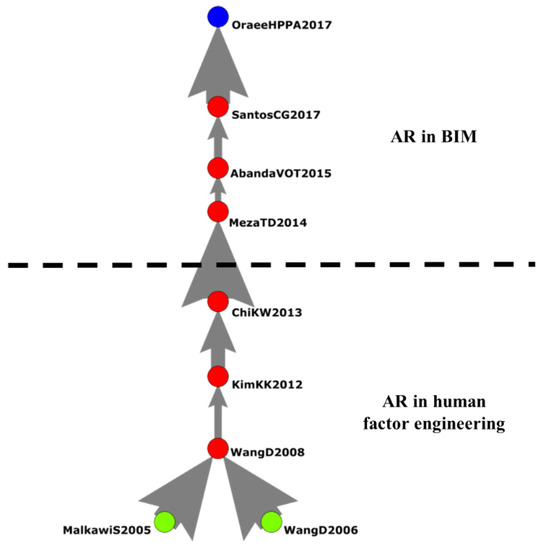
Figure 9.
Application of AR technology in architecture.
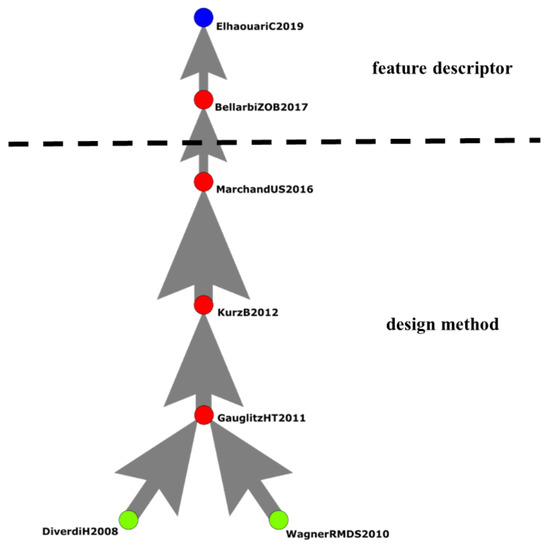
Figure 10.
Application of AR technology in visual tracking.
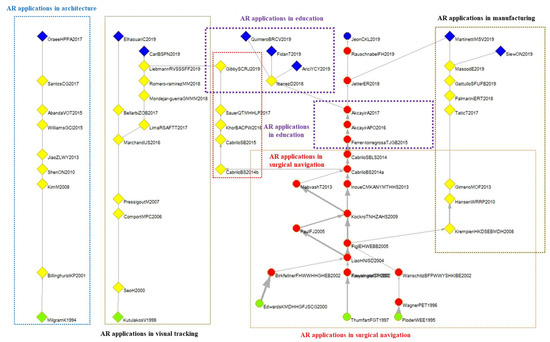
Figure 11.
Main path relationship of AR-related papers and subfields.
5.3. Latest AR Development Activities
5.3.1. AR Applications in Surgical Navigation
In the 1990s, researchers began to use AR surgical navigation to perform experiments on virtual patients or live tissues from corpses. Thus, AR applications have high development potential in surgical navigation. Assistive tools such as 3D images and head-mounted devices can be used for stereotactic positioning and reducing surgical risks. AR surgical navigation can be used in various operations, including dental implantation [37,38,39,40,41,42], facial surgery [43], nasal endoscopy [5,6,7], tumor surgery [44,45], cerebral artery surgery [11,12,46], intramedullary tumor surgery [47], craniotomy [48], interbody fusion [49], and organ surgery [50]. Khoret et al. (2016) argued that the continual research and development in AR technology can help physicians improve surgical accuracy [51]. As the costs of AR software and hardware continue to decrease, AR will become an irreplaceable technology in surgical navigation. Thus, these AR applications reduce errors in surgery and remote diagnosis.
5.3.2. AR Applications in Education
Since 2003, AR technology has been applied in education to improve students’ learning outcomes, and favorable results have been obtained by scholars. As presented in the bottom section of the main path (2003–2013), studies regarding Construct3D Kaufmann [52] and AR-Dehaes have verified that AR learning aids can effectively improve students’ performance in mathematics and geometry, science exploration, practical skills learning, and conceptual understanding [53,54]. Cheng [55] explored the use of 3D images in AR education applications. The results of the aforementioned study revealed that AR applications help students in completing scientific activities, enhancing their practical skills, and understanding concepts. As presented in the middle section of the main path (2013–2015), scholars have verified that AR learning aids help students to foster an active learning attitude [14], improve their performance in physics experiments, and enhance their knowledge of electromagnetism [56]. In the study of Sommerauer [57], the participants who used AR devices to acquire knowledge were more efficient than those who did not use AR devices. As presented in the top section of the main path (2017–2019), Akcayir [15] reviewed 68 papers on the use of AR technology in teaching environments and concluded that AR technology can improve students’ academic performance. Ibanez [58] published 28 papers and reported that students’ learning attitude is improved when AR is applied in science, technology, engineering, and mathematics courses; however, students might become overly dependent on AR or lose their focus when learning. Cabero-Almenara [59] designed three mobile AR applications for students and verified that the designed applications improved their learning motivation and performance. Quintero [60] reviewed 50 papers and noted that AR applications in education do not consider the needs of and are incompatible with students with disability. Fidan [61] developed an AR software program (FenAR) to help students solve problems through problem-based learning. The developed program enhanced students’ learning attitude and performance. Arici [62] explored the use of AR in science education and reviewed 62 papers, discovering that mobile learning, science education, science learning, and e-learning were the most common keywords in papers related to AR applications in education. The aforementioned authors suggested that researchers should focus their future research on AR mobile learning. Overall, the use of AR technology in education can improve students’ attention and learning experience.
5.3.3. AR Applications in Manufacturing
Raghavan [63] was the first to apply research on AR technology in manufacturing. In the study of Raghavan, a novel human–machine interface called AREAS was developed (Figure 8). This interface can guide users to assemble parts, enable users to select 3D virtual parts that match physical parts, and provide recommendations for improving assembly procedures. Notable studies in the bottom section of the main path (1999–2013) included those that used 3D image interaction techniques to develop and improve prototype designs, product assembly planning and assessment, and process design [64,65,66,67]. These studies have explored the use of AR systems in combination with computer-aided design systems to plan product assembly processes. As presented in the middle section of the main path (2015–2019), Wang [68] performed a comprehensive review on studies regarding the technical characteristics, unique features, and application of AR assembly systems. The limitations of existing AR technology and future development trends in AR were discussed. Scholars have reported that using spatial AR is superior to using a conventional printed operation manual [69]. Thus, researchers have created repair manuals with AR viewing functions [70]. Masood [71] explored the problems related to the implementation of AR technology in manufacturing and determined that the environment and organizational design were the key factors influencing the success of AR technology implementation. As presented in the top section of the main path (2019), Martinetti [54] discussed the lack of AR applications in manufacturing despite their prevalent use in other unique areas (e.g., video gaming). Siew [72] used wrist tactile information to provide technicians with knowledge of repair procedures and feedback, which allowed the developed AR maintenance system to guide technicians under a digital mode. Overall, the application of AR technology in manufacturing mostly involves a combination of AR technology and human-machine interfaces to help on-site managers monitor the status of manufacturing equipment, determine the condition of production lines, reduce time consumption, and increase profits.
5.3.4. AR Applications in Architecture
Regarding the use of AR technology in architecture (Figure 10), Malkawi [73] proposed an AR system with audio input and hand-posture-recognition functions. These functions allow users to visualize buildings in a virtual 3D environment and conduct immersive interaction. From the perspective of human factor engineering, Wang [74] asserted that AR technology can solve problems related to ergonomics, architecture, engineering, and construction. Wang [75] reported that the application of AR technology in building model planning and process simulation can enhance problem-solving ability; thus, the contribution of workers can be enhanced within a specific period even when their workload is increased. Kim [76] employed an AR interface that enables interaction between multiple users to devise the optimal construction plan. The adopted interface allows users to remotely share their ideas. Chi [77] compiled the results of 101 papers and asserted that AR implementation is the future development trend of architecture, engineering, and construction. Meza [78] created an AR building information modeling (BIM) system to expediate construction projects by converting complex architecture designs and concepts to 3D graphics. Abanda [79] argued that the combination of AR and BIM can enhance construction efficiency and quality. Santos [80] reviewed 381 papers on BIM and discovered that the most cited paper was related to the use of AR 3D image processing in BIM. Oraee [81] reviewed 62 papers on the use of BIM in construction. Their results revealed that combining AR with BIM improves the quality of constructed buildings. In summary, the application of AR technology in architecture involves users viewing AR effects through tablets and providing design information at construction sites to facilitate communication between on-site workers. AR applications also help managers to monitor the quality of construction sites.
5.3.5. AR Applications in Visual Tracking
Regarding the use of AR technology in visual tracking (Figure 11), Diverdi [82] employed a ground cam or camera lens, through image processing, to calculate the distance between a target object and the lens. This visual tracking approach was verified to be highly accurate with small errors. Other scholars have used natural feature markers to track AR objects on mobile phones [83], or feature descriptor markers to perform comprehensive visual tracking through detector cameras [84,85]. Kurz [86] proposed an approach that combines visual tracking with inertial sensors. Specifically, the direction of gravity measured was determined using inertial sensors to rectify camera images. Marchand [86] examined various problems that might affect visual tracking, including the partial blocking of the target, the realness of the dynamic environment, and reduced lighting. Bellarbi designed a binary feature descriptor called POLAR_MOBIL for high-stability and accurate image positioning. Elhaouari [87] designed a geometric model descriptor based on image pixel resolution and geometric coordinates suitable for 3D models. Overall, AR visual tracking technology involves the use of AR images in applications, along with finger tracking technology, to mark and locate targets.
Figure 11 presents the relationships among the five major groups of AR research topics and the main path, where only papers connected to said five groups are labeled.
5.3.6. Use of AR Technology in Other Applications
The literature review (Section 1) discussed how scholars have previously conducted literature reviews on papers related to AR applications in the fields of surgical navigation, education, architecture, mobile AR applications, and AR audio positioning. However, not all of these fields were identified in the results of this study. In particular, both mobile AR and AR audio positioning applications were not identified in the main paths because relevant literature is lacking in both areas. Additionally, our literature review only reported the development of specific fields. While some AR applications may make contributions in specific fields, our results revealed AR application fields that are highly influential or have many published papers, indicating rich content. Of the five identified major groups of AR research topics, four were unrelated to the medical field. To further explore the application of AR technology in nonmedical fields, the number of groups was increased to 10, with each group comprising more than 50 papers, to identify five new groups (Table 3). Of the five newly identified groups, the optics and AR image localization groups focused on topics related to AR technology. By contrast, the remaining three groups focused on topics related to AR applications. Specifically, the cultural heritage application group explored approaches that improve user experience and object presence in AR environments to enhance the vitality of cultural heritage. The mobile AR application group focused on enhancing the realness of the virtual experience provided on mobile phones and the implementation of real-time interaction in mobile AR applications. The AR retail group explored the establishment of experiential scenarios for customers to guide them in experiencing retail products in AR environments.
Table 3.
Sixth to tenth major research topic groups.
Previous literature reviews conducted by researchers have focused on the use of AR technology in surgical navigation, education, manufacturing, architecture, and visual tracking. However, of these fields, only surgical navigation, education, and manufacturing appeared in the main paths or subfields of research topics identified in this study. The architecture and visual tracking fields did not appear in the identified main paths because few relevant papers were published in these fields. The mobile AR application field appeared in both the main path analysis and cluster analysis results. By contrast, the AR sound localization field appeared in the main path but was not identified as one of the main groups through cluster analysis. This result indicated that although papers published in the AR sound localization field constituted a small proportion of all papers related to AR, they were rich in content and significant to the development of AR.
5.4. Time Lag between the Publication of Academic and Patent Literature
Scholars investigating the knowledge diffusion relationship between academic and patent literature have revealed that knowledge is first imparted from academic literature [88], and then referenced by patent literature three–nine years after the publication of academic literature [89]. Based on this viewpoint, we conducted text mining on the titles and abstracts of AR-related academic and patent literature to determine the exact year and frequency that specific keywords appeared in the field. The most common keyword to appear in the literature was “Augmented Reality.” From 1993 to 2019, said keyword appeared in the WOS database and was mentioned in 5996 papers. We recorded the publication of academic literature using the publication year and publication of patent literature based on the year the patent went into effect. Figure 12 illustrates an average of 3–12 years of lag for keywords in academic literature to start appearing in patent literature. In general, the publication of patent literature lags behind that of academic literature. Among the top 20 keywords, the average time lag was approximately eight years. This result confirms the empirical rule that, in the AR field, patent literature lags behind academic literature.
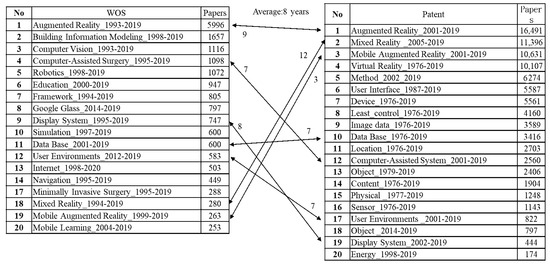
Figure 12.
Time lag between the publication of academic and patent literature.
5.5. Recent Development Direction of AR-Related Academic Research
Based on the results in the previous section, the new keywords that have emerged in recent years could be used to predict the future development direction and as a reference for the research and development planning of the industry. First, we analyzed academic literature published between 2015 and 2019 by subjecting their titles and abstracts to text mining to identify the top 20 keywords. Subsequently, we analyzed academic literature published between 2011 and 2014 in the same manner. The results were then compared by selecting keywords that appeared in literature published between 2015 and 2019 over 10 times but did not appear between 2011 and 2014 over 20 times or at all. These keywords represent novel AR research topics in academia between 2015 and 2019, and are potential development directions for future patent technology. Our comparison results revealed that novel AR research topics in academia between 2016 and 2019 were AR neuro-navigation, Pokemon Go, AR spatial augmented reality, AR virtual environments, AR physical activity, and AR scenarios. Any party interested in the AR field can employ these topics as a reference for future planning. Empirical research in the AR neuro-navigation field has proven AR to be a reliable and universal tool. When employed in minimally invasive surgery, AR applications can be used to treat common neurosurgical diseases (195 in total), specifically 75 tumor diseases (38.46%), 77 neurovascular diseases (39.48%), hydrocephalus (0.51%), and 42 unidentifiable diseases (21.53%). However, prospective randomized studies on AR applications are yet to be performed and still require advancements in AR technology. Pokemon Go employs a wireless network and GPS through mobile signals to access the geographic coordinates of users; such location-based services can be applied in various fields. Spatial AR uses a projector to project virtual images onto actual objects to combine virtual and actual objects. This type of AR application generally does not require the use of monitors, headsets, or handheld devices and can provide additional functions to actual objects and scenarios. AR virtual environments involve the use of AR interfaces to resolve problems in interacting with virtual targets and user tracking. These activities require highly accurate tracking and registration technologies and an intuitive and multifunctional interface. In AR physical activities, AR technology is integrated into a physical education training system to enable users to perform exercise activities through AR in their free time, thus providing them with health benefits. AR scenarios, a type of environment-based learning, provide learners with an immersive training environment; they can respond to simulated work challenges that may occur in their actual work. Additionally, learners are provided with real feedback that reflects their decision-making.
6. Conclusions
This study used main path analysis, cluster analysis, and text mining to determine the overall development trajectory of academic papers related to AR technology and applications. The main path analysis results revealed that early scholars mostly focused on the application of AR technology in surgical navigation. The rapid development of AR technology in recent years has reduced the cost of AR products, which has rendered them affordable in various industries. Therefore, AR technology has been gradually applied in education and manufacturing. The cluster analysis and text mining results yielded five major groups of AR research topics, namely AR surgical navigation, education, manufacturing, architecture, and visual tracking applications. The following are five conclusions:
- AR Applications in Surgical Navigation: AR applications in surgical navigation enhance surgical accuracy, reduce surgical risks, and facilitate medical education and anatomical training and benefit medical surgery. Thus, these AR applications reduce errors in surgery and remote diagnosis.
- AR Applications in Education: The aforementioned authors suggested that researchers should focus their future research on AR mobile learning. Overall, the use of AR technology in education can improve students’ attention and learning experience.
- AR Applications in Manufacturing: The application of AR technology in manufacturing mostly involves a combination of AR technology and human-machine interfaces to help on-site managers monitor the status of manufacturing equipment, determine the condition of production lines, reduce time consumption, and increase profits.
- AR Applications in Manufacturing: AR effects through tablets and providing design information at construction sites to facilitate communication between on-site workers. AR applications also help managers to monitor the quality of construction sites.
- AR Applications in Visual Tracking: AR visual tracking technology involves the use of AR images in applications, along with finger tracking technology, to mark and locate targets.
In addition, two relatively special emerging applications were found in the clusters, i.e., AR cultural heritage applications and AR retail industry applications, as recommendations for scholars to study the direction of AR technology applications:
- AR cultural heritage applications inspire a strong sense of presence and participation of the experiencers, and bring new vitality to cultural heritage.
- AR retail industry applications allow consumers to try out products in the environment, find suitable products more accurately, and stimulate consumers’ purchasing power.
AR mobile application and AR audio positioning in the Key-route Main Path do not appear in the five major clusters, indicating that these two research topics are influential, but the relevant academic literature may not be plentiful. Therefore, relevant scholars or industries can focus on these two Research topics.
- AR mobile application: For companies that want to introduce AR interactive interfaces in the future, this makes the process much easier. Not only can they bring new management and interaction methods internally, they can also add more realism when launching new products or application services, including immersive content and creativity to enhance the customer experience.
- AR audio positioning: in image positioning, audio positioning can replace image positioning when an image cannot be identified. At present, perceptual audio positioning using low-frequency ultrasonic signal processing technology has been proposed, which uses ultrasound to detect positioning.
Our text mining analysis of academic and patent literature confirmed that, in the AR field, academic research precedes patent development. Subsequently, five novel research topics in the academic research field of AR within the past four years were identified and inferred as possible future directions for patent portfolios. Parties interested in AR technology development may reference these topics for planning future research and development strategies. The present study employed a literature review and technological forecasting to propose a new approach feasible for future studies.
In this study, we collected AR-related papers from the Web of Science database and conducted a literature review. A limitation of this study was that publication bias might have affected the analysis results. However, the methods adopted in this study can serve as alternative approaches for scholars to conduct future literature reviews and technology forecasting.
Author Contributions
Final approval of the manuscript: all authors. Conceptualization, W.-H.S. and Y.-C.H.; methodology, L.Y.Y.L.; software, W.-H.S.; validation, W.-H.S., K.-Y.C. and L.Y.Y.L.; formal analysis, W.-H.S.; investigation, Y.-C.H.; resources, L.Y.Y.L.; data curation, W.-H.S.; writing—original draft preparation, Y.-C.H.; writing—review and editing, W.-H.S.; visualization, K.-Y.C.; supervision, L.Y.Y.L.; project administration, W.-H.S.; funding acquisition, K.-Y.C. All authors have read and agreed to the published version of the manuscript.
Funding
This research was supported by a grant of the National Taipei University of Technology.
Data Availability Statement
Data available in a publicly accessible repository.
Conflicts of Interest
The authors declare no conflict of interest.
References
- Azuma, R. A survey of augmented reality. Presence 1997, 6, 355–385. [Google Scholar] [CrossRef]
- Bellarbi, A.; Zenati, N.; Otmane, S.; Belghit, H. Learning moment-based fast local binary descriptor. J. Electron. Imaging 2017, 26, 023006. [Google Scholar] [CrossRef]
- Augmented/Virtual Reality Revenue Forecast Revised to Hit $120 Billion by 2020. Available online: https://www.digi-capital.com/news/2016/01/augmentedvirtual-reality-revenue-forecast-revised-to-hit-120-billion-by-2020/ (accessed on 1 November 2019).
- Lu, L.Y.; Liu, J.S. A review of broad technology assessment: Citation-based analysis. In Proceedings of the 2017 IEEE International Conference on Systems, Man, and Cybernetics, Banff, AB, Canada, 5–8 October 2017; pp. 2921–2926. [Google Scholar]
- Thumfart, W.F.; Freysinger, W.; Gunkel, A.R.; Truppe, M.J. 3D image-guided surgery on the example of the 5,300-year-old Innsbruck Iceman. Acta Otolaryngol. 1997, 117, 131–134. [Google Scholar] [CrossRef] [PubMed]
- Freysinger, W.; Gunkel, A.R.; Thumfart, W.F. Image-guided endoscopic ENT surgery. Eur. Arch. Otorhinolaryngol. 1997, 254, 343–346. [Google Scholar] [CrossRef] [PubMed]
- Kawamata, T.; Iseki, H.; Shibasaki, T.; Hori, T. Endoscopic augmented reality navigation system for endonasal transsphenoidal surgery to treat pituitary tumors. Neurosurgery 2002, 50, 1393–1397. [Google Scholar]
- Liao, H.; Hata, N.; Nakajima, S.; Iwahara, M.; Sakuma, I.; Dohi, T. Surgical navigation by autostereoscopic image overlay of integral videography. IEEE Trans. Inf. Technol. Biomed. 2004, 8, 114–121. [Google Scholar] [CrossRef]
- Figl, M.; Ede, C.; Hummel, J.; Wanschitz, F.; Ewers, R.; Bergmann, H.; Birkfellner, W. A fully automated calibration method for an optical see-through head-mounted operating microscope with variable zoom and focus. IEEE Trans. Med. Imaging 2005, 24, 1492–1499. [Google Scholar] [CrossRef] [PubMed]
- Kockro, R.A.; Tsai, Y.T.; Ng, I.; Hwang, P.; Zhu, C.; Agusanto, K.; Serra, L. Dex-ray: Augmented reality neurosurgical navigation with a handheld video probe. Neurosurgery 2009, 65, 795–808. [Google Scholar] [CrossRef] [PubMed]
- Mahvash, M.; Tabrizi, L.B. A novel augmented reality system of image projection for image-guided neurosurgery. Acta Neurochir. 2013, 155, 943–947. [Google Scholar] [CrossRef] [PubMed]
- Cabrilo, I.; Sarrafzadeh, A.; Bijlenga, P.; Landis, B.N.; Schaller, K. Augmented reality-assisted skull base surgery. Neurochirurgie 2014, 60, 304–306. [Google Scholar] [CrossRef]
- Ferrer-Torregrosa, J.; Torralba, J.; Jimenez, M.A.; García, S.; Barcia, J.M. ARBOOK: Development and assessment of a tool based on augmented reality for anatomy. J. Sci. Educ. Technol. 2015, 24, 119–124. [Google Scholar] [CrossRef]
- Akçayir, M.; Akçayır, G.; Pektaş, H.M.; Ocak, M.A. Augmented reality in science laboratories: The effects of augmented reality on university students’ laboratory skills and attitudes toward science laboratories. Comput. Hum. Behav. 2016, 57, 334–342. [Google Scholar] [CrossRef]
- Akçayır, M.; Akçayır, G. Advantages and challenges associated with augmented reality for education: A systematic review of the literature. Educ. Res. Rev. 2017, 20, 1–11. [Google Scholar] [CrossRef]
- Jetter, J.; Eimecke, J.; Rese, A. Augmented reality tools for industrial applications: What are potential key performance indicators and who benefits? Comput. Hum. Behav. 2018, 87, 18–33. [Google Scholar] [CrossRef]
- Rauschnabel, P.A.; Felix, R.; Hinsch, C. Augmented reality marketing: How mobile AR-apps can improve brands through inspiration. J. Retail. Consum. Serv. 2019, 49, 43–53. [Google Scholar] [CrossRef]
- Jeon, K.M.; Chun, C.J.; Kim, H.K.; Lee, M.J. User-aware audio marker using low frequency ultrasonic object detection and communication for augmented reality. Appl. Sci. 2019, 9, 2004. [Google Scholar] [CrossRef]
- Lee, C.-F.; Tseng, F.-M.; Lu, L.Y.Y. The development trajectory of virtual reality literature in main areas. J. Technol. Manag. 2018, 23, 61–96. [Google Scholar]
- Liu, J.S.; Lu, L.Y.; Hsieh, C.H.; Chen, S.J. Developmental trajectory and trend of the broad virtual reality. J. Manag. Syst. 2019, 26, 427–449. [Google Scholar]
- Hummon, N.P.; Doreian, P. Connectivity in a citation network: The development of DNA theory. Soc. Netw. 1989, 11, 39–63. [Google Scholar] [CrossRef]
- Batagelj, V. Efficient algorithms for citation network analysis. arXiv 2003, 41, 897. [Google Scholar]
- Liu, J.S.; Lu, L.Y. An integrated approach for main path analysis: Development of the Hirsch index as an example. J. Am. Soc. Inf. Sci. Technol. 2012, 63, 528–542. [Google Scholar] [CrossRef]
- Lin, T.J.; Duh, H.B.L.; Li, N.; Wang, H.Y.; Tsai, C.C. An investigation of learners’ collaborative knowledge construction performances and behavior patterns in an augmented reality simulation system. Comput. Educ. 2013, 68, 314–321. [Google Scholar] [CrossRef]
- Ho, J.C.; Saw, E.C.; Lu, L.Y.; Liu, J.S. Technological barriers and research trends in fuel cell technologies: A citation network analysis. Technol. Forecast. Soc. Chang. 2014, 82, 66–79. [Google Scholar] [CrossRef]
- Liu, J.S.; Lu, L.Y.; Lu, W.M. Research fronts in data envelopment analysis. Omega 2016, 58, 33–45. [Google Scholar] [CrossRef]
- Chuang, T.C.; Liu, J.S.; Lu, L.Y.; Tseng, F.M.; Lee, Y.; Chang, C.T. The main paths of eTourism: Trends of managing tourism through Internet. Asia Pac. J. Tour. Res. 2017, 22, 213–231. [Google Scholar] [CrossRef]
- Verspagen, B. Mapping technological trajectories as patent citation networks: An study on the history of fuel cell research. Adv. Complex Syst. 2007, 10, 93–115. [Google Scholar] [CrossRef]
- Fontana, R.; Nuvolari, A.; Verspagen, B. Mapping technological trajectories as patent citation networks: An application to data communication standards. J. Manag. Stud. 2009, 49, 1351–1374. [Google Scholar] [CrossRef]
- Consoli, D.; Mina, A. An evolutionary perspective on health innovation system. J. Evol. Econ. 2009, 19, 297–319. [Google Scholar] [CrossRef]
- Liu, J.S.; Lu, L.Y.; Lin, L. Analyzing technological trajectory via patent citation network: An application to Radio Frequency Identification Technology (RFID). Scientometrics 2011, 82, P1–P90. [Google Scholar]
- Yan, J.; Tseng, F.M.; Lu, L.Y. Developmental trajectories of new energy vehicle research in economic management: Main path analysis. Technol. Forecast. Soc. Chang. 2018, 137, 168–181. [Google Scholar] [CrossRef]
- Hirsch, J.E. An index to quantify an individual’s scientific research output. Proc. Natl. Acad. Sci. USA 2005, 102, 16569–16572. [Google Scholar] [CrossRef]
- Egghe, L. Theory and practise of the g-index. Scientometrics 2006, 69, 131–152. [Google Scholar] [CrossRef]
- Girvan, M.; Newman, M.E. Community structure in social and biological networks. Proc. Natl. Acad. Sci. USA 2002, 99, 7821–7826. [Google Scholar] [CrossRef] [PubMed]
- Wordle. Web of Science. Available online: http://www.wordle.net/ (accessed on 12 October 2019).
- Verhulst, P.F. Recherches mathématiques sur La Loi D’Accroissement de la population. Nouv. Mémoires Académie R. Sci. Belles-Lett. Brux. 1845, 18, 1–45. [Google Scholar]
- Ploder, O.; Wagner, A.; Enislidis, G.; Ewers, R. Computer-assisted intraoperative visualization of dental implants: Augmented reality in medicine. Radiologe 1995, 35, 569–572. [Google Scholar]
- Edwards, P.J.; King, A.P.; Maurer, C.R.; De Cunha, D.A.; Hawkes, D.J.; Hill, D.L.; Gaston, R.P.; Fenlon, M.R.; Jusczyzck, A.; Strong, A.J.; et al. Design and evaluation of a system for microscope-assisted guided interventions (MAGI). IEEE Trans. Med. Imaging 2000, 19, 1082–1093. [Google Scholar] [CrossRef] [PubMed]
- Wanschitz, F.; Birkfellner, W.; Figl, M.; Patruta, S.; Wagner, A.; Watzinger, F.; Yerit, K.; Schicho, K.; Hanel, R.; Kainberger, F.; et al. Computer-enhanced stereoscopic vision in a head-mounted display for oral implant surgery. Clin. Oral Implant. Res. 2002, 13, 610–616. [Google Scholar] [CrossRef]
- Wagner, A.; Ploder, O.; Enislidis, G.; Truppe, M.; Ewers, R. Image-guided surgery. Int. J. Oral Maxillofac. Surg. 1996, 25, 147–151. [Google Scholar] [CrossRef]
- Paul, P.; Fleig, O.; Jannin, P. Augmented virtuality based on stereoscopic reconstruction in multimodal image-guided neurosurgery: Methods and performance evaluation. IEEE Trans. Med. Imaging 2005, 24, 1500–1511. [Google Scholar] [CrossRef] [PubMed]
- Inoue, D.; Cho, B.; Mori, M.; Kikkawa, Y.; Amano, T.; Nakamizo, A.; Hashizume, M. Preliminary study on the clinical application of augmented reality neuronavigation. J. Neurol. Surg. A Cent. Eur. Neurosurg. 2013, 74, 71–76. [Google Scholar] [CrossRef] [PubMed]
- Birkfellner, W.; Figl, M.; Huber, K.; Watzinger, F.; Wanschitz, F.; Hummel, J.; Hanel, R.; Greimel, W.; Homolka, P.; Ewers, R.; et al. A head-mounted operating binocular for augmented reality visualization in medicine-design and initial evaluation. IEEE Trans. Med. Imaging 2002, 21, 991–997. [Google Scholar] [CrossRef]
- Cabrilo, I.; Bijlenga, P.; Schaller, K. Augmented reality in the surgery of cerebral arteriovenous malformations: Technique assessment and considerations. Acta Neurochir. 2015, 156, 1769–1774. [Google Scholar] [CrossRef]
- Carl, B.; Bopp, M.; Saß, B.; Pojskic, M.; Nimsky, C. Augmented reality in intradural spinal tumor surgery. Acta Neurochir. 2019, 161, 2181–2193. [Google Scholar] [CrossRef] [PubMed]
- Cabrilo, I.; Schaller, K.; Bijlenga, P. Augmented reality-assisted bypass surgery: Embracing minimal invasiveness. World Neurosurg. 2015, 83, 596–602. [Google Scholar] [CrossRef]
- Gibby, J.T.; Swenson, S.A.; Cvetko, S.; Rao, R.; Javan, R. Head-mounted display augmented reality to guide pedicle screw placement utilizing computed tomography. Int. J. Comput. Assist. Radiol. Surg. 2019, 14, 525–535. [Google Scholar] [CrossRef] [PubMed]
- Liebmann, F.; Roner, S.; von Atzigen, M.; Scaramuzza, D.; Sutter, R.; Snedeker, J.; Farshad, M.; Fürnstahl, P. Pedicle screw navigation using surface digitization on the microsoft HoloLens. Int. J. Comput. Assist. Radiol. Surg. 2019, 14, 1157–1165. [Google Scholar] [CrossRef]
- Sauer, I.M.; Queisner, M.; Tang, P.; Moosburner, S.; Hoepfner, O.; Horner, R.; Pratschke, J. Mixed reality in visceral surgery: Development of a suitable workflow and evaluation of intraoperative use-cases. Ann. Surg. 2017, 266, 706–712. [Google Scholar] [CrossRef]
- Khor, W.S.; Baker, B.; Amin, K.; Chan, A.; Patel, K.; Wong, J. Augmented and virtual reality in surgery—the digital surgical environment: Applications, limitations and legal pitfalls. Ann. Transl. Med. 2016, 4, 454. [Google Scholar] [CrossRef] [PubMed]
- Kaufmann, H.; Schmalstieg, D. Mathematics and geometry education with collaborative augmented reality. In Proceedings of the ACM SIGGRAPH 2002 Conference Abstracts and Applications, Orlando, FL, USA, 2 July 2002; pp. 37–41. [Google Scholar]
- Martinetti, A.; Marques, H.C.; Singh, S.; van Dongen, L. Reflections on the limited pervasiveness of augmented reality in industrial sectors. Appl. Sci. 2019, 9, 3382. [Google Scholar] [CrossRef]
- Martín-Gutiérrez, J.; Saorín, J.L.; Contero, M.; Alcañiz, M.; Pérez-López, D.C.; Ortega, M. Design and validation of an augmented book for spatial abilities development in engineering students. Comput. Graph. 2010, 34, 77–91. [Google Scholar] [CrossRef]
- Cheng, K.H.; Tsai, C.C. Affordances of augmented reality in science learning: Suggestions for future research. J. Sci. Educ. Technol. 2013, 22, 449–462. [Google Scholar] [CrossRef]
- Ibáñez, M.B.; Di Serio, Á.; Villarán, D.; Kloos, C.D. Experimenting with electromagnetism using augmented reality: Impact on flow student experience and educational effectiveness. Comput. Educ. 2014, 71, 1–13. [Google Scholar] [CrossRef]
- Sommerauer, P.; Müller, O. Augmented reality in informal learning environments: A field experiment in a mathematics exhibition. Comput. Educ. 2014, 79, 59–68. [Google Scholar] [CrossRef]
- Ibáñez, M.B.; Delgado-Kloos, C. Augmented reality for STEM learning: A systematic review. Comput. Educ. 2018, 123, 109–123. [Google Scholar] [CrossRef]
- Cabero-Almenara, J.; Roig-Vila, R. The motivation of technological scenarios in Augmented Reality (AR): Results of different experiments. Appl. Sci. 2019, 9, 2907. [Google Scholar] [CrossRef]
- Quintero, J.; Baldiris Navarro, S.M.; Rubira, R.; Cerón, J.; Velez, G. Augmented reality in educational inclusion: A systematic review on the last decade. Front. Psychol. 2019, 10, 1835. [Google Scholar] [CrossRef] [PubMed]
- Fidan, M.; Tuncel, M. Integrating augmented reality into problem based learning: The effects on learning achievement and attitude in physics education. Comput. Educ. 2019, 142, 103635. [Google Scholar] [CrossRef]
- Arici, F.; Yildirim, P.; Caliklar, Ş.; Yilmaz, R.M. Research trends in the use of augmented reality in science education: Content and bibliometric mapping analysis. Comput. Educ. 2019, 142, 103647. [Google Scholar] [CrossRef]
- Raghavan, V.; Molineros, J.; Sharma, R. Interactive evaluation of assembly sequences using augmented reality. IEEE Trans. Rob. Autom. 1999, 15, 435–449. [Google Scholar] [CrossRef]
- Liverani, A.; Amati, G.; Caligiana, G. A CAD-augmented reality integrated environment for assembly sequence check and interactive validation. Concurr. Eng. 2004, 12, 67–77. [Google Scholar] [CrossRef]
- Chen, C.J.; Hong, J.; Wang, S.F. Automated positioning of 3D virtual scene in AR-based assembly and disassembly guiding system. Int. J. Adv. Manuf. Technol. 2015, 76, 753–764. [Google Scholar] [CrossRef]
- Wang, Z.B.; Ong, S.K.; Nee, A.Y.C. Augmented reality aided interactive manual assembly design. Int. J. Adv. Manuf. Technol. 2013, 69, 1311–1321. [Google Scholar] [CrossRef]
- Yuan, M.L.; Ong, S.K.; Nee, A.Y.C. Augmented reality for assembly guidance using a virtual interactive tool. Int. J. Prod. Res. 2008, 46, 745–1767. [Google Scholar] [CrossRef]
- Wang, X.; Ong, S.K.; Nee, A.Y. A comprehensive survey of augmented reality assembly research. Adv. Manuf. 2016, 4, 1–22. [Google Scholar] [CrossRef]
- Uva, A.E.; Gattullo, M.; Manghisi, V.M.; Spagnulo, D.; Cascella, G.L.; Fiorentino, M. Evaluating the effectiveness of spatial augmented reality in smart manufacturing: A solution for manual working stations. Int. J. Adv. Manuf. Technol. 2018, 94, 509–521. [Google Scholar] [CrossRef]
- Gattullo, M.; Scurati, G.W.; Fiorentino, M.; Uva, A.E.; Ferrise, F.; Bordegoni, M. Towards augmented reality manuals for industry 4.0: A methodology. Robot. Comput. Integr. Manuf. 2019, 56, 276–286. [Google Scholar] [CrossRef]
- Masood, T.; Egger, J. Augmented reality in support of Industry 4.0—Implementation challenges and success factors. Robot. Comput. Integr. Manuf. 2019, 58, 181–195. [Google Scholar] [CrossRef]
- Siew, C.Y.; Ong, S.K.; Nee, A.Y.C. A practical augmented reality-assisted maintenance system framework for adaptive user support. Robot. Comput. Integr. Manuf. 2019, 59, 115–129. [Google Scholar] [CrossRef]
- Malkawi, A.M.; Srinivasan, R.S. A new paradigm for human-building interaction: The use of CFD and Augmented Reality. Autom. Constr. 2005, 14, 71–84. [Google Scholar] [CrossRef]
- Wang, X.; Dunston, P.S. Compatibility issues in Augmented Reality systems for AEC: An experimental prototype study. Autom. Constr. 2006, 15, 314–326. [Google Scholar] [CrossRef]
- Wang, X.; Dunston, P.S. User perspectives on mixed reality tabletop visualization for face-to-face collaborative design review. Autom. Constr. 2008, 17, 399–412. [Google Scholar] [CrossRef]
- Kim, B.; Kim, C.; Kim, H. Interactive modeler for construction equipment operation using augmented reality. J. Comput. Civ. Eng. 2012, 26, 331–341. [Google Scholar] [CrossRef]
- Chi, H.L.; Kang, S.C.; Wang, X. Research trends and opportunities of augmented reality applications in architecture, engineering, and construction. Autom. Constr. 2013, 33, 116–122. [Google Scholar] [CrossRef]
- Meža, S.; Turk, Ž.; Dolenc, M. Component based engineering of a mobile BIM-based augmented reality system. Autom. Constr. 2014, 42, 1–12. [Google Scholar] [CrossRef]
- Abanda, F.H.; Vidalakis, C.; Oti, A.H.; Tah, J.H. A critical analysis of Building Information Modelling systems used in construction projects. Adv. Eng. Softw. 2015, 90, 183–201. [Google Scholar] [CrossRef]
- Santos, R.; Costa, A.A.; Grilo, A. Bibliometric analysis and review of Building Information Modelling literature published between 2005 and 2015. Autom. Constr. 2017, 80, 118–136. [Google Scholar] [CrossRef]
- Oraee, M.; Hosseini, M.R.; Papadonikolaki, E.; Palliyaguru, R.; Arashpour, M. Collaboration in BIM-based construction networks: A bibliometric-qualitative literature review. Int. J. Proj. Manag. 2017, 35, 1288–1301. [Google Scholar] [CrossRef]
- DiVerdi, S.; Höllerer, T. Heads up and camera down: A vision-based tracking modality for mobile mixed reality. IEEE Trans. Vis. Comput. Graph. 2008, 14, 500–512. [Google Scholar] [CrossRef]
- Wagner, D.; Reitmayr, G.; Mulloni, A.; Drummond, T.; Schmalstieg, D. Real-time detection and tracking for augmented reality on mobile phones. IEEE Trans. Vis. Comput. Graph. 2010, 16, 355–368. [Google Scholar] [CrossRef]
- Gauglitz, S.; Höllerer, T.; Turk, M. Evaluation of interest point detectors and feature descriptors for visual tracking. Int. J. Comput. Vis. 2011, 94, 335. [Google Scholar] [CrossRef]
- Kurz, D.; Benhimane, S. Handheld augmented reality involving gravity measurements. Comput. Graph. 2012, 36, 866–883. [Google Scholar] [CrossRef]
- Marchand, E.; Uchiyama, H.; Spindler, F. Pose estimation for augmented reality: A hands-on survey. IEEE Trans. Vis. Comput. Graph. 2016, 22, 2633–2651. [Google Scholar] [CrossRef] [PubMed]
- Elhaouari, K.; Cherif, L. GMD: Geometric model-based local binary descriptor. Signal Image Video Process. 2019, 13, 289–297. [Google Scholar] [CrossRef]
- Azuma, R. Tracking requirements for augmented reality. Commun. ACM 1993, 36, 50–51. [Google Scholar] [CrossRef]
- Masahiro, O.; Kimio, M.; Masami, A. Background Noise/Speech Classification Method. U.S. Patent US 6,202,046, 13 March 2001. [Google Scholar]


Publisher’s Note: MDPI stays neutral with regard to jurisdictional claims in published maps and institutional affiliations. |
© 2021 by the authors. Licensee MDPI, Basel, Switzerland. This article is an open access article distributed under the terms and conditions of the Creative Commons Attribution (CC BY) license (http://creativecommons.org/licenses/by/4.0/).