1. Introduction
This paper presents a predictive model of passenger flows at railway stations and their key areas (entrance groups), which, combined with data on passenger satisfaction, allowed assessing the impact of passenger flow on satisfaction with transport services.
Demand for railway transportation, as an integral part of public transport, remains high. Thus, a research conducted in Great Britain says that “in the last decade the number of rail passenger journeys in Great Britain has increased by half” [
1]. In Russia, given its geographical extent, railroads are an essential part of transport infrastructure. In turn, the crucial element of the railway infrastructure is passenger stations and hubs. The COVID-19 spread has a significant impact on consumer behavior and demand, especially in large cities [
2].
Moscow is a growing metropolitan city; according to state statistics, the number of Moscow’s permanent residents has grown by almost 11% over the past 10 years (from 11,382.2 thousand in 2010 to 12,615.3 thousand in 2019) [
3]. Additionally, people from the suburbs come to Moscow to work every day, significantly increasing the passenger flow at the city’s railway stations at the rush hours.
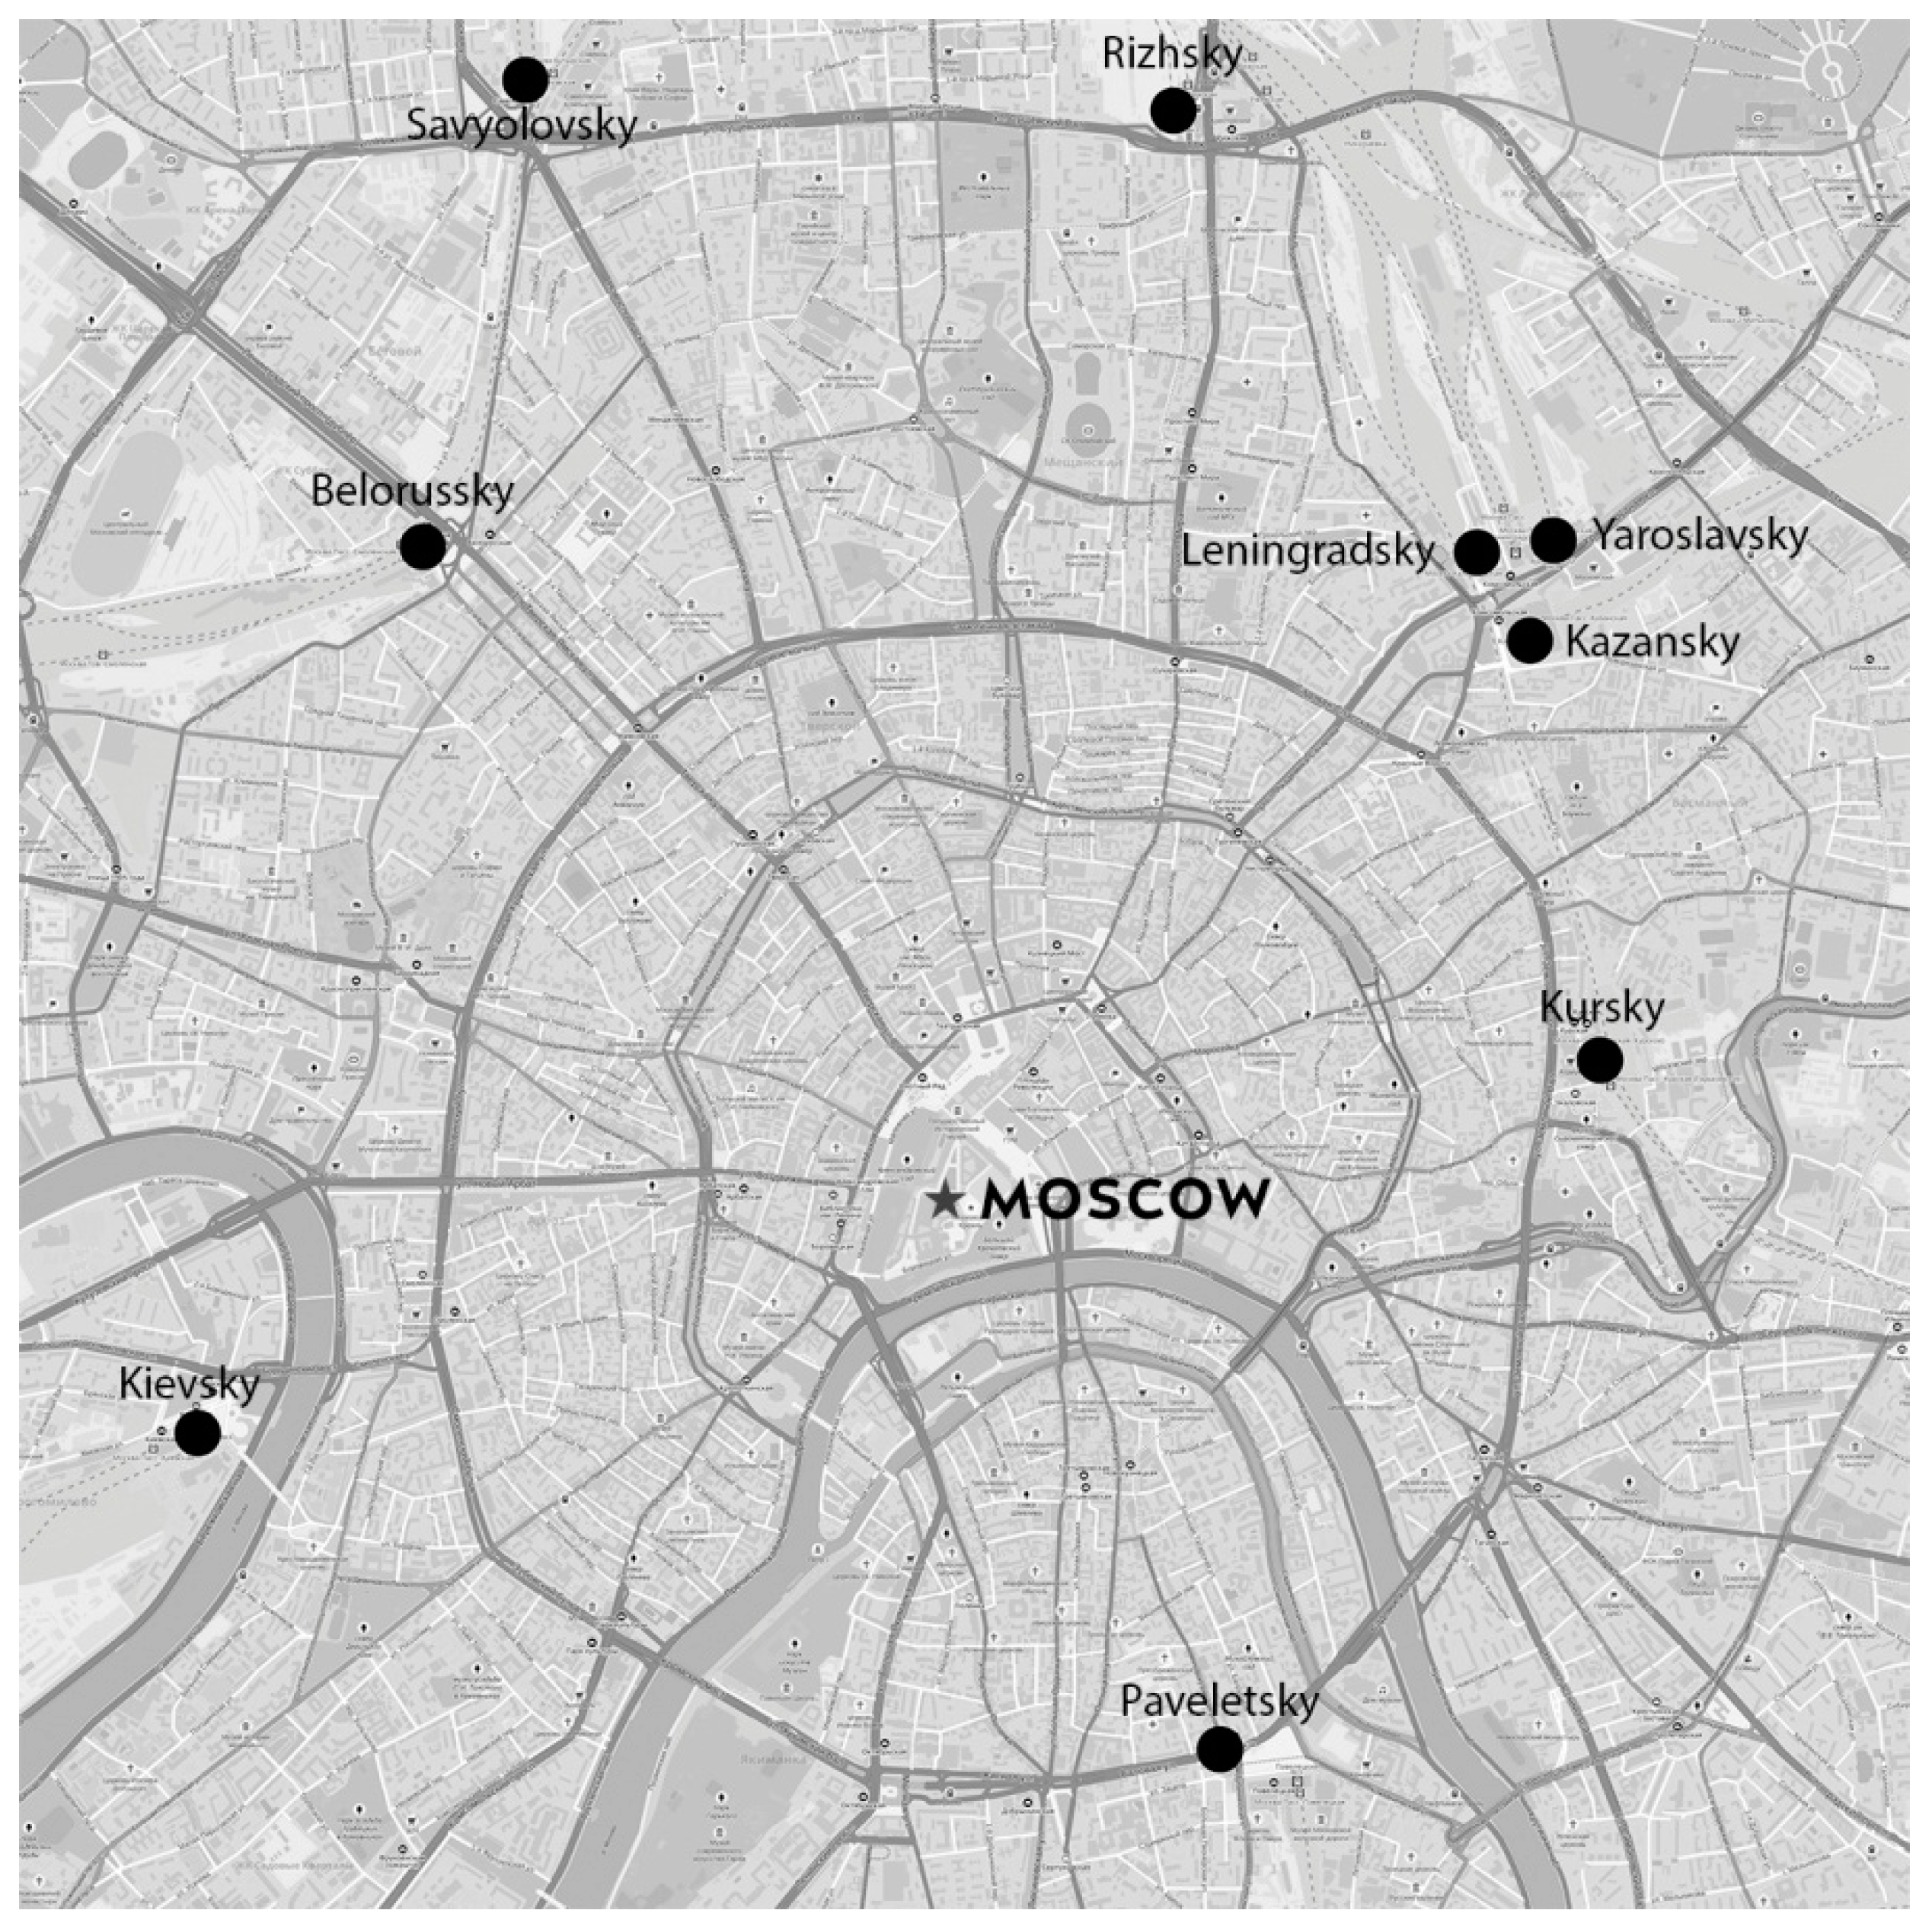
Railroad transport plays a pivotal role in ensuring the mobility of citizens and provides uninterrupted communication of Moscow with other regions. There are nine railway stations in Moscow; two more are going to open soon.
Moscow has a dense network of local suburban commuter trains, integrated to Moscow’s Underground system. The railway network is far more dominant than the Moscow Underground in some districts of the city. In the center of Moscow where most of the sights and hotels are, the Moscow Underground dominates.
There are 102 suburban train stopping points (railway platforms) and 331 metro stations in Moscow. The total length of the railway network in Russia is 85,281 km.
Railway stations are the final stations of different railway directions and serve as large transport hubs connecting Moscow, the Moscow region and other regions. Moscow’s transport passes that nearly everyone uses allow you to travel seamlessly across all modes of transport, where bus, Underground and most of the local suburban commuter trains using the same ticket/pass.
Although the railways are run by a separate company to the Moscow Underground the level of integration has stepped up a lot in recent years. The integration process is ongoing. New stations of Moscow’s Underground system and commuter trains are opening and transfer hubs are being built between the Underground system and railway network of the city.
Therefore, the analysis and management of passenger flows at rail stations is an extremely important task for Moscow City.
Currently, transport security in Moscow is provided in the following areas
Protection from acts of unlawful interference (terrorist acts, various criminal acts, transportation of prohibited substances and items):
Inspection measures at bus stations and train stations. Checkpoints at the borders of transport security zones are equipped with modern equipment and technical means of inspection that allow detecting and detecting items and substances prohibited for transportation by rail;
Video surveillance at transport infrastructure facilities and vehicles themselves;
Informing passengers over the loudspeaker about the rules of conduct in case of detection of unattended items, suspicious items;
conducting additional training sessions for employees of transport organizations;
use of monitoring and communication systems in vehicles using GLONASS/GPS satellite navigation devices.
Antiepidemic safety Measures
Disinfection and sanitation of vehicles;
Medical examination of employees;
UV disinfection of the air;
Informing passengers about the need to comply with antiepidemic rules on transport (keeping a distance of 1.5–2 m, wearing masks and gloves).
In this regard, one of the critical tasks for urban management and railway planning is to regulate passenger flows, especially at the entrance groups to the stations. This task, in turn, requires a rationale for the application of forecasting models and evaluation of proposals for new stations, including their placement and introduced innovations in services [
4,
5].
In this paper, we present part of the results of a large-scale research to develop a methodology for assessing the conformity of the standard of service at Moscow stations. The authors have conducted surveys aimed at studying consumer preferences that affect the passengers’ satisfaction and analysis of flows at the entrances and forecasts of the passenger flows. When modeling flows, we used statistical forecasting methods [
6].
The research took place from December 2019 to June 2020. The survey of Moscow railway stations passengers was conducted online. The authors used an observation method to obtain data on current flows [
7] and various sources of secondary data for further modeling.
To model the flows at the station entrances in this study, the authors analyzed the array of secondary data using the IBM SPSS Statistics 20 software package.
A review of the literature has revealed a lack of research on the relationship between the prediction of passenger flows at the entrances of stations and the impact of passenger flow on satisfaction with the transport service of station facilities. We believe that passenger flow at the stations and the possibility to enter the stations without delays or with minimal delays can significantly affect overall satisfaction with the services of the stations. All of this has defined the aims of this research:
To analyze the passengers’ satisfaction with Moscow railway stations
To study the current passenger flow to Moscow railway stations (on the basis of open statistics data)
To evaluate the impact of the intensity of passenger flow on the level of satisfaction of passengers and visitors with Moscow railway stations
To assess the current passenger flow to Moscow stations through the entrance groups of stations (on the basis of observation and of passenger flow measurement)
To evaluate the capacity of entrance groups at the stations and compare it with the existing passenger flow
To determine the time that visitors to the railway stations considered acceptable for entering the territory of the station facility
To identify stations where the capacity of entrance groups will not meet the time proper for passengers to pass on the territory of the station
The following hypotheses were developed proceeding from the established research aims:
Hypothesis 1. The intensity of the flow at the station affects the satisfaction of passengers with the station.
Hypothesis 2. The intensity of passenger flow in key areas of the station impacts passenger satisfaction with the station functioning.
The modeling results showed that passenger flow has an impact on passengers’ and visitors’ satisfaction. Predictive models have allowed us to estimate a passenger flow on entrance groups of stations. In contrast, the marketing researches allowed us to reveal the admissible time that visitors are ready to spend entering station territory. This, in turn, has allowed identifying railway stations with the insufficient capacity of entrance groups.
The research is innovative, as it reveals causal links between passenger satisfaction and passenger flow. Secondly, the regression model built by the authors made it possible to assess the degree of influence of passenger flow on the satisfaction of passengers and visitors with station facilities. Thirdly, the authors used the assessment of passenger flow in the entrance groups to estimate the capacity and also to compare it with the expectations of passengers about the proper time to enter the territory of the station facilities.
We assume that both city and railway administrations can use the results obtained for planning and managing the entrances to the station and the flows in the focal areas of the stations, using various innovative solutions.
The results of the study can be used for planning station reconstruction and managing passenger flows.
The research’s originality and value is that it deals with the way passenger flows at the entrances to the station affect passenger satisfaction.
2. Literature Review
2.1. Impact of Open Innovation on Technological and Organizational Decisions
The open innovation model is gaining popularity among companies around the world with the rising cost of innovation, as well as the growing amount of innovation [
8]. At the same time, an important issue for researchers is the influence of culture on the adaptation of consumers and entrepreneurs to the dynamics of open innovation [
9]. Several studies have shown that the dynamics of technology adoption is driven not only by the contextual description of an organization but by consumers. In addition to the perceived usefulness of the technology being an important factor for them, so is the significance of its social and environmental aspects [
10]. The solution to this problem is to constantly improve their products, services and business models. A special role in the context of the “fourth industrial revolution” is acquired by state bodies, whose task changes from regulation to assistance [
11] based on the relationship “concepts relating to open innovation, complex adaptive systems, and evolutionary change” [
12].
The literature notes that “researchers have recently emphasized the relevance of business model innovation (BMI)” [
13].
Open innovation involves various public and private institutions. Industry, government, university and society, following the policy of open innovation, create micro and macrodynamics, which leads to positive changes in all areas. One of the key issues in the context of exploiting open innovation in transport systems is to reconcile of transport stakeholders trying to maximize their own benefits. This issue is in addition to technical, financial and environmental constraints and public interests [
14].
Thus, it can be assumed that the business model in the context of open innovation is a cognitive tool between innovation and economic value, which relies on customer value (open flows of knowledge about market needs and technology potential, as well as collaboration with customers).
Consequently, additional research is required in the channels of open innovation engineering to stimulate business to intensify incoming or outgoing open innovation and for the development of a system of open innovation [
15]. Our research is done with respect for the concept of open innovation. Collaboration of all four participants in open innovation takes place in the study.
2.2. Influence of Various Factors on Passenger Satisfaction with Rail Transport
There is enough published research that shows the major role of consumer research and statistical monitoring of passenger flows for their planning and management. In particular, the National Cooperative Highway Research shows that a client-oriented approach to transport organization is fundamental [
16]. At the same time, both the study itself and the proposed recommendations do not consider the influence of passenger traffic intensity on satisfaction. Various authors note that knowing what factors influence passenger satisfaction with public railway transport is vital for management [
17,
18,
19,
20,
21,
22]. Additionally, the research that examined the Dutch railroad clients noted that, in some cases, the improvement and expansion of access services to the railway station might replace the improvement of rail transport services [
23].
In turn, the review of scientific papers that deal with client-oriented transport carried out by Molander, Fellesson, Friman and Skålén [
24] concludes that “the main contribution of existing research on public transport in the field of market orientation is the knowledge about the opinions and preferences of consumers”. These authors also pointed out the need for new research in the field of ways to generate information and its further use by transport organizations. Special attention in a part of works is given to innovative decisions on railway transport. The researchers also highlight the client-oriented approach, which puts passengers in the center of future innovative solutions on [
25]. In particular, the need to “create a comfortable and intuitive space for users” is paramount [
26], as it should include the entrances to stations. The results of research aimed at understanding the railway clients and their needs (satisfaction) show how the design of technological innovations can improve the quality of passenger service [
27,
28,
29]. The development of these trends can be seen in the proposals for innovative management mechanisms for railway transport, introducing a methodology based on the use of marketing data for forecasting, planning activities and development [
30].
2.3. Consideration of Safety Factors in Railway Transport
In addressing the issue of passenger traffic, some studies emphasize that the increase in passenger traffic at railway stations creates the need to reconstruct existing and build new transport hubs that meet all modern requirements. Thus, it requires diligent work to improve safety [
31], as well as take into account the impact of the surrounding station space on passenger traffic [
32].
In this regard, many transport hubs have passenger and luggage inspection systems. Such systems have a significant impact on passenger flows, including stations in Russia [
33]. At the same time, the result of such innovations is overcrowding of passengers, which, in turn, can cause a negative perception of the railway travel service [
34].
When analyzing passenger flows, the authors use various methods—from observation and statistical analysis to mathematical and 3D-modelling of the movement of passengers on the territory of railway stations—to reduce the time of stay and exclude the possibility of accumulation of people in certain places.
2.4. Research and Modeling of Passenger Flows
The study of flows carried out on the example of railway stations, uses an interesting approach to modeling flows associated with non-recurring events (e.g., train delays), which may cause excessive passenger traffic. At the same time, the solutions proposed by the authors (skip-stops) are suitable for suburban traffic. Still, they cannot always be used as interregional or intercity passenger traffic [
35]. Additionally, this solution does not affect the problem of entering a railway station under the conditions of installing inspection systems. In the analysis of flows, authors rely on the control of flows through managing the train schedule, which in turn does not consider the satisfaction of passengers, such as the time of arrival or departure of trains. A series of other works have considered similar approaches [
36,
37,
38,
39]. Besides several studies describing the application of flow limitation strategies to enter the platforms or through ticket price management [
40]. Such solutions, including network flow management at a group of stations, are useful when the demand for rail transport services exceeds capacity [
41]. Yet they will not be acceptable if there is an alternative to rail transportation and the passenger has a choice (or in the case of irrational behavior). To some extent, these issues are discussed in other works. Thus, Baek and Sohn [
42] analyzed irrational factors in choosing a particular route during rush hours. The authors have shown that time is so significant during rush hours that “crowding” can be ignored. However, these circumstances can also be attributed to suburban trains only. The extent to which “crowding” and congestion at the entrance will affect the behavior of all passengers entering the station requires separate research.
In this regard, the analysis of the impact of overcrowding and congestion, which determines the speed of entering the station, is not sufficiently considered in the literature. Only some publications remotely address this issue. Thus, the authors of the study of railroads in India consider “crowding” one of the critical and negative factors on passenger satisfaction [
43]. In another study, an analysis of the movement of passengers at a station in the UK using video surveillance showed the presence of problematic key areas at the station. The findings of the researchers suggest that an even distribution of passenger flows will increase passenger satisfaction and, ultimately, the preference for rail transport as the most comfortable and safe option [
44].
The closest to our study is the analysis of the flow of passengers at Lanzhou West Railway Station, which allowed us to detect the violation of capacity at the entrance and during the passage of security checkpoints and affect passenger behavior [
45]. To conduct the study, the authors used a simulation model of passenger flow lines. All passenger flows were divided into upper-level flows, platform level flows and underground flows. At the first stage, the current situation was analyzed, and the places of intersection of passenger flows that contribute to overcrowding were identified. As a result, the model of environment and model of passenger behavior in this environment arose. The research resulted in recommendations to change the number of security control points, entrances, and windows of ticket offices.
Passenger satisfaction with station services is most often considered as a set of factors [
21,
46,
47,
48,
49]. At the same time, “access/egress facilities were found to have an important effect on the general perception of traveling by rail” [
50]. The availability factor is highlighted as critical in many studies and is considered in various aspects [
51].
The literature presents a variety of approaches to modeling passenger flows at railway stations. So, for the Beijing City Railway, a mixed integer linear programming model was developed, which takes into account the consistent relationship between the requirements of passenger traffic and strict limits of capacity, allowing minimizing the waiting time of passengers who are in different parts of the station [
52].
To build and analyze passenger flow models, the authors quite often use statistical modeling [
38,
53,
54,
55]. The solution of possible shortcomings of statistical models can be overcome through their joint use with market research [
56].
In individual researches, the authors use agent-based models and consider the dynamic behavior of heterogeneous passengers at the entrance to the station. The studies have shown that modeling results show that moving service points at a station can ease congestion and crowding at key areas. The results will increase passenger satisfaction [
57]. Currently, the literature presents a sufficient number of works, which are based on such approaches to modeling passenger flows at stations [
58,
59]. As practical solutions, numerous authors suggest using the entrance restrictors to the station to reduce crowding [
60,
61,
62,
63] or synchronize transport networks [
64]. At the same time, such modeling approaches come under criticism for excluding passenger opinions from the analysis.
The relationship between access to a train station and consumer behavior is typically examined in studies from the perspective of multimodality between different modes of transport and a train station [
65,
66]. In this consideration, the issue of passage to the station is not singled out separately. As a result, passenger satisfaction is analyzed only in terms of accessibility of a particular station.
Thus, the relevant researches do not afford approaches that analyze passenger flows at the entrances to the stations simultaneously with the assessment of their impact on the satisfaction with the transport service of stations.
In addition, despite the approaches discussed above, for instance used to model flows at the entrance-exit of railway stations in China [
35] or other countries (for example, in Japan [
67]), it is impossible to fully utilize them without considering the influence of culture and consumer habits of particular country. Existing cultural and behavioral differences [
68] are required to be considered when conducting research and modeling the flow of passengers at rail stations.
3. Research Methodology
The researchers faced the task to better understand the behavior of consumers and visitors to station facilities and assess the impact of the passenger flow factor on satisfaction with the transport service of the stations. The results of the study should make it possible to determine the degree of influence of individual service parameters on the impression of consumers and consumer experience. The new results will provide an opportunity to change the existing methods to assess the quality of transport service. They will form the basis for innovative approaches to improve the services of railway stations, which determined the methodology of the research.
The satisfaction survey was based on approaches from the relevant literature [
7]. The main features of the study determined its logical structure. It was necessary to compare objective parameters on the passenger flow at the stations and, particularly, at the entrance groups with a subjective evaluation of satisfaction with the stations and an assessment of the proper time of entering the station territory through the entrance groups.
Thus, the research included: (a) an assessment of objective indicators of passenger traffic at Moscow railway stations; (b) an assessment of satisfaction of passengers and visitors to Moscow railway stations; (c) comparison of objective and subjective indicators to study the impact of the intensity of passenger traffic on the level of satisfaction of passengers and visitors to Moscow railway stations and the construction of an appropriate model.
The logical structure of the study consisted of the following successive stages:
- Stage 1.
The study of passengers and visitors’ satisfaction. We conducted the research using the method of an online survey of consumer “online panel”. The survey was conducted in March 2020 using a quota sample. The calculation of quotas by gender and age parameters provided representativeness of the general population sample by given parameters. OMI consumer online panel was used for the research tasks [
69]. The platform for the online survey was the Survey Monkey platform, which allowed programming questionnaires using complex logic, continuity of answers to related questions, and the ability to program logical transitions from tabular problems with multiple choice.
- Stage 2.
Modeling the influence of the passenger traffic intensity on the level of passenger satisfaction. Estimating of the current passenger flow at Moscow railway stations based on the analysis of statistics on passenger traffic for 2019. To assess the impact on the satisfaction of passenger traffic stations, we used the method of correlation analysis. The correlation coefficient was calculated to analyze the relationship between the satisfaction of visitors to railway stations and passenger traffic.
Since satisfaction is influenced by different parameters of station facilities, it was necessary to construct a model of satisfaction with the work of stations using multidimensional linear regression. In the regression model variables with no strong correlation between them were used as predictors. Based on the results of the built model, the first hypothesis was tested that the intensity of flow at the station affects the satisfaction of passengers.
For statistical analysis and modeling of flows at the station entrances, we used IBM SPSS Statistics 20 software package.
- Stage 3.
Study of complaints and negative feedback on the work of railway station facilities.
We analyzed complaints and negative reviews sent to the directorate using the content analysis. The analysis of statements in social networks used the netnography research methodology [
70]. The processing of an array of received texts was based on linguistic and frequency analysis of the received data. The problem at the railway station served as a criterion for selecting the statements.
The analysis made it possible to draw conclusions about the importance of the problems of passing the entrance groups of the railway stations, among other issues faced by the passengers at the station facilities.
- Stage 4.
Evaluation of the time acceptable for passage of entrance groups of stations according to visitors and passengers. Excess of this period of time will adversely affect the satisfaction of visitors and passengers with station facilities. Timing assessment was carried out using the online survey method, the methodology of which is described above. Representativeness was ensured by quotas in accordance with the structure of the population of Moscow. The screening questions allowed to include only active users of the respective stations in the survey.
- Stage 5.
Evaluation of the intensity of passenger traffic in the entrance groups of stations.
In December 2019, passenger traffic was measured during rush hour in the entrance groups of station facilities. The study used the method of observation [
6,
71]. Measurements of passenger flow were carried out, considering fluctuations of passenger flow during the day and the week. Passenger flow was assessed using the method of visual accounting. Fixing was performed during the time period corresponding to an average passenger flow at the rush hour. Flows were measured manually; measurements were made within 5 min and the result was recorded in the observation sheet. For each station the main measurements were made on Friday (morning and evening rush hour) and on Sunday (morning and evening rush hour). Additionally, verification measurements were made for each station. The measurements were repeated for the days and time of peak passenger traffic load at the key areas (control measurement).
Since the measurements were made within 1 month, the study did not allow tracking seasonal fluctuations in passenger flow at the stations. It requires adjusting the observation data according to the statistics of passenger flow fluctuations during the year. Based on the data of the annual statistics of the passenger flow at the stations, the correction factor was calculated and estimates of the average annual and peak load of the passenger flow at the entrance groups of the stations were made. These data were used to calculate the capacity of entrance groups. Then, the method of comparing the capacity of entrance groups and passenger traffic (annual average and peak) was made an estimate of the formation of queues, “overcrowding” and traffic jams in the entrance groups of stations. That allowed us to draw a conclusion about exceeding the acceptable time of passage of entrance groups and, as a consequence, the reduction of satisfaction with the work of the station facility.
The stages 3–5 allowed us to test the second hypothesis.
However, the poll on a ready-made OMI panel might not show the probability of compliance with the sample of the entire general population. Additionally, when modeling based on statistical methods, there were general limitations inherent in this approach, described in the relevant literature [
72]. An essential constraint is a visual method for measuring the throughput of inputs, including ticket validators’ turnstiles.
Given that the literature notes that there is no mandatory link between the indicators of passenger satisfaction and objective indicators of the effectiveness of public transport [
17], the results may not directly improve the efficiency of railway stations.
4. Results
4.1. Testing Hypothesis 1: The Intensity of the Flow at the Station Affects the Satisfaction of the Passengers
The satisfaction of passengers and visitors for nine railway stations in Moscow was assessed to test the first hypothesis (
Figure 1).
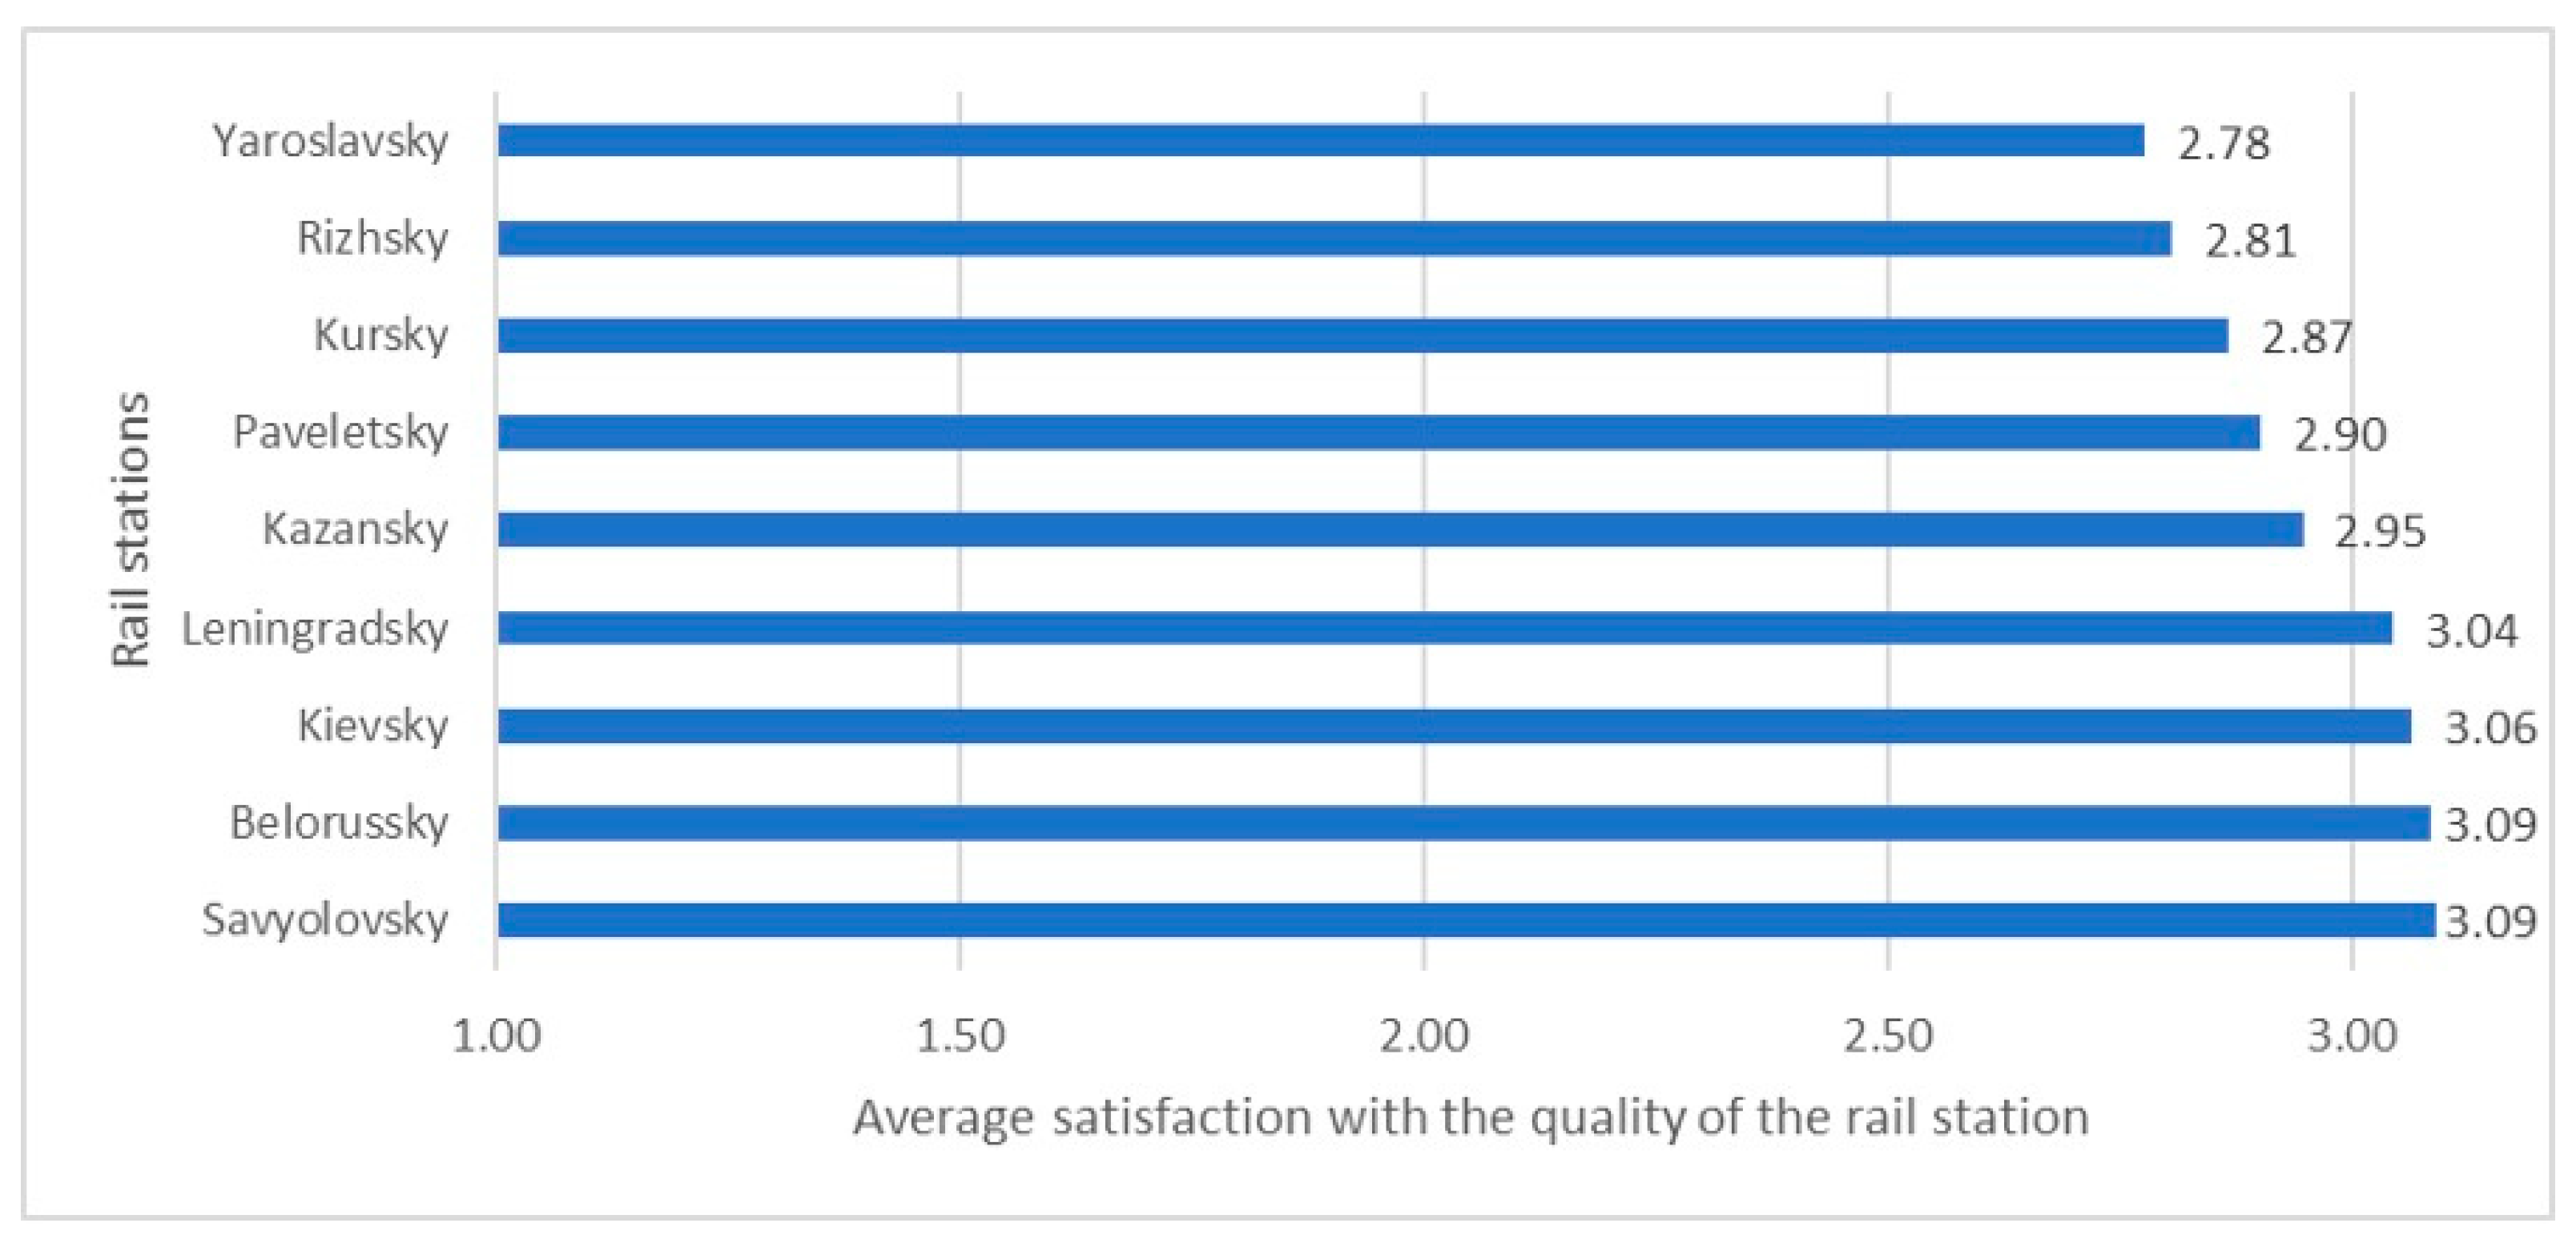
The research took place in March 2020. A total of 1183 respondents participated in the online survey of quality assessment. The quality assessment of each station was given by respondents who most often use its services. We obtained average estimates of passengers’ satisfaction with the work of the railway station (
Figure 2). The rating used a 4-point scale: 1: not satisfied; 2: somewhat not satisfied; 3: somewhat satisfied; 4: completely satisfied.
Savyolovsky, Belorussky, Kievsky and Leningradsky railway stations received the highest satisfaction ratings (the average rating exceeds 3, i.e., the level is higher than “somewhat satisfied”). Yaroslavsky and Rizhsky stations had the lowest scores, but they also had a higher average score of 2.5, indicating a positive score. The differences in the station satisfaction ratings are insignificant (no more than 0.31 points).
At the next stage of verification of the first hypothesis, the passenger flow at the Moscow railway stations had to be evaluated and the satisfaction indices obtained during the research had to be compared.
4.2. Modeling of the Influence of Passenger Flow Intensity on the Level of Satisfaction of Passengers and Visitors at Moscow Railway Stations
As the initial data for estimation of passenger flow, we used the statistical data of portal “Railway Media” (passenger traffic at Moscow stations for 2019) [
73]. The statistical data provided estimates of passenger flow of long-distance trains and suburban trains. As a result of the study, the perceived quality of the stations of long-distance trains’ passenger traffic was not affected (statistically significant connection is not revealed); in 2019, it was 18% of the total passenger traffic at the Moscow stations. Passengers of long-distance trains, as a rule, visit Moscow stations far less often than passengers of suburban trains. For preliminary estimation of influence on the perceived quality of work of stations of passenger traffic of suburban trains the scattering diagram (
Figure 3) was constructed and the correlation coefficient (−0.42) was calculated, which characterizes the statistical linear relation between the average level of satisfaction and passenger traffic as moderate with inverse relation (growth of passenger traffic leads to decrease of satisfaction).
Most of the stations on the scatter plot are on one straight line (except for Rizhsky and Paveletsky stations). If you exclude these two stations, the correlation coefficient is close to −1 (will be equal to −0.97), which suggests a virtually linear relationship. However, the location of Rizhsky and Paveletsky railway stations on the diagram does not allow us to draw such a conclusion.
Therefore, we assumed that the satisfaction of the stations’ functioning is influenced by other factors.
Variables, divided into six groups, were chosen as the quality assessment of the aspects of railway stations’ work that influence the overall satisfaction of passengers:
Satisfaction with conditions:
The convenience of the entrance to the station, including with luggage
The convenience of stay in waiting rooms (the convenience of the room, availability of sockets)
The organization of recreation areas, meals, and work areas
The stability of mobile network signal, including the Internet
The convenience of passing the inspection zones on the territory of the station
The speed of passing the inspection zones on the territory of the station
The behavior and the professional skills of the personnel of the inspection zones on the territory of the station
The quality of passenger screening by the staff of inspection zones on the territory of the station
The quality of luggage inspection by the staff of inspection zones on the territory of the station
The willingness of the staff to provide assistance
The feeling of security on the territory of the station
Satisfaction with ticket and cash services, collision with difficulties (how often they occur):
A large number of people in line
The slow progress of the queue
Not all ticket office desks were opened despite the queue
Rudeness/indifference of the cashier
Incompetence of the cashier
Distraction of the cashier to solve other issues
Closure of the cash desk for a break in case there is a queue in front of the cash desk
Difficulties in finding a terminal at the station
Insufficient number of terminals
A large number of people in a queue to the terminal
The slow speed of the queue to the terminal
Malfunction of the terminal
Inconvenient navigation in the terminal
Slow functioning of the terminal
Difficulties with ticket printing
Difficulties in obtaining a receipt/confirmation document
Difficulties with payment in the terminal
The unsafe environment in the terminal
Information and reference support on the station territory:
Visual navigation is convenient
Visual navigation is understandable
Visual navigation provides relevant information
Audio messages give actual information
The information in the audio communication is understandable
Audio communication is understandable
Audio communication is clearly audible
The information given by the staff is understandable
Level of satisfaction with the sanitary and hygienic condition of the premises and territory of the station:
Cleanliness of the station premises
Cleanliness in the station territory (station territory, platforms, crossings)
The temperature in the premises of the station
The noise level in the premises and on the territory of the station
The smell in the premises and on the territory of the station
Toilets equipment
Cleanliness in the toilets
Level of satisfaction with medical service at the station:
Condition of the medical station premises
The appearance of the employee of the medical station
Willingness to provide assistance from the staff of the medical station
Ease of finding the medical station on the territory of the station complex
The quality of medical service in the medical station at the station complex
Level of satisfaction with the load of the station (passenger traffic):
Number of people on the platforms of the station
The number of people at the entrance to the station
The number of people in the passages and premises of the station
The number of people at the cash desks of the station
To reveal the factors that have the strongest influence on the overall satisfaction of the railway stations, a correlation analysis was carried out, as a result of which the factors strongly correlated with the overall satisfaction were revealed (absolute value of the paired correlation coefficient |r| ≥ 0.7). This means being satisfied with:
Convenient entrance to the station, including luggage
Indoor tidiness
Moderately correlated (absolute value of pair correlation coefficient 0.5 ≤ |r| < 0.7)
This means being satisfied with:
Conditions of stay in the waiting rooms (room condition, availability of sockets)
Organization of recreation areas, meals, areas for work
The convenience of passing the inspection zones on the territory of the station
Serviceability of the terminal
Easy navigation in the terminal
Current information visual navigation
Information from the station staff
The temperature in the premises of the station
These parameters were further intended to use in the model of satisfaction of the station. Modeling was proposed to implement a multidimensional linear regression. In the regression model, variables between which there is no strong correlation can be used as predictors, i.e., the absolute value of the pair correlation coefficient between them should be |r| < 0.7. Based on the results of the first part of the study, it was proposed to include passenger traffic of suburban trains as predictors in the model. As a result, the following factors were selected as predictors:
Satisfaction with the convenience of entering the station, including luggage
Satisfaction with the organization of recreation areas, meals, areas for work
Satisfaction with the serviceability of the cash terminal
Passenger traffic of suburban trains
After regression analysis based on the evaluation of the model’s coefficients on the t-criterion at a level of significance of 5%, the model excluded the predictor “convenience of entering the station, including with luggage”. As a result, the following regression equation was obtained:
where
being predicted value of overall satisfaction with the work of stations;
being satisfaction with the organization of recreation areas, catering, and work areas;
being satisfaction with the operating of the cash terminal;
being passenger traffic of suburban trains.
Determination coefficient is R2 = 0.88. Thus, the model explains 88% of the dispersion of source data.
Using the model, we can draw the following conclusions: with an unchanged level of satisfaction with the organization of recreation areas, catering, work area and the proper operation of the terminal to sell tickets, with an increase in passenger traffic suburban trains station by 10 million people a year, the satisfaction of the station will decrease by 0.021 points on a scale of 4 (1—not satisfied, 4—fully satisfied). With a constant passenger flow increase in satisfaction with the organization of recreation areas, meals, areas for work by 1 point will lead to an increase in satisfaction with the work of the station by 0.35 points. In comparison, an increase of 1 point of satisfaction with the proper work of the cash terminal will lead to an increase in satisfaction with the station by 0.19 points.
Comparison of actual and calculated values of overall satisfaction with the quality of the work of the station is in
Table 1.
The absolute deviation of the predicted station satisfaction values over the actual (residuals) did not exceed 0.06 points, with the relative deviation of 2.1%, which indicates high adequacy of the model.
On the basis of the conducted research, we can conclude that the initial hypothesis was confirmed: the overall satisfaction of the stations’ work is influenced by the passenger flow. Additionally, this has a significant impact on the quality of the organization of different areas of the station (rest, meals, work) and the work of automated means of fare payment (cash terminals).
4.3. Testing of Hypothesis 2: The Intensity of Passenger Flow in the Entrance Groups of the Station Has an Impact on the Satisfaction of the Passengers
Since the model described above confirmed the impact of passenger flow on the satisfaction of visitors to the stations, it was necessary to identify problems that arise in passengers due to the intensive passenger flow at the station complexes. We were particularly interested in the difficulties faced by passengers at the entrance to the station complex. To this end, we analyzed complaints and negative feedback received by the management of the station and posted on the Internet (2018–2020 time period). The main part of the researched complaints received through netnography Internet research was found by analyzing the site aggregators. The gap in the number of complaints at stations is mostly due to intensity of the passenger traffic at different stations. Negative feedback (about 95%) was received mostly through informal channels such as social media and cites. The reason is the complexity of a complaint leaving procedure. It is possible to do in person at the train station or to write a letter on official e-mail of the Department for Transport and Road Infrastructure Development of Moscow. In contrast to this, leaving a complaint on the site does not require much effort. A total of 1062 appeals and reviews were analyzed.
We analyzed feedback on such parameters as the convenience of passage to the station through the entrance groups—the speed of passage. The results are presented in
Table 2.
At Belorussky, Kievsky, Kursky and Savyolovsky stations, the problem of passing through the entrance groups is in the first place, among other complaints and negative reviews of the visitors of the stations. Among the main difficulties faced by people are heavy closed doors, queues for passage through the arched metal detectors, dirty ribbons of introscopes and the lack of ramps for passage with heavy things. It should be noted that almost all stations have a significant share of complaints about the work of entrance groups. However, for the Yaroslavsky railway station, the percentage of complaints about the work of entrance groups is less than at other stations. At the same time, the survey showed the lowest level of satisfaction of visitors to the station, indicating that there are other more significant problems with the quality of transport services of this station. Since the problem with the passage of entrance groups at the station is as such, as evidenced by the complaints and negative feedback, then in the interests of our research and testing of Hypothesis 2, it is necessary to find out the proper time to pass the entrance groups of the station for visitors to the station.
As part of the online survey, respondents answered what amount of time at the entrance/exit of the station they consider proper. The results are in
Figure 4 and
Figure 5.
Almost 90% of respondents are ready to wait in line to enter the station for no more than 5 min, about two-thirds can wait for no more than 3 min, and 38% can wait for no more than 1 min. Then we will analyze the correspondence of the capacity of the entrance groups of the station complexes to the passenger flow during the rush hours and assess the possible impact on the satisfaction of passengers and visitors to the stations in case the actual time will exceed the acceptable time for passengers.
To estimate the passenger flow through the entrance groups of the railway stations during the rush hours, we have made measurements. The calculation of the average passenger flow per unit of time (per minute) for each of the nine stations was made for the entrance groups of the station on commuter trains and for the entrance groups of the station on long-distance trains. The results of calculating the average passenger flow for each of the nine stations are in
Table 3.
Since passenger traffic at the stations has seasonal fluctuations, which fall on July and August, and the daily rush hour time is preserved, it was necessary to assess the average annual and peak passenger traffic in the entrance groups of stations. For this purpose, we used the data of seasonal fluctuations of passenger traffic from the annual report of JSC Russian Railways for 2013 [
74].
Coefficients for correction of passenger traffic and calculation of passenger traffic load on entrance groups of stations (average annual and peak are summer months) were calculated according to Formulas (2) and (3).
with
being estimated value of average yearly passenger traffic of the station,
being calculated value of passenger flow of the station, person/min,
being a coefficient of the ratio of monthly passenger flow for December to the average monthly passenger flow (calculated on the basis of RZD data on passenger flow during the year). The coefficient was 0.80486.
The formula for calculation of peak passenger traffic load in summer months is below (see formula (3))
with
being estimated value of average annual passenger traffic of the station,
being calculated value of passenger flow of the station, person/min,
being the ratio of monthly passenger traffic for December in relation to the maximum passenger traffic in summer months (August) (calculated on the basis of RZD data on passenger flow during the year). The coefficient was 0.46605.
The results of calculations of average annual flow and maximum flow for suburban and long-distance trains are in
Table 4.
Considering the obtained estimates, one can calculate the capacity during rush hour in the entrance groups of stations. The data of observations in the entrance groups of stations allowed estimating the average capacity for turnstiles, taking into account the need to validate travel documents. On average, it will take about 15–18 s for one passenger to pass. Thus, the capacity of one turnstile passage per minute will be 3–4 people. Results of estimation of the maximum throughput capacity for all stations of Moscow are in
Table 5.
Station entrance groups can be equipped with stationary inspection equipment, including arched metal detectors and introscopes. Based on the results of observation, it was found that the capacity of the entrance group equipped with one arch and introscope is about 20 people per minute. Based on these estimates, the capacity of the entrance groups equipped with stationary inspection equipment was estimated (
Table 6).
The data obtained allow estimating the capacity of input groups of stations.
Table 7 and
Table 8 present the evaluation of the capacity of entrance groups to the station complex and the evaluation of the passenger flow on average during the year and during the months of maximum load.
Table 7 shows that for Yaroslavsky, Kursky, Kazansky and Kievsky railway stations, the capacity of turnstile lines corresponds to the passenger flow on the suburban trains.
For Savyolovsky station, capacity of entrance groups corresponds to the average yearly passenger traffic, but in the summer months, taking into account the growth of passenger traffic capacity, turnstiles will be used at the limit of possibilities, which in some cases may lead to the formation of queues to the entrance.
For Leningradsky, Paveletsky and Belorussky stations taking into account the average annual passenger traffic capacity of turnstile lines will not be enough. Exceeding the capacity of turnstile lines in 10–20 min forms a queue, leading to the fact that the average time per passage will exceed the allowable waiting time (5 min) specified by passengers in the survey. Since the netnographic analysis revealed a negative impact on queue satisfaction and difficulties in passing through the entrance groups, it is possible to speak with a high degree of confidence about a decrease in perception of quality and satisfaction with the work of these stations.
The situation with passenger flow at the Riga station differs from other Moscow stations, because the passenger flow at this station is extremely low and is characterized by significant fluctuations. For this station, there is no increase in passenger traffic during peak hours. Passenger traffic at this station is formed shortly before the arrival or departure of the train.
The analysis of the received data on the forecast of passenger flow on long-distance trains and capacity of entrance groups of station complexes with the installed stationary inspection equipment shows that their capacity is sufficient for the existing passenger flow and will not cause the formation of queues at the entrance, resulting in excess of the allowed in terms of most respondents’ waiting time at the entrance/exit. However, at Kazansky and Leningradsky railway stations in the months of peak loads, there is a significant excess of passenger traffic capacity of entrance groups. For Rizhsky station, the capacity of entrance groups is also lower than the observed passenger traffic. Passenger traffic of this level is observed only for the train departure or arrival schedule and does not depend on the rush hour.
5. Discussion
The results of the conducted research confirm the conclusions that consumer studies, particularly satisfaction research and comparison with the results of statistical observation of passenger traffic allows making decisions on planning and management of passenger traffic [
16]. Our research confirms the conclusions and develops them in terms of understanding, how changes in passenger flow can affect the level of satisfaction. This knowledge allows us to develop methods to assess the impact of management decisions on passenger flow planning on the satisfaction of visitors to railway stations, stimulating innovation in the concept of improving transport services, updating the quality standard of transport services of railway stations. The results of our attempt to assess passenger traffic in key areas of the station allowed us to use the data on the proper time for entering the station to identify problem areas. The obtained results substantiate the conclusions of Molander, Fellesson, Friman and Skålén [
24] that a client-oriented approach in transport management is only possible through a combined approach. In which objective indicators are analyzed in combination with indicators of satisfaction, expectations, and customer opinions. The conducted research not only substantiates this complex approach, but also presents models describing the relationship between the objective indicator of passenger flow and subjective indicator of satisfaction, which allows you to predict the consequences of management decisions in terms of assessing changes in the attitude of visitors to the quality of transport services as a result of changes in passenger flow at the station and in the entrance groups. This is especially important in a changing passenger flow resulting from stricter security requirements.
Modeling of passenger flow in entrance groups allows to estimate the capacity of entrance groups of stations, and to determine the possibility of “overcrowding” at entrance groups and to determine the output of waiting time in the queue at the entrance/exit beyond the proper limits for consumers. Thus, according to the number of works [
43,
57,
65,
66], we can predict a decrease in customer satisfaction with transportation services of railway stations.
Passenger traffic is growing, stations and railway stations are included in multimodal transport and logistics systems, becoming vital transport hubs. With the increasing demands on transport security due to the spread of COVID-19, open innovation technologies can improve the management of such multimodal transport and logistics systems. At the same time, studies show that the innovation potential in the railway industry is limited, as the railway industry is a slowly developing sector in terms of technology [
75]. At the same time, the study highlights the significant dependence of innovation in this sector on government policy.
In this regard, at present, most governments pay special attention to the study of how to ensure the effective functioning of railway stations using extensive data analysis, intelligent data analysis, or machine learning technologies [
76]. This overlaps with the demand shown in the literature for innovative control mechanisms for railway transport [
30], and in particular, with the use of data obtained from Internet technologies, which can be obtained from various devices (security sensors at stations, smartphones of passengers). These data can be used to make decisions on passenger flow management at the station.
Today, various sensors are widely used in the railway industry. However, a number of authors believe that security and risk management will be better provided by wireless network devices. Wireless sensor networks are regarded as an innovative method of collecting information for information and communication systems, which will significantly improve the reliability and efficiency of systems at the railway station and has a number of advantages over a wired solution. [
76]. In addition to the connection of wireless networks with “machine learning,” “big data” and “the Internet of Things”, there is “cloud computing”, which can facilitate rapid communication between operators, forecasting of risks, consequences and reactions in emergencies, as well as the monitoring of the entire infrastructure at the railway station. Such solutions become the basis and open opportunities for integration with the citywide transport system and other urban infrastructure systems. However, when increasing the efficiency of the automated systems of functioning of multimodal transport and logistics centers, it is necessary to include blocks in the system that allow the evaluation of the subjective perception of a personal comfort, creating conditions for the psychological comfort of the city residents and, in particular, visitors to railway stations [
77]. In this sense, our proposed model allows us to build in a subjective perception of passengers of the transport service of the station on the basis of the analysis of passenger traffic and thus make it possible to make effective decisions about the management of passenger traffic at the railway stations. In our opinion, in order to adjust the model and refine its coefficients, the annual market research is necessary.
At the same time, there are inevitable limitations. The research was conducted exclusively at railway stations, so additional study and recalculation of coefficients in the models presented by the authors is required to assess the impact of passenger flow on satisfaction for other types of public transport, railway rolling stock and other modes of transportation.
The statistical methods underlying the developed models have a number of limitations, which have already been described in detail [
72].
An observation method with a number of disadvantages and limitations was used to estimate the current passenger flow at Moscow’s railway stations. The inability to make conclusions from single observations [
71] of passenger flow during a limited period of time during rush hour to patterns or to detect the determinants of events or behavior. This means that it is possible to make a measurement at a time unusual for the observed phenomenon that may have occurred due to uncontrollable and unpredictable factors. To overcome this shortcoming in the methodology, we have laid down measurements of passenger flow at several receptions and at different periods and days of the week, but within rush hour. We have made five measurements for each observation point. The observation points were entrance groups of the station complexes. These measurements at each observation point allow us to further use mathematical and statistical methods that can smooth out possible significant fluctuations in the results of measurements.
Another limitation was that the measurement was carried out only in one month of the year, which made it impossible to use the obtained information as an average annual value of passenger flow at the entrance groups of the station. Thus, it was necessary to use secondary data on passenger flow statistics during the year to calculate the average annual and peak (in summer months) passenger flow at the entrance groups. For this purpose, we calculated the correction factor.
Group of observation error is related to errors caused by unforeseen circumstances, such as overlapping traffic in entrance groups on the day of observation, or errors of the observer himself, for example, the error of counting passengers. To overcome this limitation, we have developed instructions for the observers, with clear instructions on how to proceed in the event of various types of contingencies. The training was provided to the observers. There were always two observers at observation points who took measurements.
The study limitations are related to the method chosen to analyze and assess the satisfaction of visitors to the stations (online survey). Thus, the survey involved only the Internet audience; additionally, all the problems associated with the method of panel studies should also be considered.
6. Conclusions
The method of an online survey that was used to determine satisfaction made it possible to conclude that all Moscow station facilities worked positively. The highest satisfaction scores were obtained for Savyolovsky, Belorussky, Kievsky and Leningradsky railway stations (average score exceeds 3). Thus, we can conclude that visitors to the stations, in general, are “somewhat satisfied” with the transport service. The lowest marks were received for Yaroslavsky and Rizhsky stations, but they also exceed the average 2.5 points.
We have developed a regression model to assess the impact of passenger traffic intensity on the level of satisfaction of passengers and visitors. Since the bulk of visitors to the station facilities were passengers of suburban trains, the dispersion diagram (
Figure 3) was constructed for it and the correlation coefficient was calculated. Despite the fact that seven out of nine stations observed a moderate statistical linear relationship between the average level of satisfaction and passenger flow with a reverse relationship (growth in passenger traffic leads to a decrease in satisfaction), two stations (Rizhsky and Paveletsky) did not fit into a linear statistical relationship. Therefore, we assumed that satisfaction with the work of the stations is influenced by other factors, which were present in respondents’ evaluation of the quality of various aspects of the stations.
To identify the factors that have the most decisive influence on overall satisfaction with the work of the stations, a correlation analysis was carried out, which revealed factors strongly correlated with overall satisfaction and moderately correlated. As a result of multivariate linear regression, coefficients were calculated, and an equation explaining 88% of dispersion of initial data was compiled. Based on the model, we can draw the following conclusions: with a constant level of satisfaction with the organization of recreational areas, catering, work area and the proper operation of the terminal to sell tickets, with an increase in passenger traffic suburban trains station by 10 million people a year, the satisfaction of the station will decrease by 0.021 points on a 4-point scale (1—not satisfied, 4—fully satisfied). With a constant passenger flow increase in satisfaction with the organization of recreation areas, meals, areas for work by 1 point will lead to an increase in satisfaction with the work of the station by 0.35 points, and an increase of 1 point of satisfaction with the work of the cash terminal will increase satisfaction with the work of the station by 0.19 points. The presented model allows us to conclude that the first hypothesis is proved, and that satisfaction with the work of the station depends on passenger traffic. However, such factors as the organization of recreation areas, meals, areas for work, the proper functioning of the ticket-selling terminal also have a significant impact on satisfaction.
As a result of the conducted net research, we can conclude that the problem of passing to the territory of the station facility through the entrance groups is an actual problem of Moscow stations. At the same time at the Belorussky, Kursky and Kievsky stations, the share of complaints of this kind was more than 20% of the total number of complaints (
Table 1). The lowest value of complaints and negative feedback on the work of entrance groups (about 5%) was received at Yaroslavsky railway station. At the same time, the level of overall satisfaction at this station was one of the lowest.
Marketing research has led to the conclusion about the proper waiting time for passage of entrance groups, which is a useful parameter for managing passenger flow in specific entrance groups of stations and can be the basis for marketing innovation to improve the transport service of stations.
We have carried out measurements of passenger flow in the entrance groups of stations with subsequent adjustment in accordance with seasonal variations in passenger flow allowed to assess the capacity of the entrance groups of the station and assess the possibility of “overcrowding” at the entrance groups.
The analysis of flows through the entrance groups showed that in most cases the equipment of the entrance groups of the station facilities will allow coping with the passenger flow during the rush hours even in the months of the highest load. According to the online survey, an acceptable waiting time for 90% of respondents was no more than 5 min for entering the station. Using the data on the acceptable time it can be predicted that Kazansky and Leningradsky railway stations in the months of peak load will see a significant excess of passenger traffic capacity of entrance groups, which will lead to the formation of queues and form dissatisfaction of passengers.
Based on the developed model for assessing passenger satisfaction, it was proved that passenger flow has a significant effect on passenger satisfaction. During a pandemic passenger flow at the station entrances decreases that should lead to an increase in satisfaction but when passenger traffic recovers the results obtained will not lose their relevance.
The results of the study show that for the effective management, planning and reconstruction of stations the forecasting and management of passenger flows and time control of the entrance groups of the station becomes a necessary factor for assessing satisfaction with the services of the stations.
Thus, the results open the way to the implementation of a paradigm of innovation management at railway stations, through the benefits of open innovation. Open innovations offer several advantages to companies working under the global cooperation program. In this case, these benefits can be realized through customer orientation and improved accuracy of market research, which opens up the potential for synergy between internal and external innovations. Primarily through the organization of operational data collection and processing, including social networks [
78]. Technologies aimed at the collection and processing of data from different sources (technical systems of vocals), as well as automated management of various engineering systems with minimal human involvement is combined with the term
Smart Station [
79]. This technology is currently being implemented by Russian Railways and is already functioning at many stations in Moscow and other major cities. However, so far, the disadvantage of such systems is the lack of tools responsible for passenger service innovative systems that can assess the impact of decisions made on the perception of quality by passengers and on their satisfaction. For example, based on cloud technologies [
80], which allow to quickly collect and process responses from passengers. These data will open up great opportunities for station management to improve the quality of service, as well as to ensure epidemiological safety, in particular by increasing “overcrowding”. It is mobile applications that are mainly developed to provide passengers and visitors with operational information about the schedule, and a convenient way to buy tickets. However, the possibilities of collecting operational information about passenger flows and feedback from passengers and visitors through mobile applications are clearly underestimated. However, the information from passengers received in real time through the mobile application will allow to provide immediate response in case of emergency, as well as to track passenger flow in key areas of the station. Additionally, the data accumulated over time will improve the quality of the station and its staff in all directions and long-term planning.
In conclusion, we know little about the satisfaction of people who have no real alternatives, so we see the continuation of research among these users of public transport. We welcome future studies that will examine our findings and the relationship between passenger satisfaction and objective performance indicators for rail transport, as well as on passenger satisfaction at station entrances and its impact on the perception of the quality of transport services.
The results obtained in the course of the research form new knowledge about the factors that influence the satisfaction of visitors to railway stations, thus stimulating the innovative activity of transport service enterprises at railway stations, forming new methods of evaluation of the quality of transport service, making it possible to develop the concept of improving the transport services of railway stations, based on a deep understanding of the factors that form the attitude of consumers to the services provided to them, contributing to the formation of innovations. Additionally, the article contributes to the theory of customer satisfaction, customer relationship management. This research can be considered as an important part to improve the methodology of the customer satisfaction studies, which is reliant on the public transport development in the metropolises, specifically at the railway stations, which can be considered as the entrance of the cities, and the huge hub for the long distance and suburban trains which is related in the stations with other kind of the public transport. The proposed and implemented methodology of the combination of three research methods: netnography, observations of the passengers flows—customers’ experience and its satisfaction/dissatisfaction—and also large scale online survey can be recommend to further research projects, because the data obtained from different research methods, which were especially created to reach the goals of the research, can complement each other and improve reliability. The understanding of customer satisfaction and factors that affect the satisfaction of the passengers expand the knowledge of open innovation theory in the part of micro and macrodynamics of open innovation and open innovation engineering.


