Abstract
The innovation economy is the main direction for Russian’s regional development. It is important to understand organizations that utilize new technologies will determine the significance of innovations. Innovation is changing under the influence of society—the basis for the development of the society is knowledge transfer, and this is one of the most important tasks of the higher education system. In this regard, universities can be considered a factor in innovative development. In this article, the authors hypothesize a link between regional and university indicators. We assume that universities, as part of the regional innovation system, affects the effectiveness of this system. We believe that it is necessary to single out a system of indicators that can be used for analysis, which allows us to determine the efficiency of the region in terms of contribution of universities to its development—because, at the moment, there is no official methodology. The purpose of this study is to determine which indicators are significant for assessing the efficiency of the region, taking into account the activities of university complexes. We will evaluate the efficiency of regional innovation in the region using a data envelopment analysis (DEA). The research objects, or decision-making units (DMU), will be represented by 85 regions of the Russian Federation. A complex of universities operates in each region, and there is a list of socio-economic statistical indicators based on their performance over the past years. There are similar statistical results on the innovative activity of the regions. Thus, we will use the indicators of the complex of universities in the region as initial resources for analysis (2011), as well as indicators of the innovative development of the region as a result of the introduced resources (2018). A time lag of six years is justified by the end of the crisis, and the many factors affecting the activities of universities and regions. For example, increased funding for scientific activities of universities encourages small innovative enterprises within universities. As a result, we were able to identify the level of efficiency, and identify factors that are of greater importance in the resulting model. The findings of the study highlight the importance of educational organizations in the regional innovation system, and encourages alternative interactions between universities and the region, such as joint research and development, training of qualified personnel, and other channels.
1. Introduction
Education issues are traditionally considered as a priority sector of the state and regional control [1]. The actively developing market for the provision of educational services not only enhances competition between higher education institutions, but also increases the competitiveness of the region, and as a consequence, the national economy [2]. All higher education institutions in the region create a common platform for innovative, technological, and social development of the regions [3]. The key areas of activity of university complexes are to assist the regions in creating an attractive social environment and improving the quality of life, and more importantly, using and participating in developments, providing access to new technologies, creating conditions for updating the structure of the region [4]. The most important area of activity for the region can be considered as a development of innovative eco-systems that will increase the university’s income from the commercialization of research results as the launch of innovative products or the provision of high-tech services, as well as the sale of intellectual property [5].
Universities are a center of innovative, technological, and social development; therefore, analysis of its infrastructure, based on which the commercialization of scientific developments is carried out, requires additional consideration [6]. Competitiveness and sustainable socio-economic development of the state ensure the availability of “general knowledge” developed areas of which are based on a combination of effectively functioning education and development systems based on fundamental scientific research [2].
According to statistics from Federal State Statistics Service, the share of universities in the number of organizations engaged in the innovative activity and development assumes significance (about 42% of the total number of organizations engaged in the innovative activity in the Russian Federation) (Figure 1).
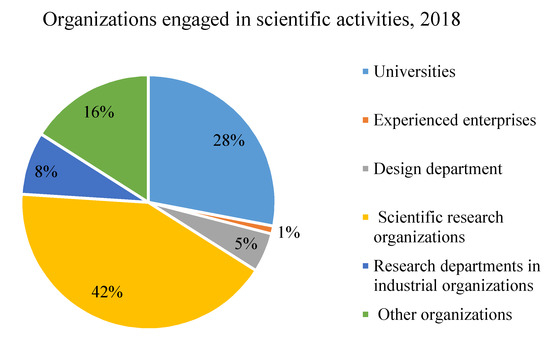
Figure 1.
Universities share in the organizations engaged in scientific activities [7].
Assessing the efficiency of the region in terms of using university complexes as resources, we examined all areas of its influence by universities [8]. Universities are one of the objects of the regional innovation systems along with small businesses, research institutes, and industrial enterprises. All objects of this system are interconnected and have both a complex and a particular impact on its changes [9]. It is now recognized that the priority in developing many regions should be given to a new economic policy—reindustrialization, which aims to develop new high-tech industries that replace the old ones or facilitate their transition to a new technological base. Higher education institutions determine the personnel potential of the region’s innovative development, as well as promote innovative ideas and bring them to specific manufacturers [10]. Taking into account the marketing research of the innovation market, universities can more effectively than other subjects of the innovation system, conduct research, and implement innovative developments that will be put into practice [11]. In addition, the “university—research institute—enterprise” or “university—enterprise” networks make it possible to develop only those innovative projects that can be implemented at enterprises and funded.
Studying the problems associated with assessing the efficiency of the region, taking into account the results of universities, will be timely and relevant. Many of them are connecting links between different users and are cluster networks within regions. Universities serve to enhance cultural development and education. In addition, universities are an essential element of the regional innovation system, which is the main platform.
The research gap lies in the fact that there are no approved and approved criteria by which it would be possible to build reliable indicators measuring the socio-economic efficiency of relations between the university and the region. The existing methods are not universal—they are not applied systematically. The indicators that the authors use in these methods are most often the most accessible and convenient for the authors of the method.
The aim of this analysis is to create a model for assessing the effectiveness of a regional innovation system, taking into account the influence of university complexes that operate on the territory of the Russian Federation. To achieve the goal, it is necessary to consider approaches to defining the concept of efficiency, to analyze how the effectiveness of universities is measured, because we believe that universities are resources for the innovative development of the region. It is also necessary to analyze the place and role of universities as drivers of the regional innovation system. Within the framework of interaction within the regional innovation system, it is necessary to consider cooperation between universities and business, since it is precisely in this type of innovation co-production that the concept of open innovation can be introduced. To build a model, it is necessary to select and substantiate the factors that determine the performance of the university, as well as indicators of innovative activity.
We decided to evaluate the efficiency of the regions of the Russian Federation using the data envelopment analysis (DEA) method [12,13,14]. It is necessary to identify significant indicators that can be used to assess how effective the regions are in comparison with each other under relatively equal input conditions in the form of university results. The information base for the study was the official annual compilation of statistical information, which reflects the entire list of socio-economic indicators of the region. The indicators of the “Education” and “Gross Regional Product” sections were used as input parameters, and the data from the “Gross Regional Product” and “Science and Innovations” sections were used as output indicators.
The reasons for this choice are clearly defined. Firstly, leading universities are state and innovation centers in their regional centers. Secondly, we can assess their comprehensive contribution to developing the region.
The results of our study correspond to the target groups: University leadership, government, a government body responsible for regulating educational organizations, small innovative enterprises that work with the university to create new innovative technologies. University leaders can build an organizational system, create an effective internal infrastructure aimed at improving interaction with the region, and increasing innovation activity. The relevance of the results for the state support lies in the fact that they can comply with the legislative acts regarding activities of universities, so that they can conduct more research aimed at increasing the innovative activity in the region. For example, such measures may include developing conditions for collaboration with international researchers, as well as the possibility of scientific mobility. For small businesses, understanding the relationship between universities and regions will be the starting point for the formation of new business strategies aimed at interaction with universities in the framework of creating new innovative products and conducting commercial research.
The sections of this paper provide the following information. Literature was reviewed to narrow the research gap and reinforce the declarative statements about the relationship between the university and the region. The theoretical part is presented in three sections: The internal efficiency of the university is considered, the university is presented as a driver of economic development, and the importance of the university’s interaction with small enterprises as parts of the regional innovation system is shown. A data set was produced as a result of the statistical data analysis. The analysis was performed using the DEA method. Research results are discussed in Section 4; they are summarized in Section 5.
2. Theoretical Framework of the Study
The study of effectiveness is a fairly popular topic for modern research. Research in this area began at the end of the last century. Studies of the effectiveness of the regional innovation systems began to gain popularity at the end of the last century.
The innovative system of the region is a set of interconnected elements. This interaction forms a single innovative field. The objects of the innovative activity in the region are higher education institutions, industrial enterprises, small and medium enterprises, technological cities, and technology parks. This attitude is emphasized by Etzkowitz and Leydesdorff [15].This study is related to developing the Triple Helix theory, which describes a model for the balanced interaction of the main complexes, which are key elements of the innovation system. The model emphasizes the network nature of the interaction between participants in the innovation process, when universities create ideas, enterprises provide resources, and the government forms a regulatory framework [16]. Reference [17] holds the same view. The author believes that there is a certain coordination triangle, each vertex of which represents a group of stakeholders. The interaction of science, business, and the state affects the modern university and determines the vector of development in the region.
Understanding how exactly the performance of these facilities affects the regional system is an important task. The main criterion for assessing the efficiency of any economic system is the effectiveness of such a system. To achieve this indicator, it is necessary to rationally choose the direction of developing this system.
In the scientific literature, there is no complete definition for the concept of “effectiveness”, which could be used to provide educational services. This leads to problems in assessing the effectiveness of higher education institutions and other socio-economic systems, such as regions [18].
“Efficiency” is usually defined as a synonym for the words “effectiveness”, “competitiveness”, “quality”. The educational market is institutional and non-profit. It is not possible to apply the classic definition of effectiveness for analysis. Efficiency, in a broad sense, is a measure of efficiency and effectiveness for the use of resources as resources for the production of goods and services.
Here are examples of definitions for “efficiency” of some researchers:
Efficiency is a relative effect, efficiency of the process, operation, project, defined as a coefficient of effect; lead to costs, expenses that led to its receipt.
Efficiency refers to the efficiency of a process, operation, project, defined as the ratio of effect, result, and cost that led to its receipt [18].
2.1. University Efficiency
Economists consider higher education systems from two points of view. For example, the author [19] considers universities from the point of view of recipients of educational services, and [20] from the point of view of producers of these services. This is the specificity of educational services consumption, if we consider education from the point of view of the employer, the state, and society: The state, higher education institution, and individual teacher are producers of services [21].
Questions of studying the efficiency of educational institutions of higher professional education have become relevant for Russia since the beginning of reforms in the 1990s [8,22]. The solution to the problem of efficiency includes a combination of social and economic evaluations [23].
A social assessment of the efficiency of higher education as a factor affecting the standard of living of the society, the degree of satisfaction of its needs, as well as the formation of social progress [21]. Increasing the human intellectual level, higher education is manifested not only in the market, but also beyond. This confirms its multifunctional function [24]. Education affects the development of such skills like interpersonal communication skills, how to behave in society, moral growth, how to make decisions, and how to allocate one’s time. Besides, higher education allows a person to dynamically develop in an actively developing environment. Economists often associate higher education with improving the quality and standard of living of a person, finding a stable correlation with its duration [19]. Among other areas of influence of the social aspects of higher education on society, one can note its constant development in the formation of moral, aesthetic, and cultural values. The result of the impact is an increase in social welfare and a decrease in social tension [25]. In turn, increasing the educational level of the population, its cultural and moral growth become the basis for the formation of a new information society.
According to Reference [26], economic evaluation of higher education efficiency in the context of the economy of a country is determined by economic returns. The basis for calculating efficiency of investment in the human capital has become a close relationship between the level of education and the amount of income received by a person, and the economic effect is expressed as a result of improving the quality of labor resources, since a person who has completed higher education has higher abilities. At the regional level, the manifestation of the economic effect can be expressed in the form of receipts to the regional budget from the activities by institutions of higher professional education, as well as through various grants and research. Researcher [27] notes that it should be noted that higher education also contributes to the improvement of the human and scientific potential of the region, since it is considered as a factor of the economic growth and increasing competitiveness of the country as a whole.
A visual representation of the social and economic effect on various subjects of the educational system is presented in Figure 2.
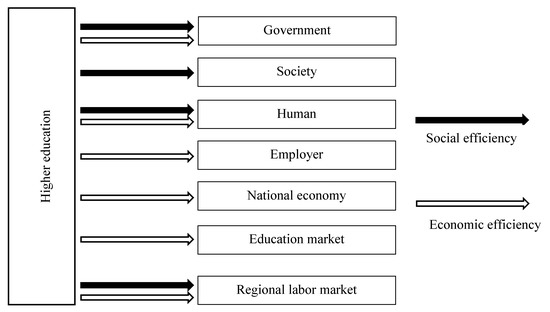
Figure 2.
Social and economic effects of higher education efficiency [19].
Researchers [28] consider that, in fact, the efficiency of the universities cannot be considered only by the university itself. Since many exogenous shocks affect the activities of the university itself, the university also affects the external environment, including the region in which it is located.
The validity of using the DEA method is determined by the results of researchers [29]. They compared the DEA method with another and found that DEA is the most suitable method for assessing the efficiency of a university in terms of research and development and its impact on efficiency. The concept of efficiency, as well as the DEA have been described by Reference [18]. He suggested separating the concept of efficiency and efficiency itself, and explained how to use the DEA method to measure university performance using Australian universities as an example.
2.2. Universities as Drivers of Innovative Regional Development
The university acts as a center of innovation and a “forge” of the labor market and national economy. The contribution of the higher education system to the creation and transfer of innovations and the economic development of the region is currently regarded as an important factor in the growth of innovation [30].
The activities of universities represent a special channel for the exchange of knowledge. The endless process of student learning, which leads to the development of the potential and increase in the competitiveness of qualified specialists in the labor market. Currently, universities are conducting research focused on the specific actions that are currently being conducted at universities, as well as creating science parks and business incubators to commercialize their innovations. Reference [9] provided a brief analysis of universities’ impact on regional innovations. They got an econometric model, with which you can prove the hypothesis that the creation of new university faculties actually affects the innovative activity of the region. Universities also collaborate with various companies in creating territorial innovation clusters. It is worth considering that the research and development that universities conduct is always used at other levels of the regional innovation system. This was proved in his studies by Reference [31]. The author revealed the positive impact of research in universities on regional innovation processes, which was empirically proven in the study. Publications and studies, academic mobility of university employees help provide access to knowledge that can be effectively used by commercial organizations [5]. More structured information is presented in Table 1. There are a huge number of ratings and methods for evaluating efficiency [11,32].

Table 1.
Proposed indicator complex.
Despite this, there is a problem of developing an assessment of the contribution of higher education to regional innovation growth.
It seems that universities can become a pillar of transformation and solving the problems of reindustrialization in regional economies. The authors [33] consider that among these tasks, for example, there is the creation of an innovative environment. This environment should be aimed at a complete innovation cycle: From research to creation of new technologies, products, and services [34]. Accompanying this transformation is possible through developing technological partnerships, strengthening ties with research educational organizations. An analysis of the research results of [35] shows that the interaction of the university and the regional system is two-way. We can say that the innovative system provides mobility of human capital (students and university employees) from the results of research of [36]. Assistance is also provided to entrepreneurship, whose activities are closely related to the processes of the university.
Based on the experience of the United States, it can be argued that the creation of technology parks, business parks, or technology parks around universities can be seen as the targeted influence of universities on the regional economy [37]. According to Reference [38], Research Universities are Research and Education investment platform. They attract not only students, but also the best scientists, specialists, innovative companies, banks, venture funds, “business angels” to the regions of their location. This accumulation ultimately leads to a powerful increase in the intellectual potential of the region. In addition, sometimes universities themselves are large institutions with tens of thousands of people and some of the largest employers in some regions.
Authors Yao and Weng, for example, examine the impact of universities on the development of an inclusive innovation system [39]. Using the example of Zhejiang University, the authors proved that its innovative activity is aimed at developing rural and remote regions of China [39]. The authors believe that, based on universities, a more competent selection and dissemination of technologies is possible, it is possible to create channels of interaction between participants in the innovation process, as well as channels of access to innovative knowledge. The research program has enabled low-income and low-income regions in China to realize industrial and consumer potential, as well as develop business.
Also, the Warnecke study [40], in which the author proves that universities transmit the knowledge that they themselves and generate through various transmission channels, cannot be thrown out, which is confirmed by Table 1. This knowledge, after generation, they transfer to the participants of regional innovation systems and agents who are behind them outside [40].
Charles also confirms the growing focus on information and knowledge, and emphasizes that the knowledge sector is expanding and influencing many areas of activity [41]. The author describes a trend that suggests that many European universities have intensified their involvement in addressing strategic regional issues. There is also a change in the role of universities, education is becoming more widespread, and the goals and objectives of universities are being transformed under the influence of a common social and innovation agenda.
Based on this, we can conclude that the value of universities for regional systems is manifested in the following areas: Formation of knowledge about new products and processes; conducting research and development work; integration into regional educational scientific and technical centers; relationships and cooperation with subjects of innovation infrastructure; functions as consumers and manufacturers of high-tech products.
2.3. Universities and Entrepreneurship Collaboration as a Factor of Innovative Regional Development
The innovative function of the university is becoming increasingly popular—especially in the conditions of formation and development of the innovation system in the region. Universities are stepping up innovation as they participate in grant research. These grants have a regional and federal level, and almost 53% of them are in cooperation with commercial enterprises. Americans [42] studied the influence of universities on regional development as the interaction of small and medium-sized businesses with research laboratories located in this region [43]. Researchers have established a close positive correlation between research conducted by universities, their innovation, and R&D companies. There is an innovative activity of organizations that provides technological, organizational, and marketing innovations in Russian regional systems (Figure 3). The figure shows that approximately 20% of all companies in St. Petersburg and 10% of all companies in the Siberian region, on average, take part in the innovative development of the region [7]. This is due to the fact that in St. Petersburg and Moscow, more and more entrepreneurs are more actively involved in this process. The reason is that in these regions, businesses have more opportunities to work under economic contracts [37]. Kaufmann and Tödtling [37] evaluated the relevance of certain types of external innovation partners (customers, suppliers, consultants, technology transfer offices, contract research organizations, and universities) to innovation activities of the company based on a survey of firms from several regions of Europe.
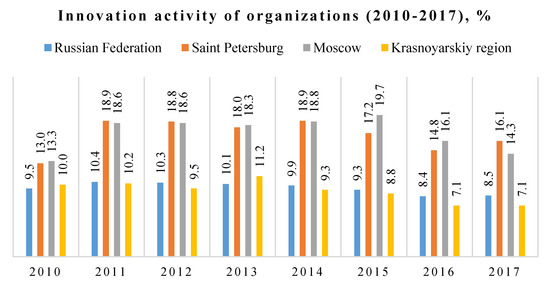
Figure 3.
Innovation activity of organizations (2010–2017) [7].
It is necessary to develop an integrated approach to developing the university-enterprise system. One of the obvious advantages of such cooperation is that the university will only carry out research that can be funded by enterprises or used in the future.
Consider the university-business interaction indicators according to the functions of the university: Education, education-science, science, science-entrepreneurship, entrepreneurship, entrepreneurship—education.
Education [44]:
- Development and implementation of joint educational programs;
- Part-time or full-time business representatives at the university and university in business (job change or double employment).
Education-science [45]:
- Industrial traineeships and internships for students;
- Use of university facilities by business (experimental facilities, infrastructure);
- Holding and participation in scientific conferences.
Science [46]:
- Joint scientific publications;
- Contract research.
Science-entrepreneurship [47,48]:
- Joint research and publications;
- Provision of consulting services;
- Exchange of professional information through communication platforms (workshops, exhibitions);
- Interaction within clusters and technological platforms.
Entrepreneurship [49]:
- Creation of start-up and spin-off companies (any companies having affiliation or interaction with the university);
- Transfer of intellectual rights (licensing);
- Small-scale production.
Entrepreneurship—education [10]:
- Mentoring, tutoring, conducting master classes, business trainings on the development of entrepreneurial skills of students and university staff;
- Additional education, advanced training;
- Scholarships, venture financing of projects.
Thus, the research gap is as follows: Universities reproduce the technical and intellectual potential for the development and commercialization of innovations in the region. A region that receives more results with a relatively equal amount of resources is relatively more effective. It is necessary to form a pool of indicators that will help determine the efficiency of the regional innovation system in terms of the contribution of university complexes as a resource to achieve results. A comprehensive methodology explaining the qualitative purpose of indicators for assessment is not available at the moment.
3. Data and Research Methodology
3.1. DEA Method
The Data Envelopment Analysis method was proposed in 1978 by American scientists A. Charnes, W. W. Cooper, E. Rhodes, which were based on the ideas of M. J. Farrell [13,29]. This method is successfully used to assess the efficiency of the functioning of homogeneous objects in various socio-economic systems. Such objects may include industrial and agricultural enterprises, banks, healthcare, and educational institutions, governing and judicial bodies, educational institutions, and regional systems. The DEA method is constantly evolving and improving.
The DEA methodology uses the term “performance efficiency”. This term reflects the efficiency with which the studied objects convert inputs to outputs. When using the DEA methodology, it is necessary to clarify the concept of “efficiency”, since the authors propose to consider this term as a reflection of a measurable result when converting input data into output data, that is, as a quotient from dividing the sum of all output parameters by the sum of all input.
A DEA is appropriate to use in this analysis because it allows you to take into account external variables with respect to the system under consideration—environmental factors. DEA can simultaneously process many inputs and many outputs, each of which can be measured in different units of measurement. The method does not require a priori indication of weighting coefficients for variables corresponding to input and output parameters when solving the optimization problem. Moreover, DEA allows you to calculate one aggregate indicator for each object in terms of using input factors (independent variables) to produce the desired output products (dependent variables).
When assessing socio-economic systems, we can talk about modeling partially linear models with constant returns to scale or CRS-models. To assess the effectiveness of innovative regional development, taking into account the use of universities as resources, it is advisable to use an output-oriented model, since regional development involves improving the indicators of innovative activity in the region, which are output indicators in this type of model.
The overall output-oriented model can be presented as follows:
where:
- X is input
- Y is output
- ϕ is a calculated variable for each object, taking a value from 0 to 1
- λ is a vector of constants of dimension for a model matrix
- are the projection of objects that do not lie on the boundary of efficiency to the boundary of efficiency
To build the matrix of the basic DEA model, it is necessary to determine the set of DMUs, as well as the input and output data for analysis.
3.2. Analysis Specification
The analysis relies on a dataset of 85 Regions of the Russian Federation—decision-making units of the analysis (DMU) and the complex of universities inside them (Appendix A).
The result of the analysis will be the construction of the boundary of effectiveness in the regions of the Russian Federation for innovative regional development, taking into account the use of university complexes as resources. Thus, the value of effectiveness for the current study can be interpreted.
It is necessary to define some limitations for the results of the analysis. Firstly, it follows from the model that objects are effective whose effectiveness value should be equal to one, respectively, the DMU efficiency value is less than one, which means that the object in question is not effective. Depending on the value of efficiency from 0 to 1, it is possible to build a rating of the effectiveness in the regions of the Russian Federation in terms of innovative development.
For the analysis, we selected seven significant resources (inputs) that will affect the efficiency of the region from the university resources (Table 2). The reasons why we chose these resources are as follows.
Table 2.
Input and output factors of the model.
Indicators that can characterize the potential ability of a region’s educational system to form the human capital necessary for the implementation of innovative activities include: The number of educational institutions of higher education; the number of branches of educational organizations of higher education; how many students are enrolled in undergraduate, graduate, and specialist programs; and how many students graduate with bachelor’s, specialist, and master’s degrees.
Several researchers, with a degree by region, indicated the intellectual potential of the university to characterize its internal capabilities and produce new knowledge in the process of educational and research activities—as well as to create and accumulate the intellectual capital necessary for the implementation of innovative activities. Teachers are the channel of knowledge transfer. They have the opportunity to participate in various grants, conferences, and symposia at the regional and international levels. Visiting professors are also an important resource, since such mobility provides new opportunities for research, in which the potential of several countries participates. The areas for research were chosen to show how interested universities are for students, teachers, and partners to do research and experiment.
The volume of costs for research and development was expressed in cash actual costs—both current and capital, for research and development. The indicator shows available investments in research and development, and the dynamics of this indicator reflect the multiplier effect of investments in innovation in the region, allows us to evaluate the efficiency of research and development and the high technology intensity of the regional product.
Dataset results (outputs) consist of five indicators.
Gross regional product per capita represents the value of goods and services produced for the final use by residents of the region.
The innovative activity of organizations reflects the involvement of regional economic entities in the process of implementing innovative activities, which characterizes the level of innovative susceptibility of the region, its ability to realize innovative and intellectual potentials. This indicator represents the proportion of organizations implementing technological, organizational, marketing innovations, in the total number of organizations examined, calculated as the ratio of the number of organizations implementing technological, organizational, marketing innovations to the total number of organizations examined.
The amount of innovative goods, works, services represents the innovative productivity of the regional economy, and it is characterized by the amount of new or technologically changed goods of one’s own production. This indicator allows you to determine the efficiency of innovation in the region.
Patent filing shows the efficiency of innovative processes in the region’s economy.
The share of education in the sectoral structure of GRP reflects the modernization of the structure of the regional economy. The dynamics of these indicators show structural changes in the economy.
The data were collected over the years—2011 and 2018. This is due to the need to take into account the time between the moments when resources are formed and when their use leads to results. The time span of six years is due to the fact that in 2011 Russia emerged from a state of crisis. This period (2011–2018) was a period of growth and stabilization of the Russian economy, which increased in the quality of life for citizens, and improved social infrastructure. Over this period, there has been a steady increase in GDP (Figure 4). In 2014, it became possible to evaluate the efficiency of the functioning of universities—the Methodology for evaluating the activities of a university of the Ministry of Education and Science of the Russian Federation. That was the time when the 5—100—2020 program was launched. The program dealt with the financing of research, academic mobility for the growth of university indicators, and the concept of upward in world rankings. Channels of financial support for science and education have emerged: Grants, scholarships for graduate students, young scientists, and research teams.
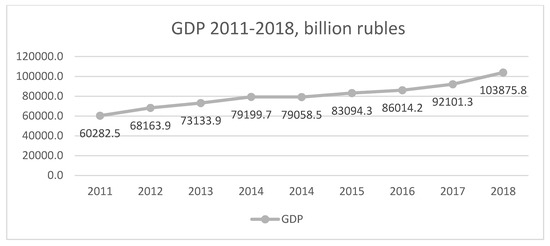
Figure 4.
GDP growth in 2011–2018 [7].
All data were collected on the basis of reports of the Federal State Statistics Service—Socio-Economic indicators of regions [48]. All reports are publicly available.
Our approach is a one-step DEA. We will use a model focused on output factors, i.e., an output model. We believe that the input factors in this model are more manageable.
The application of the DEA method based on the collected data was made possible using the RStudio program.
4. Results
Before applying the DEA methodology, it is necessary to analyze descriptive statistics using generalized statistics: Mean, median, skewness, and kurtosis, standard deviation (Table 3 and Table 4).
Table 3.
Descriptive statistics for the independent variables.
Table 4.
Descriptive statistics for the dependent variables.
With a normal distribution, which is symmetrical, the median should be equal to the mean, skewness should be zero, and kurtosis should also be equal to 0.
According to the descriptive statistics, it can be observed that the median significantly exceeds the arithmetic average. For example, for the indicator “research” the median takes the value 1768.5, and the mean is 12,008.58, that is, an excess of the indicator is established by almost 10 times.
The value of asymmetry can be interpreted as follows. Since for all indicators, the value is greater than zero, we can talk about right-hand asymmetry. The value of kurtosis, also exceeding 0, indicates that in this model there is a sharp-pointed distribution.
Since the average and median do not coincide, and the value of kurtosis and asymmetry is quite large, we can conclude that the distribution is abnormal. To normalize the distribution, it was decided to use logarithms. Note that after translating into logarithms, the variables will have new labels (names) (Table 5).
Table 5.
Input and output factors of the model after logarithm.
It is necessary to analyze the values of descriptive statistics of the model when translating variables into logarithms (Table 6 and Table 7).
Table 6.
Descriptive statistics for the independent variables after logarithm.
Table 7.
Descriptive statistics for the independent variables after logarithm.
The table shows that the values of the median and mean are close to each other and almost equal. For the variable “lnngrad” for example, the median value is 2.066, and the arithmetic mean value is 2.07. Left-side asymmetry is observed for most variables, since the asymmetry value is negative, that is, less than 0. However, all these values tend to 0 or have a value close to 0. The value of kurtosis is negligible, but the spiky distribution remains.
A similar conclusion can be reached based on the results of the analysis of histograms (Figure 5 and Figure 6). We selectively plotted histograms for dependent and independent variables to compare descriptive statistics.
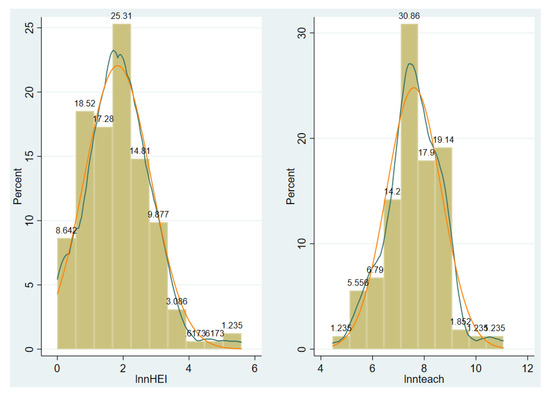
Figure 5.
Histograms for independent variables after logarithm.
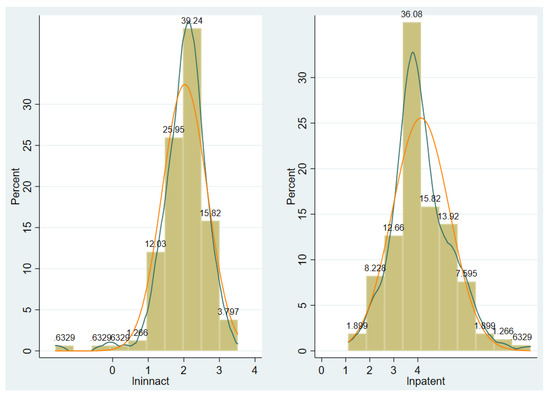
Figure 6.
Histograms for dependent variables after logarithm.
The results of the analysis of the histograms show full compliance with descriptive statistics. The distribution is slightly shifted to the left, i.e., asymmetry is observed on the left. The solid orange line in the graph is plotted using the normal distribution function. An abnormal distribution of variables is observed. It can be noted that the variable “lnnHEI” goes beyond the normal distribution, since universities are distributed unevenly throughout the country, in some regions, such as Moscow, St. Petersburg, Kazan, there are much more universities than in other regions, and in some especially separate territorial universities are absent.
A variable that goes beyond the normal distribution of “lnpatent” implies that patents are granted in some regions with more patents than in others. It is possible to associate with a lack of universities, small innovative enterprises, a lack of a state program to support innovation, or with a population over the age of 65.
To determine the efficiency of the regions of Russia are in relation to each other with the same set of input and output factors, a dataset was analyzed. Obviously, in some geographically remote regions, there are no universities, so the efficiency indicator with the meaning that we put in it will be zero. It must be understood whether the number of universities depends on a performance indicator.
We used a partially linear direct output-oriented model (CCR-Output) with a constant scale effect (CRS). The number of DMUs is 85, and the results of the DEA are presented in Table 8.
Table 8.
Data envelopment analysis (DEA) results.
According to the DEA method, the efficiency indicator is evaluated within the range from 0 to 1. The most effective regions with the indicator of 1 or close to one. We can divide the regions into three groups. Leaders and developed regions (0.7–1.0), developing regions (0.1–0.7), and relatively weak regions (0–0.1). The most effective regions were the Moscow region, Moscow, Arkhangelsk region, Saint Petersburg, Republic of Crimea, Sevastopol, Republic of Mordovia, Republic of Tatarstan, Perm region, Amurskaya Oblast, and Magadan Region. Despite this, we cannot take into account regions that show efficiency 1; however, they do not have university complexes or branches, technology parks that belong to universities. It is advisable to remove from the sample: Nenets Autonomous Okrug, Yamal-Nenets Autonomous Okrug, Chukotka Autonomous Okrug, Republic of Adygea. In addition, it is impossible to say about the unit effectiveness of the Republic of Crimea, since in this case, there is no input data, since the Crimea entered the Russian Federation only in 2013.
The high-performance indicators of Moscow and St. Petersburg are explained by several different factors, in particular, the concentration of the business community in these cities, various scientific schools, various subjects of innovation infrastructure, and availability of the increased federal and regional financial support for innovative and research projects.
The analysis shows that the group of the most inefficient regions consists of 40 regions. In our opinion, this depends on how large the region is and how many potential development opportunities it has. In these regions, there are really low rates for graduates and scientists with a degree, as well as a low level of output indicators: Insufficient funding, a small number of registered patents.
The analysis of the DEA results showed multidirectional trends in the influence of universities on the regional innovation activity and effectiveness of the region, which makes it expedient to further study the characteristics of the mechanisms of interaction between actors, and their impact on the quality of regional innovation systems. In addition, several regions (for example, Penza Region 0.04 and Krasnodar Region 0.058), which are rated quite high for the quality of life and innovative activity, have obviously not introduced the most effective mechanisms for using universities located in their territory, such as resources to improve the effectiveness of the region.
It is important to show the significance of each factor for the level of innovative activity in the region. We want to find out whether these time series can actually be used with these variables to show the causality of using resources to achieve a result. In order to establish the significance of factors, we will build regression models using Stata15. Then we will see which of the independent variables are significant in the model relative to the dependent variables. So, all input paraments from the DEA model are independent variables (X) for regression analysis, and all output paraments are dependent variables (Y). To achieve high values of significance for the P value, we removed the constant from the model and used the logarithmic values of the independent variables. After conducting a regression analysis, we found that the following indicators became the most significant for Y (Figure 6 column 1). Now we can build SEM. SEM stands for a structural equation model, and allows you to create path diagrams for SEMs, and show results on the path diagram (Figure 7).
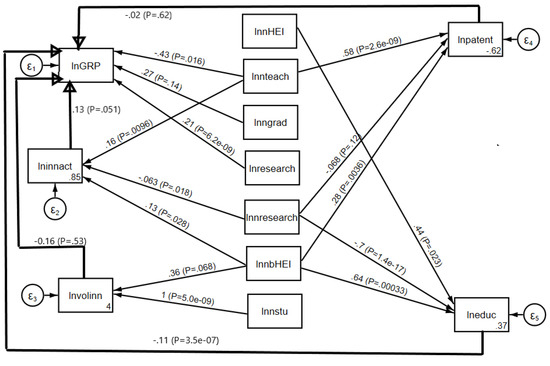
Figure 7.
SEM path diagram.
An analysis of the SEM estimation results (Table 9) showed that all the independent variables selected for the analysis are significant for the model, since the p value tends to 0.000. The number of branches of higher education institutions (0.108) became less significant for the dependent variable “Innovative activity of organizations”, and for the variable “Patent filing”, the number of researchers with a degree (0.163) became. However, the significance level of these variables suggests that they can be used for the model, although they are less significant than the others.
Table 9.
SEM regression modelling results.
It should be noted the variables with a negative coefficient, which have an inverse effect on the dependent variable. In other words, these are input resources that reduce the value of indicators of output resources. Among these, there was the “Graduation with bachelor’s, master’s, and specialist degrees” indicator, which negatively affects the GDP indicator. The number of researchers who have a degree also negatively affects the innovative activity of organizations in the region, as well as the number of patents granted.
This means that the model is adequate and proves its applicability for the increased perception of universities as drivers of the innovative activity in Russian regions.
5. Discussion: The Open Innovation by Universities in Regional Innovation System
We use the possibilities of innovative regional development, because it is necessary to focus on knowledge. Within the framework of the management system, the concept of open innovation can be considered. We consider the concept of using open innovation projects as a tool to improve the efficiency of the innovation process, since at present, the implementation of this concept makes it possible to reduce the time and financial resources for creating innovative activities, increase the economic result from innovation and investment projects, and reduce the level of innovation and investment risks. The underlying basic idea of a global and free transfer of ideas and technologies implies close interaction between the regional innovation system, for example, between universities and a business representative. The basic principles of open innovation were formulated by Chesborough, and among them, there is a principle based on the use of both external and internal knowledge, which also applies to the activities of universities within the RIS.
Based on the concept of open innovation, free inbound and outbound information flows are possible, allowing companies to use external sources of innovation in interaction based on commercial orders, as well as allowing universities to participate in the intellectual property market. In addition, open innovation in universities leverages strategic alliances that have achieved synergies in R&D.
As a positive example of the implementation of open innovation, we can consider the platform for the implementation of joint projects within the framework of the “smart city” model in Tampepe, Finland. As part of this open activity, the knowledge triangle and quadrilateral models of the experience of three Finnish universities, which are currently beginning to transform, were analyzed. The coverage of these models was limited to a few project participants of several large projects, leading universities. At the moment, the situation has been transformed, and now more and more attention is paid to the development of open innovation eco-systems, open innovations on the platform with the involvement of a wider circle of participants in the innovation process. Such transformation and formation mechanisms form a qualitatively new space for co-production.
In the Russian Federation, restrictions can be set, as well as institutional conditions can be used that hinder the implementation of the idea of open innovation. This is due to the fact that regional companies operate in the innovation market and bear more risks compared to organizations that operate under dark conditions. In the Russian Federation, there is a weakly effective legal protection of innovations and intellectual property, which negatively affects the development of, for example, the Patent Federation, and of innovative infrastructures of universities. The specific problems of the development of open innovations in the regional innovation systems of the Russian Federation impose sanctions that limit access to innovations in key sectors of the knowledge economy. In addition, there are further limitations, such as the insignificant effect of supporting innovative entrepreneurship. These limitations can be tackled by using the possibilities of introducing innovative activities in the regions, including the possibility of introducing innovative activities in the regions.
6. Conclusions
Development of such methods for assessing the effectiveness of the innovation system and participation of universities in all regions allows us to find various aspects of university activities and to create tools to assess their opportunities for innovative development, in order to develop efficiency and evaluate effectiveness of innovative activities of universities, ratings of regions.
It can be argued that there is a connection between universities and the regional innovation system. Thus, we can say that we have chosen the most significant indicators to calculate the effectiveness of the regions based on the regression analysis. The impact of the activities on the level of innovation in the region is tantamount to using the data coverage analysis (DEA). We can determine the efficiency of regions. The validity of the selected factors for the analysis has been proven.
During the research, several tasks were solved to achieve the goals and confirm the hypothesis. Among these tasks: Assessment of national and international studies; definition of the main factors as a resource; and model building and description of the results.
Thanks to the results obtained, it was possible to formulate the following recommendations on developing a more effective mechanism and tools for interaction between participants of the innovation system in the region when implementing the strategy of innovative development of the regions. Universities must actively create sophisticated, innovative infrastructures for educational institutions. It is necessary to open science parks, business incubators, centers of excellence, small innovative enterprises. It is equally important to optimize the research and development work carried out in accordance with the needs of the market and the demand for innovative products for use in a particular region. It is necessary to develop instruments of state support for universities, to develop a mechanism to stimulate grant and patent activities of research groups within the university.
However, there are limitations to further research. This thesis deals with the impact of the Russian universities’ performance on the Russian regions’ economy.
Further analysis can be carried out based on the performance of universities and regional development in other countries, taking into account the specific features of the regional innovation systems. In addition, the model can be enhanced and tested by adding other factors into it, and further used to evaluate the efficiency of the regional innovation system. Based on the DEA, it is planned to consider and analyze the influence of leading universities on the depressive regions of the Russian Federation, since the integration of universities and regional innovation systems is at a high level, including, for example, the Lomonosov Moscow State University in 2019 opened the Vernadsky program to create mirror laboratories at regional universities.
Author Contributions
D.R. developed the theoretical basis of this paper based on the discussions with co-authors. The author of the thesis also wrote the methodological section of this paper, developed suggestions and conclusions through the discussion with co-authors. D.V. was responsible for collecting data for literature review and building an econometric model for calculating the efficiency of regional innovation systems using the DEA method. The methods of data analysis, the main findings and contributions of the study were discussed in collaboration with the co-author. All authors have read and agreed to the published version of the manuscript.
Funding
This research work was supported by the Academic Excellence Project 5—100 proposed by Peter the Great St. Petersburg Polytechnic University.
Acknowledgments
Authors would like to thank for support Graduate School of Industrial Economics, Peter the Great St. Petersburg polytechnic university and Faculty of Economics, St. Petersburg, Russian Federation.
Conflicts of Interest
The authors declare no conflict of interest.
Appendix A
Table A1.
The dataset of 85 Regions of the Russian Federation.
References
- Hauge, E.S.; Pinheiro, R.M.; Zyzak, B. Knowledge bases and regional development: Collaborations between higher education and cultural creative industries. Int. J. Cult. Policy 2018, 24, 485–503. [Google Scholar] [CrossRef]
- Benneworth, P.S.; Fitjar, R.D. Contextualizing the role of universities to regional development: Introduction to the special issue. Reg. Stud. Reg. Sci. 2019, 6, 331–338. [Google Scholar] [CrossRef]
- Reichert, S. The Role of Universities. In Regional Innovation Ecosystems; European University Association: Brussels, Belgium; Geneva, Switzerland, 2019; Available online: https://eua.eu/downloads/publications/eua%20innovation%20ecosystem%20report%202019v1.1_final_digital.pdf (accessed on 8 March 2019).
- Vila, L.E. The Micro-Macro Interfaces of Higher Education, Innovation, Regional Growth and Regional Development; Springer: Berlin/Heidelberg, Germany, 2019; pp. 141–166. [Google Scholar]
- Varga, A.; Erdős, K. Handbook of Universities and Regional Development; Edward Elgar Publishing: Cheltenham, UK, 2019. [Google Scholar]
- Pinheiro, R.; Young, M.; Sima, K. Higher Education and Regional Development; Palgrave Macmillan: London, UK, 2018. [Google Scholar]
- Website of the Federal State Statistics Service. Available online: http://www.gks.ru (accessed on 8 March 2019).
- Beliakov, S.; Lugachyov, M.; Markov, A. Financial and Institutional Change in Russian Higher Education. SSRN Electron. J. 1999. [Google Scholar] [CrossRef]
- Cowan, R.; Zinovyeva, N. University effects on regional innovation. Res. Policy 2013, 42, 788–800. [Google Scholar] [CrossRef]
- Bychkova, A.; Rudskaia, I. assessing the efficiency of a regional innovation system as one of the models for running an innovative business. In Proceedings of the 2018 International Conference on Internet and e-Business, Singapore, 25–27 April 2018; pp. 208–212. [Google Scholar]
- Rodionov, D.G.; Rudskaia, I.A.; Kushneva, O.A. How key Russian Universities advance to become leaders of worldwide education: Problem analysis and solving. World Appl. Sci. J. 2014, 31, 1082–1089. [Google Scholar]
- Ahn, T.; Charnes, A.; Cooper, W.W. Efficiency characterizations in different DEA models. Socioecon. Plann. Sci. 1988, 22, 253–257. [Google Scholar] [CrossRef]
- Banker, R.D.; Charnes, A.; Cooper, W.W. Some Models for Estimating Technical and Scale Inefficiencies in Data Envelopment Analysis. Manag. Sci. 1984, 30, 1078–1092. [Google Scholar] [CrossRef]
- Charnes, A.; Cooper, W.W.; Rhodes, E. Evaluating program and managerial efficiency: An application of data envelopment analysis to program follow through. Manag. Sci. 1981, 27, 668–697. [Google Scholar] [CrossRef]
- Etzkowitz, H.; Leydesdorff, L. The triple helix—University-industry-government relations: A laboratory for knowledge based economic development. EASST Rev. 1995, 14, 14–19. [Google Scholar]
- Solesvik, M.Z. The Triple Helix Model for Regional Development and Innovation: Context of Nordic Countries; Wydawnictwo Naukowe Akademii WSB: Dabrowa Gornicza, Poland, 2017; pp. 5–21. [Google Scholar]
- Clark, B.R. The Higher Education System: Academic Organization in Cross-National Perspective; University of California Press: Berkeley, CA, USA, 1986. [Google Scholar]
- Abbott, M.; Doucouliagos, C.; Doucouliagos, H. The efficiency of Australian universities: A data envelopment analysis. Econ. Educ. Rev. 2003, 22, 89–97. [Google Scholar] [CrossRef]
- Frolova, I.A. Social’no-jekonomicheskaja jeffektivnost’Rossijskogo vysshego professional’nogo obrazovanija (Socio-economic efficiency of Russian higher education). Her. Omsk. Univ. Ser. Econ. 2011, 1, 68–73. [Google Scholar]
- Gafforova, E.B.; Karlovsky, A.V. On approaches to assessing the effectiveness of universities’ activities. World Econ. Manag. 2009, 9, 34–48. [Google Scholar]
- Jarocka, M. Transparency of university rankings in the effective management of university. Bus. Manag. Educ. 2015, 13, 64–75. [Google Scholar] [CrossRef]
- Smolentseva, A. Current trends in Russian higher education. Int. High. Educ. 1999, 16, 13–14. [Google Scholar] [CrossRef][Green Version]
- Rivchun, T.E. Scientific and methodological approaches to assessing the effectiveness of the university. Serv. Plus. 2010, 3, 137–146. [Google Scholar]
- Lawson, H.A. The physical education system as a consequential social determinant. Quest 2020, 72, 72–84. [Google Scholar] [CrossRef]
- Stepanova, I.N. Higher education: Social lift or social barrier? World Sci. Discov. Mire Nauchnykh Otkrytiy 2014, 59, 1–2. [Google Scholar] [CrossRef]
- Klochkova, E.S.; Alasas, B.M.; Esedulaev, R.R.; Tveryakov, A.M.; Vasily’Ev, D.V.; Krayneva, R.K. Assessment of the quality of higher professional education on the basis of professional and social accreditation. In Proceedings of the 2017 IEEE VI Forum Strategic Partnership of Universities and Enterprises of Hi-Tech Branches (Science. Education. Innovations) (SPUE), St. Petersburg, Russia, 15–17 November 2017; pp. 137–140. [Google Scholar] [CrossRef]
- Florax, R.J. The University: A Regional Booster? Economic Impacts of Academic Knowledge Infrastructure; Aldershot: Hampshire, UK, 1992. [Google Scholar]
- Lehmann, E.E.; Meoli, M.; Paleari, S.; Stockinger, S.A.E. Approaching effects of the economic crisis on university efficiency: A comparative study of Germany and Italy. Eurasian Bus. Rev. 2017, 8, 37–54. [Google Scholar] [CrossRef]
- Feng, Y.J.; Lu, H.; Bi, K. An AHP/DEA method for measurement of the efficiency of R&D management activities in universities. Int. Trans. Oper. Res. 2004, 11, 181–191. [Google Scholar]
- Chatterton, P.; Goddard, J. The response of higher education institutions to regional needs. Eur. J. Educ. 2000, 35, 475–496. [Google Scholar] [CrossRef]
- Schwartz, M.; Peglow, F.; Fritsch, M.; Günther, J. What drives innovation output from subsidized R&D cooperation?—Project-level evidence from Germany. Technovation 2012, 32, 358–369. [Google Scholar]
- Williams, R. Methodology, meaning and usefulness of rankings. Aust. Univ. Rev. 2008, 50, 51. [Google Scholar]
- Ponds, R.; Oort, F.; Frenken, K. Innovation, spillovers and university-industry collaboration: An extended knowledge production function approach. J. Econ. Geogr. 2009, 10, 231–255. [Google Scholar] [CrossRef]
- Kang, D.; Jang, W.; Kim, Y.; Jeon, J. Comparing national innovation system among the USA, Japan, and Finland to improve Korean deliberation organization for national science and technology policy. J. Open Innov. Technol. Mark. Complex. 2019, 5, 82. [Google Scholar] [CrossRef]
- Goddard, J.B.; Chatterton, P. The response of universities to regional needs. In Economic Geography of Higher Education: Knowledge, Infrastructure and Leanring Regions; Boekema, F., Rutten, R., Eds.; Routledge: London, UK, 2003. [Google Scholar]
- Zaborovskaya, O.V. Conditions of formation, development and restoration of human capital in Russia: Modern tendency. Fed. Sci. Theor. J. 2013, 1, 1–2. [Google Scholar]
- Kaufmann, A.; Tödtling, F. Science–industry interaction in the process of innovation: The importance of boundary-crossing between systems. Res. Policy 2001, 30, 791–804. [Google Scholar] [CrossRef]
- Hall, B.H.; Link, A.N.; Scott, J.T. Universities as research partners. Rev. Econ. Stat. 2003, 85, 485–491. [Google Scholar] [CrossRef]
- Yao, W.; Li, H.; Weng, M. The role the university could play in an inclusive regional innovation system. Triple Helix 2018, 5, 1–21. [Google Scholar] [CrossRef]
- Warnecke, C. New survey data on the role of universities in the German regional innovation system. Jahrb. Natl. Okon. Stat. 2018, 238, 601–608. [Google Scholar] [CrossRef]
- Charles, D. Universities as key knowledge infrastructures in regional innovation systems. Innov. Eur. J. Soc. Sci. Res. 2006, 19, 117–130. [Google Scholar] [CrossRef]
- Anselin, L.; Varga, A.; Acs, Z. Local geographic spillovers between university research and high technology innovations. J. Urban Econ. 1997, 42, 422–448. [Google Scholar] [CrossRef]
- Firsova, A.A.; Makarova, E.L.; Tugusheva, R.R. Institutional management elaboration through cognitive modeling of the balanced sustainable development of regional innovation systems. J. Open Innov. Technol. Mark. Complex. 2020, 6, 32. [Google Scholar] [CrossRef]
- Fonseca, L. Designing regional development? Exploring the University of Aveiro’s role in the innovation policy process. Reg. Stud. Reg. Sci. 2019, 6, 186–202. [Google Scholar] [CrossRef]
- Klochkov, Y. Analysis of the publication activity of university researchers. In Proceedings of the 2019 Amity International Conference on Artificial Intelligence (AICAI), Dubai, UAE, 4–6 February 2019; pp. 74–79. [Google Scholar]
- Aschhoff, B.; Schmidt, T. Empirical Evidence on the Success of R&D Cooperation—Happy Together? Rev. Ind. Organ. 2008, 33, 41–62. [Google Scholar]
- Belderbos, R.R.; Carree, M.; Lokshin, B. Cooperative R&D and firm performance. Res. Policy 2004, 33, 1477–1492. [Google Scholar]
- Kim, H.; Park, Y. The impact of R&D collaboration on innovative performance in Korea: A Bayesian network approach. Scientometrics 2008, 75, 535–554. [Google Scholar]
- Arvanitis, S.; Sydow, N.; Woerter, M. Is there any impact of university-industry knowledge transfer on the performance of private enterprises? An empirical analysis based on Swiss firm data. SSRN Electron. J. 2005. [Google Scholar] [CrossRef]


Publisher’s Note: MDPI stays neutral with regard to jurisdictional claims in published maps and institutional affiliations. |
© 2020 by the authors. Licensee MDPI, Basel, Switzerland. This article is an open access article distributed under the terms and conditions of the Creative Commons Attribution (CC BY) license (http://creativecommons.org/licenses/by/4.0/).