1. Introduction
Heat transfer in a fire scenario significantly affects the strength and performance of structural components such as beams, columns, and slabs. For instance, heat can alter the mechanical properties such as strength and stiffness of the material of these and can weaken even the noncombustible materials [
1]. Therefore, it is critical to appropriately define the thermal environment to which these components are exposed, to estimate their structural performance in fire conditions.
More than 30% of the urban population lives in informal settlements and the size of which is currently increasing. Often, the structures of the above settlements are extremely vulnerable to fires due to combustible construction materials and limited access to fire services [
2]. Further, the density of housing is so high that an extremely fast fire spread is typically observed; fire incidents in informal settlements is even analogous to wildfires [
3]. To understand this disastrous fire spread phenomenon, real-scale fire tests with mockup informal settlements have been conducted outdoors [
4].
To measure both total and incident radiant heat flux, commercially available heat flux sensors such as Schmidt-Boelter gauges and Gardon gauges have been used traditionally by fire safety researchers [
5]. Both gauge types require cooling water to maintain relatively constant surface temperature by removing absorbed heat continuously. However, using such gauges can be often impractical for outdoor fire tests such as those for informal settlements where continuous water supply is not available. As the need for a more robust and less cumbersome alternative to the water-cooled gauges became apparent, the researchers have used the existing plate thermometer (PT) which was originally developed to measure the harmonized furnace temperatures in fire resistance tests to calculate the incident radiant heat flux. While PTs show reasonably accurate performance, their calculation accuracy has not been investigated associated with the outdoor environmental condition, especially the humidity.
The purpose of the current study is to identify whether the calculated incident radiant heat flux of PTs is influenced by the environmental moisture conditions. To achieve this goal, moisture contents of the insulation layers of the PT were altered, mimicking the changing environmental moisture content. Schmidt-Boelter type heat flux gauges were used to calibrate the PTs when pre-defined equations were used to calculate the incident radiant heat flux.
2. Materials and Methods
The common types of industrial gauges used to measure both total and incident radiant heat flux are the “water-cooled total heat flux gauge” (WCTHG) and the “water-cooled radiometer” (WCRM). WCRM only allows radiant heat transfer through a highly transparent window, but not convective heat transfer. These gauges can measure incident radiant heat flux up to 200 kW/m
2 [
6]. While providing very good accuracy, they have limited applications especially in outdoor fire tests due to water supply and associated tubing required.
2.1. Plate Thermometer
The plate thermometer has been used to define the thermal environment in the fire resistance furnaces as per ISO 834-1 (International Organization for Standardization) and EN 1363 (European Standard). Plate thermometers have several advantages over the commercially available gauges: simplified design, robustness, low manufacturing cost, and not requiring external cooling water supply [
7,
8]. The standard PT design consists of a 0.7 mm × 100 mm × 100 mm Inconel plate, backed by a 10 mm thick inorganic insulation material (density of 280 ± 30 kg/m
3) [
7]. The surface temperature of the Inconel plate is measured by a Type-K thermocouple welded to its geometric center between the plate and the insulation layer.
Perfect insulation with a negligible heat loss between the Inconel plate and the insulation layer is assumed for the standard PT. Lumped heat capacity analysis is acceptable due to the thin Inconel plate. Incident radiant heat flux calculations by PTs showed optimum results when the temperature of the metal plate and the insulation layer are close to each other as in steady-state conditions, which ensures minimized heat flow from the metal plate to the insulation layer [
8]. Conversely, at higher temperature differences (transient conditions) PTs generally show lower incident radiant heat flux than WCTHG. The reason is identified as a significant amount of heat loss from the Inconel plate to the insulation layer.
The standard PT design was modified by some researchers occasionally to achieve more accurate results [
9]. One of these modified PT designs is used in this research as shown in
Figure 1. The design consists of a 25.4 mm × 25.4 mm × 0.584 mm Inconel 600 metal plate (density of 8240 kg/m
3 and a specific heat capacity of 444 J/kg K) and two layers of ceramic fiber insulation layers bounded with a 6.35 mm cement board. An insulation layer (Kaowool
®PM) with a thickness of 6.35 mm is placed against the Inconel plate followed by a 12.7 mm thick second insulation layer (Kaowool
®M). Finally, two thin mechanical wires bind all the layers together as a single unit. Two thermocouples (Type-K, 24 gauge) are used to measure the front surface temperature of the Inconel plate and the insulation layer temperature. The first thermocouple is welded to the geometric center of the unexposed surface of the Inconel plate and the other one is inserted in between the two insulation boards.
An important modification of this PT design is the reduction of the size of the Inconel plate, which lowers thermal mass, reduces lateral heat loss from sides of the plate to the environment, increases the uniform temperature distribution on the plate, and provides smaller ‘Biot number’ (<0.1). As a result, this new plate design is capable of reacting faster under fast-changing fire conditions such as outdoor fire tests. Further, the Inconel surface is painted with high-temperature black paint to protect it from oxidative damage and maintain the surface emissivity relatively constant. In practical usage, the surface can be fouled due to the soot, which has dark in color. Considering that the surface color does not change noticeably due to the fouling, the emissivity of the surface is assumed to be constant values. The emissivity of the PT was determined to be 0.85 in agreement with previous research [
10].
Overall insulation thickness is increased by introducing two insulation layers. As a result, the overall heat loss from the Inconel plate is reduced. The nominal density of the selected ceramic fiber insulation is 256–320 kg/m
3 and the maximum allowable temperature is as high as 1204 °C (2200 °F) [
11]. By assuming negligible heat loss from the PT and only one dimensional (1-D) heat transmission from the Inconel plate to the insulation layer, the heat balance equation for the Inconel plate in mixed convective/radiation environment can be written as shown in Equation (1). The term in the left-hand side represents the amount of heat stored inside the Inconel 600 plate and the terms in the right-hand side represent the radiation heat absorbed from the plate, radiation heat reflected from the plate, convective heat transfer, and the heat loss from the plate.
2.2. Effects on Moisture Content to Heat Transfer
Moisture can reside inside a cell structure in two main forms: free moisture and bound water. Free moisture rests in cell lumens and cavities while the bound moisture rests within the cell walls [
12,
13]. To quantify the moisture inside a substance, the moisture content percentage (%MC) is introduced as the ratio between the mass of moisture and the mass of solids in the same volume as shown in Equation (2) [
14].
To determine the %MC inside the insulation layers, a pin-type moisture probe in the thermo-hygrometer (OMEGA™ RH 700) was used. This instrument gives the output in the unit of the “Wood Moisture Equivalent” percentage (%WME), which is the moisture content that would be measured if the material were wood [
15]. The conversion formula for %WME and %MC material has been developed as in Equation (3) below.
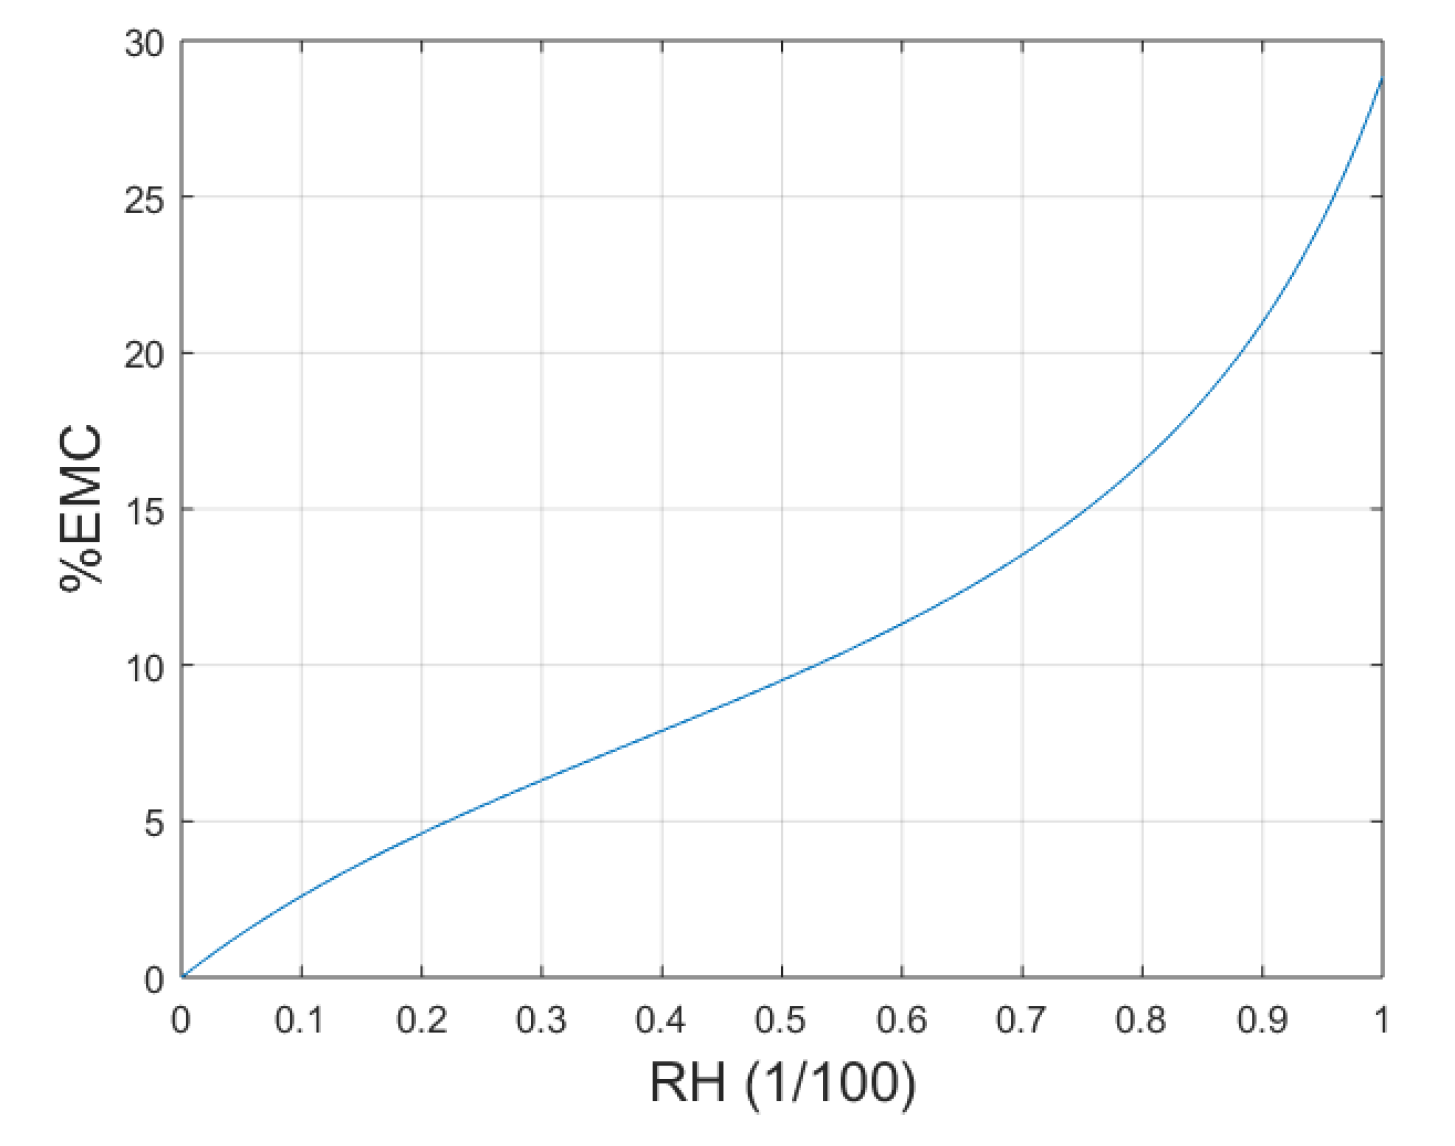
Relative humidity (RH), the ratio between the actual and saturated moisture density in the atmosphere, and the temperature are the two main factors that affect the internal moisture level of any material exposed to an environment. Once the porous material is exposed to an environment, it absorbs moisture from the environment, and eventually, the moisture content inside the material reaches equilibrium with the environment, known as “Equilibrium Moisture Content” (%EMC) [
16,
17]. A correlation between %EMC, RH, and the temperature was developed by Hailwood & Horrobin [
16,
18]. The value of %EMC represents the maximum %MC for that particular material for that atmospheric conditions. The %EMC in steady-state environmental conditions was plotted against increasing RH at 27 °C and is given in
Figure 2. The figure shows that the range of %EMC generally falls between 0% and 30% in any given ambient environment.
2.3. Previous Studies on Moisture Content Influence on Heat Transfer
A study performed by Hedlin [
19] validated varying heat flow rates through roof insulation depending on the moisture content on it. The insulation layer with controlled moisture percentage was placed on top of the roof; heat flow through the insulation layer was measured using heat flux transducers. The result of the Hedlin study shows different temperatures and heat flux values for each selected moisture condition. Researchers conjectured it is because of the two factors: the moisture evaporated from the warm surface of the insulation and condensing at the cold. Further, the study showed a noticeable difference in the heat flux measurements of the insulation in different moisture conditions and agreed that the heat flux measurement accuracy decreases with the moisture content in the insulation layers. Khoukhi, et al. [
20], studied the moisture effect on heat transfer through the building envelope. Polystyrene insulation material with different densities under different moisture content levels; 10%, 20%, 30%, have been used as the controlling factors for the study. Internal and external temperature difference variation was observed along with the insulation density and the moisture content. As the moisture content increases, the temperature difference showed decreasing tends due to the increased conductivity. Research conducted by Liu, et al. [
21] determined the effect of moisture content on heat transfer and thermal properties of the hot pressing process of plywood. A quasi-steady method was used to determine the specific heat, thermal conductivity, and thermal diffusivity in different moisture levels. Researchers mainly focused on two plywood pressing phases; fast heating and slow heating. Results showed that when the moisture content in the range of 10–22%, the specific heat, and thermal heat capacity enhanced significantly.
2.4. Temperature Represents the Perfectly Insulated Condition
Liu, et al. [
8], introduced a new method to determine incident radiant heat flux; instead of focusing the heat loss from the metal plate, a new surface temperature to be calculated when the PT having perfect insulation conditions, denoted as
Ts-ideal. This temperature is always higher than the measured surface temperature as it has to compensate for the heat losses and the uncertainties associated with the PT such as thermocouple welding, thermocouple wire heat conduction, etc. The energy balance equation for the PT: Equation (1), can be modified as shown in Equation (4) by introducing the
Ts-ideal to compensate for the heat losses.
2.5. Experimental Setup
An experimental setup was developed to determine the incident radiant heat flux by measuring the PT’s front surface temperature corresponding to different atmospheric weather conditions. The PT was configured accordingly by manipulating the moisture level of the insulation layers along with the varying heat flux applied to the PT surface. The study was mainly categorized into two different phases.
In the first phase, an unheated (or freshly-made) PT, and WCRM were subjected to incident radiant heat flux from the cone calorimeter heater (manufactured by Fire Testing Technology, West Sussex, UK) and increased its temperature gradually from 200 °C to 900 °C in 100 °C increments. The same procedure was followed for the preheated PT as well. The internal bonds within the insulation layers made of ceramic fiber were deemed to be degraded if the PT is preheated.
The second phase is about different moisture levels: 0, 45, 65, and 98 (measured in %WME) in the insulation layers of the preheated PT. Possible minimum humidity or 0%WME was achieved by drying the PT inside a furnace (manufactured by Thermo Fisher Scientific, Waltham, MA, USA) at 60 °C until the moisture content of the insulation layers reached 0%WME. To achieve 45% and 65%WME, insulation layers were kept on a stand inside a sealed plastic container filled with water up to 40 mm level for 9–12 h and approximately 24 h, respectively. By this method, insulation layers absorb moisture evenly from the exposed surfaces as it happens in the normal environment. The insulation layers were prepared for 98%WME to imitate raining conditions in a wet humid day. This situation was created by dropping a few water droplets on the insulation layers since, in actual raining conditions, rainwater will create high water concentration in a smaller area.
This respective %MC for the selected %WME can be calculated using Equation (3) as 0, 87, 125, and 188 by taking the wood density as 0.520 g/cm3. Then, the prepared PTs and WCRM were positioned under the cone calorimeter heater and followed the same procedure in phase one.
2.6. Calibration and Data Collection
The correlation development between the front surface temperature and incident radiant heat flux is the main purpose of the calibration. The PT and the WCRM were fixed in a horizontal configuration, close to each other, and maintaining a 25 mm distance under the center of the cone calorimeter heater element, complying with ISO-5660 to measure the incident radiant heat flux and the front surface temperature as shown in
Figure 3.
The calibration was performed by progressing the cone calorimeter heater temperature from 200 °C to 900 °C with an increment of 100 °C. Each temperature was maintained for 300 s to provide a steady-state condition to the PT and WCRM. Convection contribution throughout the calibration process was considered negligible as the Rayleigh number was less than 10
3 [
22]. The two major reasons for this minimum convection contribution are the horizontal configuration and the small size of the PT. The WCRM was cooled by water throughout the process to maintain the atmospheric temperature in the surface. Both PT and WCRM were considered exposed to the same incident radiant heat flux since there was a negligible convection effect in the system [
8]. Considering the radiation-only environment, Equation (4) can be modified as Equation (5).
Relating the measured incident radiant heat flux values from the WCRM, corresponding steady-state
Ts-ideal values can be determined using the above equation. Further, a correlation between steady-state
Ts-ideal and measured surface temperature can be developed as shown in Equation (6).
An equation to calculate incident radiant heat flux using measured surface temperature in the radiation only environment can be derived as shown in Equation (7) by combining Equations (4) and (6).
3. Result and Analysis
Incident radiant heat flux results from WCRM and PT for the selected %MC were evaluated to check the effect on moisture condition to incident radiant heat flux readings. As the results from the first phase, front surface temperature, insulation layer temperatures, incident radiant heat flux values were plotted for both unheated and preheated PTs as shown in
Figure 4.
The first horizontal segment exhibits the behavior of the surface temperature of the PT when the cone reaches 200 °C and the last segment when the cone reaches 900 °C. The surface temperature plots in both graphs are ascending along with the cone heater temperature without any abnormalities. The horizontal portion of each step represents the steady-state condition. The insulation layer temperature of unheated PT shows an abrupt change upon the PT surface temperature reaching approximately 500 °C (773 K) around 3000 s of the graph. The ascending external temperature increases the insulation temperature and reduces the mechanical strength as well as the thermal stability along with the strength of the internal bonds. [
23].
This internal phenomenon influenced the temperature pattern and created an anomaly in the incident radiant heat flux values. The difference between the measured and calculated incident radiant heat flux values can be observed between 10 kW/m2 and 40 kW/m2 as a result of the aforementioned phenomenon. Over 40 kW/m2, the temperature and heat transfer showed a steady behavior. Conversely, preheated PT had its internal bonds already degraded due to the preheating. As a result, there was no noticeable difference in either insulation layer temperature or incident radiant heat flux graphs for the preheated PT.
Temperature and incident radiant heat flux with 0%, 45%, 65%, and 98%WME are shown in
Figure 5 and the plots for 0%, 45%, and 65%WME show comparatively similar trends. Insulation temperature values do not show any abrupt changes as described in the paragraph above, because the PT used in this stage was a preheated PT of which the internal bonds have already been degraded.
Free moisture close to the exposed surface of the insulation layer evaporates from the surface while the moisture content away from the exposed surface gets vaporized gradually upon receiving heat through the insulation layer by conduction. It should be noted that moisture inside the insulation increases the thermal conductivity which results in the decreased temperature gradient between the metal surface and the insulation layers. In
Figure 5b,c, approximately up to 200 s, both metal surface and insulation temperatures have relatively similar values. After moisture gets vaporized completely, the difference between the two temperatures becomes noticeable and continues through the experiment.
On the contrary, for 98%WME in
Figure 5d, the temperature reading of the front surface and the insulation layer is very close until the surface temperature becomes 110 °C (380 K, 2700 s). In this period, higher moisture content exists in the form of free and bound moisture and it increases the thermal conductivity in the insulation. As a result, the thermal gradient through the insulation layer decreases by showing very similar front surface and insulation temperatures. After vaporizing the moisture inside the insulation with the heat, conductivity decreases, and both temperature and incident radiant heat flux graphs show a normal pattern. To explain this phenomenon further, a comparison of error percentage calculated using the average incident radiant heat flux from WCRM and PT is shown in
Table 1.
A decreasing pattern in the error percentage is observed with the increasing cone heater temperature in all moisture conditions. This is because of the moisture inside the PT insulation getting reduced with the cone heater temperature. As the %WME increases, the internal moisture content increases as well as the vaporization time. Error percentage values for the cone temperatures under 400 °C, show comparatively higher values and measured incident radiant heat flux are less than 5 kW/m
2 according to
Figure 5. Since the error percentage represents the ratio of absolute error to the measured incident radiant heat flux, even with the smaller absolute error values give higher error percentages in lower incident radiant heat fluxes, i.e., lower temperatures.
The error percentage in 98%WME shows a much higher value than the range of 0–65%WME as it contains more moisture inside. Increasing moisture inside tends to settle bound moisture inside the cells. Bound moisture requires more energy and time to escape from the cells and vaporize. The vaporization energy shown in
Table 2 describes this phenomenon further.
For 45 and 65%WME in
Table 2, the calculated energy is less than the required energy to evaporate moisture content from the PT. In this range, it is conjectured that excessive free moisture can evaporate from the sides of the PT covered with a high porous wool blanket. This evaporation does not require to absorb energy from the outside heat source.
On the contrary, for 98%WME, the energy required to vaporize moisture is comparatively less than the calculated energy. It is conjectured that this is due to the existence of high content of bound water inside the insulation. Bound moisture needs additional energy to detach and vaporize from the cell. Vaporization energy is calculated based on the amount of moisture without considering the detachment energy. That makes a noticeable difference between these two values.
The maximum %EMC observed in 100% RH lies in between 27% to 30% as in
Figure 2, which is well below for all 45%, 65%, and 98%WME. Even the 45%WME (87%MC) contains more moisture than an average day would have. Additionally, 98%WME represents 188%MC, which may correspond to a rainy day. This analysis shows that PT containing even 65%WME (125%MC) moisture gives accurate enough temperature readings to calculate incident radiant heat flux. Therefore, PT provides sufficiently accurate incident radiant heat fluxes in almost all weather environments given that no water droplets inside the PT.
The accuracy of the calculated incident radiant heat flux as well as the temperature measurement of the PT depends on the measurement error of the Type-K thermocouple. The thermocouple used in this study has a measurement error as the greater value between 2.2 °C and 0.75% [
7]. The two uncertainties associated with the WCRM incident radiation heat flux measurements; calibration and non-linearity, were given as ±6.5% and ±2.0% respectively [
5]. The error function was developed based on the Equation (7) and the uncertainty range mentioned above for the incident radiant heat flux as shown in Equation (8). The calculated average incident radiant heat flux uncertainty for both phases of this study varies from 2.86% to 3.27%, which is within an acceptable limit for any possible moisture content inside the PT.
4. Conclusions
The purpose of the current study is to investigate the effect of moisture content in the PT insulation on the incident radiant heat flux calculations. The study was conducted in two phases; (i.) unheated PT against preheated PT, (ii.) manipulating the moisture levels inside the PT. Preheated PT was used to develop the calibration equation. As a result, preheated PT provides sufficiently accurate results compared to fresh-made PT. In the second phase, four moisture conditions were compared equivalent to 0%, 45%, 65%, and 98%WME. Considering the relationship between RH and %WME, the values of 45%, 65%, and 98%WME are deemed to contain more moisture than the equilibrium with a 100% RH. The findings of the second phase showed that the incident radiant heat flux calculated using PT having 0 to 65%WME does not deliver any noteworthy difference from that of the WCRM. Instead, PT with 98%WME showed a noticeable difference between the incident radiant heat flux values as the moisture inside the insulation layers absorbs heat from PT to vaporize. We recommend the use of preheated PT in any environmental moisture conditions for accurate enough incident radiant heat flux measurement given that no water droplets have been added to the PT.
The PT has been used to measure the incident radiant heat flux in the fire engineering community and showed a promising performance, specifically outdoor fire tests to study the fire spread phenomena for informal settlements or wildfires. The current study is expected to contribute to minimizing concerns on the measurement accuracy of PTs in varying ambient humidity conditions in outdoor fire tests.


