1. Introduction
The private value of a patent depends on the specific context in which valuation is made. A valuation must be made “within the context of time, potential owners, and potential uses” [
1] (p. 141). In general, many important determinants of patent value such as commercialization strategies are hidden or unknown as of the valuation date and observable patent value indicators such as counts of citations, claims, while words of the patent paper don’t provide enough information for appraisers to precisely estimate the value of a patent.
The literature on private values of patents or innovations point to a highly skewed nature of the distribution of patent values. Scotchmer [
2] summarized findings from different sources as stylized facts about the distribution of patent values: the values of patents are highly dispersed and the distribution of values is highly skewed, with most of values provided by the top tier (around 10%) of patents. Although academic researches on the distribution of patent values are not considered to provide practical guidance for patent value appraisals, information about the distribution of values can be effectively exploited to test and compare the validities of vast lists of existent or potential patent value indicators.
An obstacle to researches on patent value indicators results from that patents are rarely traded and data on patent values are seldom obtainable. One strand of literature has side-stepped the measurement issue of patent values and indirectly estimated values from patent owners’ decisions on foreign applications [
3] or renewals [
4]. For example, [
4] incorporated patent characteristics and other variables into the models constructed by the literature using data on renewal decisions [
5,
6,
7] and estimated the “protection value” [
8] or “renewal value” [
9] of patents. The other strand of literature has treated patents as assets and tried to collect information on the “asset value” [
9] in order to test patent value indicators. Some researchers obtained subjective asset value estimates from surveys targeted at inventors, patent experts, and patent owners [
9,
10,
11]. Recently, [
12] used directly observed asset value data of Ocean Tomo patent auctions between 2006 and 2009. In spite of different conceptions of patent values (protection/renewal value vs. asset value) and diverse modelling approaches, results from two strands of literature are largely comparable.
Among potential patent value indicators, many indicators including number of claims, number of backward references, and family size are fixed at the early period of the patent lifecycle (around the grant date) and can be dubbed “
ex ante indicators” [
13,
14]. Some indicators change through the patent lifecycle and are dynamic in nature. For example, changes in renewal or litigation status may occur at any point of time and forward citations may change beyond the legal life of the patent. These dynamic indicators convey some information on “
ex post impacts” [
13] or “learning” about patent values [
8,
15,
16]. We will call a set of indicators with dynamic characteristics “
ex post indicators”.
Researches on patent value indicators have failed to explicitly distinguish these two classes of indicators in their models and, therefore, have not analysed dynamic effects of
ex post indicators on values of patents. For example, several works cited above estimated the effects of forward citations on patent values [
4,
9,
11,
12], but they used total number of citations received or truncated number of citations received until five years after the filing date [
12,
17] as forward citation measures. As multidimensional data were reduced to one dimensional numbers, information related with learning was lost and not incorporated into the analysis.
This paper attempts to fill a research gap of literature by constructing the dynamic model into which both ex ante and ex post patent value indicators are incorporated, and demonstrating especially the effects of forward citations. We follow the patent renewal modelling approach which originated from [
5] and was significantly extended by [
4]. One weakness of renewal models is that they must assume explicit functional forms about the distribution of patent value because renewal data do not distinguish between different possible realized values of patents in the top tail [
8,
9]. In spite of the restrictions on functional forms, extant literature show that results from renewal models are comparable to those of direct approaches assuming no explicit functional forms. The primary reason why we adopt the renewal modelling approach is that renewal models are dynamic in nature and easy to incorporate dynamic variables explicitly. We use the granted patent data on the pharmaceutical technology field filed with the European Patent Office (EPO) between 1996–2009.
The paper is organized as follows.
Section 2 describes the model and the indicators used to estimate patent values.
Section 3 describes the data sources, the data collection procedure, and the resulting data set used as a basis for the analysis.
Section 4 presents results of estimations of coefficients.
Section 5 discusses contributions and limitations.
2. Model and Literature Review
2.1. The Estimation Model
The original renewal model of [
5] and later models of [
6,
7,
15,
16] were developed for aggregate patent data by industrial sectors or countries. [
3] developed cross-sectional models for individual patent data on international patent applications. [
4] extended the original renewal model for individual granted patent data, incorporating various patent value indicators. We construct a specific renewal model for individual patent data, distinguishing between ex ante and ex post indicators.
First, we postulate the underlying condition of patent renewal,
where
is the expected annual return (revenue)from the patent
i at age
a in year
t, and
is the renewal fee for the patent at age
a in year
t. In all renewal models, R
iat is not directly observable and assumed to be calculated as a sort of expected cash flow equivalent to benefits due to the patent i in year t. By definition, private value of the patent i in year 0 is the sums of discounted present values of R
iats. This condition reflects an annual decision made by the patent owner who will renew the patent only if its anticipated return in the next year is greater than the renewal cost.
We assume that the value
equals to multiplication of two factors, one factor
depending on ex ante indicators and the other factor depending on ex post indicators. We further assume that
decays at constant rate
and the latter factor is exponential function of linear combinations of
ex post indicators in year
t:
Here
represents the annual decay rate (
,
is depreciation rate),
represents the value of the
ex post indicator
n of patent
i in year
t and its characterized by the coefficient
, and
is the initial annual return of patent
i.
corresponds to the initial annual return of deterministic renewal models of [
4,
5,
6,
7]. To represent the skewness of distribution of
, researchers have tested log normal, Pareto, and Weibull distributions and found that log normal distribution provides best fit [
16] or only gives converging estimates [
4]. According to [
4], we assume that the
follows a log normal distribution,
where
is the value of the
ex ante indicator
m of patent
i characterized by the coefficient
. Since ex ante indicators are measured once (i.e. they are static), index for year is not required. With the expression (3), we can restate condition (1) as follows:
The inequality (4) can be expressed with the
z-score normalization as follows:
This renewal decision model is in fact a probit model,
where
is the dependent variable that tells whether or not the patent
i was renewed at the age
a in year
t. The set of independent variables include
ex ante indicators
, ex post indicators
, logarithm of renewal fee
, and age
a of patent
i in year
t. Renewal fee and patent age are indispensable variables for all generations of renewal models. Only if renewal fee is included as an independent variable, renewal models can estimate mean protection values of patents. The coefficient of patent age provides, along with the coefficient of logarithm of renewal fee, provides information about deterministic decay rate of annual returns of patents.
2.2. Patent Value Indicators
We test five ex ante indicators, i.e., family size, backward references to patent (backward citations), backward references to non-patent literature, number of claims, and number of inventors. We test only one ex post indicator, citations received from patents applied later (forward citations).
2.2.1. Family Size
Family size is the number of countries that protect the invention, so it captures the geographic scope of the patent. Since the scope is defined during the application, we treat this indicator as an
ex ante one. In this paper, we assume that family size is fixed at early time and does not change in patent’s life. However, after registration, family size may become smaller over time as patentees abandon patents in some countries. The value of a patent depends on both technological merit and economical relevance of the underlying invention [
12]. Compared with other indicators we are interested in this paper, family size provides more economical information relevant with the patent value such as market sizes or competitive structure of potential markets. After the pioneering research of [
3], multitude of studies has held the evidence for the positive and significant influence of this indicator on the patent value [
9,
12,
16,
18,
19], and we expect that our work will support this observation. We calculate the indicator (FAT) from the PATSTAT Biblio database provided by the EPO.
2.2.2. Backward Citations
Backward citations are the number of citations made to the patents applied earlier. While some researchers argue that backward citations measure the scope (breath) of the patent [
9,
20], others argue that they measure or have relevance to the technological novelty of the invention [
10,
13]. The literature holds numerous evidences on the strong and positive influence of this ex ante indicator on the patent value [
4,
9,
12]. We calculate backward citations (PBKWCIT) from the PATSTAT Biblio database provided by the EPO.
2.2.3. Backward References to Non-Patent Literature
This ex ante indicator is the number of citations made to non-patent literature published earlier. Known in the literature as the science linkage or the non-patent references, it captures the relation of the patent to the academic literature [
21]. It is known to be particularly strong for the pharmaceutical and chemical patents [
9]. We calculate this indicator (NPBKWCIT) from the PATSTAT Biblio database provided by the EPO.
2.2.4. Number of Claims
This
ex ante indicator is considered to reveal the legal scope of protection a given invention receives [
16]. Some researchers, however, argue that it may be positively correlated with the patent’s legal sustainability [
10,
12,
22]. Both interpretations imply that patents with higher number of claims have higher probability of renewal and larger values. We calculate the number of claims (CLAIMS) from the PATSTAT Biblio database provided by the EPO.
2.2.5. Number of Inventors
Compared with other indicators, the number of inventors or the size of research team that produced the invention underlying the patent has been relatively ignored in the literature. [
23] reported that the number of inventors is negatively correlated with the number of forward citations, a correlate of patent values. However, [
24] using OECD triadic patent data, reported that the number of inventors is positively correlated with the number of forward citations. Because of conflicting findings of previous literature, we think it necessary to test empirically the relations between the number of inventors and patent value with alternative models. Large research team size (that is, large number of inventors) may lead to more patents and larger sums of patent values, but the value per patent does not necessarily increase as the number of inventors increases. [
25], using European inventors survey data, estimated the economic value of patent portfolios (defined as groups of technically or economically highly related patents). They found that investments in individual patents showed diminishing returns and a meaningful part of a patent portfolio depended on added new patents. We test two variants of the model, one considering only linear effect and the other including also non-linear effect. For the latter variant, in addition to the number of inventors (INV), we included the squared number of inventors (INV2) as a regressor. We calculate this indicator from the PATSTAT Biblio database provided by the EPO.
2.2.6. Forward Citations
The number of citations received from patents applied later is the only ex post indicator considered in our research. Since the work of [
26], forward citations have been studied as possible correlates of several different measures of values such as social values [
26,
27], private values of patents [
4,
9,
12,
28], and market values of firms [
29]. Some researchers, however, consider forward citations as good measures of ex post technological impacts, because the relationship between patent values and forward citations is noisy [
13].
From the renewal modelling perspective, we are interested in size and characteristics of the possible learning effects which forward citations make on patent owners’ estimation of patent values. The deterministic renewal models originated from [
5] assume that patent owners know initial returns from random draws at the earliest time [
3]. It is hard to reconcile this assumption with apparent persistence of patents with values below renewal fees. [
8,
15] developed sophisticated stochastic renewal models with option value of learning. Both studies, however, show that most learning is over at early age of protection, five years [
15] and four to seven years [
8], respectively. We try to examine the evolution of learning by calculating marginal effects of forward citations. We test two measures of forward citations, the number of forward citations until year t (ACCFWDCIT, “accumulated citations”) and the number of forward citations between year t-1 and year t (INCFWDCIT, “incremental citations”). We calculate forward citations from the PATSTAT Biblio database provided by the EPO.
2.2.7. Renewal Fee
Renewal fee is also useful indicator of patent value [
30]. The variable used herein is the logarithm of the renewal fee at age
a in year
t log(RFEE). Renewal rates change in the EPO every two years and these changes should be taken into account. Under the European Patent Convention (EPC) system, a patentee is required to pay renewal fees to the EPO from the third year of application filing until the patent is granted. Once the patent is granted, the obligation to pay renewal fees to the EPO terminates, and the patentee is required to pay renewal fees to the national patent offices in the countries in which the patent is granted. We assume that each patent owner pays renewal fees to the EPO and one national state at the EPO rates until the longest year when the patent is renewed (see next section for our definition of the renewal status of a patent). Renewal fee rates differ by countries and renewal fees are a small portion of total costs of patent validation and maintenance [
31]. Our measure of renewal fee has a risk of under-estimation of patent values, but it is a common risk of renewal type models.
2.2.8. Patent Age
The patent age a (AGE) is a number between 3 and 20 calculated from the patent application filing date with the EPO. We count it starting from 3, because renewal decision is made between third and twentieth year under the EPC system. The introduction of this variable to the model allows capturing the annual decay rate.
2.2.9. Application Filing Year
The application filing year (FYEAR) is a number from 1 to 14 that tells in which year the application of the focal patent was filed. Since the data used in our research contain European patents applied between year 1996 and year 2009, FYEAR = 1 represents year 1996 and FYEAR = 14 represents year 2009. The coefficient of this variable measures the growth rate of average patent value applied each year. [
4] provides estimates suggesting that patent value of the United States increased modestly during the mid-1980s and then levelled off. [
32] discusses whether patent quality decreased during the mid-1980s and the early 1990s.
3. Data
We use two data sources provided by the EPO: the PATSTAT Biblio database and the PATSTAT Legal Status database. The group of PATSTAT databases called the “backbone data set for the statistical analysis” is an expert solution with a complex structure that allows querying highly detailed patent-related data using the structured query language (SQL).
The core list of focal patents was gathered from the PATSTAT Biblio database (PATSTAT—2016 Autumn Edition) by applying the following conditions: the patent application is related to an existing granted publication, the type of intellectual property right matches the patent of invention, the patent authority where the application was filed is EP, and the publication was published before year 2010. Additionally, a condition was set to bind the International Patent Classification (IPC) codes of patents to match the Pharmaceutical technology field using the [
33] commissioned by the World Intellectual Property Organisation (WIPO). The query resulted in the list of 71,534 patents.
For each patent from the above set of patents by means of querying PATSTAT Biblio database, we collected family size, number of inventors, patent backward citations, non-patent backward citations, number of claims, and forward citations.
Collection of the patent renewal statuses at age a and the application filing year required querying both PATSTAT Biblio database and the PATSTAT Legal Status database (PATSTAT—2016 Autumn Edition). PATSTAT databases do not store the renewal information of the European patent in the unified form, storing the renewal information separately for all member countries instead. Thus, in order to collect the set of renewal decisions of a patent, we looked for the oldest age reached by a renewed patent (a number between 3 and 20) in any of the member countries and based on that we constructed the vector of renewal decisions (with positive decisions spanning from year three to the oldest age reached, and negative decisions spanning after it until year 2015). The year 2015 was chosen as the upper boundary since the edition of PATSTAT database we worked on was released in autumn 2016 and it does not contain full data for year 2016. The application filing year was calculated as a latest renewal date year reduced by the patent age reached at that time. Using the last renewal fee payment date as a basis for calculating the application filing year is burdened with a certain risk. In case the last renewal fee payment was belated it can mistakenly add one year to the application filing year. Additionally, belated payment inflates the renewal fee by 50% which is not taken into consideration in our data set.
Above information is necessary in order to make proposed model to work and capture the accumulative, continuous nature of the ex post indicators which is perhaps the strongest virtue of our model.
Since numerous patents from the original set were never renewed, their renewal decisions were represented with vectors of zeroes. However, keeping such patents in the data set brought a noise so significant it would affect signs of selected coefficients, which forced us to eliminate all the never renewed patents and further narrow down the data set bringing the stability to the model.
The model presented in the previous section requires knowing the yearly renewal fees dictated by the EPO. The renewal fees increase progressively whilst the patent get older and they are also changed every even year in April by the EPO. The renewal fees information is provided by the EPO starting from the April 1999, which forced us to further narrow down the data set and select patents granted between year 1996 and 2009. Each of the patents published in 1996 would have a vector of 17 renewal decisions (from age 3 to age 19). The vector would gradually decrease its size to 4 renewal decisions for patents granted in 2009 (from age 3 to age 6).
After applying all the above conditions, we obtained a final set of 34,106 patents. The data was transformed from the panel to the pooled representation with respect to renewal decisions resulting in a total number of 433,595 observations. Yearly patent counts for the set are available in
Appendix.
4. Empirical Results
4.1. Descriptive Statistics
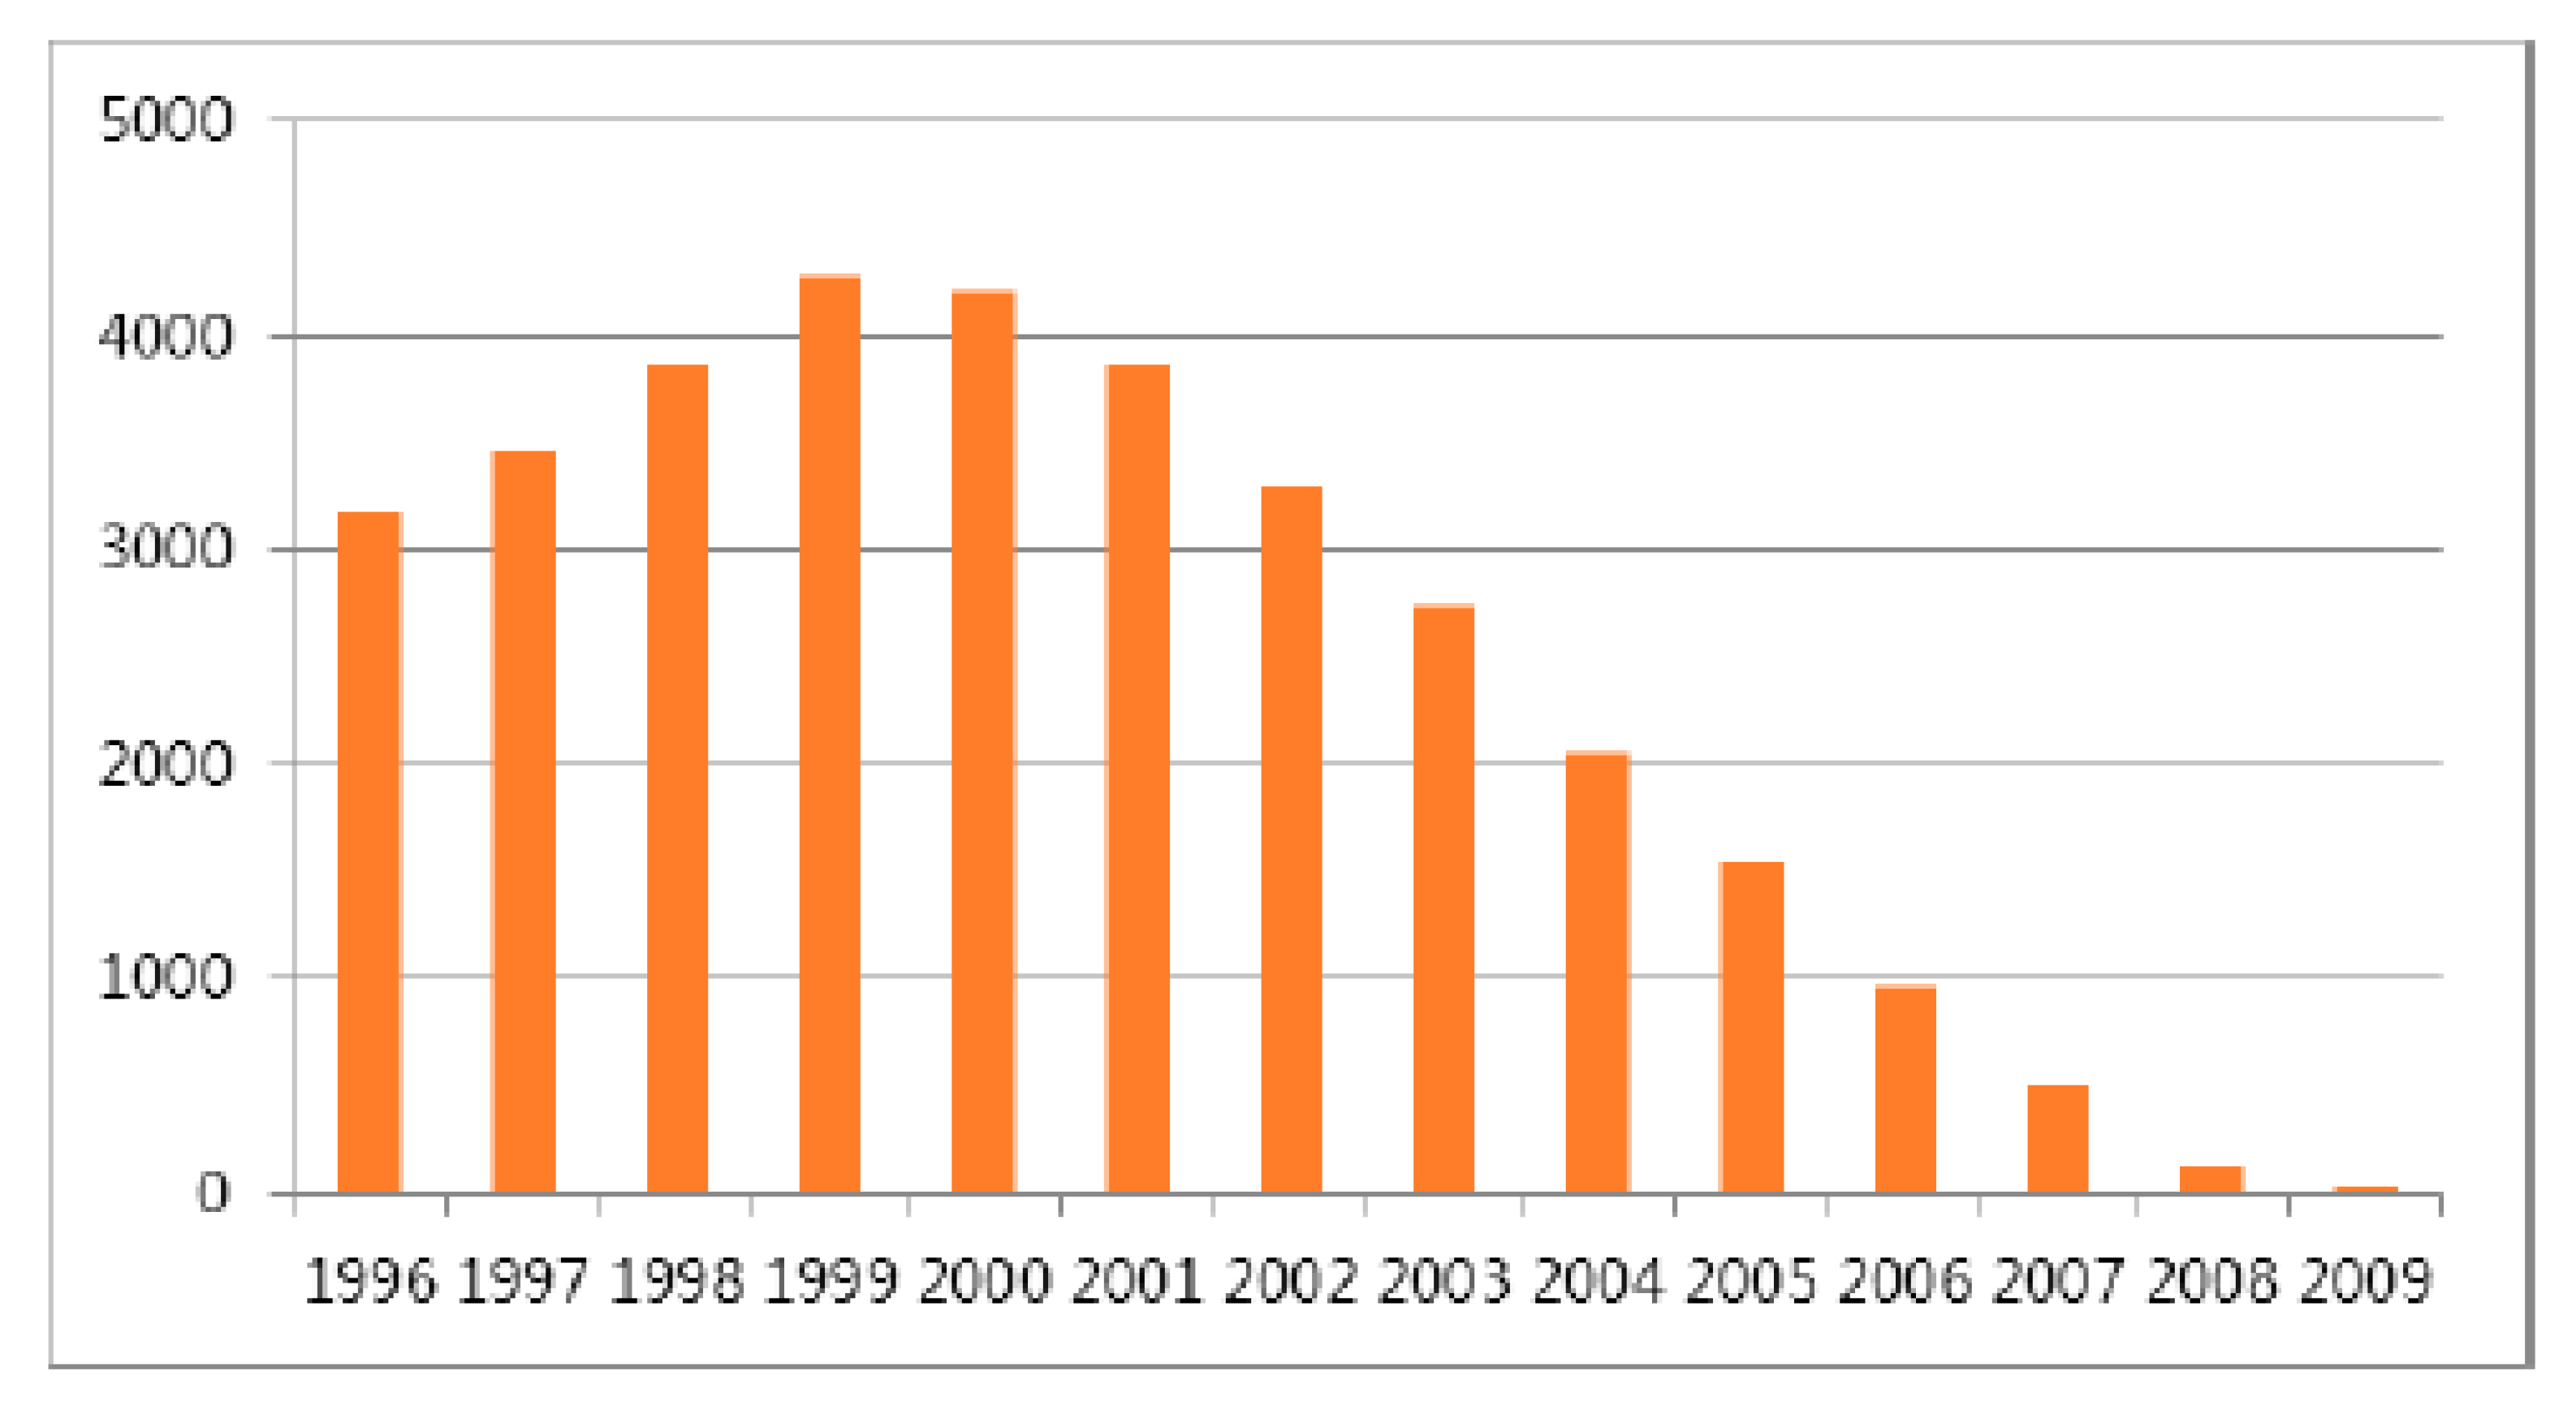
Figure 1 reports the number of patents by application year, i.e., the size of same year cohort, between year 1996 and 2009 in the data set of 34,106 patents. The cohort size increases until the year 1999 and decreases rapidly after the new millennium. It is, however, premature to conclude from this figure that patenting productivity of the pharmaceutical technology field has fallen since the beginning of the new millennium, because the data set contain only granted patents and many patents applied in recent years are still waiting for the validation. Patents applied in early years are far more represented in the data than those applied in recent years, thus the proportion of patents applied during the first five years is larger than that of patents applied in the last five years, 55.7% and 9.2% respectively. Since records on renewal status of a patent increase as it is older, the proportion of patents applied during the first five years in the total observations (sample size = 433, 595) is much larger than that of patents applied in the last five years, 65.1% and 5.2% respectively (see
Appendix for the number of applications and observations by year cohorts).
Table 1 reports descriptive statistics of independent variables. The mean value of family size (FAM) is relatively high (17.16). That could indicate a trend in the pharmaceuticals technology field towards wide protection in geographic sense.
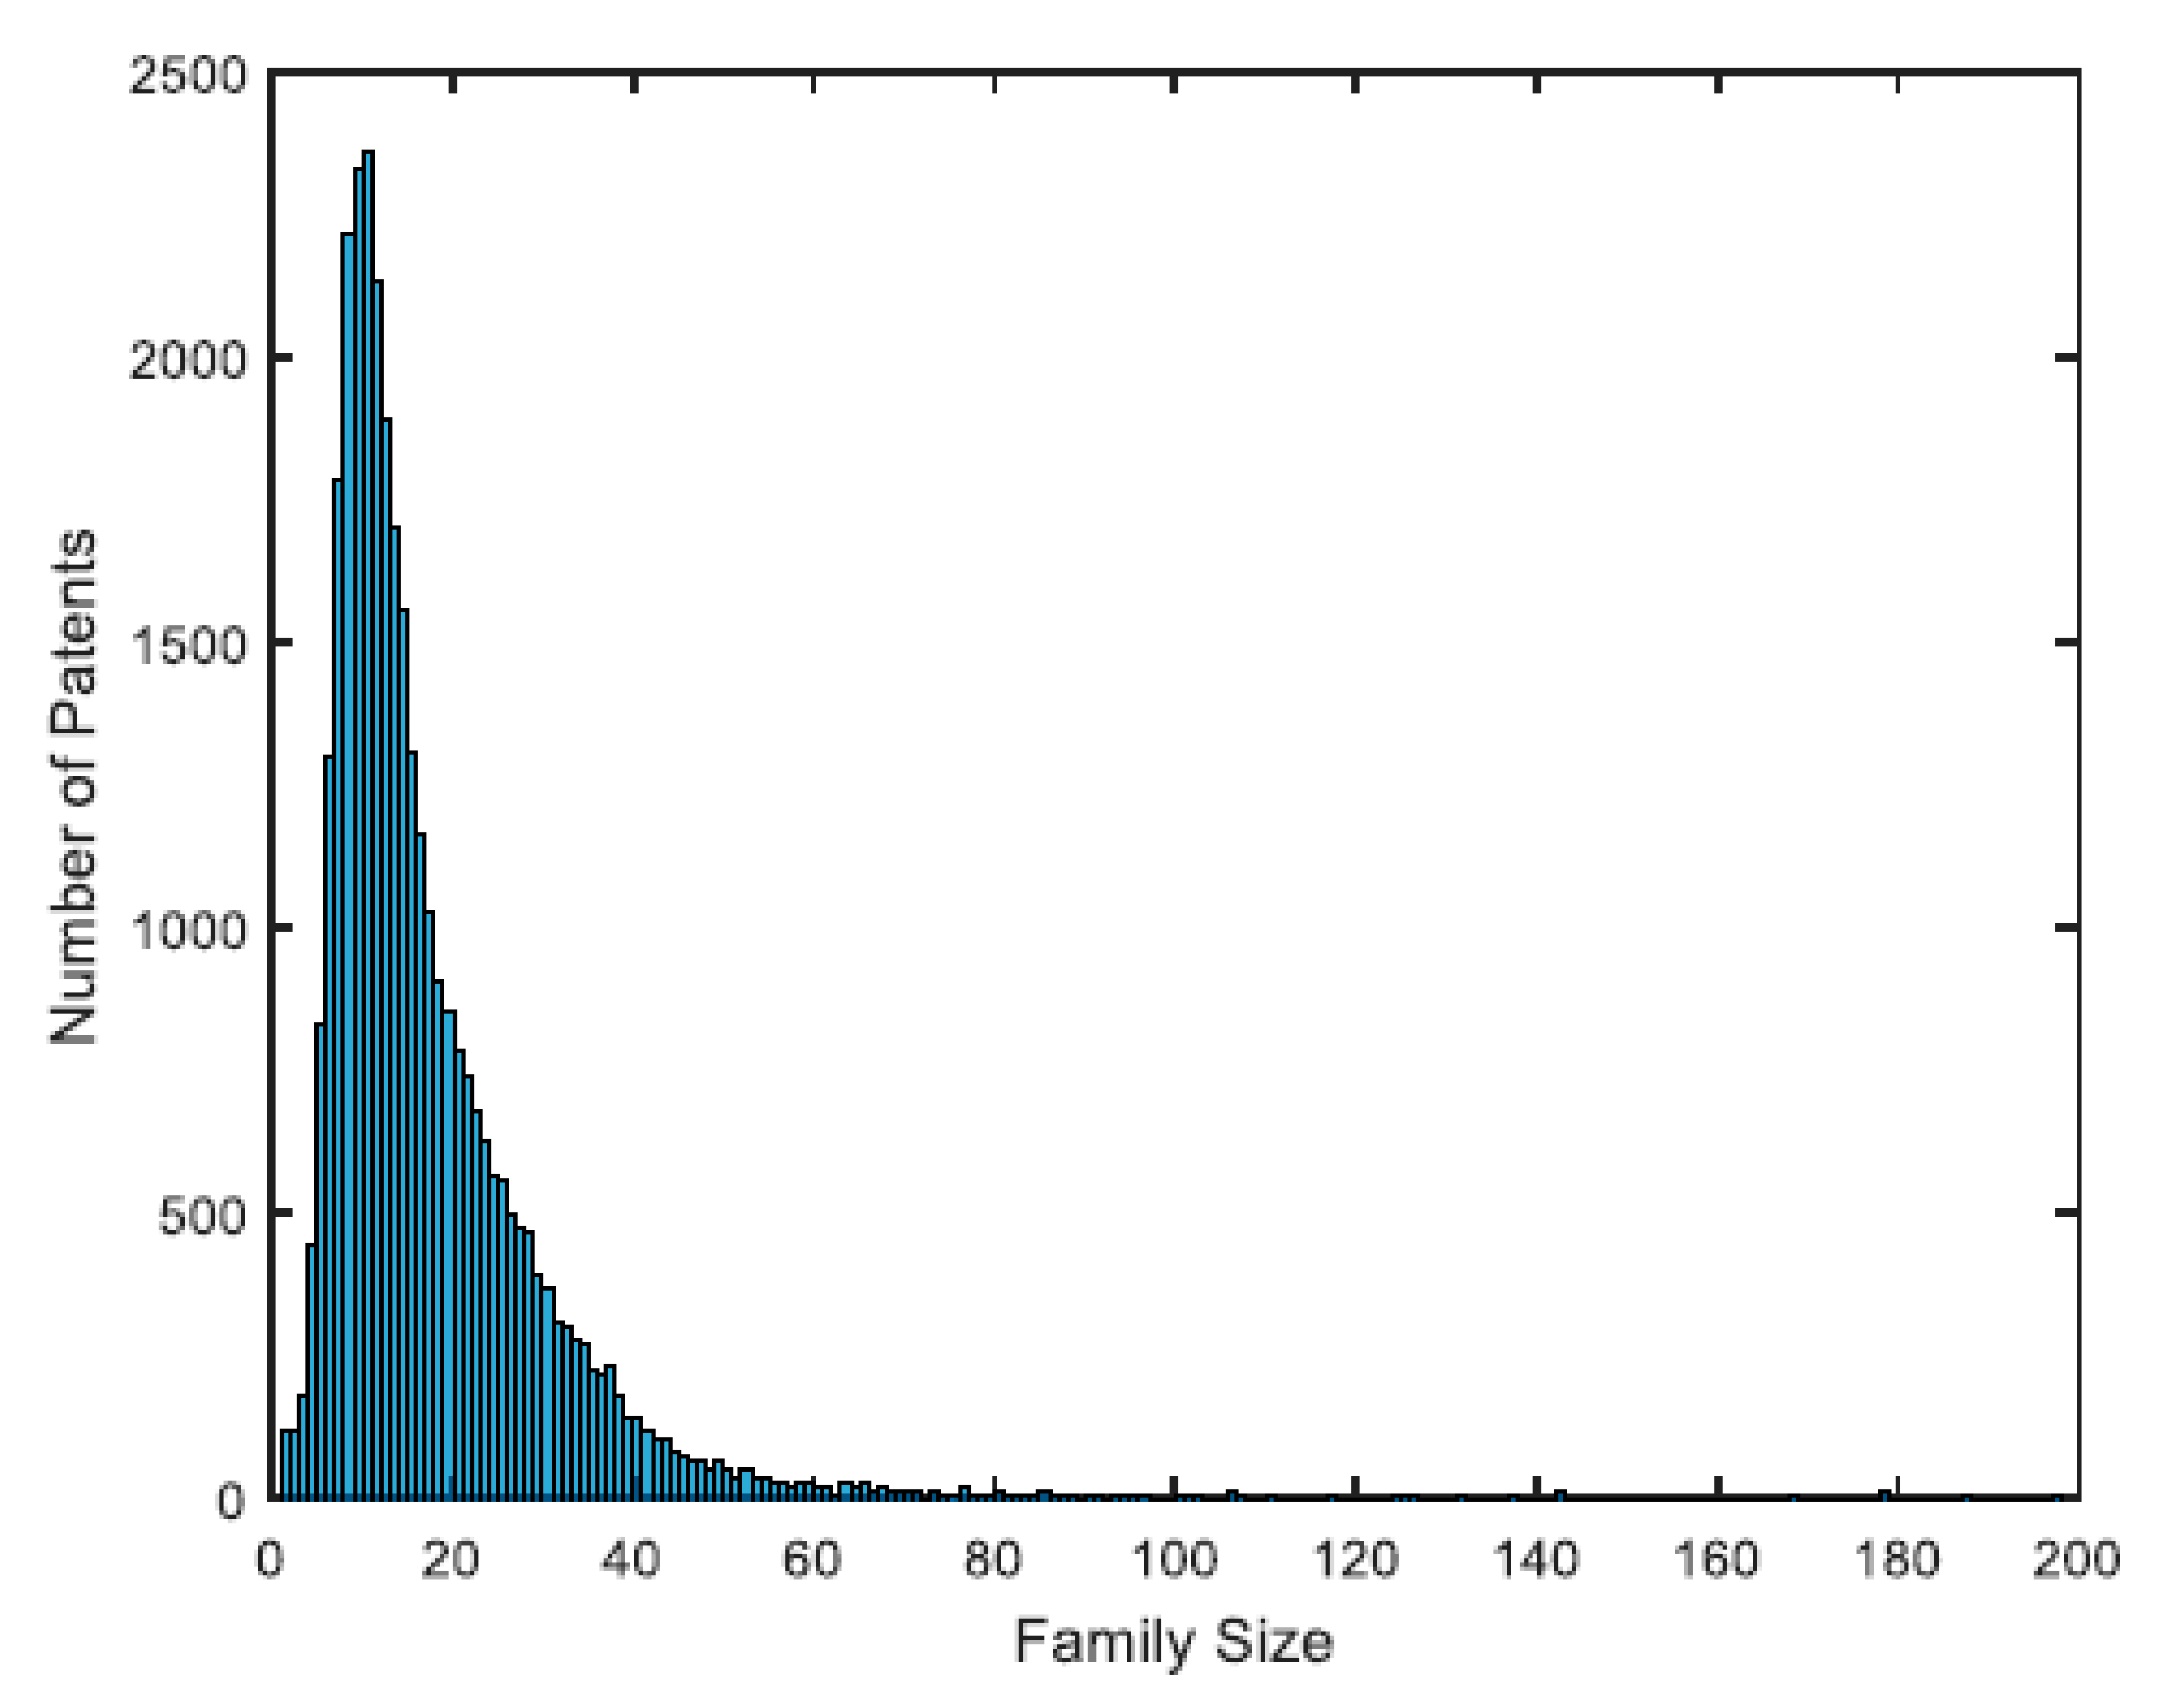
Figure 2 is the histogram of family size for patents in the data set (34,106 items). Family size of patents has a skewed distribution similar to that of patent value reported by the previous literature. The number of inventors (INV) ranged from 1 to 33 with the mean value of 3.66. The mean values of patent backward citations (PBKWCIT) and non-patent backward citations (NPBKWCIT) are rather low with 0.11 and 0.21 respectively. It is probably related to the fact that the EPO does not force applicants to enclose the list of related prior art. The number of claims (CLAIMS) ranged from 1 to 247 with the mean value of 16.64. We use two measures of the number forward citations, accumulated citations (ACCFWDCIT) and incremental citations (INCFWDCIT). The mean values of the accumulated citations and incremental citations are very row with 0.07, 0.02 respectively. Compared with other independent variables, citation related variables have very dispersed distributions, with standard deviations 5–9 times mean values, and forward citations are most dispersed. The logarithms of renewal fees increase with age and year, with the minimum 5.94 (380 euro) and the maximum 7.35 (1560 euro).
4.2. Regression Results
We considered two classes of models presented in
Section 2. The first class of models of which results are shown in
Table 2, relied on accumulation citations as the
ex post indicator, while the second class of models shown in
Table 3 were estimated on incremental citations. Each class has four variants, depending on whether the application filing year (FYEAR) control variable is used or not, and whether non-linear effect of the number of inventors is considered or not. Equations (1), (3), (5), and (7) include the application filing year variable, and Equations (3), (4), (7), and (8) include the squared number of inventors (INV
2) as a regressor. We included at the right most columns of each table the estimates of the marginal effects at the means with respect to the best model in the class (model 3 and model 7 respectively).
Calculations of model fit measures (McFadden R2, Loglikelihood) show that models including the application filing year variable are slightly better than models without the variable. The coefficient estimates and model fit values of models including non-linear effect of the number of inventors differ very small from those of models omitting non-linear effect. Furthermore, the coefficient estimates of the squared number of inventors are close to zero (0.001) for all models containing the variable. Estimates of all independent variables in each model are statistically significant. More details about results on each variable will be discussed below.
The estimates of coefficients of two variables, renewal fee (log (RFEE)) and age (AGE) have right signs as expected from the theoretical model in
Section 2. The point estimates of implied depreciation rates (
) are higher for models with application filing year variable included. For models with this control variable, the estimates are 0.107 (model 5, 7) and 0.11 (model 1, 3) respectively, while for models without the variable, the estimates are 0.056 (model 6, 8) and 0.057 (model 2, 4) respectively. Estimates of earliest deterministic renewal models were much higher, on the order of 0.25 [
5,
8]. Bessen’s estimates for regressions with patent characteristics were about 0.14 [
4]. Schankerman’s estimates on Pharmaceutical field, however, were lower, on the order of 0.05 [
7]. Our estimates are in the range of latter two studies.
The coefficient of application file year variable measures the rate at which the average patent value of a given year cohort increases with respect to that of the previous year cohort. Increases in the average patent value of a cohort may be due to inflations or improvement in average patent quality. The estimates are around −0.05, meaning that the average patent value of a cohort has decreased 5% a year since the mid-1990s. [
4] suggested that patent value of the U.S. levelled off after the mid-1980s. [
32] commented on researches suggesting that patent quality decreased during the mid-1980s and the early 1990s. [
8] gives a possible explanation for decreases in the average patent value of a cohort. They reviewed previous researches suggesting that there exists “the inverse correlation between quantity and quality across cohorts of patents” and proposed several reasons for this relationship [
8] (pp. 411–412).
Figure 1 shows that the number of granted patents of a cohort increased during 1996–1999. Although the number of granted patents of a cohort has decreased after the year 2000, observations from early years dominate the sample and may have a great influence on the estimates. Our results suggest that patent quality decrease has continued until the end of 1990s, at least in the pharmaceutical technology field.
5. Discussion
Empirical results show that three citation related indicators, family size, and the number of claims are positively associated with patent values, while the number of inventors is negatively correlated. Citation related indicators including backward citations, backward references to non-patent literature, and forward citations appear to be more important than other indicators. The number of claims turns out to be the least important indicator contrary to the extant research.
5.1. Patent Value Indicators
We used two measures of forward citations in estimating the regression models. The estimates of coefficients of other indicators varied little whether accumulated citations or incremental citations were used. Among six patent value indicators considered in our study, five indicators except the number of inventors are positively correlated with patent values. Of five indicators, three citation related indicators seem to be more important than family size or the number of claims. The number of claims turned out to be the least important indicator and family size was the second least important indicator. When accumulated citations were replaced with incremental citations as measure of forward citations, the estimate of coefficient more than tripled and forward citations became the most important indicator. When accumulated citations were used, however, backward citations turned out to the most important indicator and forward citations were on par with backward references to non-patent literature.
Table 4 shows the estimates of relevant indicators of three studies on patent value [
4,
9,
12]. Since these studies were based on different data and models, sizes of estimates cannot be directly comparable. Instead, we focus on the order of estimates. [
12] incorporated all five variables which are positively correlated with patent values as shown in our study. The ordering of their estimates is very similar to that of ours based on accumulated citations (
Table 2). Furthermore, their estimates on family size and the number of claims are not only very small but also statistically insignificant. Family size was as important as citation related indicators in [
9]. Except family size, their results on citation related indicators are comparable with ours, although backward references to non-patent literature were more important than backward citations in their regression on the drug and chemical field (for all sample, backward citations turned out to be more important). Our estimates of coefficient on family size are about 10% of coefficients on citations, whereas coefficient on family size of [
9] is on par with coefficients on citations. It seems that the differences between [
9] and our study are mainly due to characteristics of data used. In our sample, average family size is relatively high (17.16) and family size has concentrated, very skewed distribution (
Figure 2), whereas average counts of citations are very small and citations have very dispersed distributions (
Table 1). Relatively high scales and concentrated distribution of family size may contribute to lowering its marginal effect on renewal rate, thus its coefficient, compared with coefficients on citation measures. Results of [
4] seem to be very different from ours, even though he chose approaches similar to ours. In his study, backward citations were not only far less important than forward citations, even less important than the number of claims which is the least important indicator in our study. Backward citations were among the least important patent value indicators in his study. The differences between [
4] and our study with respect to estimates on the number of claims may reflect the differences in the traditions of the legal interpretation of the breath of a patent between the Europe and the Unites States. The definition of the breath (scope) of a patent has been developed around “doctrine of equivalents”. There have been two competing views on the doctrine. The “central definition” emphasizing the fundamental ideas contained in the patent text has prevailed in the Europe and Japan, while the “peripheral definition” focusing on the literal interpretation of patent claims has prevailed in the United States. Although [
12] using the U.S. patents reached different results from [
4] with respect to patent claims, they worked on the sample with rather small size.
Future research based on large samples including European, Japanese, and U. S. patents may reveal clues to the questions such as “is the number of claims as important as other indicators?” or “is the number of claims an important patent value indicator only in the United States?”.
Marginal effects at the means measure increases in probability of renewal with respect to one unit increase in an independent variable at the sample mean point of each variable. The ordering of marginal effects may differ from that of estimates of coefficients due to non-linear effects. For our models, however, marginal effects are in order as estimates of coefficients. Largest marginal effects are from citation related indicators. In models on accumulated citations (
Table 2), marginal effects of citation related indicators are on order of 1%, while in models on incremental citations (
Table 3), forward citations have largest marginal effect with 3.4%.
Estimates on the number of inventors need explanations. The number of inventors is negatively correlated with patent value. Although positive non-linear effects offset negative direct effects, these secondary effects are too small to fully countervail the direct effects. Larger R&D teams probably produce more patents, but results on the number of inventors imply that average quality of patents decreases as size of R&D teams increases. Our findings support [
23] and especially concur with [
25], though our data prevent us from directly confirming patent portfolio effects.
5.2. Learning Effects of Forward Citations
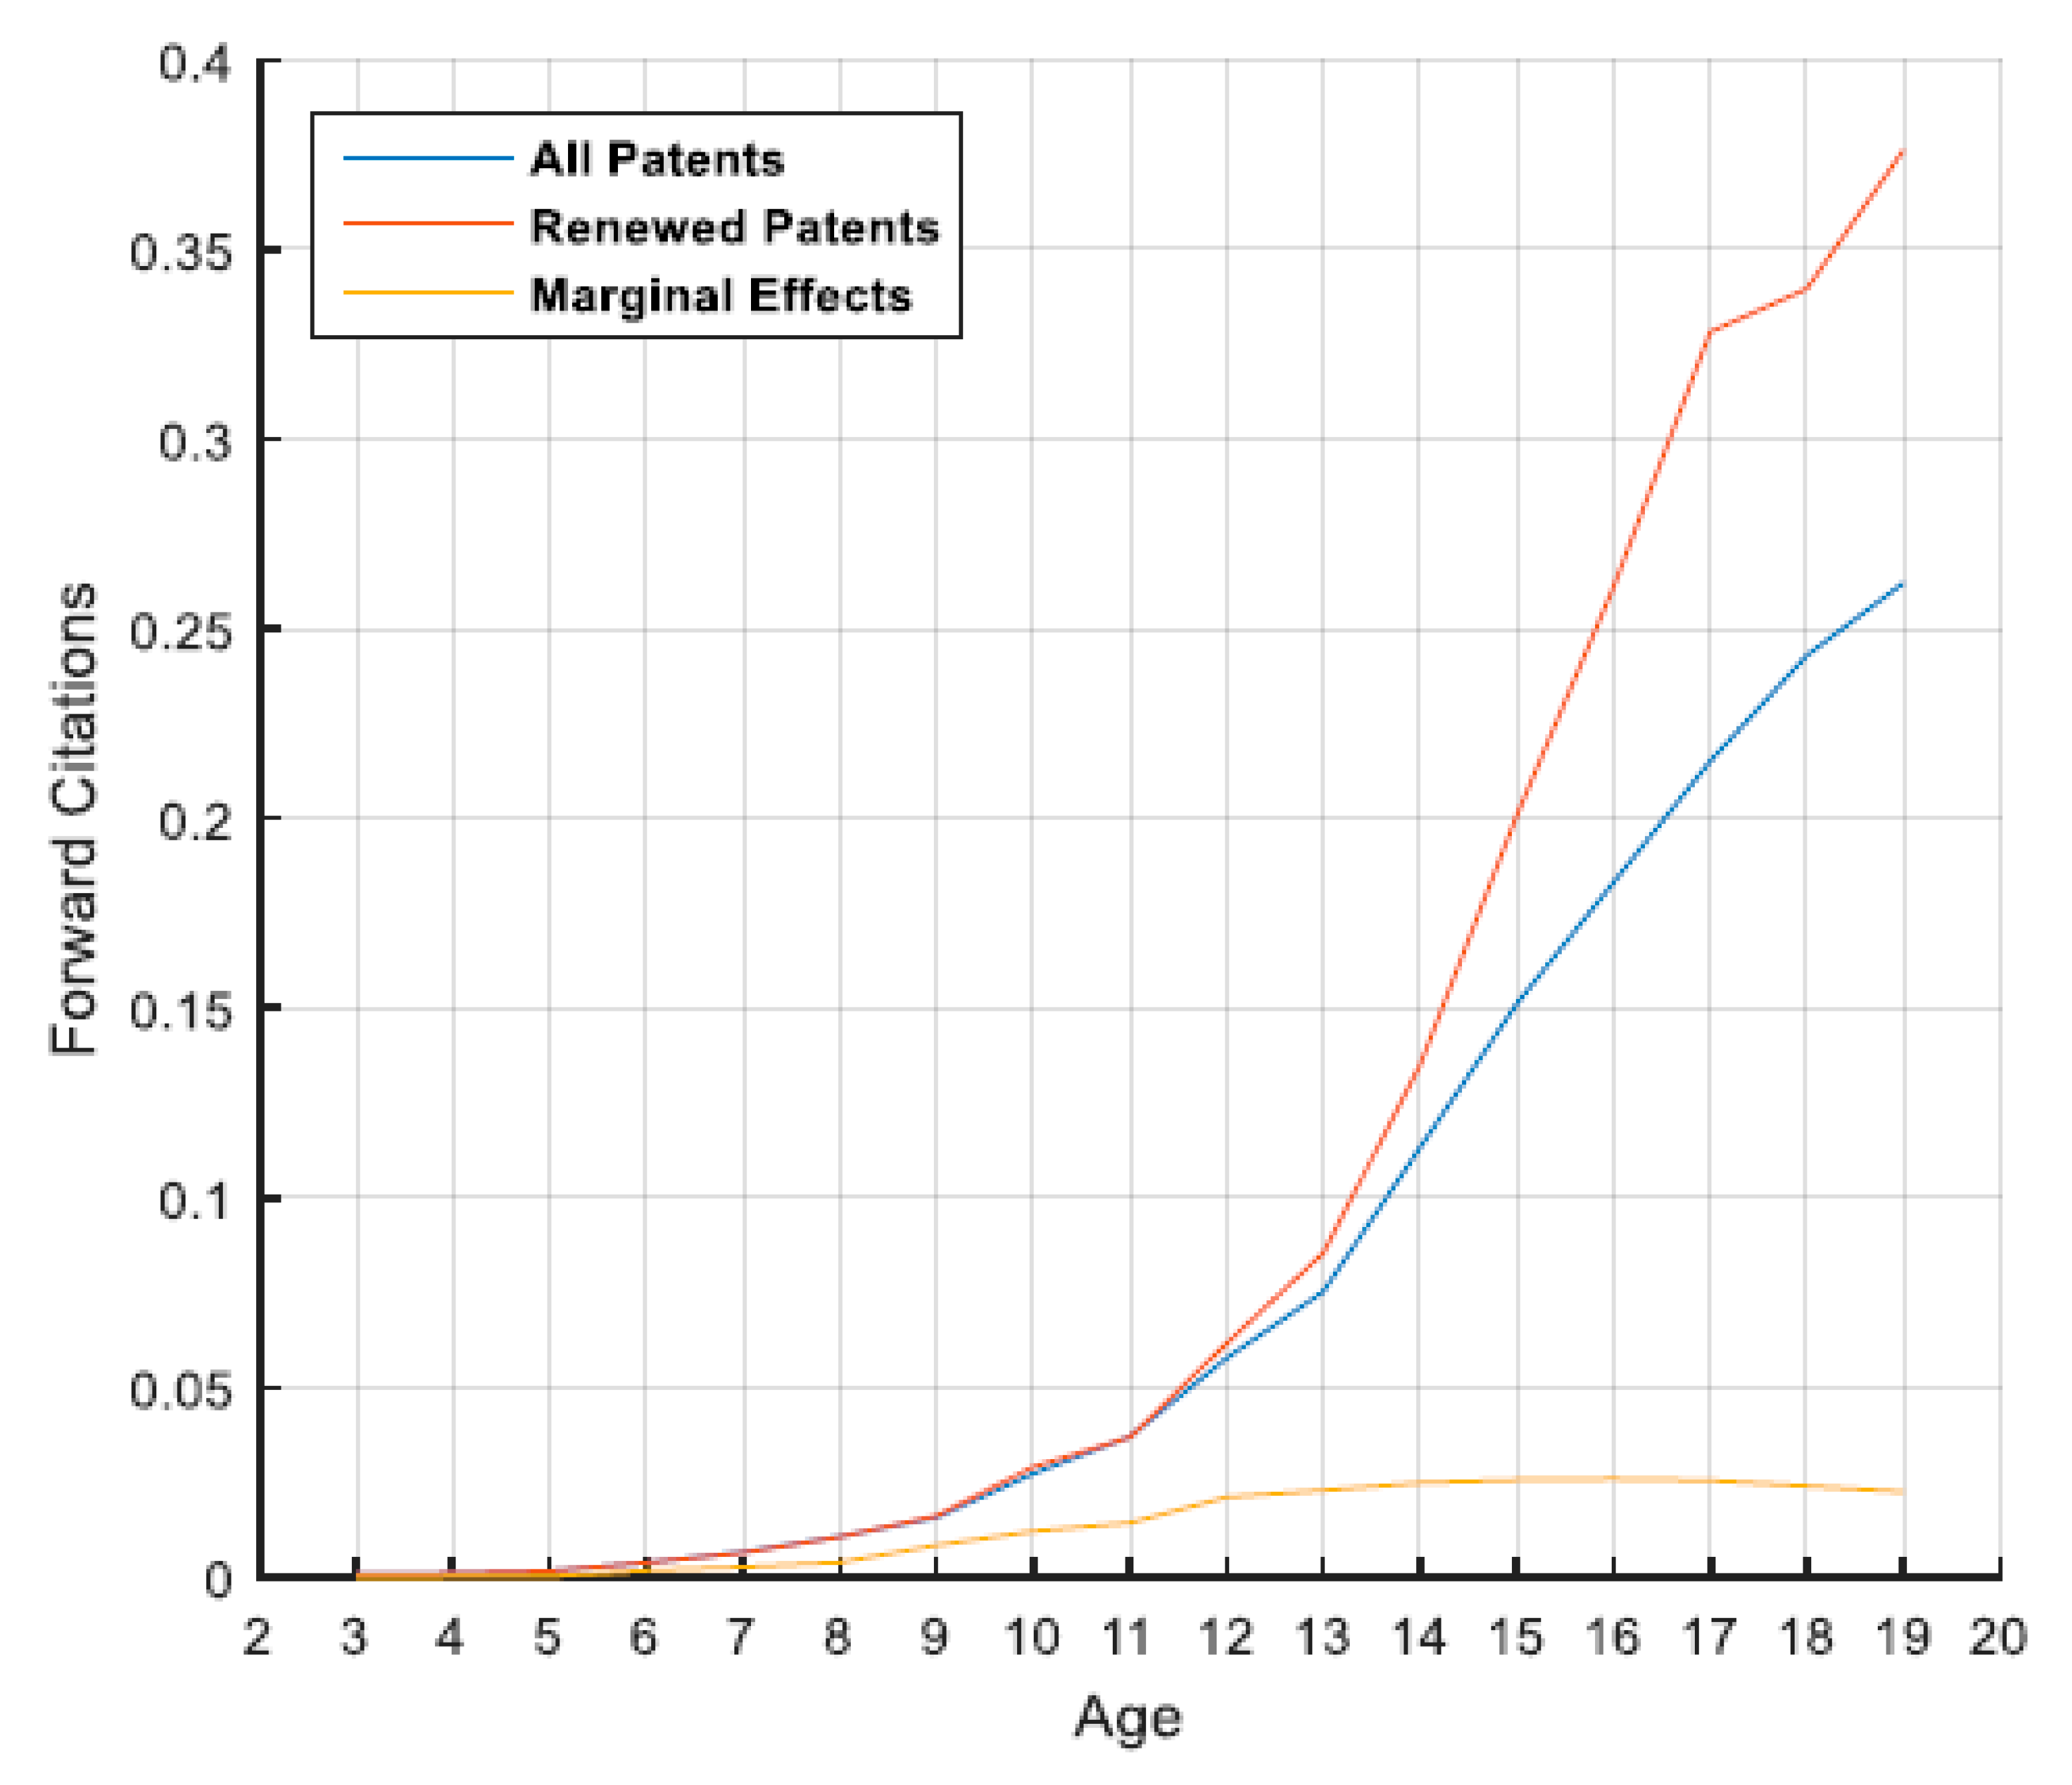
The number of forward citations is the only ex post indicator in our models which countervails the tendency of annual returns of a patent to fall, providing some information about the current patent value. To analyses dynamic effects of forward citations on the patent values, we calculated three kinds of age dependent indices on the oldest cohort of patents, i.e., patents applied in the 1996 (total 3190 patents). We first calculated the average number of forward citations per age for total patents. Secondly, we calculated the average number of forward citations per age for patents renewed until given age. Lastly, we calculated marginal effects at the means of forward citations for patents renewed until given age. We preformed calculations on both accumulated citations and incremental citations and calculated marginal effects on the best models (model 3 in
Table 2 and model 7 in
Table 3).
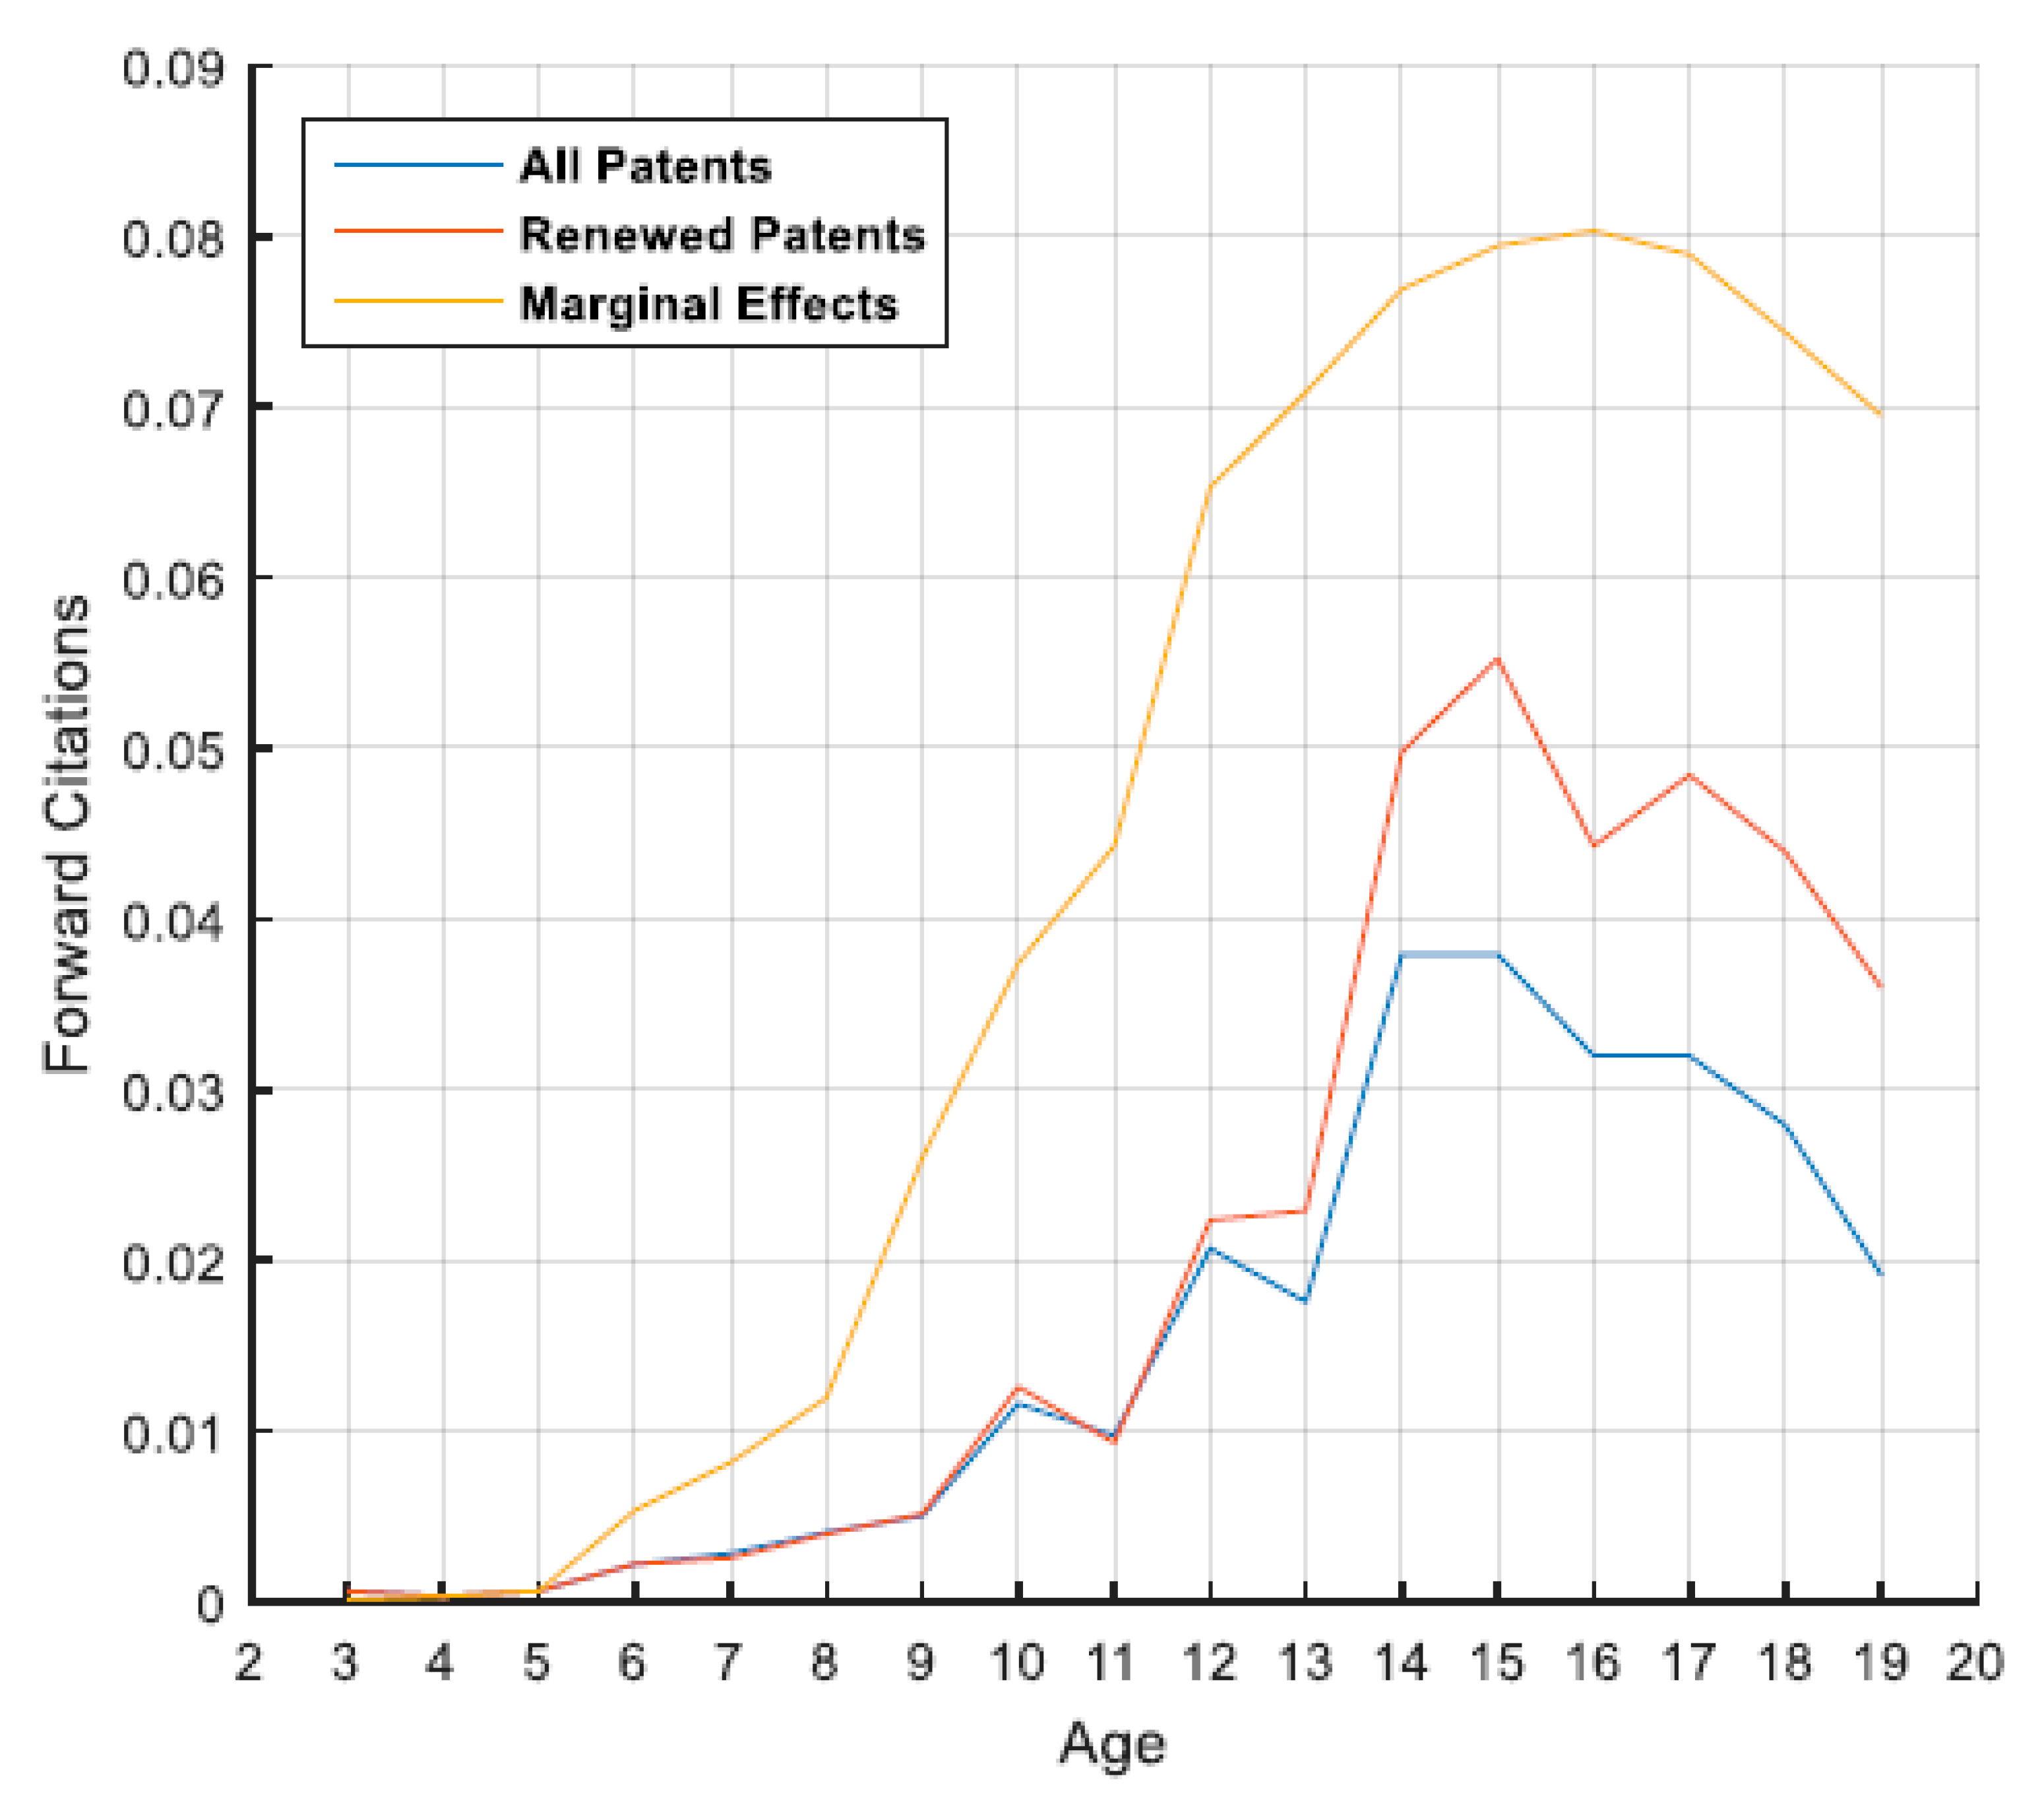
Figure 3 and
Figure 4 show the results of calculations for accumulated citations and incremental citations, respectively. For accumulated citations, both measures of average number of forward citations continue to increase and paces of growth do not slow down until later ages. Marginal effects continue to increase until 15–16 years and then level off (
Figure 3). Calculations on incremental citations show more dynamical results (
Figure 4). Two measures of the average number of forward citations fluctuate more than the counterparts of
Figure 3, but exhibit tendencies to increase until 14–15 years and then level down. Marginal effects continue to increase and reach the maximum (8%) at age 16 and level off thereafter.
The results of exercises on the 1996 cohort imply at least two points about researches on patent value indicators. First, forward citations may continue to increase until older ages of patents, thus the familiar conventions truncating records at first five years may lead to the missed information and false findings. Second, while learning effects of forward citations turn out to persist long years, these findings are in sharp contrast with those of previous researches implying that learning effects end within first seven years [
15,
18]. More researches are needed to explain or reconcile discrepancies between earlier results and our findings.
6. Conclusions
The development of information technology in the last two decades has enabled researchers to access and use large amounts of data that were unavailable in the past. We used the renewal data of European patents in the pharmaceutical technology field open to researchers to test ex ante and ex post patent value indicators. To distinguish the effects of the only ex post indicator in our study, i.e., forward citations, from those of ex ante indicators, we constructed a data set consisting of 433,595 observations from 34,106 granted patents applied to the EPO during the 1996–2009 period. The main findings of our study are as follows:
Of six patent value indicators, five indicators (three citation related indicators, family size, and the number of claims) are found to be positively correlated with patent values, while the number of inventors are negatively correlated.
Citation related indicators (backward citations, backward references to non-patent literature, and forward citations) are more important than other indicators. In particular, the number of claims turns out to be the least important indicator. When accumulated citations are used as measures of forward citations, three citation related indicators are on par in importance, though backward citations are slightly more important that other two indicators. If incremental citations are used, however, forward citations are found to be far more important than two backward reference indicators.
Forward citations seem to have persistent learning effects on patent values. Marginal effects at the means of forward citations increase until age 16 and level off thereafter.
We believe that the results are encouraging, thus provide new research opportunities and patent policy implications. For example, renewal data based researches may reveal differences in patent policies on country or regional level. Time series data of ex post indicators such as forward citations can be effectively used by researchers who want to delve into learning dynamics of patenting systems. We propose three possible directions to extend our study.
First, on technical level, there are several ways to extend or improve our models.
We tested individual observable indicators. Many patent characteristics of interest, such as breath (scope), novelty, inventive step (non-obviousness), etc. are latent, i.e., not observable [
10], and researchers have estimated several latent factors using factor analysis [
22]. The structural equation modelling in which latent factors are incorporated into renewal type models seems to be highly promising.
The estimate on forward citations more than tripled when accumulated citations were replaced with incremental citations (
Table 3 and
Table 4). This large jump in the estimate is not surprising, because new information will have greater effects on patent values than old information. It would be valuable to try alternative measures incorporating depreciation rates used to estimate R&D stock or knowledge capital [
29,
34].
We considered only one ex post indicator, but there are other potential ex post indicators that were reported to have larger effects than forward citations such as the status of litigation [
4] or opposition [
9]. By adding new ex post indicators, researchers would reach a deeper understanding about learning dynamics. For example, they may find some hints to the question that there are large discrepancies in learning periods between past researches (4–7 years) and ours (16 years).
Lastly, our models can be extended to pre-grant stages to deal with opposition issues (the European countries) or decisions on examination application (some countries including Japan and South Korea).
Second, one of the unexpected findings in this study is that similar approaches may lead to quite different results, while different approaches may lead to comparable results. It seems that analytic methods are less important than the objects of analysis—the data. Relatively easy implementations of renewal type models enable researchers to focus on the substance of data. We used the European patent data in the pharmaceutical technology field. Analysis can be easily extended to several technology fields to compare the effects of patent value indicators between technology fields, and to find out field specific patterns of learning dynamics. We believe that the construction of the database comprising European, Japanese, and the U. S. patents will provide researchers many opportunities. For example, researchers may find key indicators that reveal differences in patent policies on country or regional level and provide new policy insights.
Finally, it is usually the case that the value of a patent portfolio as a whole is larger than sums of individual values of constituent patents. The value of a patent may depend on size of the patent portfolio to which it belongs or its position in the portfolio [
10]. Researchers may incorporate owner level variables such as size of the portfolio into renewal type models and analyse the effects of portfolio on the value of a patent. This would be a valuable contribution.
Author Contributions
Conceptualization, J.Y.O.; methodology, J.Y.O.; software, K.P., R.P., validation, E.J., R.P.; formal analysis, K.P.; investigation, K.P.; data curation, K.P., J.Y.O.; writing—original draft preparation, K.P., J.Y.O.; writing—review and editing, B.-K.K.; visualization, K.P.; supervision, B.-K.K.; project administration, E.J.; funding acquisition, B.-K.K. All authors have read and agree to the published version of the manuscript.
Funding
This work was supported by the National Research Foundation of Korea Grant funded by the Korean Government (NRF-2019S1A5C2A02082342).
Conflicts of Interest
The authors declare no conflict of interest.
Appendix A
Table A1.
Annual counts of patents in analysed data set with pooled equivalents.
Table A1.
Annual counts of patents in analysed data set with pooled equivalents.
| Year | Number of Patents | Number of Renewal Decisions per Patent | Number of Observations in Pooled Representation |
|---|
| 1996 | 3190 | 17 | 54,230 |
| 1997 | 3456 | 16 | 55,296 |
| 1998 | 3866 | 15 | 57,990 |
| 1999 | 4275 | 14 | 59,850 |
| 2000 | 4214 | 13 | 54,782 |
| 2001 | 3873 | 12 | 46,476 |
| 2002 | 3310 | 11 | 36,410 |
| 2003 | 2736 | 10 | 27,360 |
| 2004 | 2061 | 9 | 18,549 |
| 2005 | 1539 | 8 | 12,312 |
| 2006 | 964 | 7 | 6748 |
| 2007 | 495 | 6 | 2970 |
| 2008 | 114 | 5 | 570 |
| 2009 | 13 | 4 | 52 |
| Total | 34,106 | | 433,595 |
References
- Smith, G.; Parr, R. Intellectual Property—Valuation, Exploitation, and Infringement Damages; John Wiley & Sons, Inc.: Hoboken, NJ, USA, 2005. [Google Scholar]
- Scotchmer, S. Innovation and Incentives; MIT Press: Cambridge, MA, USA, 2004. [Google Scholar]
- Putnam, J. The value of international patent rights. 1996. Available online: http://www.competitiondynamics.com/wp-content/uploads/International-Patent-Rights.pdf (accessed on 12 February 2020).
- Bessen, J. The value of US patents by owner and patent characteristics. Res. Policy 2008, 37, 932–945. [Google Scholar] [CrossRef]
- Pakes, A.; Schankerman, M. The Rate of Obsolescence of Patents, Research Gestation Lags, and the Private Rate of Return to Research Resources. In R&D, Patents, and Productivity; Griliches, Z., Ed.; University of Chicago Press: Chicago, IL, USA, 1984. [Google Scholar]
- Schankerman, M.; Pakes, A. Estimates of the value of patent rights in European countries during the post-1950 period. Econ. J. 1986, 96, 1052–1076. [Google Scholar] [CrossRef]
- Schankerman, M. How valuable is patent protection? Estimates by technology field. RAND J. Econ. 1998, 29, 77–107. [Google Scholar] [CrossRef]
- Lanjouw, J.; Pakes, A.; Putnam, J. How to count patents and value intellectual property: The uses of patent renewal and application data. J. Ind. Econ. 1998, 46, 405–433. [Google Scholar] [CrossRef]
- Harhoff, D.; Scherer, F.; Vopel, K. Citations, family size, opposition and the value of patent rights. Res. Policy 2003, 32, 1343–1363. [Google Scholar] [CrossRef]
- Reitzig, M. What determines patent value? Insights from the semiconductor industry. Res. Policy 2003, 32, 13–26. [Google Scholar] [CrossRef]
- Gambardella, A.; Harhoff, D.; Verspagen, B. The value of European patents. Eur. Manag. Rev. 2008, 5, 69–84. [Google Scholar] [CrossRef]
- Fischer, T.; Leidinger, J. Testing patent value indicators on directly observed patent value—An empirical analysis of Ocean Tomo patent auctions. Res. Policy 2014, 43, 519–529. [Google Scholar] [CrossRef]
- Verhoeven, D.; Bakker, J.; Veugelers, R. Measuring technological novelty with patent-based indicators. Res. Policy 2016, 45, 707–723. [Google Scholar] [CrossRef]
- Higham, K.W.; Governale, M.; Jaffe, A.B.; Zulike, U. Ex-ante measure of patent quality reveals intrinsic fitness for citation-network growth. Phys. Rev. 2019. [Google Scholar] [CrossRef]
- Pakes, A. Patents as options: Some estimates of the value of holding European patent stocks. Econometrica 1986, 54, 755–784. [Google Scholar] [CrossRef]
- Lanjouw, J. Patent protection in the shadow of infringement: Simulation estmations of patent value. Rev. Econ. Stud. 1998, 65, 671–710. [Google Scholar] [CrossRef]
- Jaffe, A.; De Rassenfosse, G. Patent citation data in social science research: Overview and best practices. J. Assoc. Inf. Sci. Technol. 2017, 68, 1360–1374. [Google Scholar] [CrossRef]
- Lanjouw, J.; Schankerman, M. Patent quality and research productivity: Measuring innovation with multiple indicators. Econ. J. 2004, 114, 441–465. [Google Scholar] [CrossRef]
- Squicciarini, M.; Dernis, H.; Criscuolo, C. Measuring Patent Quality: Indicators of Technological and Economic Value; OECD Publishing: Paris, France, 2013. [Google Scholar]
- Yun, J.J.; Jeong, E.S.; Lee, C.H.; Park, J.S.; Zhao, X. Effect of distance on open innovation: Differences among institutions according to patent citation and reference. Sustainability 2017, 9, 1478. [Google Scholar] [CrossRef]
- Nagaoka, S. Assessing the R&D management of a firm in terms of speed and science linkage: Evidence from the US patents. J. Econ. Manag. Strategy 2007, 16, 129–156. [Google Scholar]
- Lanjouw, J.; Schankerman, M. Characteristics of patent litigation: A window on competition. RAND J. Econ. 2001, 32, 129–151. [Google Scholar] [CrossRef]
- Lee, Y.G.; Lee, J.D.; Song, Y.I.; Lee, S.J. An in-depth empirical analysis of patent citation counts using zero-inflated count data model: The case of KIST. Scientometrics 2007, 70, 27–39. [Google Scholar] [CrossRef]
- Tahmooresnejad, L.; Beaudry, C. Capturing the economic value of triadic patents. Scientometrics 2019, 118, 127–157. [Google Scholar] [CrossRef]
- Gambardella, A.; Harhoff, D.; Verspagen, B. The economic value of patent portfolios. J. Econ. Manag. Strategy 2017, 26, 735–756. [Google Scholar] [CrossRef]
- Trajtenberg, M. A penny for your quotes: Patent citations and the value of innovations. RAND J. Econ. 1990, 21, 172–187. [Google Scholar] [CrossRef]
- Jaffe, A.; Trajtenberg, M.; Henderson, R. Geographic localization of knowledge spillovers as evidenced by patent citations. Q. J. Econ. 1993, 108, 577–598. [Google Scholar] [CrossRef]
- Harhoff, D.; Narin, F.; Scherer, F.; Vopel, K. Citation frequency and the value of patented innovation. Rev. Econ. Stat. 1999, 81, 511–515. [Google Scholar] [CrossRef]
- Hall, B.; Jaffe, A.; Trajtenberg, M. Market value and patent citations. RAND J. Econ. 2005, 3, 16–38. [Google Scholar]
- De Rassenfosse, G.; Jaffe, A.B. Are patent fees effective at weeding out low-quality patents? J. Econ. Manag. Strategy 2018, 27, 134–148. [Google Scholar] [CrossRef]
- Harhoff, D.; Hoisl, K.; Reichl, B.; de la Potterie, B.P. Patent validation at the country level—The role of fees and translation costs. Res. Policy 2009, 38, 1423–1437. [Google Scholar] [CrossRef]
- Van Zeebroeck, N. The puzzle of patent value indicators. Econ. Innov. New Technol. 2011, 20, 33–62. [Google Scholar] [CrossRef]
- Schmoch, U. Concept of a Technology Classification for Country Comparisons. Final report to the World Intellectual Property Organisation (WIPO). 2008. Available online: https://docplayer.net/7371089-Concept-of-a-technology-classification-for-country.html (accessed on 12 February 2020).
- Jaffe, A. Technological opportunity and spillovers of R&D: Evidence from firm’s patent, profit, and market value. Am. Econ. Rev. 1986, 76, 984–1001. [Google Scholar]
© 2020 by the authors. Licensee MDPI, Basel, Switzerland. This article is an open access article distributed under the terms and conditions of the Creative Commons Attribution (CC BY) license (http://creativecommons.org/licenses/by/4.0/).


