Abstract
Purpose: The advancement of technologies and their adoption affects the socio-economic growth of nations. This research is focused on how this innovation adoption path is linked to economic growth of nations since the previous IT revolution has been combined with existing industries and adding values in terms of applying intelligence through adopting digital technologies. Approach/Design/Methodology: There are two different approaches—process approach and factor approach—in innovation adoption research. Innovation diffusion research, which is one of the process approaches, is related to adoption, diffusion, and impact theories, but there are limitations in explaining the perspective of a nation other than individual and organization on the basis of previous literatures. Therefore, we build the integrative model to verify innovative growth path of nations by applying Diffusion of Innovation Theory (DoI) and Technology (T)-Organization (O)-Environment (E) framework, which can explain factors of affecting innovation. We evaluate eight hypotheses with data collected from 137 to 212 nations using international information index by credible organizations: World Economic Forum (WEF), World Bank, United Nations (UN), and International Communications Union (ITU), based on the integrative model we proposed. The path analysis using Structural Equation Modeling (SEM) is performed, and the result shows that the path from technological innovation capabilities (T), human capital (O), and environment (E) is related directly to economic impact, except for the path from human capital to value chain breadth directly and indirectly. The indirect path through Information and Communication Technology (ICT) access, use, and value chain helps to understand the full impact of digital innovation. Practical implications: By verifying this relationship, we expect to give suggestions in policy perspective and in building strategy towards innovative growth of countries. Our results show that technological innovation capabilities take time to show impact in terms of economic growth than the other factors, which are human capital, and political and regulatory environment of country. The nurture of human capital directly affects to the economic growth of nations relative to other T and E factors. The political and regulatory environment support stable ICT usage, which gives impact to the economic growth of nations.
1. Introduction
The research regarding technological innovation is mostly focused on technological changes in the perspective of organization and society. Additionally, the approaches towards technological innovation phenomenon are mostly for analysis of usefulness. Most of the theories of innovation are dedicated to research focusing on computer usage of individuals, computing in business, and exchanging electronic data as digital format. These activities are all potentially enabled according to the advancement of Information and Communication Technologies (ICTs). The rapid development of information and communication technologies makes organizations to actively expand their business globally in terms of production network. The development of Information and Technology, and digitalization [1] is at the center of this global production network. The advancement of ICT has improved national economies, social progress, and industrial development [2], which is why the phenomenon driven by ICT is called the Third Industrial Revolution. Based on the network connectivity, interactive organizations and information exchanging are all promising across the border; therefore, the adoption of digital technologies based on ICT is considered to be an important tool for socio-economic growth of country.
To analyze the links between digital innovation and economic growth of nations, we use two approaches: factor approach and innovation process approach [3]. First of all, we review stages of innovation, composed of discovery, adoption/diffusion, and impact, based on the diffusion of innovation (DoI) theory. The contexts explaining influential factors of innovation are derived by referring the Technology-Organization-Environment (TOE) framework theory. Grounded in these theories, we propose the model explaining stages of innovation with factors of innovation at pre-adoption stage. For the pro-adoption stage, after adoption of digital technologies, we apply economic performance index (GDP per capita) in the stage of impact.
Previous literature shows the integrative model of DoI and TOE theories to analyze the links between factors of technological innovation and economic growth in diverse level, individuals, organizations, and nations. This paper focuses more on life cycle of innovation, the path between factors of adopting innovation in national level and economic growth of nations through the path of ICT access, ICT usage, and value chain, main factors of connecting this relationship.
We describe digital innovation as adoption output of digital technologies in innovation process since today’s innovation is described in various terms such as Digital Age, the Fourth Industrial Revolution, the Internet of Things/Everything, or the Industrial Internet [4]. Further, digital technologies are based on connectivity of Information Communication Technologies, therefore, the usage of ICT supported by ICT accessibility is expressed as measurable output of digital innovation phenomenon. The value chain activities are suggested as determinants of post-adoption digital innovation following previous literature [5]. Therefore, value chain breadth is derived from the meaning of transformation of industrial structure through product or service innovation following value chain path.
We execute practical research to verify innovative growth path in national level by following procedures. We first present the theoretical background of how the model has been developed. Then, we propose the conceptual model and empirical model for testing hypothesis and provide results based on analysis. Finally, we summarize the results with major findings, and limitations for future research.
2. Theoretical Background
2.1. DoI Theory
DoI is introduced by References [3,6] and has been widely used for explaining adoption pattern as societal theory. It has been widely used as theoretical basis in innovation adoption theory. The characteristics of innovation are acknowledged by supporting diffusion of technological innovation, and DoI has been named as most popular model to confirm main characteristics of IT adoption [7,8]. Reference [9] suggests DoI for diverse field such as astronomy, education, and pharmaceutical industry, therefore, the concept of DoI research is studied by many scholars, and actively applied to diverse industries. To understand the process of adoption, most of scholars are explaining the phenomenon without separation of two different stages [10], adoption and diffusion. They are considered together as one stage in many research papers, but little but main difference exists in two stages [11]. Under the adoption process, innovative product or process is adopted in the case that they are in leading position. Consequently, DoI is dependent on the adoption mechanism of adopters. The diverse theories give descriptions about the stages of innovation diffusion (see Figure A1), but DoI theory has been practically verified as it explains innovation diffusion phenomenon. Reference [3] puts together existing 3000 theories about adoption/implementation and diffusion through literature reviews. The author identifies four characteristics of innovation; relative competitiveness, complexity, compatibility, and observability. These features are perceived as determinants of acceptance in terms of proportion and pattern of acceptance by the inmates. While the generalization of existing diffusion has not required extensive special knowledge before adoption, it has evolved from an individual-focused perspective of accepting innovation. Therefore, recent studies have focused on explaining complex acceptance scenarios. The adoption of innovation from an individual’s perspective is subject to systematic research, either in terms of administrative impact or in terms of organizational aspects, so much of the existing diffusion theory is suitable for the acceptance of innovation by the organization, though it requires modification and expansion. Reference [12] presents diversity of competitive effects in the industry of technology consumers (competitive strength, uncertainty of demand, professionalism, and cosmopolitanism), and Reference [13] further develops the framework for organizational acceptance and diffusion studies defining five factors— user group characteristics, organizational features, technical features, work characteristics and environmental factors—and each of these factors influence the six stages of IT execution: initiation, adoption, adaption, acceptance, routinization, and infusion.
Although DoI remains a popular model in investigating the acceptance of innovation in its organization, it has limitations in its application at the organizational level [14]. The literature shows through constant empirical studies that DoI has a solid theoretical basis [7], but it fails to provide sufficient explanation for IT adoption [15] in terms of organizations, because it focuses on innovations that are autonomously embraced by individuals.
In summary, DoI is able to describe the individual-level adoption process at the pre-adoption stage, at the adoption-decision stage and at the post-adoption stage [16]. However, DoI fails to explain the execution process of IT in terms of providing rationality in determining whether innovation is implemented by the users [17]. Therefore, we suggest to supplement the threshold further by introducing the TOE theory, which describes the technical, organizational and environmental perspectives.
2.2. TOE Framework
The TOE framework is also in line with the theory of Reference [3] in terms of spreading innovation within the organization. The TOE framework as described in Reference [18] is an analytical system theory that can be useful in research on the adoption and assimilation of various types of digital innovation [19]. TOE theory has a solid theoretical foundation and potential for application in the information system. It specifies three types of factors that affect acceptance and utilization of organization’s technological innovations, which are useful for improving organizational productivity. The focus is on three factors that embrace technological innovation: technological, organizational and environmental content, which means internal and external technologies related to the company, including a set of technologies that exist within the company and available in the market. Organizational factors are defined by several descriptive measurement tools. For example, the formalization and complexity of company’s size, centralization, and management system include the quality of human resources and the quantity of resources available internally. In addition, environmental factors are defined as areas in which the company’s business performance includes industry, access to resources supplied by competitors and others, and relationships with governments [18].
IT innovation adoption studies have been conducted in the form of a variety of combinations of decision factors presented, including innovation adoption theories, technology acceptance models (TAM), and factors that have been publicly used for the study of organization acceptance (see Table 1).

Table 1.
Determinants 1 of Information Technology (IT) Innovation Adoption.
The adoption of organizational innovation can be useful for improving organizational productivity, and the innovation resulting from technological change provides a reason for industrialized countries that have learned the benefits of a sustainable innovation system to set goals for innovation to accelerate economic growth, and to reduce inequality and escape from poverty [20]. Low-wage countries can be characterized as stability-oriented systems and, in some cases, they can be separated by displacement in industrialized countries [21] where safety-oriented systems do not reflect the failures of those who constitute them, but rather fail to produce actions that could break their own inertia [22], as can be achieved relatively quickly from developing countries. As a result, changes in the system are still possible, but chronic entropy becomes difficult to take off. Therefore, comprehensive and sustained technological innovation can be shaken by structural bias in the social system, and the technical process unfolds in the concept of development, namely the social process. In further, it can be reconciled by the two opposing pressures of social and technological. This theoretical paradigm can be explained by socio-technical system theory in more depth. It is also a part of the TOE framework that can explain the innovation at the national level from a social perspective.
Therefore, in this study, TOE framework theory gives explanations about the factors of digital innovation adoption under the phase of innovation process, which result in impact in terms of economic growth in national level considering social structure and technological change with human resources of country.
2.3. Conceptual Model and Hypothesis
2.3.1. Integrating DoI Theory and TOE Framework
The theoretical model combining DoI theory and TOE framework has been widely used. Reference [19] shows the studies regarding TOE framework combined with other theories such as DoI and institutional theory explaining IT adoption models. As we acknowledge from the research results of Reference [23], there are currently only a few country level analyses in IT adoption and diffusion studies. Therefore, based on studies of prior integrative models and DoI theory and TOE framework discussed above, we propose a conceptual integrated model (see Figure 1). In terms of the IT acceptance process within an organization, factors influencing the initiation of innovation, adoption-decision, and implementation phases of innovation are explored by Reference [16] in a literature survey on the acceptance phase of innovation in the past.
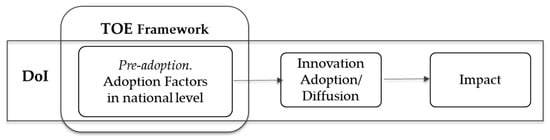
Figure 1.
Conceptual Model.
While looking at the stages and phenomena of innovation at the individual and organizational levels can be described in many ways at the adoption/diffusion level. Explaining the phenomenon at the national level can be explained by looking at the initiation and impact of innovation, namely the link between the implementation and performance. Therefore, the factors affecting to innovation adoption are explained by TOE framework under the phase of innovation described by DoI theory.
Decisions to accommodate individuals or organizations can rely on the dynamics of acceptance levels based on the externalities of the network [24,25] and these complex factors create operational challenges for IT acceptance [26]. Therefore, there are few reviews that focus on the application of IT adoption diffusion theory. Based on an innovation growth effect model grounded in an integrated innovation phase through a prior study of the adoption of innovation, the following metrics—ICT accessibility, ICT use, and Value chain breadth—are considered for viewing the outcome of the adoption of innovation as digital innovation. However, while the technology side (T) and the environment side (E) remain the same as existing TOE theory describes them, the factors that describe the organizational (O) side need to be expanded to the factors of social meaning, in order to account for the phenomenon of innovation at the national level. Therefore, the characteristics of an organization are applied as sub-concepts in a socio-related manner that can explain the diffusion of innovation at the national level. In terms of economic impact, the widespread adoption of ICTs causes recent changes of economy at national level, even though the mechanisms are not fully understood. Following the advancement of ICTs—a key driver of digital innovation—the productivity closely related to the changes of public policy is considered for global comparison as impact [27]. In summary, the next model (see Figure 2) is suggested.
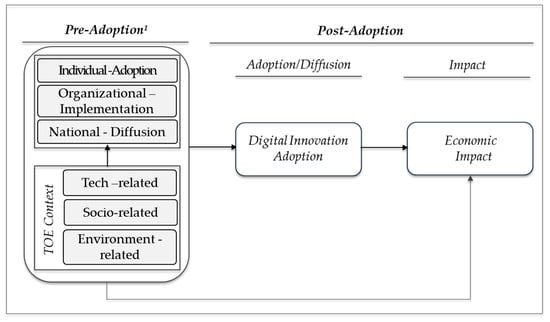
Figure 2.
Research Model. Note 1: 1 Pre-adoption part is adapted from Reference [28]. Note 2: We refer to Reference [16], which considers stages of adoption, theories under the categorized innovation format, and a conceptual model for IT innovation adoption process in organizations.
The next section discusses the factors affecting the process of innovation; adoption/diffusion/impact in national level, and posits a unique hypothesis, which have not been found in previous literature from the perspective of path analysis with a practical point of view.
2.3.2. Key Variables and Hypothesis
Based on prior research and theory, corresponding variables are extracted and used to construct each axis. A model is established to set up variables and explains the effects of innovation growth on national units by introducing the TOE framework theory that explains the determinants of innovation adoption.
• TOE framework and Innovation Adoption
Technology-related context Looking for an explanation of technological innovation capabilities and acceptance in the previous study, Reference [13] argued for the importance of internal technical resources such as infrastructure, technical capabilities, developers and usage time to accommodate a successful information system, which lead to productivity growth as many other empirical studies [29,30] demonstrated. Reference [31] says skills in technology can be explained by three subcomponents: IT infrastructure, Internet proficiency and business know-how. First, IT infrastructure refers to Internet-related and business-related technologies. Secondly, Internet proficiency refers to the skills of employees using the Internet and Internet-related technologies. Third, business know-how also means the knowledge of executives who manage electronic business. Based on these definitions, technical skills include not only physical assets, but also resources that are out of reach: skills and know-how [32,33], which could lead digital innovation adoption/diffusion.
H1:
Nations with higher level of technology capabilities will show positive impact on digital innovation.
Socio-related context As an innovation influential factor, the social structure is explained by human resources. Social structures can be recognized by people’s actions: human resources can act as a driving force in establishing ideas for society or the country and cannot play a functional role without people. In fact, digitalization should be based on human resources with physical fundamentals, hardware and accessories implemented through information and communication technology, i.e., computers, network equipment, connectivity and software, and skills to treat.
The human resource is an essential tool for economic growth in the country and plays an important role in creating jobs and improving labor technology and production [34].
H2:
Nations with higher fundamental skills in human resources have a positive impact on digital innovation.
Environment related context Explanations of internal and external environmental factors can be found in relationships between individuals and society under governance systems, such as norms and political stability that come from social structures. The concept of development in a social structure that causes change in the behavior of individuals and societies, or the relationship between structure and behavior, is an area that many researchers have drawn attention to in social science [35]. Social structures are recognized by enabling and reproducing human behavior [36,37]. Reference [36] defines in his study of the social structure’s influence on human behavior as a resource for individuals to communicate and interpret any event or action. It also says that the chosen changes in the structure of society define the general discipline and values that connect human behavior as norms and change the possibilities and accessibility of individuals and social groups change by learning new behaviors that contribute to the development of society. This change includes two forms: change in behavior to learn new behaviors and change in structure of social environment, which can be achieved by technological change or innovation, which many economists cite as a driver of socio-economic development.
Therefore, external environment plays an important role in IT acceptance [18,38], especially environmental features have been described as important elements. Reference [7] describes competitive pressures, tracking partners, trading partner support, and vertical connections, while [39] describes factors that influence the acceptance of business and business tracking exchanges in small businesses, assessing the impact of government support and external pressures. Reference [40] consider trading partners and vendor support as a competitive pressure, government support, and environmental aspect, while Reference [41] shows empirical studies in the period from 1992 to 1999 of industrialized countries that find that labor-market practices that delay the acceptance of innovation, particularly information and communication technology innovation, are caused by regulation, resulting in a slowdown in productivity. This leads to the following.
H3:
Nations with stable governance system will have a positive impact on digital innovation.
Therefore, as shown in Table 2, technical, organizational (social) and environmental factors of the national unit using the TOE system theory can be presented as indicators.
Table 2.
Factors affecting adoption of IT innovation at national level.
• TOE Framework and Economic Impact
Many papers measuring performance at the firm level are to be found, but studies measuring economic performance at the national level are not easy to find. Reference [42] says digital innovation is igniting a new flow of productivity, similar to the ICT flows seen by electrification in the 1990s, but digital innovation has yet to be tangible. While the potential gains may be a bit late in areas where these new technologies play a role in boosting productivity and economic growth, they will be able to extract maximum value based on method and policy direction. However, in terms of measurement, the size and path of digital innovation can affect the consumers whose business operates or is interconnected. On the business side, digitalization through innovation adoption provides a scope for improving the production process and gives access to new markets, but digitalization itself also provides an important scope for profit beyond national boundaries by deriving new business and allowing business to be carried out in new ways, which can be connected to the growth of productivity.
H4:
National innovation factors (technology innovation capabilities, human resources and the environment) will have a significant positive impact on the nation’s economic performance.
• Innovation adoption and Economic Impact
Digitalization also affects the role of consumers, allowing households to be linked to relay services, eliminating the separation between consumption and participatory production. Therefore, the problem of measuring digitalization has become an issue, with the recent observed decline in productivity, coupled with the increasing participation of companies and countries in the global value chain and the rising level of education in the workforce at a time of rapid technological change, all of which has to do with high productivity gains. Therefore, the debate remains as to whether productivity reduction is a transition, a long-term state, or a measurement error. In addition to the measurement problem, there are many arguments between information technology and productivity, and there are limitations in explaining this with productivity alone [43]. Many researchers have reported that information technology not only improves productivity but also affects economic growth [44] and that the accounting framework for GDP, an indicator of economic growth, is being challenged by digitalization due to complex features such as measuring assets based on international exchanges and knowledge. Economists who see digital technology as having a positive impact on productivity gains also argue that consumers’ surplus or time differences, which are not identified by the GDP index, are still less likely to increase productivity and therefore still need more time to appear as productivity gains [45] but still use GDP in the practical measurement of digitalization resulting from globalization because of the lingering problems in price changes.
H5:
Digital innovation will have a significant positive impact on the nation’s economic performance.
• TOE factors: Innovation Adoption and Economic Impact (the path from TOE factors to economic impact through innovation adoption)
The OECD divided the e-commerce market into stages of introduction, growth and maturity according to the growth phase of the digital economy in the measurement of the digital economy at the national level. For each stage of analysis, the required data is different with focus being on data, related to readiness at the introduction phase, indicating strength of growth at the stage of growth, and related to socio-economic impacts at the stage of maturity. Indeed, in the case of the United States, efforts have been made to analyze the economic impact through digital innovation and to predict its future, presenting five areas in the study of digital economy, including IT infrastructure, e-commerce form, changes in corporate/industrial and market structure, individual characteristics and labor-market characteristics using IT, and price behavior. Some argue that the performance of ICT investments made to date is not adequately measured and that productivity growth is underrated, and that statistics to measure the actual economic impact of computers in the information age are not appropriate to measure the results of digitalization [46]. Therefore, from the perspective of the innovation phase, we present digital innovation: ICT access, ICT use and value chain breadth, as a result of adoption of innovation, apply it as a measurable indicator to verify the relationship with the creation of the nation’s economic performance. We also intend to present and demonstrate that measuring actual economic impact through empirical analysis of direct and indirect channels in relation to innovation capacity factors, represented by TOE.
Many examples have observed economic effects with access to IT or broadband technologies in analyzing existing economic effects [47,48,49,50]. Most indicators, which mean ICT access as a measurable indicator, have focused until recently on the penetration rate of these wireless phones or access to Internet and broadband acceptance, which can explain only a fraction of the recent digitization that is happening very comprehensively.
H6:
ICT access will link the path from country’s innovation capabilities to economic performance positively.
The recent transition from accepting digital technologies requires an additional perspective in terms of usage, which is the effect of cumulative ICT, because the effects of separate technologies are complemented by each other in their acceptance and utilization, so the word ’accumulated’ is being explained. In addition, since research into communication and the use of IT infrastructure only describes the parts, the limitations are supplemented by complementing the traditional view of technology penetration. The transition to a digitally focused society is not only about technology acceptance but also about the use of these technologies in terms of new applications and services.
H7:
ICT use based on country’s innovation capabilities will lead the economic performance positively.
The creation of new value chains is also caused due to the development of digital technology. By connecting with global partners through diverse chains, the new value chains are created [51]. Therefore, recent studies have been conducted to develop indicators that can measure the development of digitalization in countries [52,53,54,55].
H8:
Value Chain breadth will link the path from country’s innovation capabilities to economic performance positively.
2.4. Research Methodology
2.4.1. Data
To evaluate the theoretical relationships above, we used the survey data from international organizations. Comparisons between countries are common through the preparation of relevant indicators based on objective statistical work [56]. After establishing two sections: pre-adoption and post-adoption in the innovation phase, the pre-adoption segment with indicators is set up and used as independent variables by applying the TOE framework theory, which can explain innovation phenomena and productivity increases at the national level. The post-adoption section is classified into two: adoption/diffusion and impact according to the classification of the innovation diffusion phase (see Figure 1). The parameters for adoption/diffusion section reflect the characteristics of digital innovation as a result of innovation adoption by digitalization, while the impact segment reflects the economic growth. The survey targets countries in 137 to 212 countries whose measurement results have been continuously accumulated as the International Information Service Index.
The data used in the analysis are the indicators measured on national targets, and variables were collected mainly from authoritative international organizations. As of 2010, the segments corresponding to the performance of innovation adoption during the pre-adoption and/or diffusion phases are reflected, and the impact of innovation adoption is analyzed by reflecting the average data for 2015–17 considering time differences. The reasons for the analysis as of 2010 are as follows. Reference [57] defines that the third wave of innovation has started since 2010 when information processing using big data, robotics and machine learning, which are called as digital technologies, started to be used for automation and decision-making. In particular, according to Reference [58], the third wave of digitalization is linked to productivity gains and is equivalent to progress through innovation, which includes the acceptance of technology by R&D, businesses, governments and consumers. There is also a clear time gap in the spread of goods from technological advances, so this should be reflected. Therefore, the timing of the productivity increase is based on the most recent data, reflecting the economic performance index, GDP, and the average value for 2015–17. The average value of three years is used as part of the elimination of inflation to look at the real GDP economic growth rate. Reference [59] uses the average of the three years between 2003 and 2005 for the growth rate of GDP as indicators of economic growth.
For verification of this research model, an analysis model including independent variables, mediating variables, and dependent variables is established with followings (see Table 3):
Table 3.
Characteristics of data.
The technological innovation capabilities as an independent variable are related to the country’s technological innovation capabilities in terms of the private economy, which is a measure that can be used in terms of the government’s capacity in dealing with innovation in terms of technological advancement. The country’s Global Information Technology Report by WEF measures its competitiveness in IT readiness explaining the role of ICT in leading innovation of countries considering levels of individual, corporate and government. The E-Government Development Index is used for human resources in the country as an independent variable. The human capital index reflected the people’s acceptance of e-Government services through the measurement of the general intellectual capacity of the people who could use e-government covering 193 countries. The total value is weighted based on four indicator items: adult literacy rate, school attendance rate, expected school education years, and average school education years. The environmental index of countries in the TOE context is published annually by the National Governance Indicator (WDI), a data collected by the World Bank, measuring political stability, lack of violence or terrorism, government efficiency, normative quality, rule of law, and prevention of corruption by a detailed index. It targets 212 countries around the world, and a smaller figure means a lower level of the government’s governance system, which can support the adoption of technological innovation.
As mediating variables, ICT access and ICT availability data utilized as national ICT development indices. The ICT accessibility measurement values published in the Information Society Measurement Report are based on statistics from the previous year, and ICT accessibility focuses on securing network connectivity based on sub-indicators, which consist of the ratio of Internet users to Internet users, the number of landline/mobile phone subscriptions per 100 people, the ratio of households with computers, and the ratio of households with Internet access. In addition, the ICT utilization section is comprised of the percentage of Internet users, the number of wired high-speed Internet subscriptions per 100 people, and the number of wireless high-speed Internet subscriptions per 100 people, which is based on high connectivity rather than securing connectivity as users actually pay through subscription. These variables are selected since they have been used as measurable data for the development of information society by measuring the level of development and digital divide of information society in national level as ICT Development Index surveyed by the International Telecommunication Union (ITU). Another mediating variable we suggested is the value chain path utilized the data from the Global Competitiveness Index published by Reference [60]. The Global Competitiveness Index is largely measured by three sectors, one that develops resources of a country as a growth engine, one that powers efficiency and one that drives innovation, among which the value path index is divided into detailed indicators of economic growth. In addition, the WEF explains that the inclusion of value paths in measuring the delicacy of each country’s business is important for economic growth, as well as for moving beyond production processes and products to value paths, which are based on high education.
The general use of GDP per capita (US $ current prices) as a sign of economic development by country is used as the dependent economic performance generation data. Reference [27] uses GDP per capita to compare income equality associated with socio-economic growth based on hyper-connected society. The progress of GDP per capital can measure the growth of economy by considering its relative dimension by adjusting total GDP with population growth [61]. Indeed, the impact of economic growth from the flow of digitally mobile data is growing increasingly. The United National Conference on Trade and Development (UNCTAD) has demonstrated that more than half of trade services are driven by innovation from the technology sector, which has been made possible by leveraging the movement of data across national boundaries. In the 2014 work described in Reference [62], the data were also collected, representing the country’s economic growth in a comprehensive sense rather than the selection of a subdivided economic growth indicator, as data movement accounted for US $2.8 trillion of global GDP, which is higher in economic value than movement by trade of goods, therefore, we select the GDP per capita as measurable value of economic growth impact.
2.4.2. Measures
We developed the measurement items based on comprehensive review of literatures. In the context of statistical assessment of the theoretical model, the validity of the development theory model can be obtained from the assessment of how well the development theory model fits in the actual data [58] using structural equation model (SEM). The type of structural equation model is a path analysis model that analyzes the descriptive relationship between the measurement variables. The structural equation model assumes that the observations of the measurement variables are derived from a continuous, multivariate, normally distributed status [63]. If multivariate normality is not validated, there is a possibility of amplification of chi-square-based conformity indices and the underestimated problem of standard error [64]. Therefore, it is examined through a basic statistical analysis to ensure that it does not violate the normality assumption (see Table 4).
Table 4.
Descriptive Statistics.
Dependent variable describing the economic performance of innovation in this study shows Skewness = 1.763, Kurtosis = 3.018 to meet the strict criteria of skewness, below the absolute value of 2 or lower, and of kurtosis, below absolute value of 4 or lower [58,65]. However, the minimum value (302) and maximum value (102,096) are significantly different from average (16,025) and standard deviation (19, 758), so we covert values as log. The descriptive statistical characteristics (see Table 4) satisfy the normality assumption by showing the absolute value criterion of 2 degrees or less, and the peak value of 4 or less. The number of examples of measurement variables presented in this study is 120 to 130 and the structural equation model is analyzed with a fairly small number of cases, so the threshold may exist.
Potential variables made up of hypothetical constitutive concepts are not utilized because they are utilized on a theoretical basis and country-specific observational data measured according to a clear definition. However, since the variables are measured on different scales, data are injected into the covariance matrix accordingly.
The conformity assessment results of the study model (Table 5) show that χ 2/df value is 28.49, which is higher than the general conformity criterion of 4. However, the traditional conformity index, χ 2, is too sensitive to sample size and is rarely used as the actual conformity assessment criterion based on references [66]. References [66,67] are negative about the use of this value itself because of defects that should only be used when multivariate normality is met. Non-increasing fitted indices based on chi-square provide results sensitive to sample size [68,69]. Therefore, the model is judged to be suitable with incremental non-compliance factors such as the Normed Fit index (NFI) and Comparative Fit index (CFI). The structural equation model analysis with 150 or less samples is conducted, so the indices, Root mean square error of approximation (RMSEA), CFI, Non-normed fit index (NNFI) known as Tucker Lewis Index (TLI), that do not provide sample size-sensitive results [70] are used to determine compliance. CFI shows 0.966, over 0.9, the general recommended standard value, so the model is suitable for the study [71,72]. The NNFI(TLI) value is assessed as a suitable model for 0.8 or higher [73], and the resultant value of approximations of 0.797.
Table 5.
Model’s goodness of fit.
As a result, although not satisfied with the criteria of all fitted indices provided by Mplus due to the limits of data that are not the same scale and the number of cases below 150, the CFI, used as the absolute conformity index, obtained results of more than 0.9 of the compliance indices not sensitive to sample size, and the TLI 0.8 and Standardized root mean square residual (SRMR), obtained a baseline of 0.022 lower than the SRMR = 0.08. Therefore, the study model can be judged to be superior in general as it satisfies the corresponding reference values in CFI, SRMR, given by Reference [66].
3. Results
To test the validity of the aforementioned hypothesis, a structural equation model is analyzed using the Mplus7.0 program based on a research model consisting of detailed factors. Since the suitability of the path model has been verified, the hypotheses of this study have been verified based on statistics of path coefficients. The significance of the path coefficient is determined by comparing the C.R. with the statistical criteria. When the C.R. value is greater than t = 1.96 or less than t = -1.96, the path coefficient is considered significant at a significant level of 0.05 [74]. The direct effects of each path in the path analysis are shown in the standardized coefficients values.
The overall results show that the path from TOE factors to economic impact through digital innovation is all related directly and indirectly except the direct path from human capital to value chain breadth and indirect path through value chain breadth.
The ICT access, measured at the national level of network connectivity in terms of accessibility to information, has been found to be related to innovation influencing factors in terms of digital innovation and also contribute to achieving economic performance in a pathway, but indirect effects have been found to be of lesser magnitude in relation to economic performance by innovation influencing factors.
ICT use was found to be more influential in terms of innovation capabilities and indirect effects with innovation capacity factors in the environment, and relatively insignificant in the analysis of human resources as innovation capacity factors. Although the value path has been identified as leading to the creation of economic performance through the channel for the country’s innovation capabilities and environment, it does not appear that human resources are in a direct path relationship. Therefore, for the total effect, the environment could be a direct factor in economic performance creation, and the effect on the path through the digital path of innovation to economic performance was found to exist, and the total effect was also found to be significant in the path of 0.453.
In the case of national human resources, there are high levels of direct effects in terms of economic performance and indirect effects have also been found to be affected by the relationship to economic performance through digital innovation. However, for the nation’s innovation capabilities, the direct effect relationship has been identified negative in terms of economic performance creation, which can be interpreted as having a rather short term to confirm economic performance resulting from digital innovation. Reference [57] once argued that a period of 10 years is needed before the acceptance of digital technology can be created as a result. In addition, in the case of technological innovation, the effect of other parameters for application can be considered to create physical outcomes in generating economic performance. Therefore, it was found that in terms of total effectiveness, the relationship between human resources and economic performance perspective and the relationship between environment and economic performance perspective is relatively low. However, in terms of indirect effects, significant relationships in the effect of economic performance along the digital path of innovation have also been identified as a major factor in the effect of creating economic performance on the path of digital innovation.
3.1. Direct Effect
The path to innovation capability for accessibility is significantly defined as ß = 0.197(p < 0.01) and the path to human resources is ß = 0.203(p < 0.01), the path to the environment is ß = 0.470(p < 0.01) and the direct effect on the path to accessibility is significant in terms of innovation capacity, human resources, and environment, but the greater the stability in terms of the national environment, the greater the trend of ICT accessibility expansion.
The path of innovation capability for usability is ß = 0.358 (p < 0.01), the direct effect path coefficient for human resources ß = 0.225 (p < 0.01), and the direct effect path coefficient for environment is ß = 0.471(p < 0.01), and the direct path of the environment that has the greatest impact on usability is the country’s environment, which shows the stability of the environment is the same as the accessibility of the country, and also directly affected by the innovation.
ß = 0.805 (p < 0.01), the largest path coefficient for innovation capacity in direct pathways with the nation’s innovation impactors, for the spread of the value path is shown. In the case of the environment, there is a significant effect of ß = 0.140 (p < 0.01). For human resources, however, there is no significant direct effect in terms of value paths that are increasing efficiency and productivity by utilizing digital technologies in the value path. This shows a significant impact in terms of the magnitude of the direct path coefficient of innovation, which can be interpreted as the greater the innovation capacity, the more it involves expansion in the value path.
Although innovation capacity has a significant effect on the direct path of innovation factors and economic performance, the negative value of ß = -0.121(p < 0.01) may result in various interpretations of the direct path to economic performance. This phenomenon can also be described as a lag phenomenon of innovation, as seen by a literature review that the nation’s innovation capacity takes 10 years to produce economic performance, especially those measured in terms of GDP [57]. Human resources were shown to have a direct impact on economic performance by ß = 0.314 (p < 0.01). In addition, for the environment ß = 0.173 (p < 0.01). The path coefficient can be interpreted as having a direct effect on generating economic performance in the human capacity and environment among the innovation influencing factors of the country. In addition, it is possible to predict that innovative capabilities do not have a positive effect on economic performance on a direct path, but have a path to economic performance through a mediated effect. The overall results are shown below (see Figure 3).
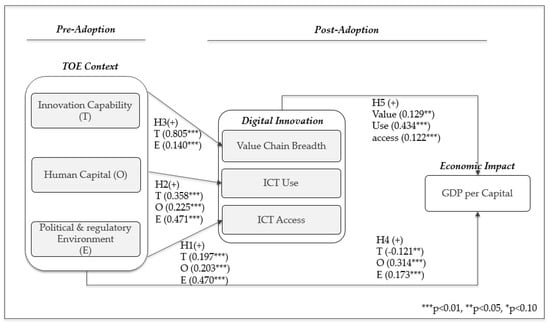
Figure 3.
An integrative model. Direct effect from Technology-organization-environment (TOE) factors to Innovation adoption (H1~H3), Direct effect from TOE context to Economic Impact (H4), and Direct effect from Innovation adoption to Economic impact (H5). (See the table in Appendix B).
3.2. Indirect Effect
Identification of the mediated effects of digital innovation shows that accessibility, usability, and spread of value paths all have indirect effects on the economic performance of technological innovation (see Figure 4). The total sum of indirect effects is ß = 0.283 (p < 0.01) which results in a reduction in the economic effect on the path of direct innovation capacity, indicating that the magnitude of the impact on the relationship with economic performance along the path to ICT utilization is greatest and the contribution of increasing economic performance through ICT utilization and value paths is significant. ICT accessibility also shows a path coefficient of ß = 0.024 (p < 0.01) that is considered to have a indirect effect but is insignificant.
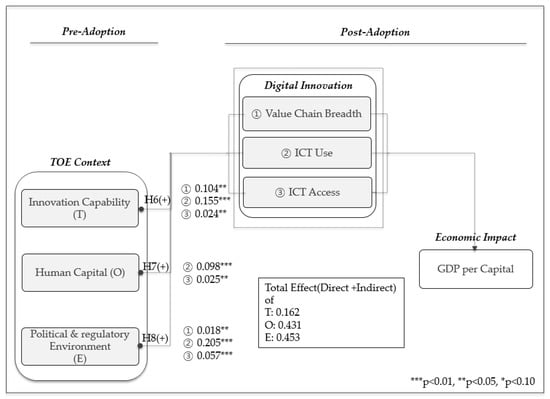
Figure 4.
An integrative model. Indirect effect from TOE Factors in national level to Economic impact through innovation adoption path (H6~H8), Total effect (Direct + Indirect effect) of TOE factors to economic impact through digital innovation adoption. (See the table in Appendix B).
The relationship between human resources and economic performance results in digital innovation being mediated in both directions. However, there has been no significant outcome in the direct path to human resources and value paths, nor has there been any indirect effect in the value path. Therefore, the total effect of human resources is 0.431, which can increase economic performance as the capacity of human resources increases. The ICT accessibility and usability aspects of indirect routes also serve as positive intermediaries.
The use of ICT in the relationship between the environment and economic performance of the country is a result of mediating in both directions ß = 0.205(p < 0.01) and ICT accessibility also showed positive mediated effects, but the effect was ß = 0.057(p < 0.01) and indirect effects through the value path are also shown to have a positive mediated effect, but the effect could be seen as insignificant at the level ß = 0.018 (p < 0.05). The total effect is 0.453 and the effect of the total indirect effect is ß = 0.280 (p < 0.01).
4. Discussions
4.1. Summary and Major Findings
In this study, an analysis category is set up for economic performance generation in the adoption of innovation in terms of digitalization in an innovative process approach.
The step-by-step approach to innovation divided innovation into pre-adoption and post-adoption processes, separated by initiation, diffusion and impact, exemplified the data required for each step of analysis and presented metrics accordingly. In the pre-adoption phase, the TOE framework is utilized in explaining the impact factors of innovation at the national level as independent variables in terms of technology, society and national environment. The ICT accessibility, ICT use, and value chain are considered for real path towards impact of national productivity growth through technological innovation of country.
Finding 1. Overall, the relation between innovation factors and value chain breadth—a new characteristic applied in this study—is verified in terms of economic growth of nation.
The digital innovation as the output of digitalization could give directions in building policy in terms of transferring value through value chain path and changes in ecosystem. In other words, a physically well-developed digital infrastructure represented by ICT accessibility can increase productivity by lowering transaction costs, reducing distance and time impacts and improve the real usage, and by integrating markets with global value paths: value chain breadth, using information flows. This is also why digital innovation is becoming more important, and empirical studies are increasing on how digital innovation can be leveraged to affect the productivity of a company or country [75].
Finding 2. The ICT use than ICT access shows higher relation to economic growth of nation under the links between innovation factors and economic growth of nations.
Additionally, ICT accessibility is the primary underlying infrastructure, and ICT usability is found to require the determination of indicators based on actual utilization. Therefore, ICT accessibility, which means network-based connectivity as a measurable indicator of digital innovation, and ICT utilization based on the advent of new technologies based on ICT access, are able to be considered as metrics for digital innovation adoption. In addition, value chain breadth, characterized by digital innovation as a result of value path creation, can also be considered as an indicator in measuring economic growth
Finding 3. The effectiveness of governance structure in the perspective of environment is also considered as crucial factor, so securing of flexibility for adoption of individuals and organizations could be one of the important factors to make growth. Reference [76] uses the same variables used by Reference [77] to analyze the efficiency of their investment in information and communications, and calculate the use of ICT, meaning the overall environment for IT, such as market, political, regulatory and infrastructure, and ICT preparation variables for individuals, businesses and governments to benefit from IT.
Finding 4. The human capital is also one of the vital factors for innovative growth of nation, and for that, incubating human capital could give huge impact to the economic growth of nation in terms of innovation. We therefore suggest a measurable index that could explain the characteristics of digital innovation, output of digitalization and innovation adoption, and we verify the path to economic growth derived from innovation including digital innovation.
4.2. Implications
Technology changes cause industrial changes and lead to economic ripple effects. The global economy classifies innovation as an influence factor for technological change and is making continuous investments to revitalize digital innovation. However, due to the inconsistency between the productivity of the industry resulting from these investments, countries have begun to describe the issues of productivity measurement related to digitalization. In addition, digitalization affects the entire social culture through industrial transformation and the creation of new values by value chain path based on advancement of ICT, so the need for empirical analysis based on policy interests has also increased to overcome the limitations of the statistical system, including existing indicators [46].
The policy-makers face difficulties in responding to the explosive growth of ICT through access to additional accumulative ICT technologies and access to their use in terms of measuring and determining the economic effects. As digitalization through digital technologies based on connectivity driven by IT has assimilated to society, there is a lack of standard performance indicators to measure it. Therefore, new ways of looking at digitalization of policy-makers focused on the proliferation of value paths could explain digital innovation and its subsequent utilization. Through indicators we have suggested, post-digital policy impacts are measurable in terms of the degree of digitalization. Therefore, digital indicators are expected to increase their use in determining the progress achieved by each country in the implementation of digital agenda [53] and to define the major impact factors of policy.
4.3. Limitations and Future Research
The lack of tools to measure the impact of the adoption of connected digital technologies and applications and services in society and the economy has led to the need for new policy approaches to accelerate digitalization and reap the benefits derived from them for the past few decades. In addition, new policies need to be developed and applied to the existing strategic directions, considering the social values or economic effects that can be gained by accelerating digitalization. However, the connectivity of digital technologies in terms of performance creation and the consequent impact of applications on society and the economy have not yet been studied much, particularly due to the lack of statistical data on developing countries. In addition, relatively few studies have been conducted on how digital technologies and the use of infrastructure affect the innovation process as organizations and society grow [78].
According to those factors, this research also has a few limitations. If all countries do not have the same measurable variables in their national comparisons, it is very difficult to select the same variables and the same output variables, so there may be limitations, such as the omission of important variables from the use of the National Intelligence Index as observational variables [76]. Furthermore, the impact or performance of the adoption and diffusion of digital innovation needs to be more specific since currently data is yet to be accumulated sufficiently. The relationships with indicators need to capture of years of accumulated data over time or duration for analyzing dynamically changing patterns. Therefore, the current limitations can give ideas for future research.
First, the requirements for time difference analysis are met partly by estimating the structural methodologies in this study by deriving sequential performance implementation processes at the stage of innovation [79], but there are still needs to analyze the different pattern depending on groups: low intensity and high intensity in terms of usage to find directions in policy aspects. Second, new measurable indicators can be suggested. As an indicator of the performance of the digital economy, GDP is a measure of productivity, not welfare or consumer supply. Therefore, there is still a need for empirical analysis through path analysis to additional economic performance indicators such as high-tech exports and research and development expenditure considering time-lag effect with time series analysis.
Author Contributions
H.P. and S.O.C. conceived and designed the research. Conceptualization, methodology, software, validation, formal analysis, investigation, resources, data curation, writing—original draft preparation, writing—review and editing, and visualization.
Funding
This research received no external funding.
Acknowledgments
This paper received the best paper award at the SOItmc 2019 conference.
Conflicts of Interest
The authors declare no conflicts of interest.
Appendix A

Figure A1.
Framework for digital innovation by [80].
Appendix B
Table A1.
Direct effect.
Table A1.
Direct effect.
| Hypothesis | The Path | Standardized Coefficient | SE | t-Value | p-Value | |
|---|---|---|---|---|---|---|
| H1 | 1-a | INNO → ACCESS | 0.197 | 0.047 | 4.181 | 0.000 |
| 1-b | HUMAN →ACCESS | 0.203 | 0.042 | 4.827 | 0.000 | |
| 1-c | ENV → ACCESS | 0.470 | 0.050 | 9.394 | 0.000 | |
| H2 | 2-a | INNO → USE | 0.358 | 0.029 | 12.315 | 0.000 |
| 2-b | HUMAN → USE | 0.225 | 0.026 | 8.606 | 0.000 | |
| 2-c | ENV → USE | 0.471 | 0.031 | 15.161 | 0.000 | |
| H3 | 3-a | INNO → VALUE | 0.805 | 0.028 | 28.724 | 0.000 |
| 3-b | HUMAN → VALUE | −0.039 | 0.029 | −1.324 | 0.185 | |
| 3-c | ENV → VALUE | 0.140 | 0.036 | 3.848 | 0.000 | |
| H4 | 4-a | INNO → ECO | −0.121 | 0.046 | −2.601 | 0.009 |
| 4-b | HUMAN → ECO | 0.314 | 0.027 | 11.745 | 0.000 | |
| 4-c | ENV → ECO | 0.173 | 0.038 | 4.495 | 0.000 | |
| H5 | 5-a | ACCESS → ECO | 0.122 | 0.035 | 3.504 | 0.000 |
| 5-b | USE → ECO | 0.434 | 0.056 | 7.747 | 0.000 | |
| 5-c | VALUE → ECO | 0.129 | 0.042 | 3.091 | 0.002 | |
Table A2.
Total effect of innovation factors to economic growth through digital innovation.
Table A2.
Total effect of innovation factors to economic growth through digital innovation.
| Hypothesis | The Path | Standardized Coefficient | SE | t-Value | p-Value | |
|---|---|---|---|---|---|---|
| H6 | 6-a | INNO → ACCESS → ECO | 0.024 | 0.009 | 2.697 | 0.007 |
| 6-b | INNO → USE → ECO | 0.155 | 0.024 | 6.528 | 0.000 | |
| 6-c | INNO → VALUE → ECO | 0.104 | 0.034 | 3.067 | 0.002 | |
| Total | The indirect path | 0.283 | 0.041 | 6.956 | 0.000 | |
| Total effect (Direct + Indirect) | 0.162 | |||||
| H7 | 7-a | HUMAN → ACCESS → ECO | 0.025 | 0.009 | 2.896 | 0.004 |
| 7-b | HUMAN → USE → ECO | 0.098 | 0.016 | 5.932 | 0.000 | |
| 7-c | HUMAN → VALUE → ECO | −0.005 | 0.004 | −1.22 | 0.224 | |
| Total | The indirect path | 0.117 | 0.017 | 6.983 | 0.000 | |
| Total effect (Direct + Indirect) | 0.431 | |||||
| H8 | 8-a | ENV → ACCESS → ECO | 0.057 | 0.018 | 3.235 | 0.001 |
| 8-b | ENV → USE → ECO | 0.205 | 0.030 | 6.811 | 0.000 | |
| 8-c | ENV → VALUE → ECO | 0.018 | 0.007 | 2.419 | 0.016 | |
| Total | The indirect path | 0.280 | 0.029 | 9.616 | 0.000 | |
| Total effect (Direct + Indirect) | 0.453 | |||||
References
- United Nation’s Secretary General. Task Force on Digital Financing of the Sustainable Development Goals. 2019. Available online: https://digitalfinancingtaskforce.org/about-the-task-force/sdgs/ (accessed on 5 August 2019).
- Lee, K.W.; Choi, S.C.; Kim, J.H.; Jung, M.J. A Study on the Factors Affecting Decrease in the Government Corruption and Mediating Effects of the Development of ICT and E-Government—A Cross-Country Analysis. J. Open Innov. Technol. Mark. Complex. 2018, 4, 41. [Google Scholar] [CrossRef]
- Everett, M. Rogers. Diffusion of Innovations, 3rd ed.; Macmillan Publishing Co., Inc: New York, NY, USA, 1983. [Google Scholar]
- Lee, M.H.; Yun, J.J.; Pyka, A.; Won, D.; Kodama, F.; Schiuma, G.; Park, H.; Jeon, J.; Park, K.; Jung, K.; et al. How to Respond to the Fourth Industrial Revolution, or the Second Information Technology Revolution? Dynamic New Combinations between Technology, Market, and Society through Open Innovation. J. Open Innov. Technol. Mark. Complex. 2018, 4, 21. [Google Scholar] [CrossRef]
- Zhu, K.; Dong, S.; Xu, S.X.; Kraemer, K.L. Innovation diffusion in global contexts: Determinants of post-adoption digital transformation of European companies. Eur. J. Inf. Syst. 2006, 15, 601–616. [Google Scholar] [CrossRef]
- Rogers, E.M. Lessons for guidelines from the diffusion of innovations. Jt. Comm. J. Qual. Patient Saf. 1995, 21, 324–328. [Google Scholar] [CrossRef]
- Premkumar, G.; Roberts, M. Adoption of new information technologies in rural small businesses. Omega 1999, 27, 467–484. [Google Scholar] [CrossRef]
- Thong, J.Y.L. An integrated model of information systems adoption in small businesses. J. Manag. Inf. Syst. 1999, 15, 187–214. [Google Scholar] [CrossRef]
- Rogers, E.M. A prospective and retrospective look at the diffusion model. J. Health Commun. 2004, 9, 13–19. [Google Scholar] [CrossRef]
- Jha, A.K.; Bose, I. Innovation research in information systems: A commentary on contemporary trends and issues. Inf. Manag. 2016, 53, 297–306. [Google Scholar] [CrossRef]
- Ghoshal, S.; Bartlett, C.A. Creation, adoption and diffusion of innovations by subsidiaries of multinational corporations. J. Int. Bus. Stud. 1988, 19, 365–388. [Google Scholar] [CrossRef]
- Robertson, T.S.; Gatignon, H. Competitive effects on technology diffusion. J. Mark. 1986, 50, 1–12. [Google Scholar] [CrossRef]
- Kwon, T.H.; Zmud, R.W. Unifying the fragmented models of information systems implementation. In Critical Issues in Information Systems Research; John Wiley & Sons, Inc.: New York, NY, USA, 1987; pp. 227–251. [Google Scholar]
- Chau, P.Y.K.; Tam, K.Y. Factors affecting the adoption of open systems: An exploratory study. MIS Q. 1997, 21, 1–24. [Google Scholar] [CrossRef]
- Niederman, F.; Brancheau, J.C.; Wetherbe, J.C. Information systems management issues for the 1990s. MIS Q. 1991, 15, 475–500. [Google Scholar] [CrossRef]
- Hameed, M.A.; Counsell, S.; Swift, S. A meta-analysis of relationships between organizational characteristics and IT innovation adoption in organizations. Inf. Manag. 2012, 49, 218–232. [Google Scholar] [CrossRef]
- Fichman, R.G. The diffusion and assimilation of information technology innovations. In Framing the Domains of IT Management: Projecting the Future through the Past; Pinnaflex Educational Resources Inc.: Cincinnati, OH, USA, 2000. [Google Scholar]
- Tornatzky, L.G.; Fleischer, M.; Chakrabarti, A.K. The Processes of Technological Innovation; Issues in Organization and Management Series; Lexington Books: Lexington, MA, USA, 1990. [Google Scholar]
- Oliveira, T.; Martins, M.F. Literature review of information technology adoption models at firm level. Electron. J. Inf. Syst. Eval. 2011, 14, 110. [Google Scholar]
- Mokyr, J. Punctuated equilibria and technological progress. Am. Econ. Rev. 1990, 80, 350. [Google Scholar]
- Kunkel, J.H. Society and Economic Growth: A Behavioral Perspective of Social Change; Oxford University Press: Oxford, UK, 1970. [Google Scholar]
- Goulet, D. The Cruel Choice: A New Concept in the Theory of Development; Atheneum Publishers: New York, NY, USA, 1971. [Google Scholar]
- Williams, M.D.; Dwivedi, Y.K.; Lal, B.; Schwarz, A. Contemporary trends and issues in IT adoption and diffusion research. J. Inf. Technol. 2009, 24, 1–10. [Google Scholar] [CrossRef]
- Katz, M.L.; Shapiro, C. Technology adoption in the presence of network externalities. J. Political Econ. 1986, 94, 822–841. [Google Scholar] [CrossRef]
- Markus, H.; Wurf, E. The dynamic self-concept: A social psychological perspective. Annu. Rev. Psychol. 1987, 38, 299–337. [Google Scholar] [CrossRef]
- Fichman, R.G. Information technology diffusion: A review of empirical research. Available online: http://paper.shiftit.ir/sites/default/files/article/10KIII-RG%20Fichman-2001.pdf (accessed on 1 August 2019).
- Baurer, J.M. The Internet and income inequality: Socio-economic challenges in a hyperconnected society. Telecommun. Policy 2018, 42, 333–343. [Google Scholar] [CrossRef]
- Xiao, X.; Christopher, B.C.; Saonee, S.; Suprateek, S. ICT innovation in emerging economies: a review of the existing lieterature and a framework for future research. Journal of Information Technology. 2013, 28, 264–278. [Google Scholar] [CrossRef]
- Cragg, P.B.; King, M. Small-firm computing: Motivators and inhibitors. MIS Q. 1993, 17, 47–60. [Google Scholar] [CrossRef]
- Grover, V.; Goslar, M.D. The initiation, adoption, and implementation of telecommunications technologies in US organizations. J. Manag. Inf. Syst. 1993, 10, 141–163. [Google Scholar] [CrossRef]
- Zhu, K.; Kraemer, K.; Xu, S. Electronic business adoption by European firms: A cross-country assessment of the facilitators and inhibitors. Eur. J. Inf. Syst. 2003, 12, 251–268. [Google Scholar] [CrossRef]
- Mata, F.J.; Fuerst, W.L.; Barney, J.B. Information technology and sustained competitive advantage: A resource-based analysis. MIS Q. 1995, 19, 487–505. [Google Scholar] [CrossRef]
- Helfat, C.E. Know-how and asset complementarity and dynamic capability accumulation: The case of R&D. Strat. Manag. J. 1997, 18, 339–360. [Google Scholar]
- Islam, M.A.K.M.; Mansoor, N.; Baharun, S.; Khanam, S. A comparative analysis of ICT developments in developing and developed countries. Reg. Sci. Inq. J. 2012, 4, 159–182. [Google Scholar]
- Cohen, I. Theories of Action and Praxis. In The Blackwell Companion to Social Theory; Turner, B., Ed.; Blackwell Publishers: Oxford, UK, 1996. [Google Scholar]
- Giddens, A. Central Problems in Social Theory: Action, Structure, and Contradiction in Social Analysis; Univ of California Press: Berkeley, CA, USA, 1979. [Google Scholar]
- Giddens, A. The Constitution of Society: An Introduction to the Theory of Structuration; University of California Press: Berkeley, CA, USA, 1984. [Google Scholar]
- Damapour, F.; Schneider, M. Phases of the adoption of innovation in organizations: Effects of environment, organization and top managers. Br. J. Manag. 2006, 17, 215–236. [Google Scholar] [CrossRef]
- Kuan, K.K.Y.; Chau, P.Y.K. A perception-based model for EDI adoption in small businesses using a technology–organization–environment framework. Inf. Manag. 2001, 38, 507–521. [Google Scholar] [CrossRef]
- Quaddus, M.; Hofmeyer, G. An investigation into the factors influencing the adoption of B2B trading exchanges in small businesses. Eur. J. Inf. Syst. 2007, 16, 202–215. [Google Scholar] [CrossRef]
- Gust, C.; Marquez, J. International comparisons of productivity growth: The role of information technology and regulatory practices. Labour Econ. 2004, 11, 33–58. [Google Scholar] [CrossRef]
- Schreyer, P.; Nadim, A. Are GDP and Productivity Measures Up to the Challenges of the Digital Economy? Int. Product. Monitor 2016, 30, 4–27. [Google Scholar]
- Byrne, D.M.; Fernald, J.G.; Reinsdoref, M.B. Does the United States have a productivity slowdown or a measurement problem? Brook. Pap. Econ. Act. 2016, 1, 109–182. [Google Scholar] [CrossRef]
- Oliner, S.D.; Sichel, D.E. Computers and output growth revisited: How big is the puzzle? Brook. Pap. Econ. Act. 1994, 25, 273–334. [Google Scholar] [CrossRef]
- Brynjolfsson, E.; Mcafee, A. The Profession of IT Learning for the New Digital Age. Profession 2014. [Google Scholar] [CrossRef]
- Um, M.J. A Survey Study on Government Statistics for the Digital Economy; STEPI: Seoul, Korea, 2001. [Google Scholar]
- Jensen, R. The digital provide: Information (technology), market performance and welfare in the South Indian fisheries sector. Q. J. Econ. 2007, 122, 879–924. [Google Scholar] [CrossRef]
- Muto, M. The impact of mobile phone coverage expansion on market participation: Panel data evidence from Uganda. World Dev. 2009, 37, 1887–1896. [Google Scholar] [CrossRef]
- Klonner, S.; Nolen, P. Cell phones and rural labor markets: Evidence from South Africa. In Proceedings of the German Development Economics Conference, Hannover, Germany, January 2010; Available online: http://hdl.handle.net/10419/39968 (accessed on 1 August 2019).
- Foluke, O.O. User motivation and acceptance of mobile services in Nigeria. Int. J. E-Adopt. (IJEA) 2018, 10, 70–81. [Google Scholar] [CrossRef]
- Park, H.S. Technology convergence, open innovation, and dynamic economy. J. Open Innov. Technol. Mark. Complex. 2017, 3, 24. [Google Scholar] [CrossRef]
- Katz, R.L.; Koutroumpis, P. Measuring socio-economic digitization: A paradigm shift. SSRN Electron. J. 2012. [Google Scholar] [CrossRef]
- Raul, K.; Pantelis, K.; Fernando, M.C. Using a digitalization index to measure the economic and social impact of digital agendas. J. Policy Regul. Strateg. Telecommun. Inf. Media 2014, 16, 32–44. [Google Scholar] [CrossRef]
- Friedrich, R.; LeMerle, M.; Grone, F.; Koster, A. Measuring Industry Digitization: Leaders and Laggards in the Digital Economy; Booz & Co.: London, UK, 2011. [Google Scholar]
- Holbling, K.; Grone, F.; Seelbach, F.; Maekelburger, B. Advancing Digital Commerce Capabilities to Drive Financial Value: Perspective and Benchmarking Framework; Booz & Co: London, UK, 2011. [Google Scholar]
- Korea Development Institute. Journal of Economic Policy; Korea Development Institute: Sejong, Korea, 2017. [Google Scholar]
- Katz, J.E. Machines that Become Us: The Social Context of Personal Communication Technology; Routledge: Abingdon, UK, 2017. [Google Scholar]
- Shim, J.S. Structural equation modeling in public administration: A critical assessment and suggestions. Korean Public Adm. Rev. 2015, 9, 453–485. [Google Scholar]
- Jae-Jin, Y.; Ah-Ra, C. The Social Investment State: Theory and Socioeconomic Performance. Citiz. World 2007, 5, 212–242. [Google Scholar]
- World Economic Forum. The Global Competitiveness Report; World Economic Forum: Geneva, Switzerland, 2015. [Google Scholar]
- Andre, H.; Claudio, A.; Vianka, A. Information and communication technologies and their impact in the economic growth of Latin America, 1990–2013. Telecommun. Policy 2016, 40, 485–501. [Google Scholar]
- Hong, S.H. The criterial for selecting appropriate fit indices in structural equation modeling and their rationales. Korean Psychol. Assoc. 2000, 2, 161–177. [Google Scholar]
- MacCallum, R.C.; Roznowski, M.; Necowitz, L.B. Model modifications in covariance structure analysis: The problem of capitalization on chance. Psychol. Bull. 1992, 111, 490–504. [Google Scholar] [CrossRef] [PubMed]
- Decarlo, L.T. On the meaning and use of kurtosis. Psychol. Methods 1997, 2, 292–307. [Google Scholar] [CrossRef]
- Schröter, D.; Cramer, W.; Leemans, R.; Prentice, I.C.; Araújo, M.B.; Arnell, N.W.; Bondeau, A.; Bugmann, H.; Carter, T.R.; Gracia, C.A.; et al. Ecosystem service supply and vulnerability to global change in Europe. Science 2005, 310, 1333–1337. [Google Scholar] [CrossRef] [PubMed]
- Hu, L.-t.; Bentler, P.M. Fit indices in covariance structure modeling: Sensitivity to underparameterized model misspecification. Psychol. Methods 1998, 3, 424–453. [Google Scholar] [CrossRef]
- Garver, M.S.; Mentzer, J.T. Logistics research methods: Employing structural equation modeling to test for construct validity. J. Bus. Logist. 1999, 20, 33–57. [Google Scholar]
- Anderson, J.C.; Gerbing, D.W. The effect of sampling error on convergence, improper solutions, and goodness-of-fit indices for maximum likelihood confirmatory factor analysis. Psychometrika 1984, 49, 155–173. [Google Scholar] [CrossRef]
- Marsh, H.W.; Balla, J.R.; Mcdonald, R.P. Goodness-of-fit indexes in confirmatory factor analysis: The effect of sample size. Psychol. Bull. 1988, 103, 391–410. [Google Scholar] [CrossRef]
- Fan, X.; Thompson, B.; Wang, L. Effects of sample size, estimation methods, and model specification on structural equation modeling fit indexes. Struct. Equ. Model. Multidiscip. J. 1999, 6, 56–83. [Google Scholar] [CrossRef]
- Hu, L.; Bentler, P.M. Evaluating model fit. In Structural Equation Modeling: Issues, Concepts, and Applications; Hoyle, R., Ed.; SAGE Publications: Thousand Oaks, CA, USA, 1995; pp. 76–99. [Google Scholar]
- Sugawara, H.M.; Maccallum, R.C. Effect of estimation method on incremental fit indexes for covariance structure models. Appl. Psychol. Meas. 1993, 17, 365–377. [Google Scholar] [CrossRef]
- Bagozzi, R.; Dholakia, U. International social action in virtual communities. J. Interact. Mark. 2002, 16, 2–21. [Google Scholar] [CrossRef]
- Park, H.S.; Oh, S.Y.; Rho, S.P. A Model and Test on the Impact of the Street-level Bureaucrat’s Role Stress on Quitting Intent in Public Service Environment: On the focus of Differences between Men and Women. Korean Public Adm. Rev. 2001, 9, 197–219. [Google Scholar]
- McKinsey Global Institute. The Great Transformer: The Impact of the Internet on Economic Growth and Prosperity. Available online: http://dese.ade.arkansas.gov/public/userfiles/Legislative_Services/Quality%20Digital%20Learning%20Study/Facts/McKinsey_Global_Institute-Impact_of_Internet_on_economic_growth.pdf (accessed on 1 August 2019).
- Lee, J.H.; Choi, H.J. An Analysis of the Efficiency of the National Information Service Investment and Redefining the Future of the National Intelligence Strategy; KIPA: Seoul, Korea, 2009. [Google Scholar]
- Mathur, S.K. Indian IT& ICT Industry: A Performance Analysis Using Data. Glob Econ. J. 2007, 7, 1850109. [Google Scholar]
- Raul, K.; Fernando, C. Accelerating the development of Latin American digital ecosystem and implications for broadband policy. Telecommun. Policy 2018, 42, 661–681. [Google Scholar]
- Moon, J.W.; Kim, H.J. A Study on the Information Service Performance Evaluation Model and Application Cases; Korea Information Society Development Institute: Seoul, Korea, 2008. [Google Scholar]
- Fichman, R.G.; Santos, B.L.D.; Zheng, Z. Digital Innovation as a Fundamental and Powerful Concept in the Information Systems Curriculum. MIS Q. 2014, 38, 329–354. [Google Scholar] [CrossRef]
© 2019 by the authors. Licensee MDPI, Basel, Switzerland. This article is an open access article distributed under the terms and conditions of the Creative Commons Attribution (CC BY) license (http://creativecommons.org/licenses/by/4.0/).