1. Introduction
In July and August of 2016, electric power consumption was the highest ever due to the heat wave in Korea. As a result, the electricity bills for household use increased drastically; such that electricity charges for 871 million households, which is 40% of total households, increased by more than 50% from July, whilst it more than doubled for 291 million households [
1]. Despite the increase in power supply capacity in preparation for such a sudden power usage, the power reserve ratio in the case of maximum power demand declined to 8.5% in August 2016 from 16.5% in August 2015. In other words, since the power supply capacity is limited to cope with the increase in the maximum power demand, it is necessary to keep the power demand stable and secure an adequate power reserve ratio continuously (refer to
Table 1).
From the traditional point of view, the process of generation and consumption of electricity is through a one-sided process in which energy is used to produce electricity, and then electricity is transmitted and distributed to consumers. In other words, the producers of electricity have focused on the construction of infrastructure to transmit and distribute electricity efficiently, with less concern on information exchange with consumers about their consumption of electricity. If the amount of electricity generated is higher than the amount needed due to a lack of information on the consumption of electricity, then unnecessary production costs of electricity are incurred due to overproduction. If the amount of electricity generated is less than the amount consumed, then a blackout can occur and the social cost may increase [
2]. Therefore, it is important to determine the appropriate amount of power supply, which is the minimum condition to reduce unnecessary costs. Furthermore, it is important to develop a technique to maintain power supply and demand stably [
3].
In order to prevent such a sudden blackout and maintain stable supply, the Korean government has prioritized projects to analyze electricity demand in real-time and lower the error rate by reducing the demand forecast error on the basis of it; and stabilizing the power reserve ratio by guiding households to consume electric power during the light load time. To this end, the government is promoting the introduction of the HEMS (Home Energy Management System), a system that allows consumers to actively their control power usage. HEMS utilize a smart grid technology that can exchange power supply and demand information in real-time throughout the electric power network. Since HEMS can provide households with real-time electricity cost information according to their electricity consumption, households can control their consumption of electricity right away, which prevents electricity consumption from being concentrated in a specific time zone [
4]. The introduction of HEMS, not only helps to sustain a stable supply of electricity, but also enables consumers to drive efficient power consumption [
5,
6,
7,
8]. However, despite this importance, few studies have been conducted to verify the various effects and consequences of introducing HEMS to existing power networks.
In this study, we try to examine the causal relationship between the factors constituting power supply and demand from a dynamic point of view. Based on this, we will identify what improvements are made when HEMS is introduced using system dynamics.
2. Literature Reviews
The characteristic of system dynamics, is that the phenomenon arising from the dynamic change of a specific variable is understood as a system structure that occurs through bi-directional interaction with other variables. In other words, the core of system dynamics is to recognize the complex structure of phenomena as a temporal type, and to model and integrate the whole relationship [
9,
10].
Kim and Ahn [
11] examined the impact of monopolistic market dominance on market price in the electricity market and analyzed the effect of the real-time price policy introduced to prevent it using system dynamics. From this study, it was analyzed that the effect of market dominance was mitigated by lowering the current market price by about 20%, through real-time pricing policy. To this end, it suggested the consumers’ willingness to actively participate in real-time pricing policy.
Hwang et al. [
12] selected the factors affecting future energy consumption based on scenario development through system thinking as a prediction for Korea’s energy consumption prospects. In this study, global economic trends, changes in industrial structure, and energy prices were derived as factors that have an uncertain impact on future energy consumption. To offset these negative factors, they analyzed the future of energy consumption based on strategic scenarios reflecting the increase in alternative energy production, the change in energy demand based on economic activity, and the change to environment friendly systems.
Bunn et al. [
13] used system dynamics to identify new strategies that power companies should have in the UK’s electricity market, which has become competitive with the opening of the country’s power market. The study showed that the success or failure of a power generation company depends on the size and competitiveness of it; and that the supplier producing power using various sources of energy acquires market power.
Qudrat-Ullah [
14] explained the mechanism by which the Canadian power market is operated, through system dynamics. The study suggested that investing in R&D investments in securing power generation facilities and improving the efficiency of power generation, can sustain balanced supply and demand.
Kim and Lee [
15] analyzed the value of electricity usage to derive acceptable services in smart grid environments. Research has shown that consumers think electricity is an indispensable factor in the use of consumer electronics. In addition, it was investigated that consumers want an electricity saving method that is easy to understand, and they want to pursue safety to reduce electromagnetic waves and electric shock. Based on these results, they suggested a direction for technological development that smart grid services should pursue.
Kim et al. [
16] analyzed the difference between the expert group and the consumer group, on the acceptance motive of adopting smart grid based on the technology acceptance model (TAM). As a result, it was analyzed that the perception of smart grid was different between the expert group and consumer group. In the case of the expert group, the security of the smart grid was a significant factor in the usefulness of the technology, but the security perceived by the consumer group did not affect the acceptance intention. In addition, the perceived quality level had a positive effect on ease of use in the expert group, and usefulness in the consumer group. This result suggested the necessity of a policy approach considering the difference of perception, between the expert group and consumer group.
Moslehi and Kumar [
17] studied the impact of the introduction of smart grid on the existing power grid. In the study, the smart grid had the effect of expanding renewable energy, power saving behavior through demand response, and popularization of power storage devices, resulting in a distribution pattern of power demand. Therefore, the technology of smart grid should be developed with the direction to expand such influence.
Yan et al. [
18] discussed the functions of telecommunication facilities that should be ready for the spread of smart grid. The result of this study, showed the smart grid should be aimed at enhancing the security of telecommunication facilities because it is a system that exchanges information through the communication function of suppliers and consumers using the existing power grid. To do this, they analyzed security technologies that reduce the risk of hacking to the smart grid automation and remote-control functions and applied them to the smart grid network.
Most of these studies have been based on statistical analysis and there have been few studies on the utility of HEMS using system dynamics. System dynamics is a useful analytical tool because it is particularly suited to modeling social problems with feedback loops. In this study, we analyzed the problems of power supply and demand from an integrated viewpoint and analyzed the effects of HEMS on the power market through system dynamics models.
3. Causal Loop Diagrams
3.1. Power Supply
The purpose of the electric power supply company, is to produce electric power at low cost and supply it stably through transmission and distribution. However, a power generation strategy based on economics is likely to lead to a power outage, considering a minimal amount of electricity production to meet demand. On the other hand, if the realization of stable electric power supply is a main consideration of electric power generation, investments should be made to expand generation facilities, which can inevitably lead to inefficient electric power production. Therefore, a power generation strategy that meets both efficiency and stability in supply is required, and it is necessary to maintain an adequate level of reserve power [
19].
The remaining power amount, that subtracts the demand from the maximum amount of power that can supply power during the day when the demand for power is highest in the day, is called the reserve power amount. The ratio of the reserve power amount to the maximum power amount is the power reserve ratio. Generally, the appropriate level of power reserve ratio in Korea is 15%. The power reserve ratio is influenced by the increase and decrease of electric power production and electric power demand. When the reserve power is less than 5 million kilowatts (kW) due to a decrease in electric power production, or an increase in electric power demand, a preliminary alarm is issued to request electricity saving actions from each home, office and industry.
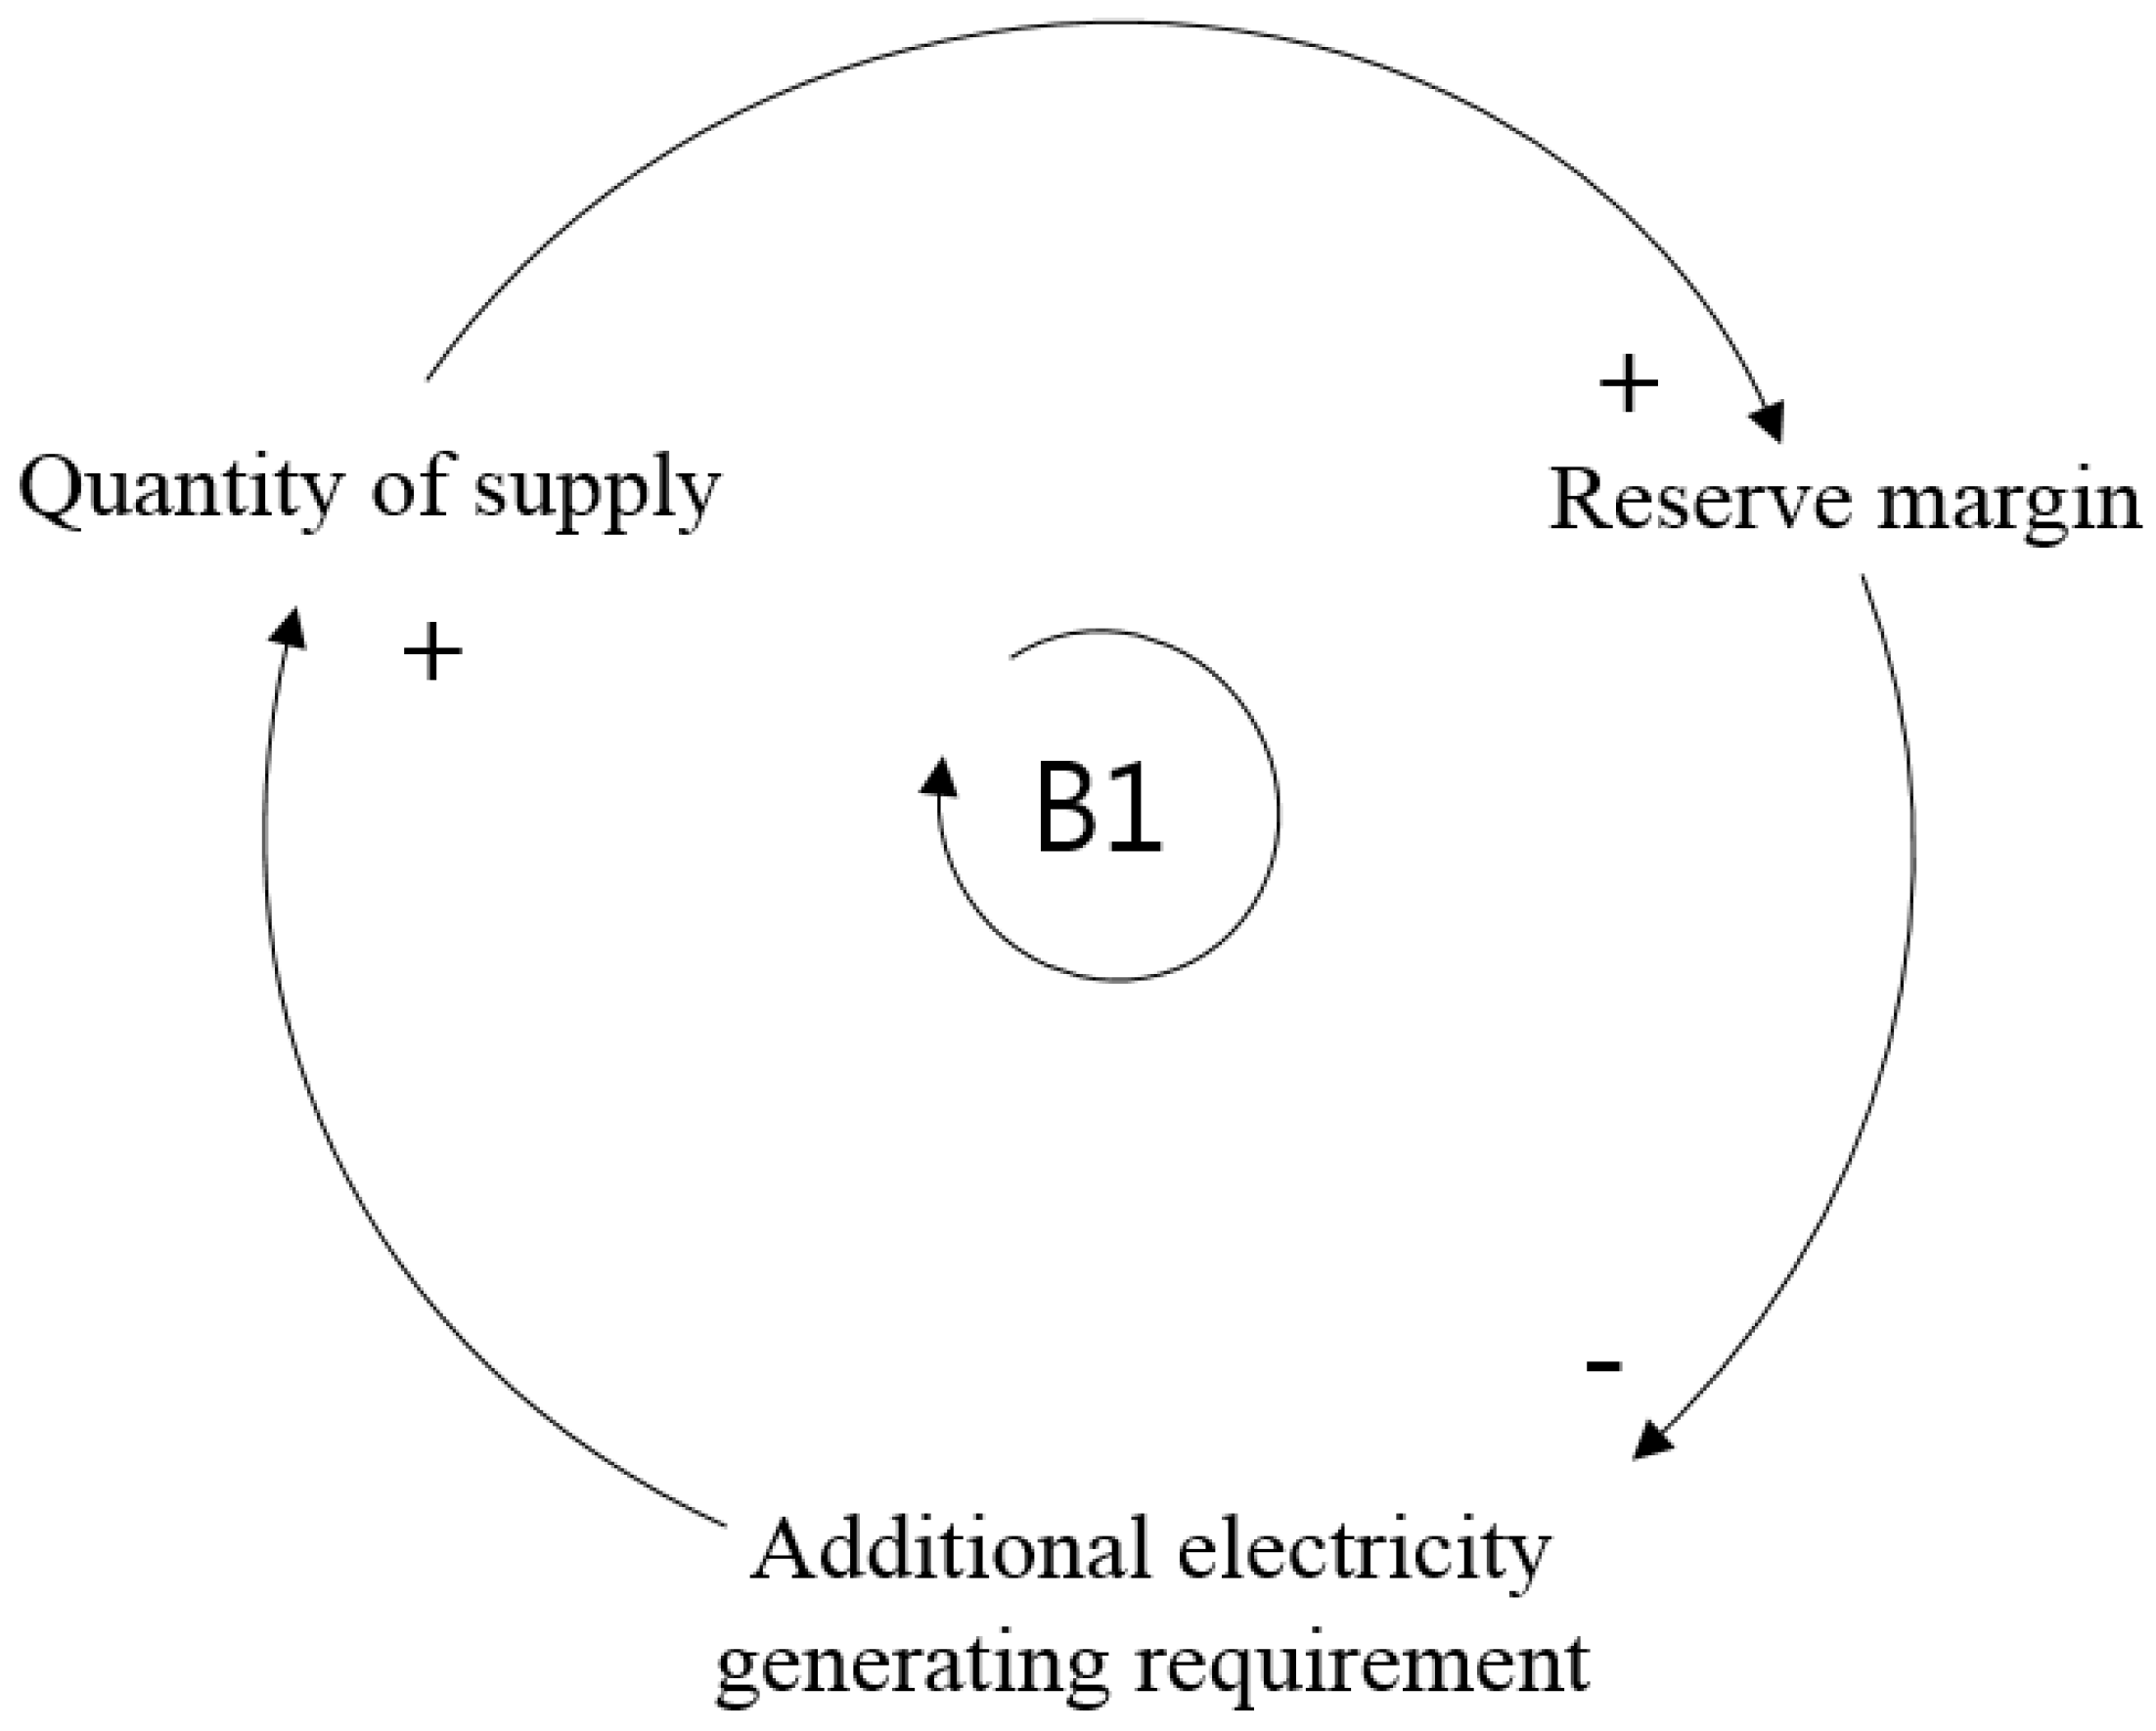
If the reserve power drops to between 3–4 million kilowatts (kW), it will be possible to secure the available capacity and to produce additional power. It is known that the reserve power level falls to this level frequently due to seasonality. Such a mechanism is shown in the causal loop below, (refer to
Figure 1).
In the B1 loop, it can be seen that a stable negative loop can be formed since there is a demand for additional power generation according to the power reserve ratio, which in turn affects the power supply and eventually changes the power reserve ratio. That is, if the power reserve ratio is high, the demand for additional power generation is reduced, the amount of power supply is decreased, and it causes the power reserve to be small. On the other hand, if the power reserve ratio is low, the demand for additional production of electric power in the industrial and household sectors may increase. Therefore, additional power needs to be produced, which means that the supply in the electricity market will increase. As the power supply increases, a stable and virtuous cycle in which the power reserve ratio increases will continue.
3.2. Power Consumption
In Korea, household electricity demand grew at an annual average rate of 9.7% until the 2000s, but remained at an average rate of 5.2% overall until 2010. However, in the last five years, the increase was only 0.5%. That is, the use of electric appliances has increased due to rapid economic growth and improved income levels. However, as the recent increase in electric power facilities and the stable supply of electric power are ensured, the balance between total electric power demand and supply is gradually becoming stable. However, demand for electricity in the summer and winter months, which are the highest power-consuming seasons, has been increasing year by year due to the increase in income and the use of heating and cooling equipment in the winter season [
20] (refer to
Table 2).
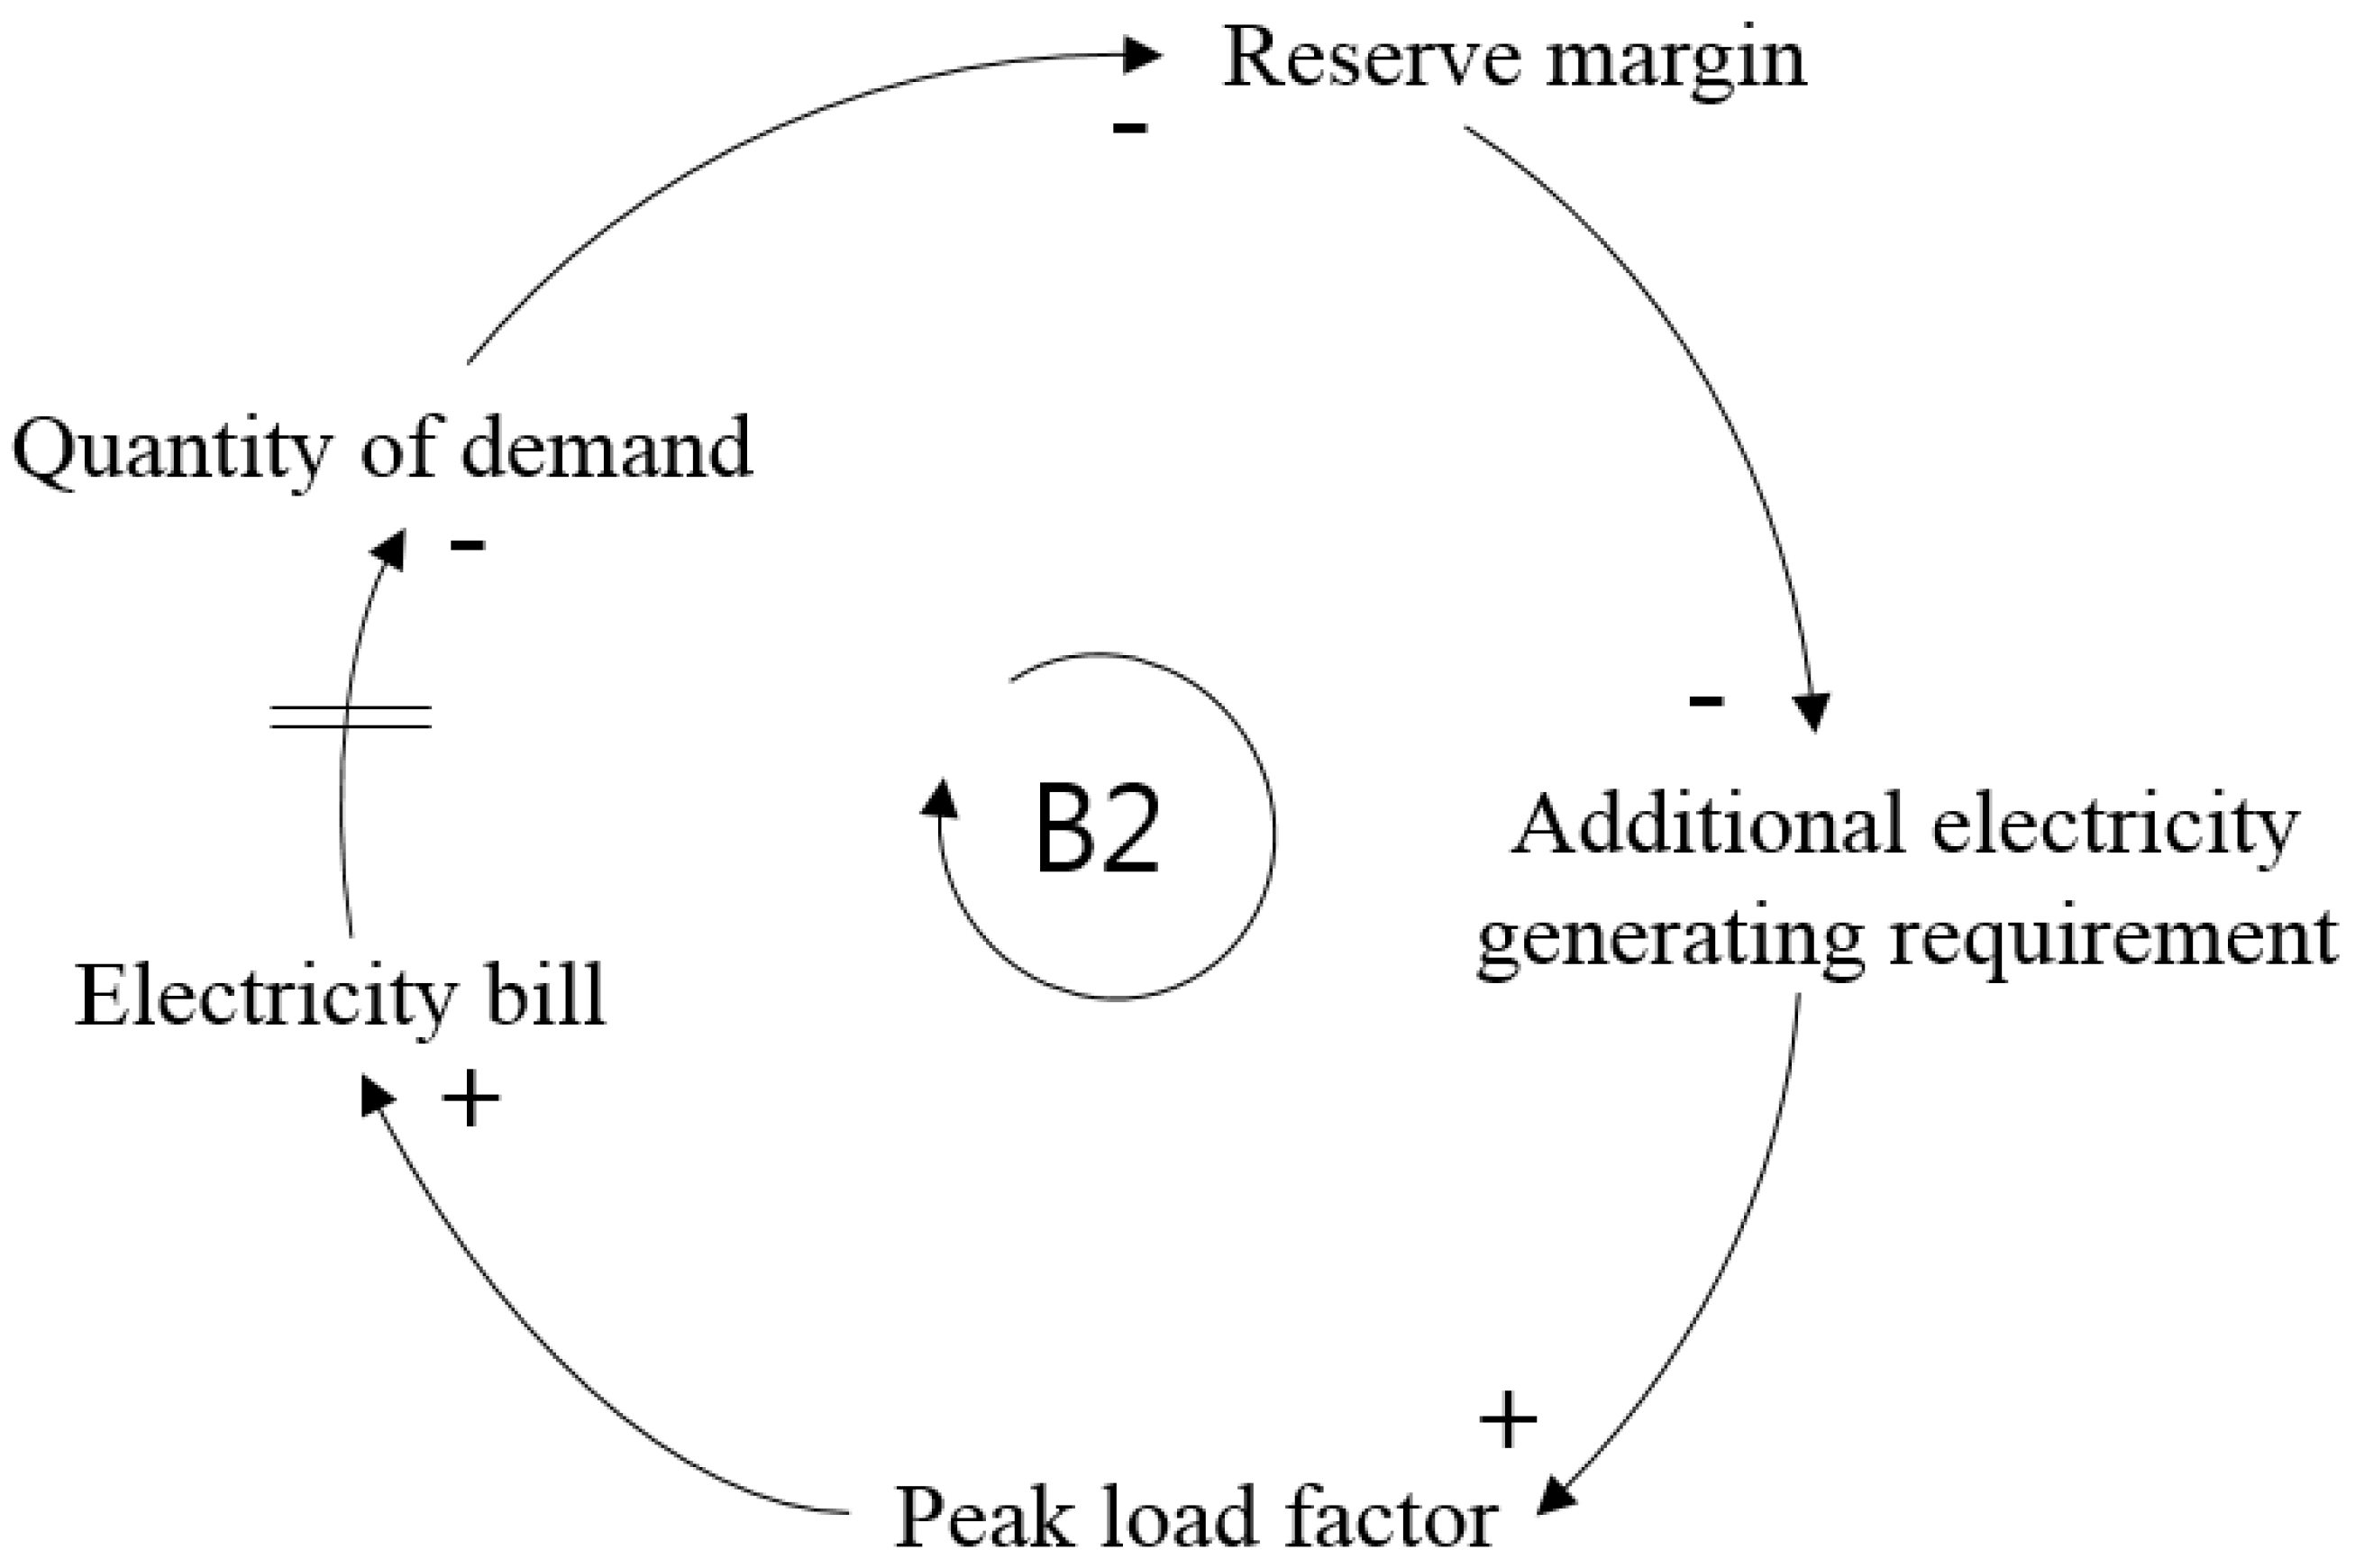
Power demand is steadily maintained even during periods of rapid increase in demand because power facilities that can maintain a reserve power of more than 15%, are already installed and operated in advance. Securing sufficient reserve power is a basis for the stable supply of power even when the peak load due to rapid power demand changes. The power reserve ratio is affected by demand. If the demand for electric power is high, the power reserve ratio is low. Conversely, if the electric power demand is low, the power reserve ratio is high. In other words, as in the case of power supply, whether additional production of electric power is required is determined by the increase or decrease in the reserve power rate, and the level of electric charges is determined according to the degree of peak load rate. This power consumption mechanism can be explained, as in
Figure 2.
The B2 loop represents a causal relationship between changes in power reserve ratios affecting peak load ratios and changes in the electricity bill, and the ultimately changing demand for electricity. Decreasing the power reserve ratio increases the demand for additional power production to cope with unexpected situations, such as power outages. Therefore, if additional power is generated, the peak load ratio will be higher than the existing equipment, so the electricity bill will increase relatively. In other words, a lower reserve margin brings a higher peak load factor because, we should generate more electricity to prevent the blackout. As a result of this, the demand for electricity is reduced, so that the power reserve ratio becomes higher. This leads to a balanced loop in which the overall power demand relationship is stabilized.
3.3. Problems of Power Supply and Demand
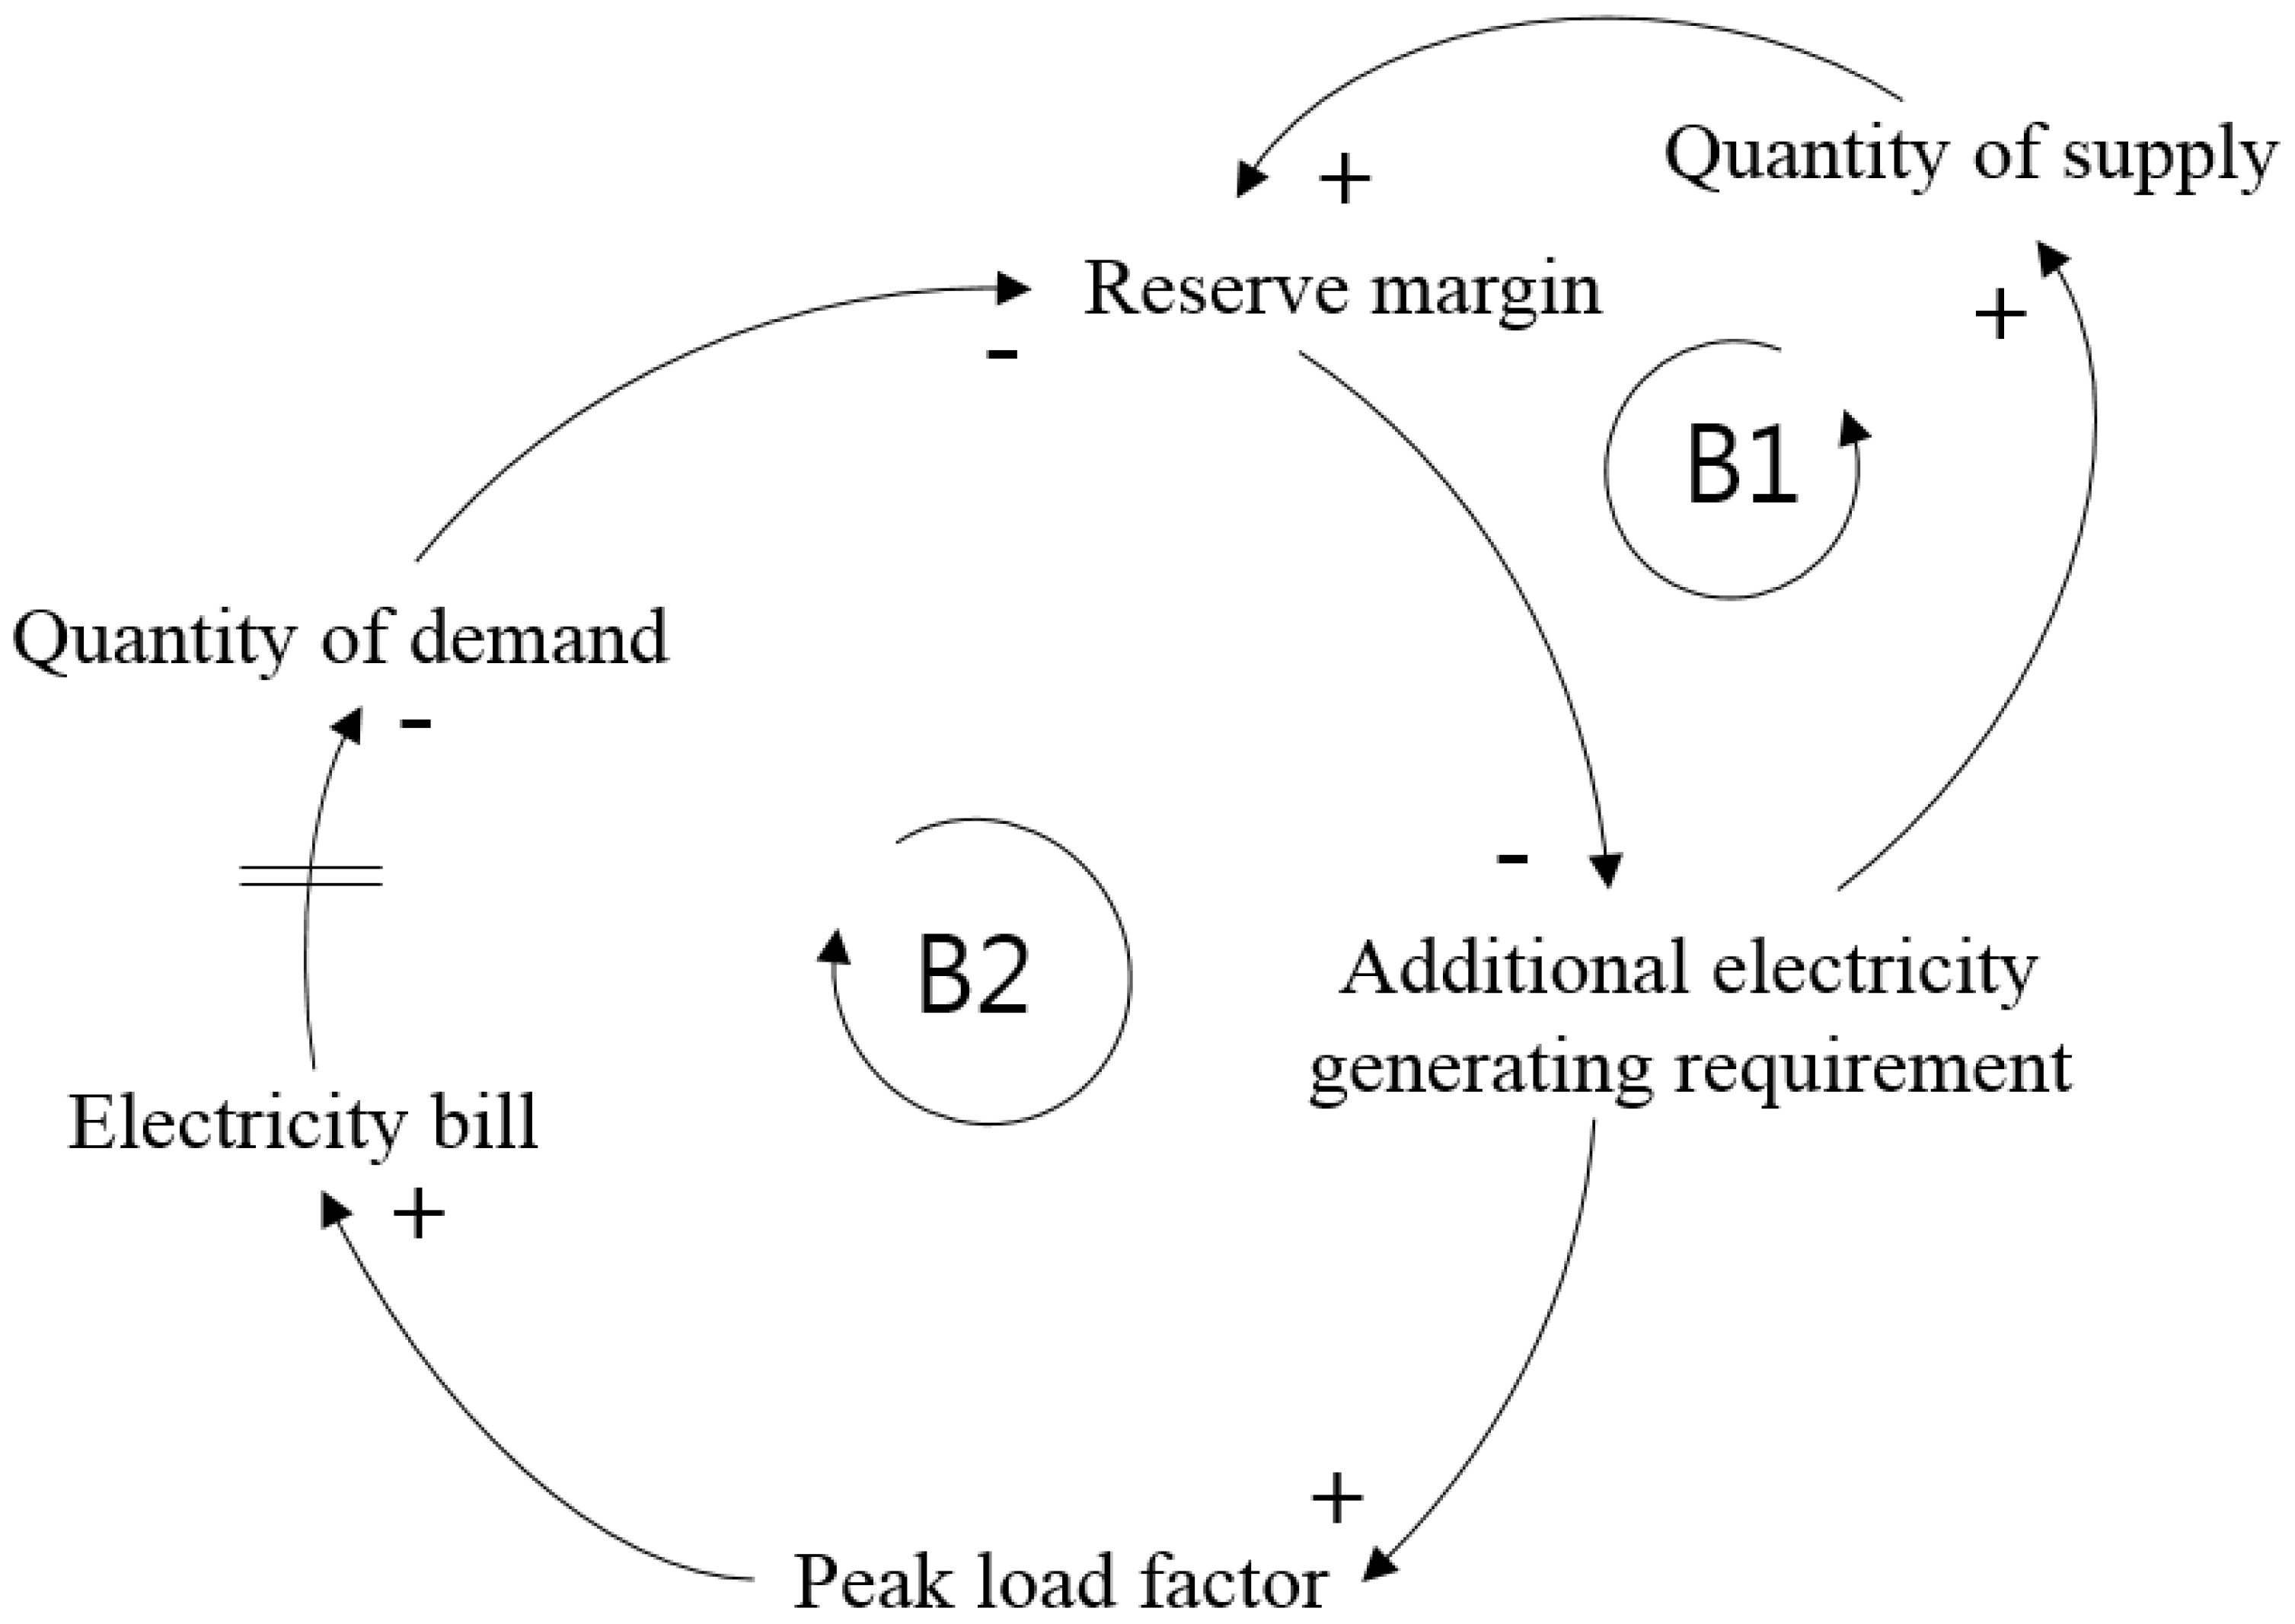
The individual causal relationship between power supply and demand has a feedback structure in which the system is stabilized at a certain target value, so that the power reserve ratio of the supply is stable and the electricity price of the demand is stable. In other words, the power supply and demand have a negative feedback structure in each system, and have a stable causal relationship that does not spread to either side.
However, the information delay between the electricity demand and the electricity bill makes it difficult for the consumer to get enough decision time to balance the B2 loop. In other words, it is difficult to maintain a stable electricity bill due to information delays in relation to electricity demand and the bill.
Figure 3 shows the causal relationship of power supply and demand, in the overall power market.
When we look at the causal relationship between the supply and demand of electricity, each loop is balanced as a negative feedback structure. However, since the information is delayed, the consumer recognizes the electric charge only after a certain period of time, which makes it difficult to immediately apply the appropriate amount of demand. Therefore, an unnecessary surplus or an insufficient amount of power is generated without predicting the demand quantity in advance, and inefficient power supply and demand can be achieved. As a result, there is a problem that the balance of power supply and demand is broken and it becomes difficult to stably maintain the power reserve ratio.
4. Improvement
For a long time, the Korean government has been conducting various studies on the development of related technologies and industry upbringing to improve energy efficiency. Various technologies have been developed to help rational interaction between power generation and consumption, and efforts are being made to study ways to conserve energy for efficient power generation. This is because most of the energy sources depend on imports, with 97% dependence on energy imports [
21]. Therefore, to reduce high energy consumption, it is important to identify the cause of power waste and find out improvement measures and practice them. HEMS, one of the products utilizing smart grid technology, can provide real-time information of electricity prices to the existing power grid, and can help to control power consumption by itself. Therefore, when these characteristics are utilized, it is a product that can solve the inefficiency problem of power supply and demand [
22].
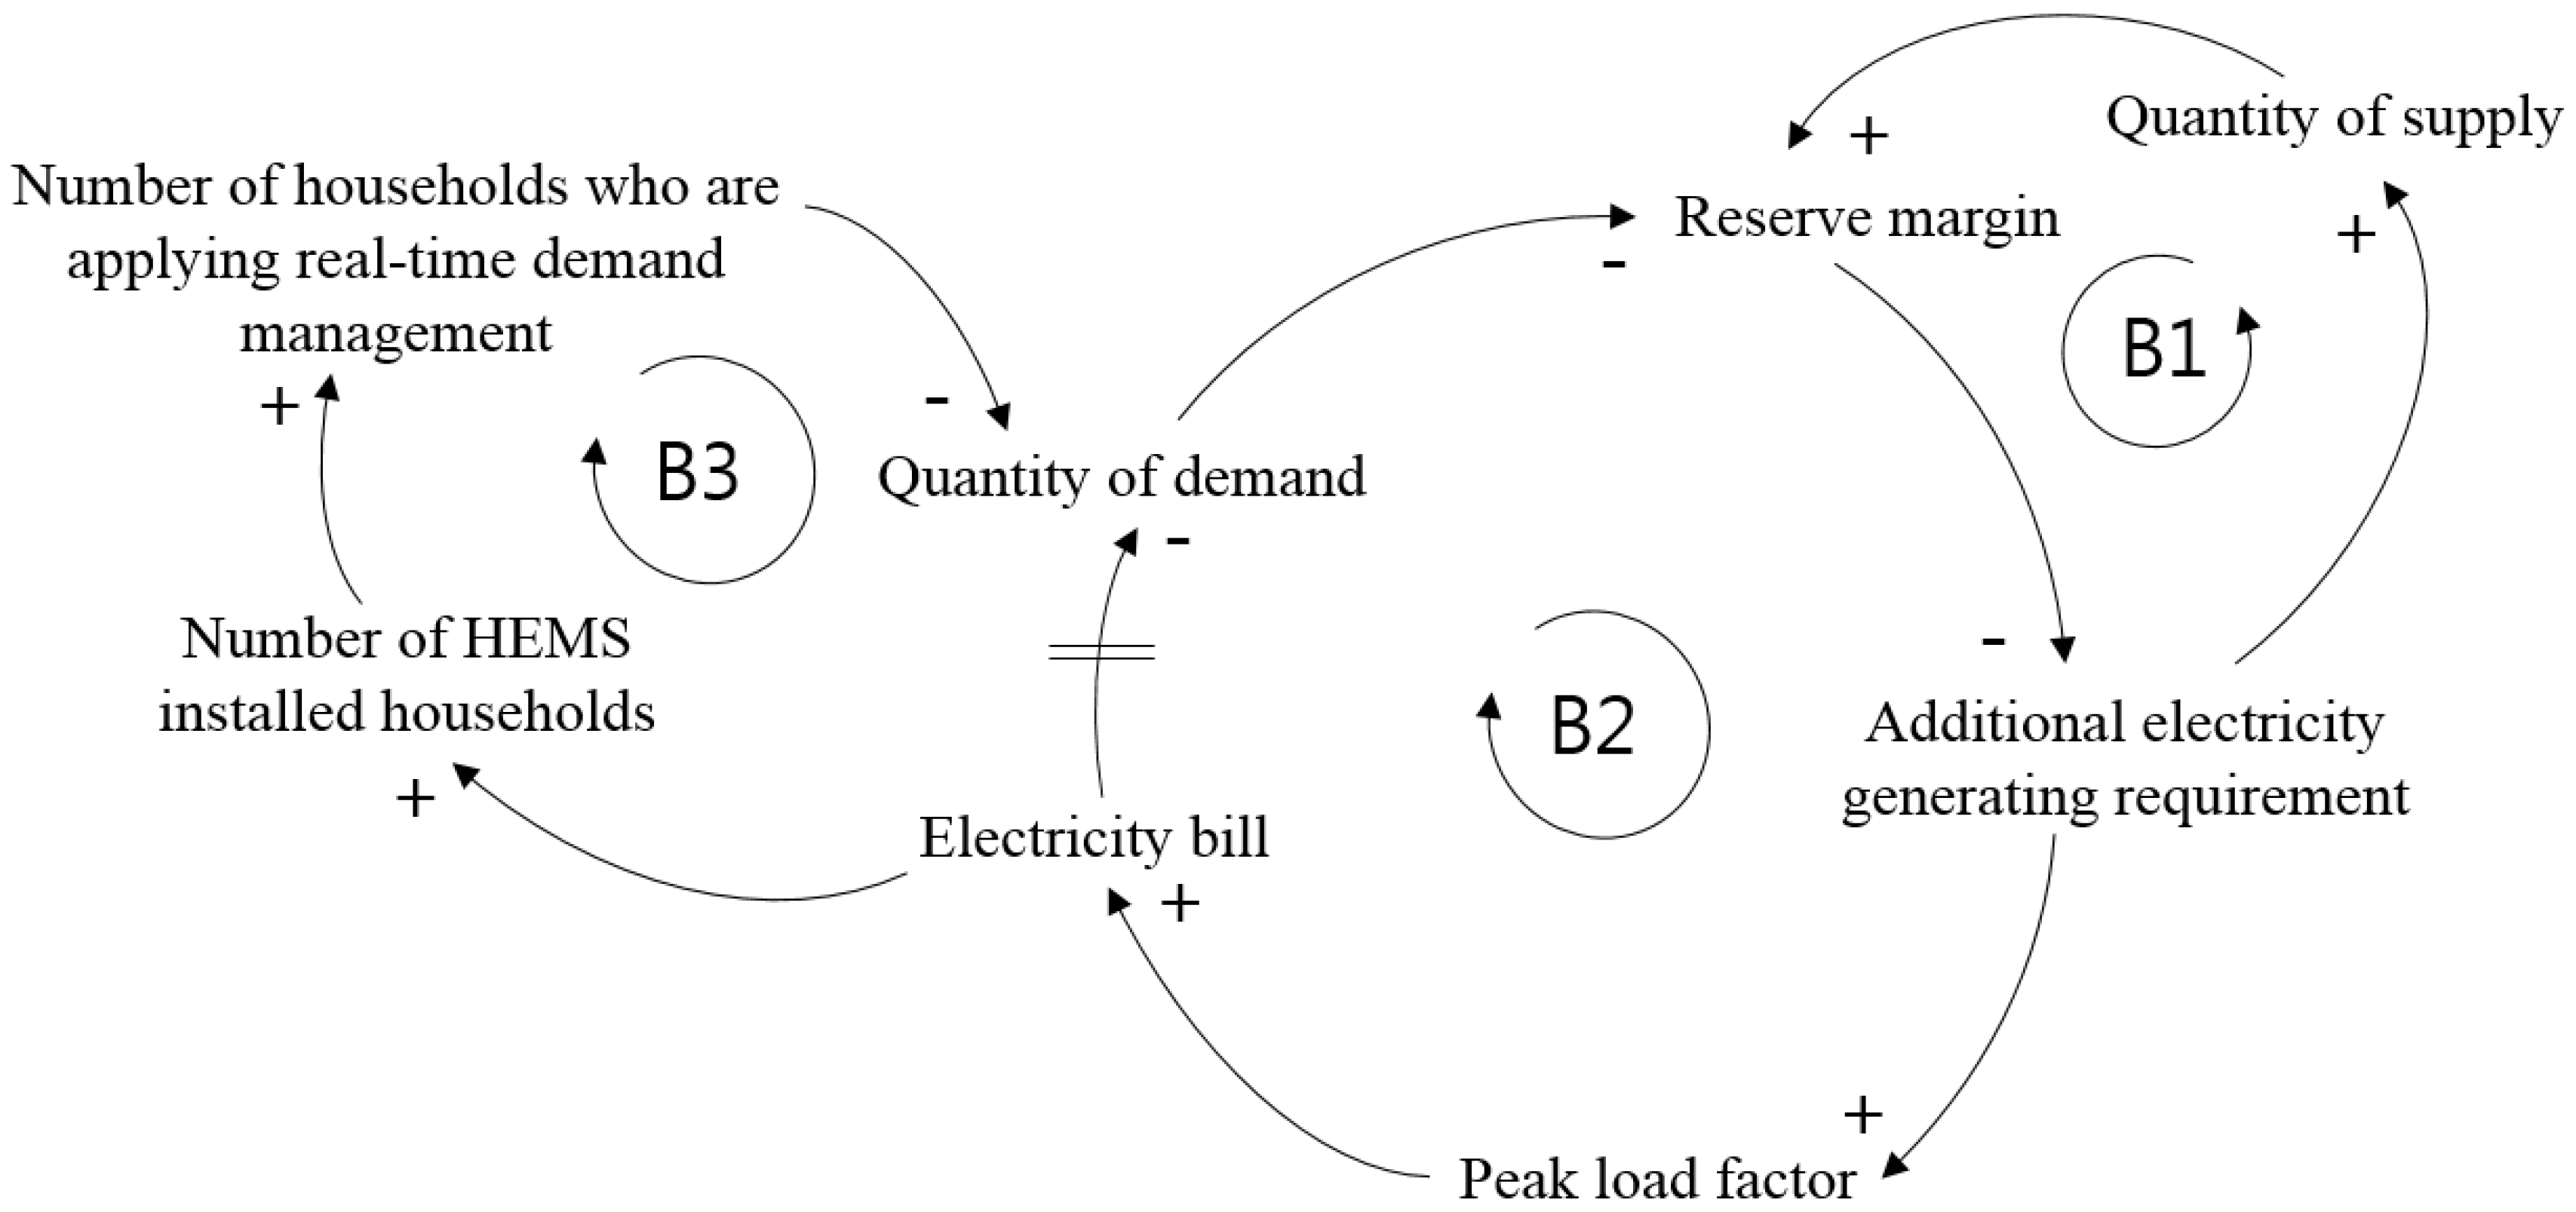
When we look at the power supply and demand systems, we have found that they have a stable feedback structure. However, in the electric power market, it was found that the problem occurred due to the delay of information on the electricity rate. To overcome these problems, the introduction of HEMS is needed and the causal relationship with the effects of HEMS on the whole system, is shown in (
Figure 4).
As a result of the above-mentioned causal relationship between electricity demand and demand, the management of demand for electric power was unstable due to mutual imbalances caused by the delay in delivery of the electric charge information to consumers. However, the introduction of the HEMS expressed in the B3 loop made it possible to transmit real-time information, so that demand could be adjusted simultaneously with the recognition of the electricity bill. In other words, based on the result of collecting real-time electric power usage information derived through HEMS, it is possible to provide a condition for the consumer to perform active demand management on their own. Based on the electric power demand data collected by HEMS, Korea Electric Power Corporation (KEPCO) can adjust the supply amount by reducing the error of power demand prediction. In addition, it is possible to stabilize the power supply and supply by balancing the power generation and demand through adjusting the peak load ratio to secure the power reserve ratio. Based on the effects of HEMS, we can see a new causal relationship that can solve the existing power supply and demand problems.
5. Conclusions
In this study, the effects of HEMS using smart grid technology on power supply and demand were analyzed using system dynamics. The results of the study are summarized as follows.
First, we found that electricity demand is not stable because electricity bill information is not transmitted to electric power users immediately. This problem can be overcome through the introduction of HEMS, which informs the amount of electric power usage information and electric charges in real-time through the causal loop.
Second, in terms of power supply, we examined the ability to reduce the supply−demand error by determining the amount of power generation using the electricity demand data collected through HEMS. In addition, we looked at the positive aspects of saving unnecessary costs by preventing additional installation of unnecessary power facilities.
Since HEMS can inform consumers of the electricity bill information in real-time, the consumers themselves can control their power demand effectively. In addition, by introducing HEMS, KEPCO can reduce the error of power generation based on real-time data on power demand and reduce unnecessary power installation costs.
As a conclusion, HEMS has proven to be a useful system for both power producers and consumers. HEMS with these advantages, is made possible because it enables real-time sharing of information using smart grid technology. Therefore, in order for HEMS to be successful, many consumers should adopt and use the system, and KEPCO needs to share their proprietary power usage information with consumers. In other words, open thinking with an open innovation-level information sharing system is needed, rather than owning proprietary information [
23,
24,
25,
26,
27,
28].


