Article

Wind Energy Potential of Gaza Using Small Wind Turbines: A Feasibility Study

1
Department of Engineering, Palestine Technical College, College street, 920, Deir El-Balah, Gaza Strip, Palestine
2
Department of Agricultural Economics, Humboldt-Universität zu Berlin, Philippstr. 13, 10115 Berlin, Germany
*
Author to whom correspondence should be addressed.
Energies 2017, 10(8), 1229; https://doi.org/10.3390/en10081229
Submission received: 20 July 2017 / Revised: 11 August 2017 / Accepted: 14 August 2017 / Published: 18 August 2017
(This article belongs to the Section L: Energy Sources)

Abstract

:
In this paper, we conduct a feasibility study of the wind energy potential in Gaza, which suffers from a severe shortage of energy supplies. Our calculated energy harvested from the wind is based on data for a typical meteorological year, which are fed into a small wind turbine of 5 kW power rating installable on the roof of residential buildings. The expected annual energy output at a height of 10 m amounts to 2695 kWh, but it can be increased by 35–125% at higher altitudes between 20 m and 70 m. The results also depict the great potential of wind energy to complement other renewable resources such as solar energy: the harvested energy of a wind system constitutes to up to 84% of the annual output of an equivalent power rating photovoltaic system and even outperforms the solar energy in the winter months. We also show that one wind turbine and one comparable photovoltaic system together could provide enough energy for 3.7 households. Hence, a combination of wind and solar energy could stabilize the decentralized energy production in Gaza. This is very important in a region where people seek to reach energy self-sufficient buildings due to the severe electricity shortage in the local grid.

1. Introduction

During the last decade, renewable energies have witnessed a great deal of importance worldwide: renewable power capacity doubled from 1010 GW in 2007 to 2017 GW in 2016 with installed wind energy capacity increasing from 95 GW to 487 GW and installed solar capacity increasing from 7.8 GW to 303 GW in this period [1,2]. Currently, Gaza is also witnessing a spread in the use of photovoltaic power systems due to the sunny weather conditions, but the use of wind power systems is currently rare in the Gaza Strip [3,4].
The Gaza Strip has an increasing demand for electrical power with an increasing shortage of power supplies. The Gaza Strip is a coastal strip and it is part of the state of Palestine located on the eastern coast of the Mediterranean Sea. Gaza constitutes the Southern Palestinian governorates, which also includes the West Bank as northern governorates. The Gaza Strip is 41 km long, and from six to twelve kilometers wide, with a total area of 365 square kilometers and more than 1.85 million inhabitants, Gaza is among the regions with the highest population density in the world.
In 2009, Gaza’s total demand for power, according to estimates by the Gaza Electricity Distribution Co. (Gaza, Palestine), is 244 MW [5]. However, even when the only power plant is running, Gaza obtains, at most, only 198 MW from all power supplies. The working power plant contributes about 60 MW [5]. Another 121 MW are brought in from Israel (but only if all 10 feeding lines are in good order), and Egypt powers the Southern Gaza city of Rafah with another 17 MW. Therefore, the deficit under the best circumstances is 18%. According to a UN report from July 2017, Gaza’s energy crisis has worsened: the electricity demand in 2017 amounts to 450 MW, whereas only 120–142 MW are supplied due to a halt of the power plant, leading to a deficit of more than 68%. Under different growth and energy supply scenarios, energy deficit projections for 2020 range between 29% and 75% [6].
Adding to the complexity, the “grid” is not actually integrated, meaning that power from Egypt, Israel, and the power plant cannot be diverted within Gaza to make up for losses in another part. That means, for example, if the power plant stops working, electricity from Egypt cannot be rerouted to Gaza City [5]. The grid has an average blackout schedule of at least 12 h daily. With the current grid infrastructure, it is impossible to feed it directly with renewable electricity generated by individuals using solar or other renewable sources. Therefore, the typical solution would be to develop self-sufficient energy supply systems. This solution can be realized through a hybrid power system composed of solar panels and/or wind turbines, battery banks, and inverters. Wind energy is one of the most promising clean energy sources that developing and developed countries are seeking to harvest to reduce dependence on non-renewable sources of energy [7,8].
Despite its current low use, wind energy has a promising future in Gaza for the following reasons:
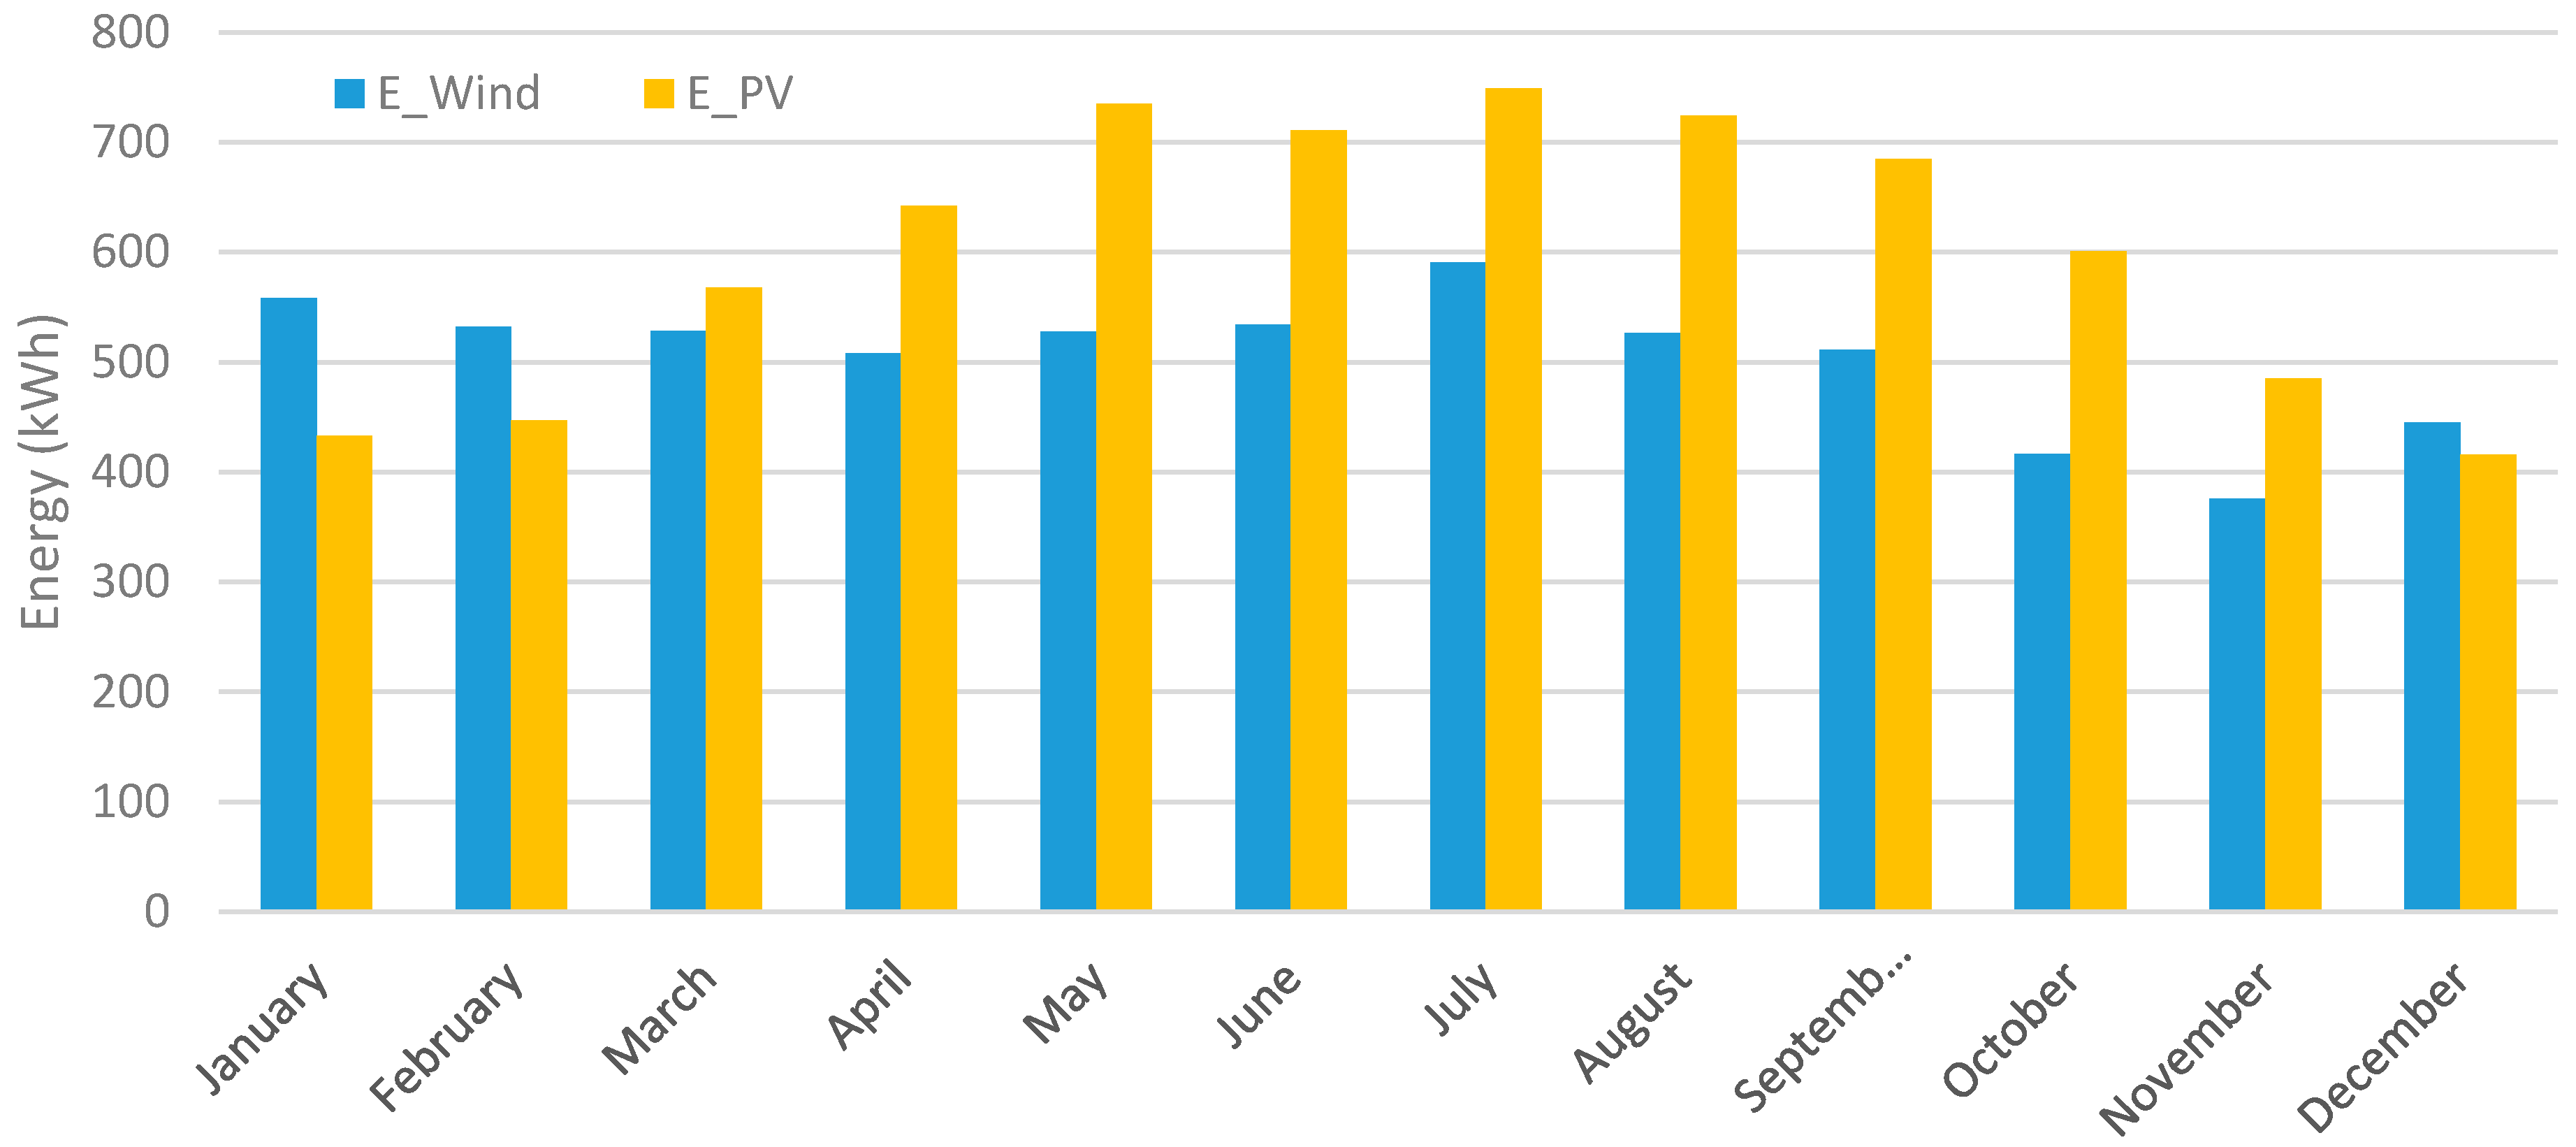
  • Solar energy is not enough alone to supply the needed energy, especially during the night and in the short gray days of winter. Moreover, according to local weather statistics, wind speed increases in winter, so that solar energy and wind energy can complement each other.
  • Photovoltaic modules are not cheap, roughly 1.2 USD $/Wp, and their manufacturing technology is complicated (Wp denotes peak power and it is used in photovoltaic systems to describe the power rating of installed solar panels. The subscript p is to differentiate it from measured power). Small wind turbines, in contrast, have a rather simple manufacturing technology and can be completely manufactured in Gaza. Therefore, wind turbines could have lower costs than solar panels in terms of $/W if manufactured locally. Moreover, manufacturing itself contributes to the local economy.
  • Due to the high population density, Gaza city is full of high-rise residential buildings. The majority of the buildings are restricted to five floors as regulated by the local municipality. Therefore, the majority of the city areas will access unobstructed wind at nearly the same height since the land is flat. The height of the buildings of around 50 m and the installation of the turbine on a metal pole allow for wind turbines installed at higher altitudes. All of the roofs in Gaza are flat and, therefore, the installation is possible and technically stable due to the concrete building structure. Although the wind speed is not that high at low altitudes, we expect it will be more efficient at higher altitudes. This issue will be investigated deeply in our research.
  • Wind turbines require less land area, which is restricted to the metal pole and, therefore, they fit the small land area of the Gaza Strip.
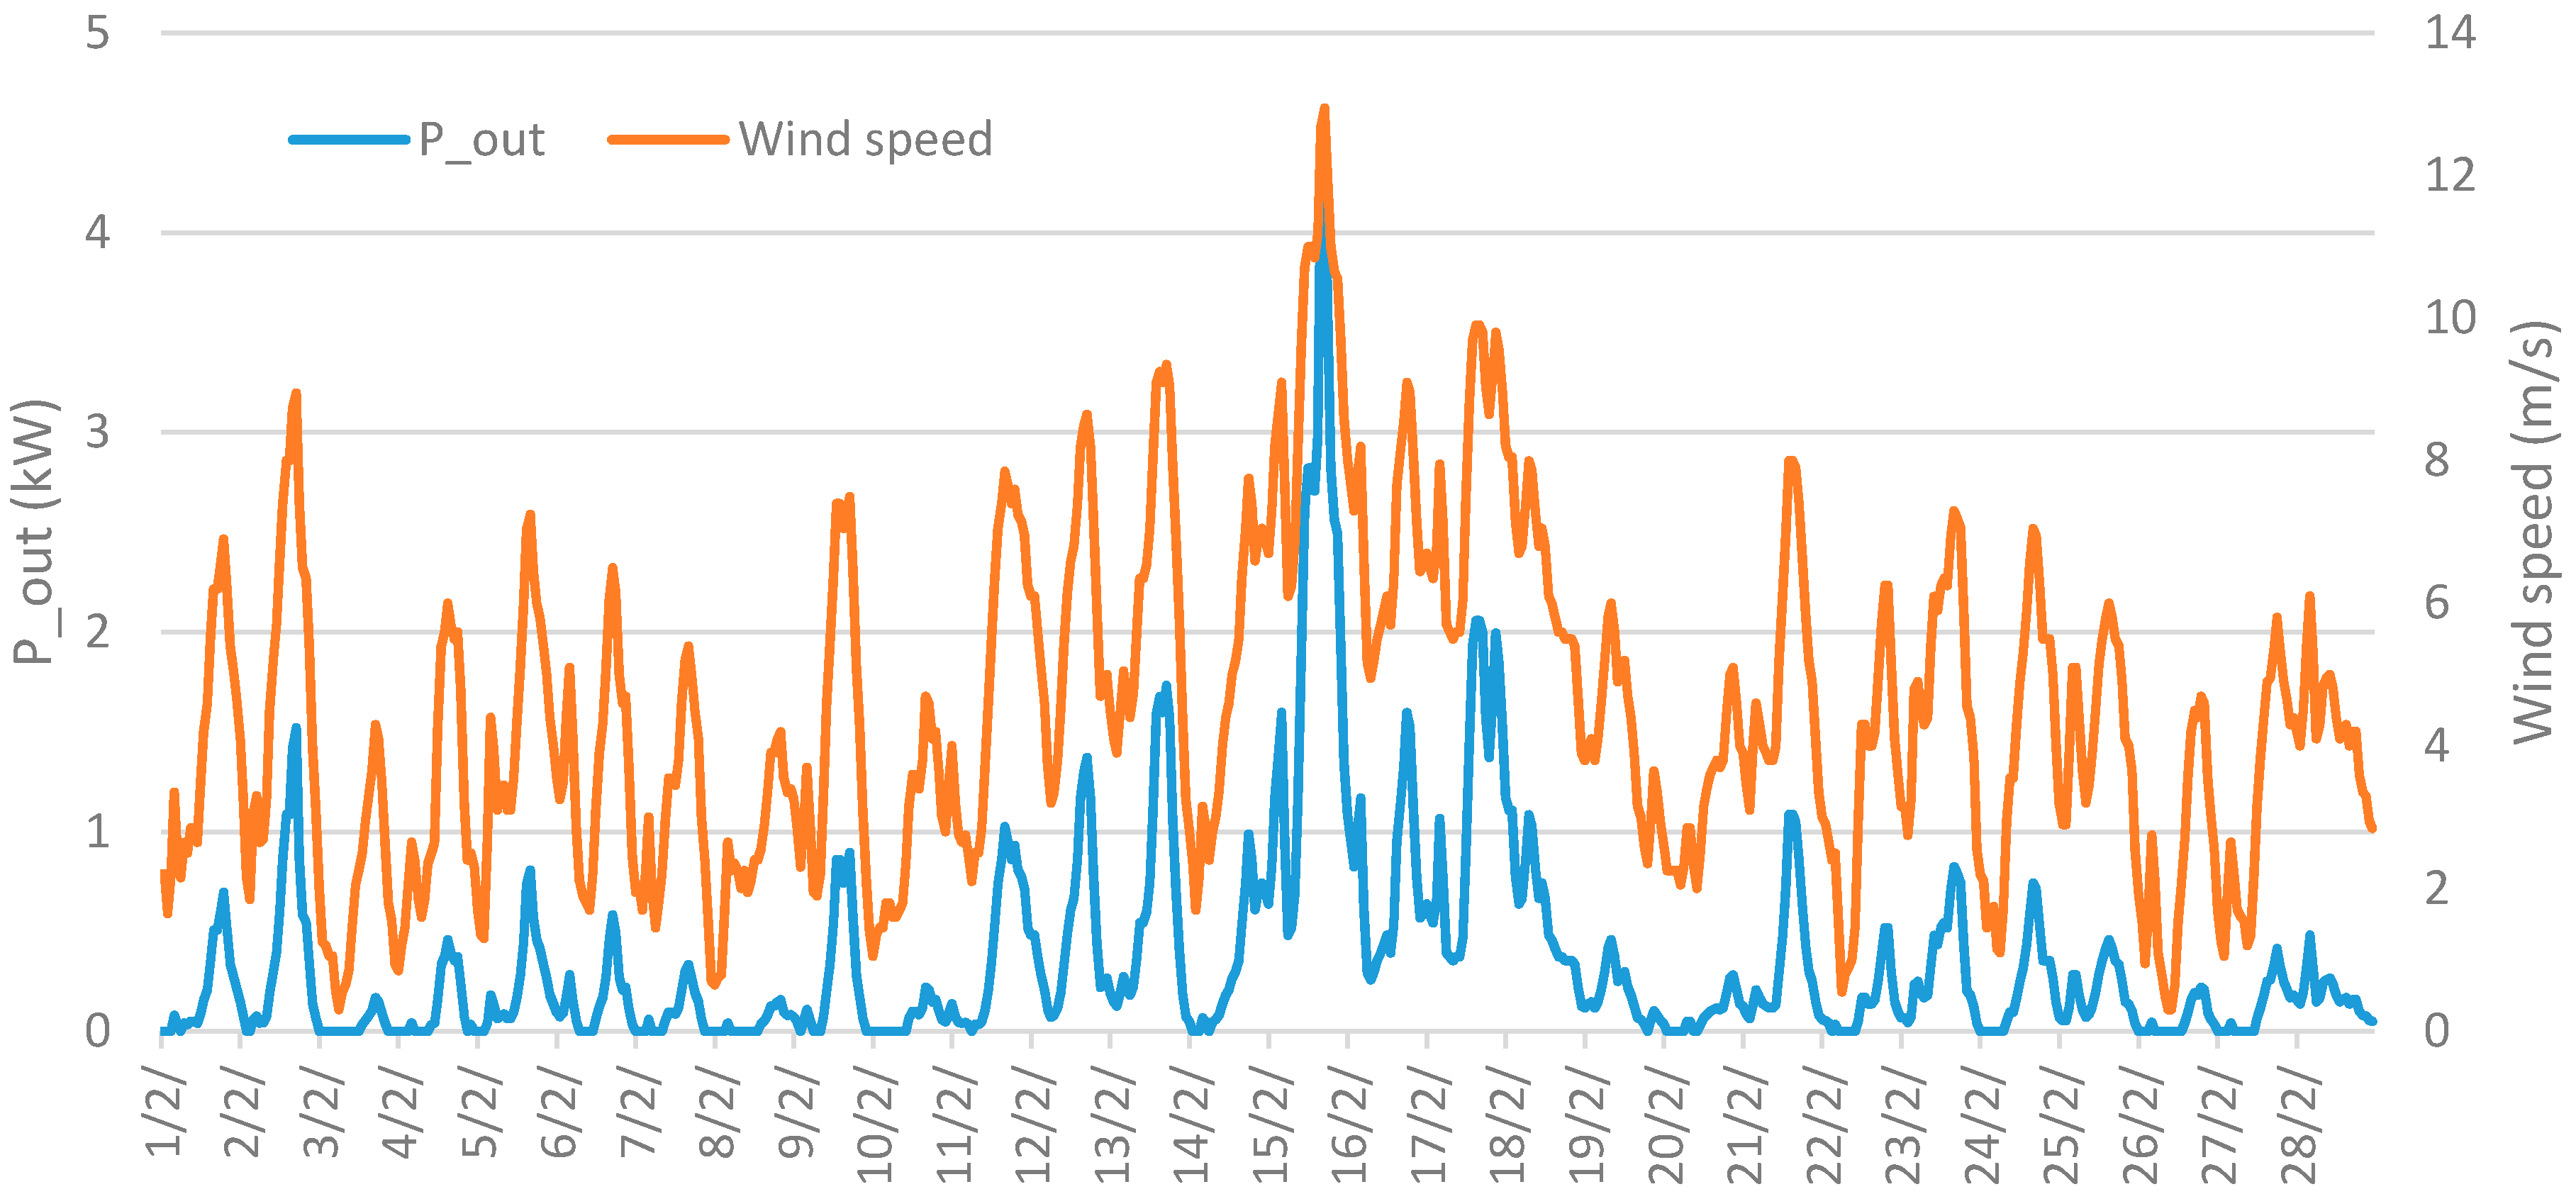
In this paper, the possibility of using small wind turbines in Gaza to harvest wind energy is investigated theoretically and by simulation using TRNSYS software through finding wind speed, maximum power produced by the wind turbine, and the actual turbine power. We base our analysis on the specifications of the proposed WTT 5000S (small) wind turbine. The goal is to explore the use of wind energy in dense urban areas and to evaluate the performance of a small wind turbine at different altitudes on top of residential buildings based on its output power and the total generated energy. Moreover, the potential to complement solar energy and to meet the household energy demand is assessed.

2. Climatic Data

Gaza is located on the western edge of the Asian continent and the eastern extremity of the Mediterranean Sea at 31.5° N latitude and 34.47° E longitude [9]. Due to its location as a narrow strip adjacent to sea, it is exposed to stable wind patterns during the whole year, as far as small wind-energy systems are concerned [10]. Moreover, this location, as a residential area, makes it a good candidate for exploiting wind energy for home usage to solve energy shortages.
The climate database is constructed based on Meteonorm software (Meteotest, Bern, Switzerland, meteonorm) for the period from 1991 to 2010. Meteonorm provides hourly data for a ‘typical meteorological year’ based on nearby weather stations and stochastic weather generators (details can be found in [11]). Since there is no typical meteorological year data for Gaza, specifically, we will rely on Ashdod climatic data due to the similarity between these two cities. Ashdod is only 30 km away from Gaza, located also in the coastal plain of the Mediterranean Sea at the same elevation, so they have comparable climatic conditions. This makes it a reasonable candidate for Gaza wind data in other studies, as well (e.g., [9]).
Figure 1 depicts the histogram of wind speed data at 10 m height for a typical meteorological year. It can be noticed that the wind speed can reach above 13 m/s for a few hours in certain days. In Figure 2, the wind situation is summarized through a wind rose. Most of the times, wind comes from the sea, this means from between south-southwest and north-northwest. Most of the wind speeds lie between 2 and 6 m/s. Figure 3 shows the monthly means of wind speed. It becomes clear that the average monthly speed mostly exceeds 4 m/s, except for October and November. The highest average wind speeds are achieved in February and September.

3. Methodology

3.1. Wind Harvesting System Basics

The wind turbine used for harvesting wind energy needs to be mounted at a relatively large height above the ground to avoid local obstacles. To overcome the intermittency of wind energy, harvested energy is stored in battery banks and a DC/AC inverter is used to convert it to AC electrical power. Home wind turbines consist of a rotor, a generator mounted on a frame, and (usually) a tail. Through the spinning of turbine blades, the rotor captures the kinetic energy of the wind and converts it into rotary motion to drive the generator. The rotor can have two, three, or more blades, but the most common rotors have three blades. The input power that is fed to the turbine is proportional to its swept area, which is proportional to the blade diameter. Details about the structure of wind turbines can be found in [12].

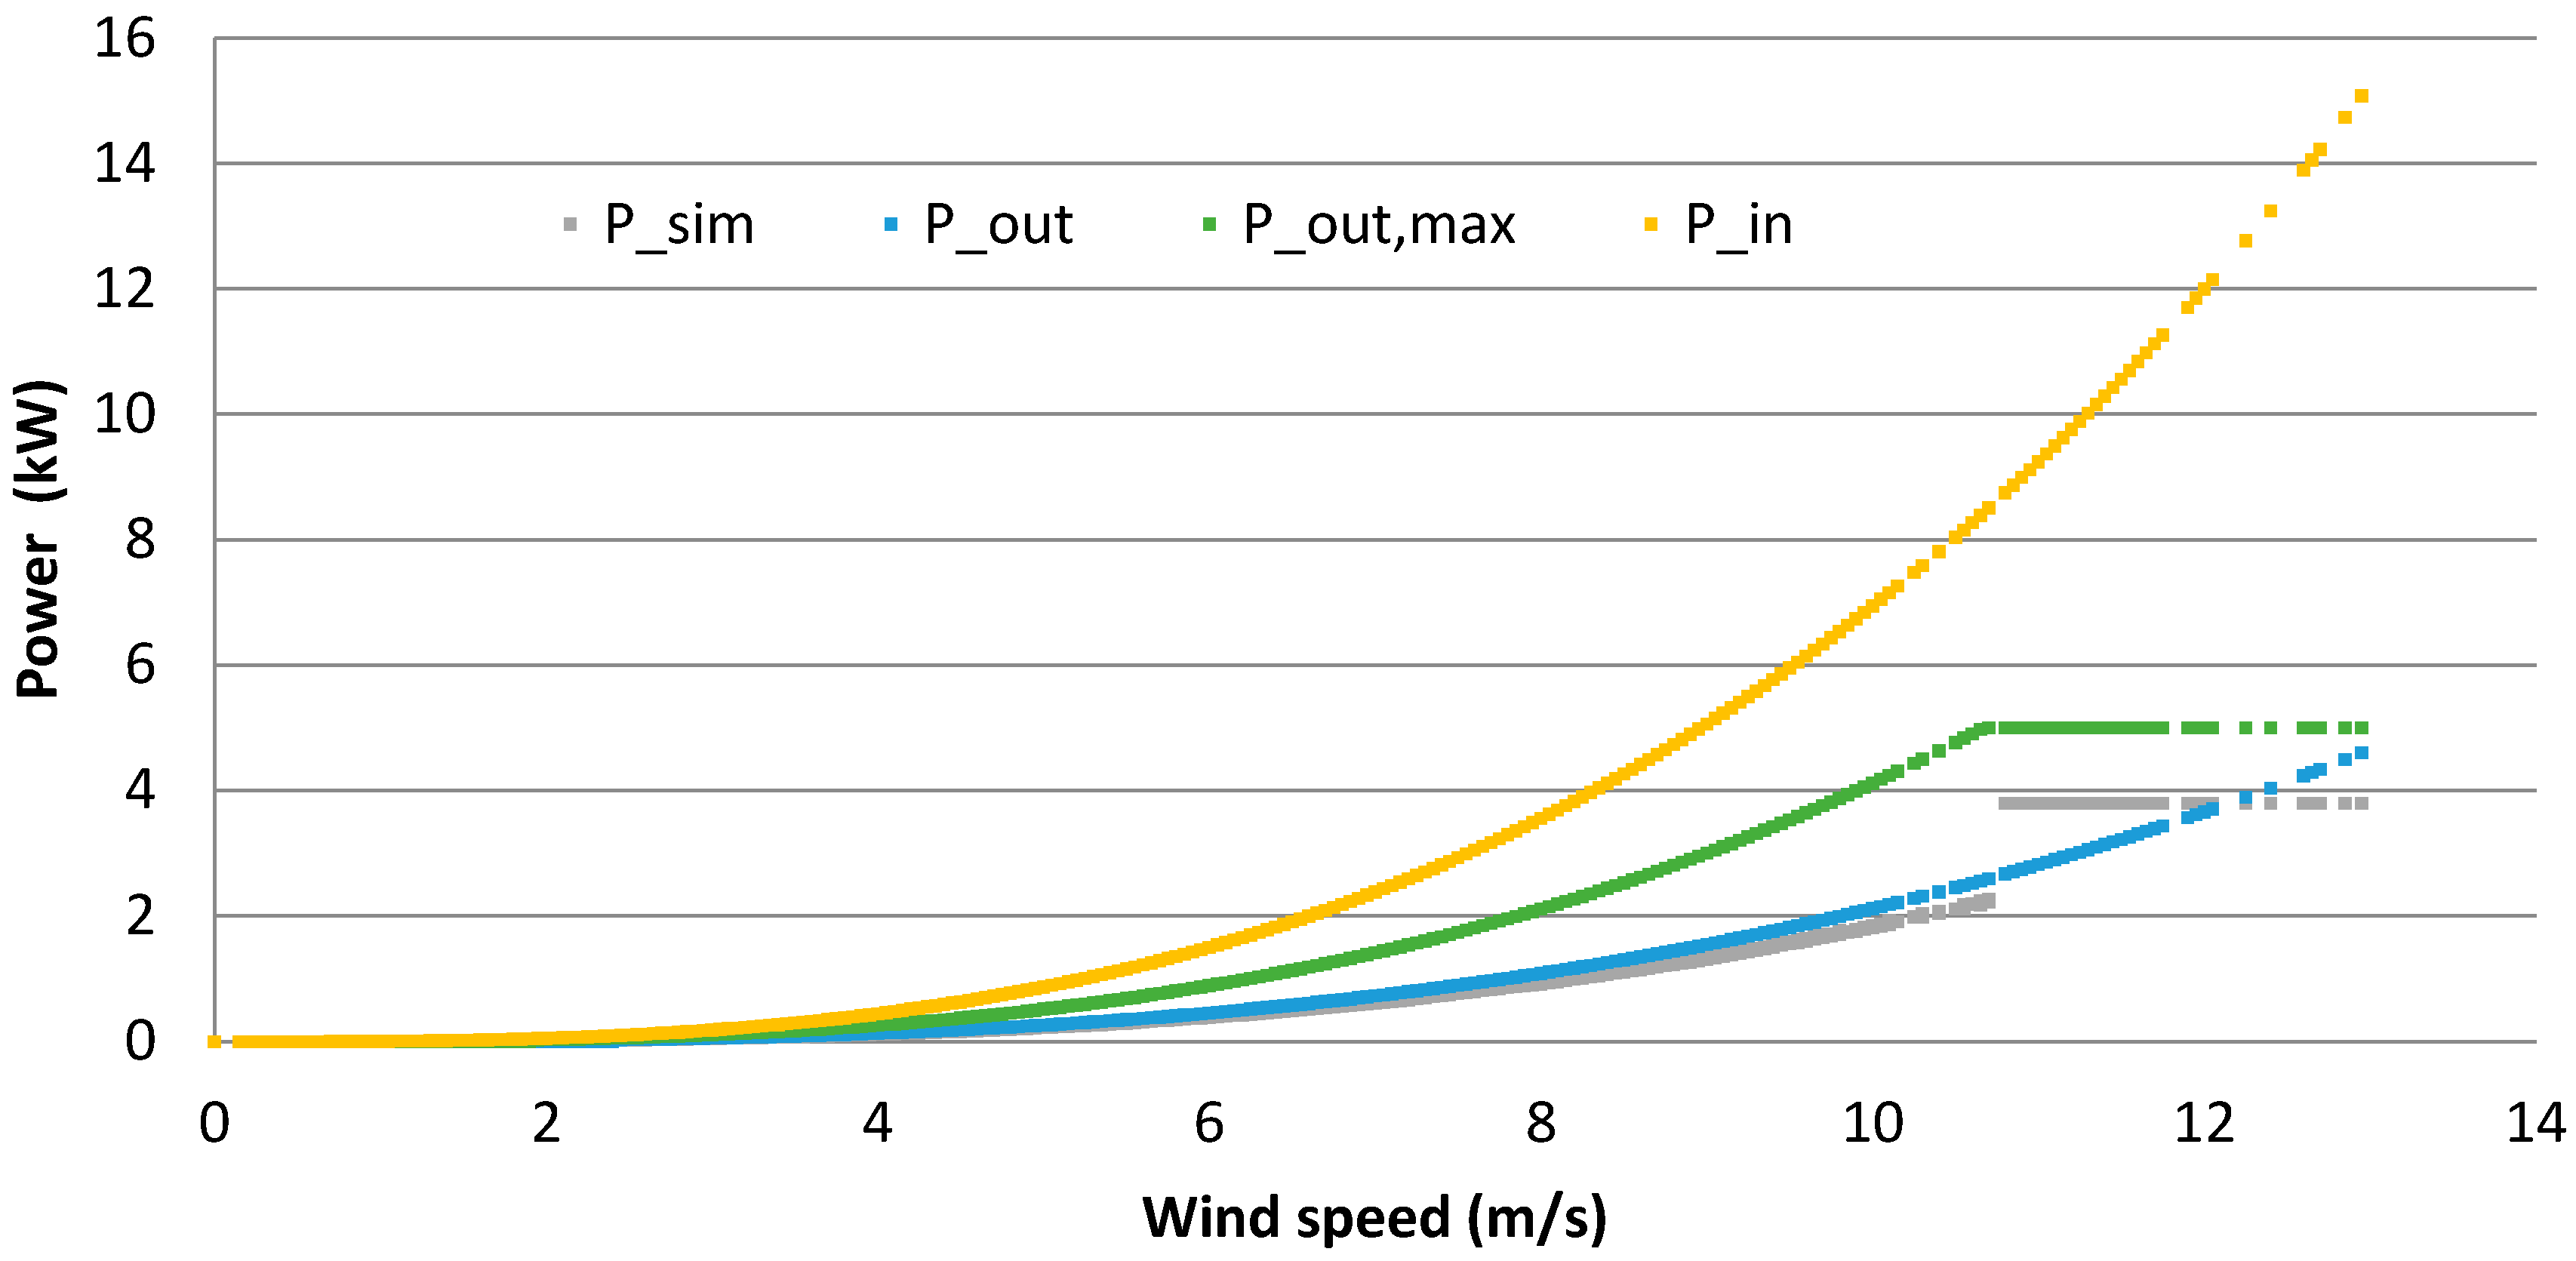
3.2. Theoretical Analysis: Wind Turbine Coefficient and Power

The efficiency of the wind turbine is referred to as power coefficient C p , which is a measure that is often used by the wind power industry. The efficiency is a ratio of the actual electric power produced by a wind turbine divided by the total wind power flowing into the turbine blades at a specific wind speed [13]:
C p = Actual   Electrical   Power   Produced Wind   Power   into   Turbine = P o u t P i n
The wind power entering the turbine blades P i n is calculated from the following equation:
P i n = 1 2 ρ A v 3
where ρ is the air density (equal to 1.225 kg/m3), A is the swept area, and v is the magnitude of the horizontal velocity [14].
The electrical power output P o u t can be obtained through the efficiency of the turbine according to Equation (1) [15,16]:
P o u t = C p P i n = 1 2 ρ A C p v 3
The power coefficient C p can also be calculated from the following equation [13]:
C p = η b η m η e
where η b is the blade aerodynamic efficiency, η m is the mechanical efficiency, and η e is the electrical efficiency. Power flow in a typical wind turbine can be found in [13].
The Betz limit shows the maximum possible energy that may be derived by means of an infinitely thin rotor from a fluid flowing at a certain speed [17]. The power coefficient C p has a maximum value of C p , m a x =   16 / 27 = 0.593 [18]. The Betz limit describes the maximum amount of energy a turbine can theoretically extract from the wind [14]:
P o u t , m a x = 1 2 0.593 ρ A v 3

3.3. Wind Turbine Specification

The wind turbine WTT 5000S (small) produced by WTT GmbH (Reichling, Germany) and applied in this study was selected based on different criteria:
  • Output power: It fits home use as the harvested energy is in the range of the average consumption of a household;
  • Price (its price is competitive compared with others);
  • Operation speed (fits low speed as starts from 2.5 m/s until 15 m/s);
  • Efficiency is 30.5% which is relatively good; and
  • Weight and size are suitable for home installations.
Table 1 shows the specifications of the WTT 5000S (small) wind turbine [19]. According to the manufacturer, it is an extremely quiet horizontal wind turbine, low speed, movable tail fin, slip rings, aluminum housing, permanent magnet direct drive, and it comes with a high-quality power inverter. The wind turbine is designed by the manufacturer to operate at a power of about 4 kW. If a larger inverter with a power of 5.5–6 kW is used and tail fin weights (100–300 g) are added, it reaches 4.5 kW–5 kW. As an approximation for the power coefficient which, in general, depends on the wind speed, we use the turbine’s total efficiency of 0.305 (a more sophisticated simulation approach is described in the next section). When calculating Pout and P o u t , m a x for this turbine, we will cut the power at the maximum of 5 kW. Even for higher wind speeds, the turbine power will then not increase.
The turbine itself costs around $4000 USD including shipping costs. Moreover, a charging controller and a DC/AC inverter for together about $2000 USD and a battery bank for about $2000 USD are necessary since the generated electricity cannot be fed into the local grid during blackouts. The costs for a tower and the installation at higher heights amount to approximately $1000 USD. Hence, total costs of around $9000 USD apply. When combining this turbine with other turbines or photovoltaic systems, the costs do not increase linearly.

3.4. Simulation Model Using TRNSYS

Simulation models are useful tools for predicting system behavior without the need for constructing the system as a hardware. TRNSYS is a transient system simulation program with a modular structure that was designed to solve complex energy systems problems by breaking the problem down into a series of smaller components known as “types” [20,21]. It is one of the most reliable modeling and simulation programs oriented to deal with complicated energy systems [22]. The core TRNSYS components of the model are presented in Table 2 and Figure 4.
Figure 4 shows the TRANSYS interface of the model. It depends on a certain number of interconnected components and each component has an input and an output. The description of each component is shown in Table 2. It should be noted here that the core component model in the system is the wind turbine defined as Type90 where we configured the parameters of this component model according to the specifications of WTT 5000S small wind turbine. Type109-TMY2 is the model for “Weather Data Reading and Processing” which consists of wind speed, wind direction, and ambient temperature. The online_T65 model creates plots of wind speed, resulting power in daily and hourly basis. The functionality of Type25a and Type25b/Daily and Total Results models are shown in Table 2. Opposite to the approaches in the previous section, the size of the power coefficient C p in the TRANSYS model depends on the wind speed.

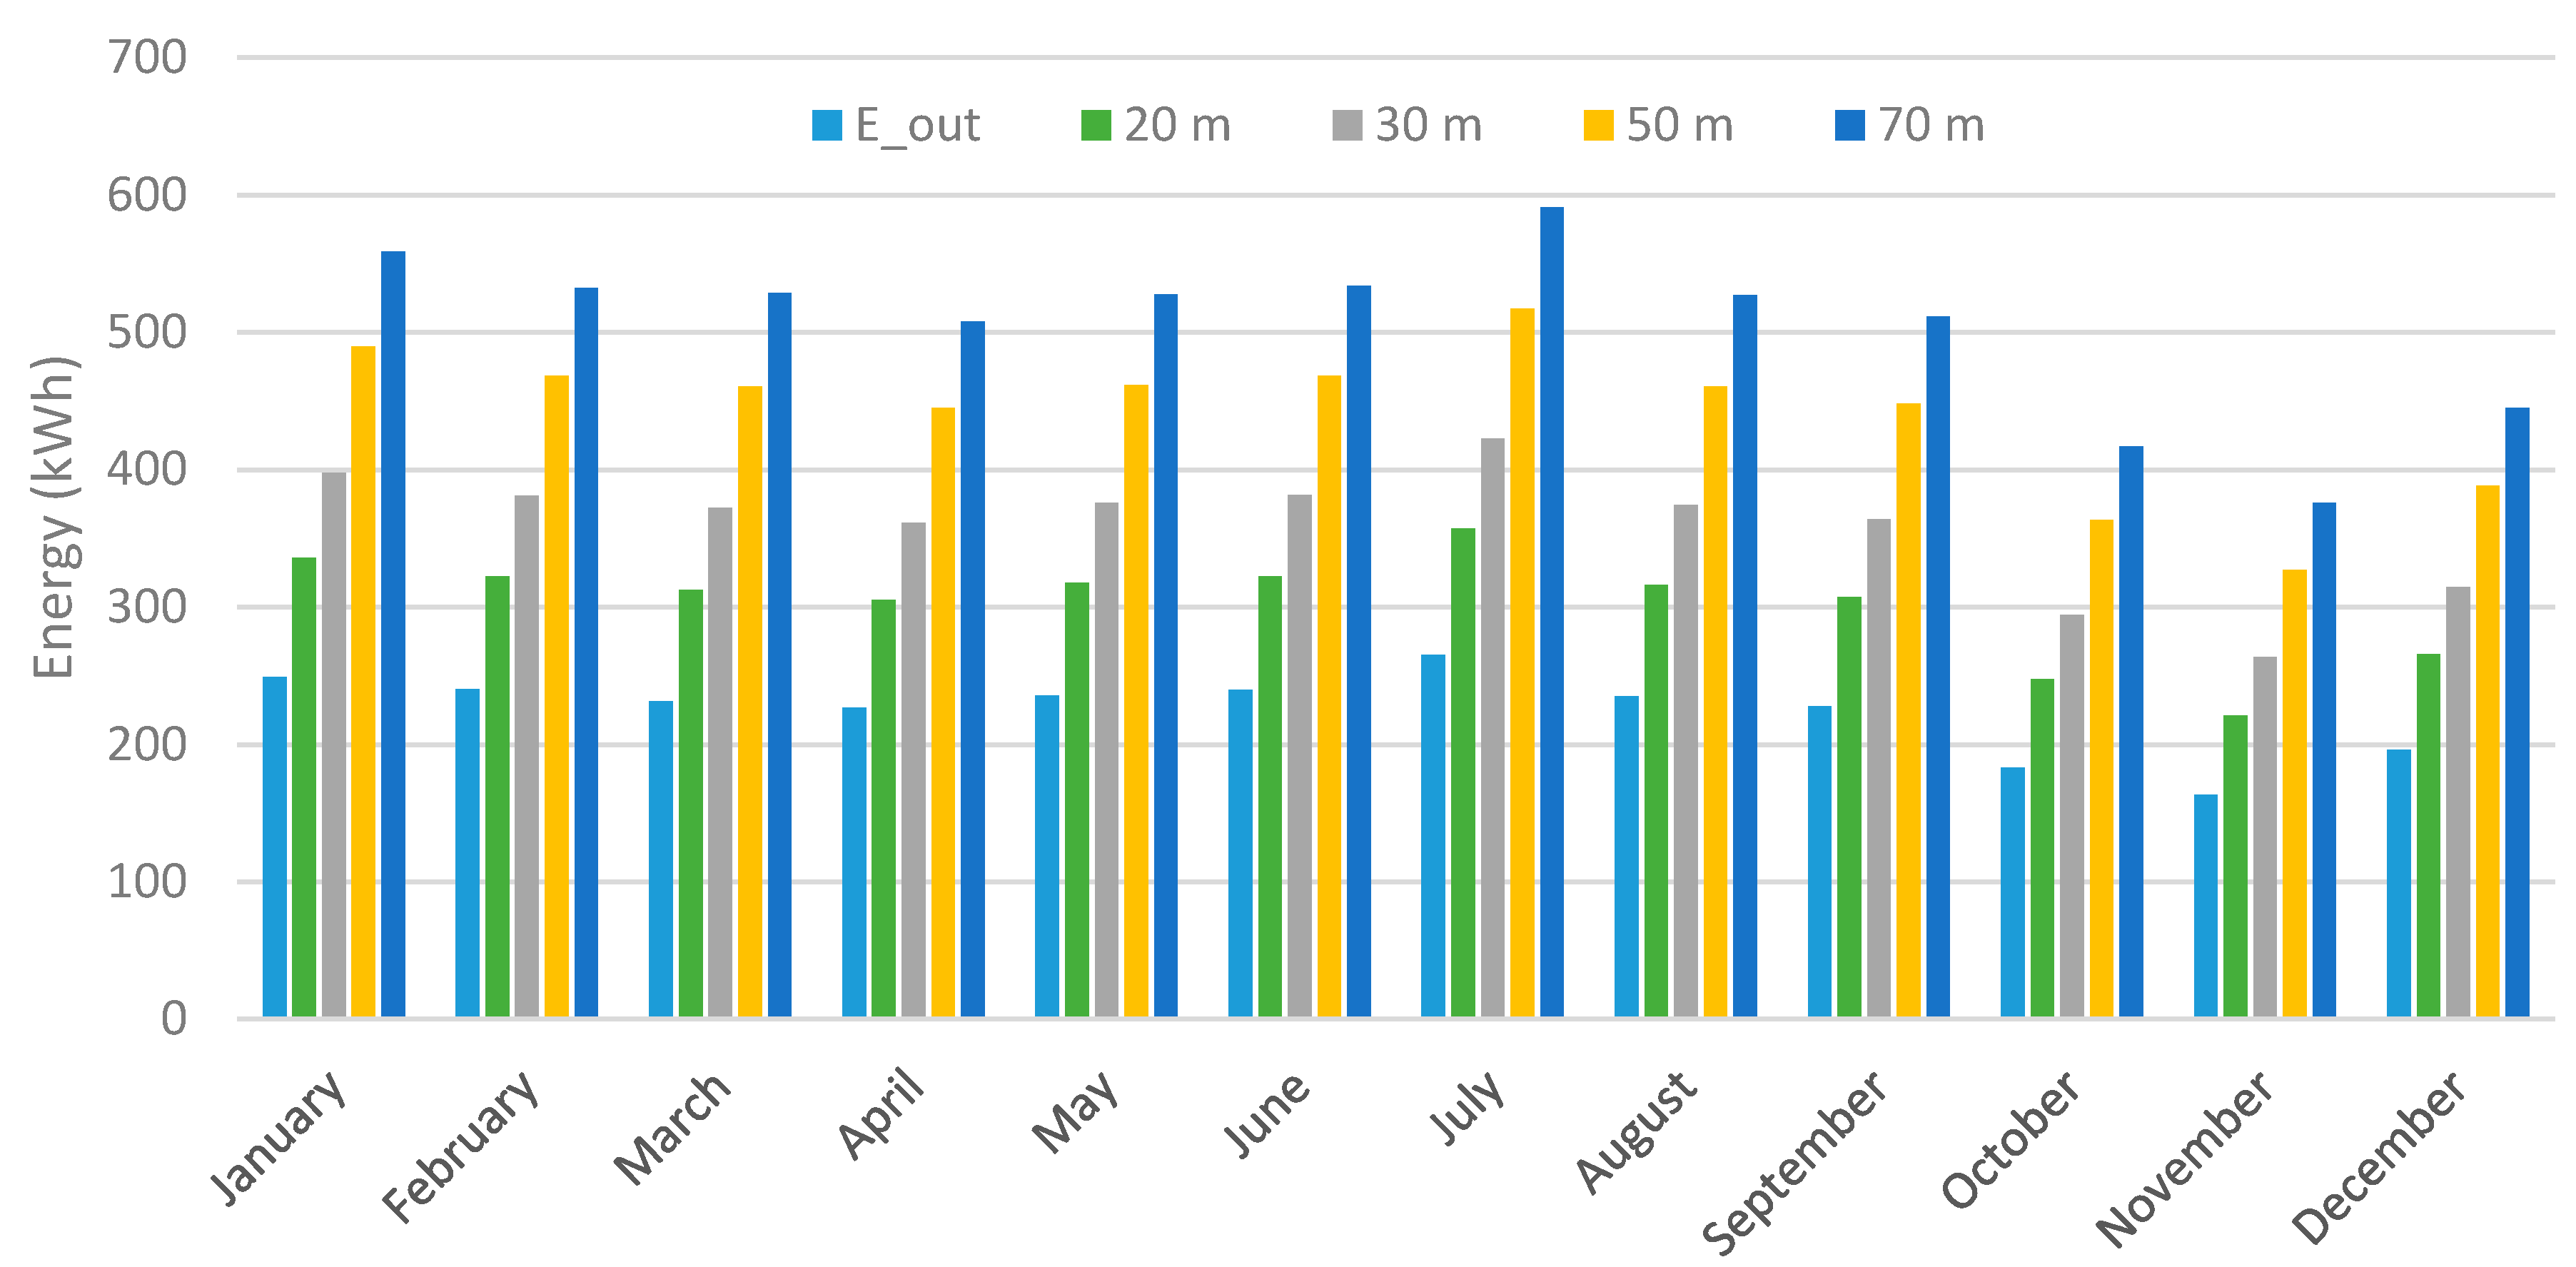
3.5. Extrapolation of Wind Speed to Different Heights

To calculate the effect of the height, the wind speeds are extrapolated to different heights using the power law (e.g., [14,24]):
v = v r ( z z r ) α
where v denotes the wind speed extrapolated to height z and v r the wind speed at reference height z r (10 m in our case). α describes the stability of the atmosphere and is often assumed to be 1/7. According to Brown, Katz, and Murphy, the power law provides a ‘reasonable first approximation to the change of wind speed with height under most meteorological conditions’ [24] (p. 1190). If data on surface roughness and atmospheric stability were available, a better approximation could be achieved using the log wind profile (e.g., [25,26]).

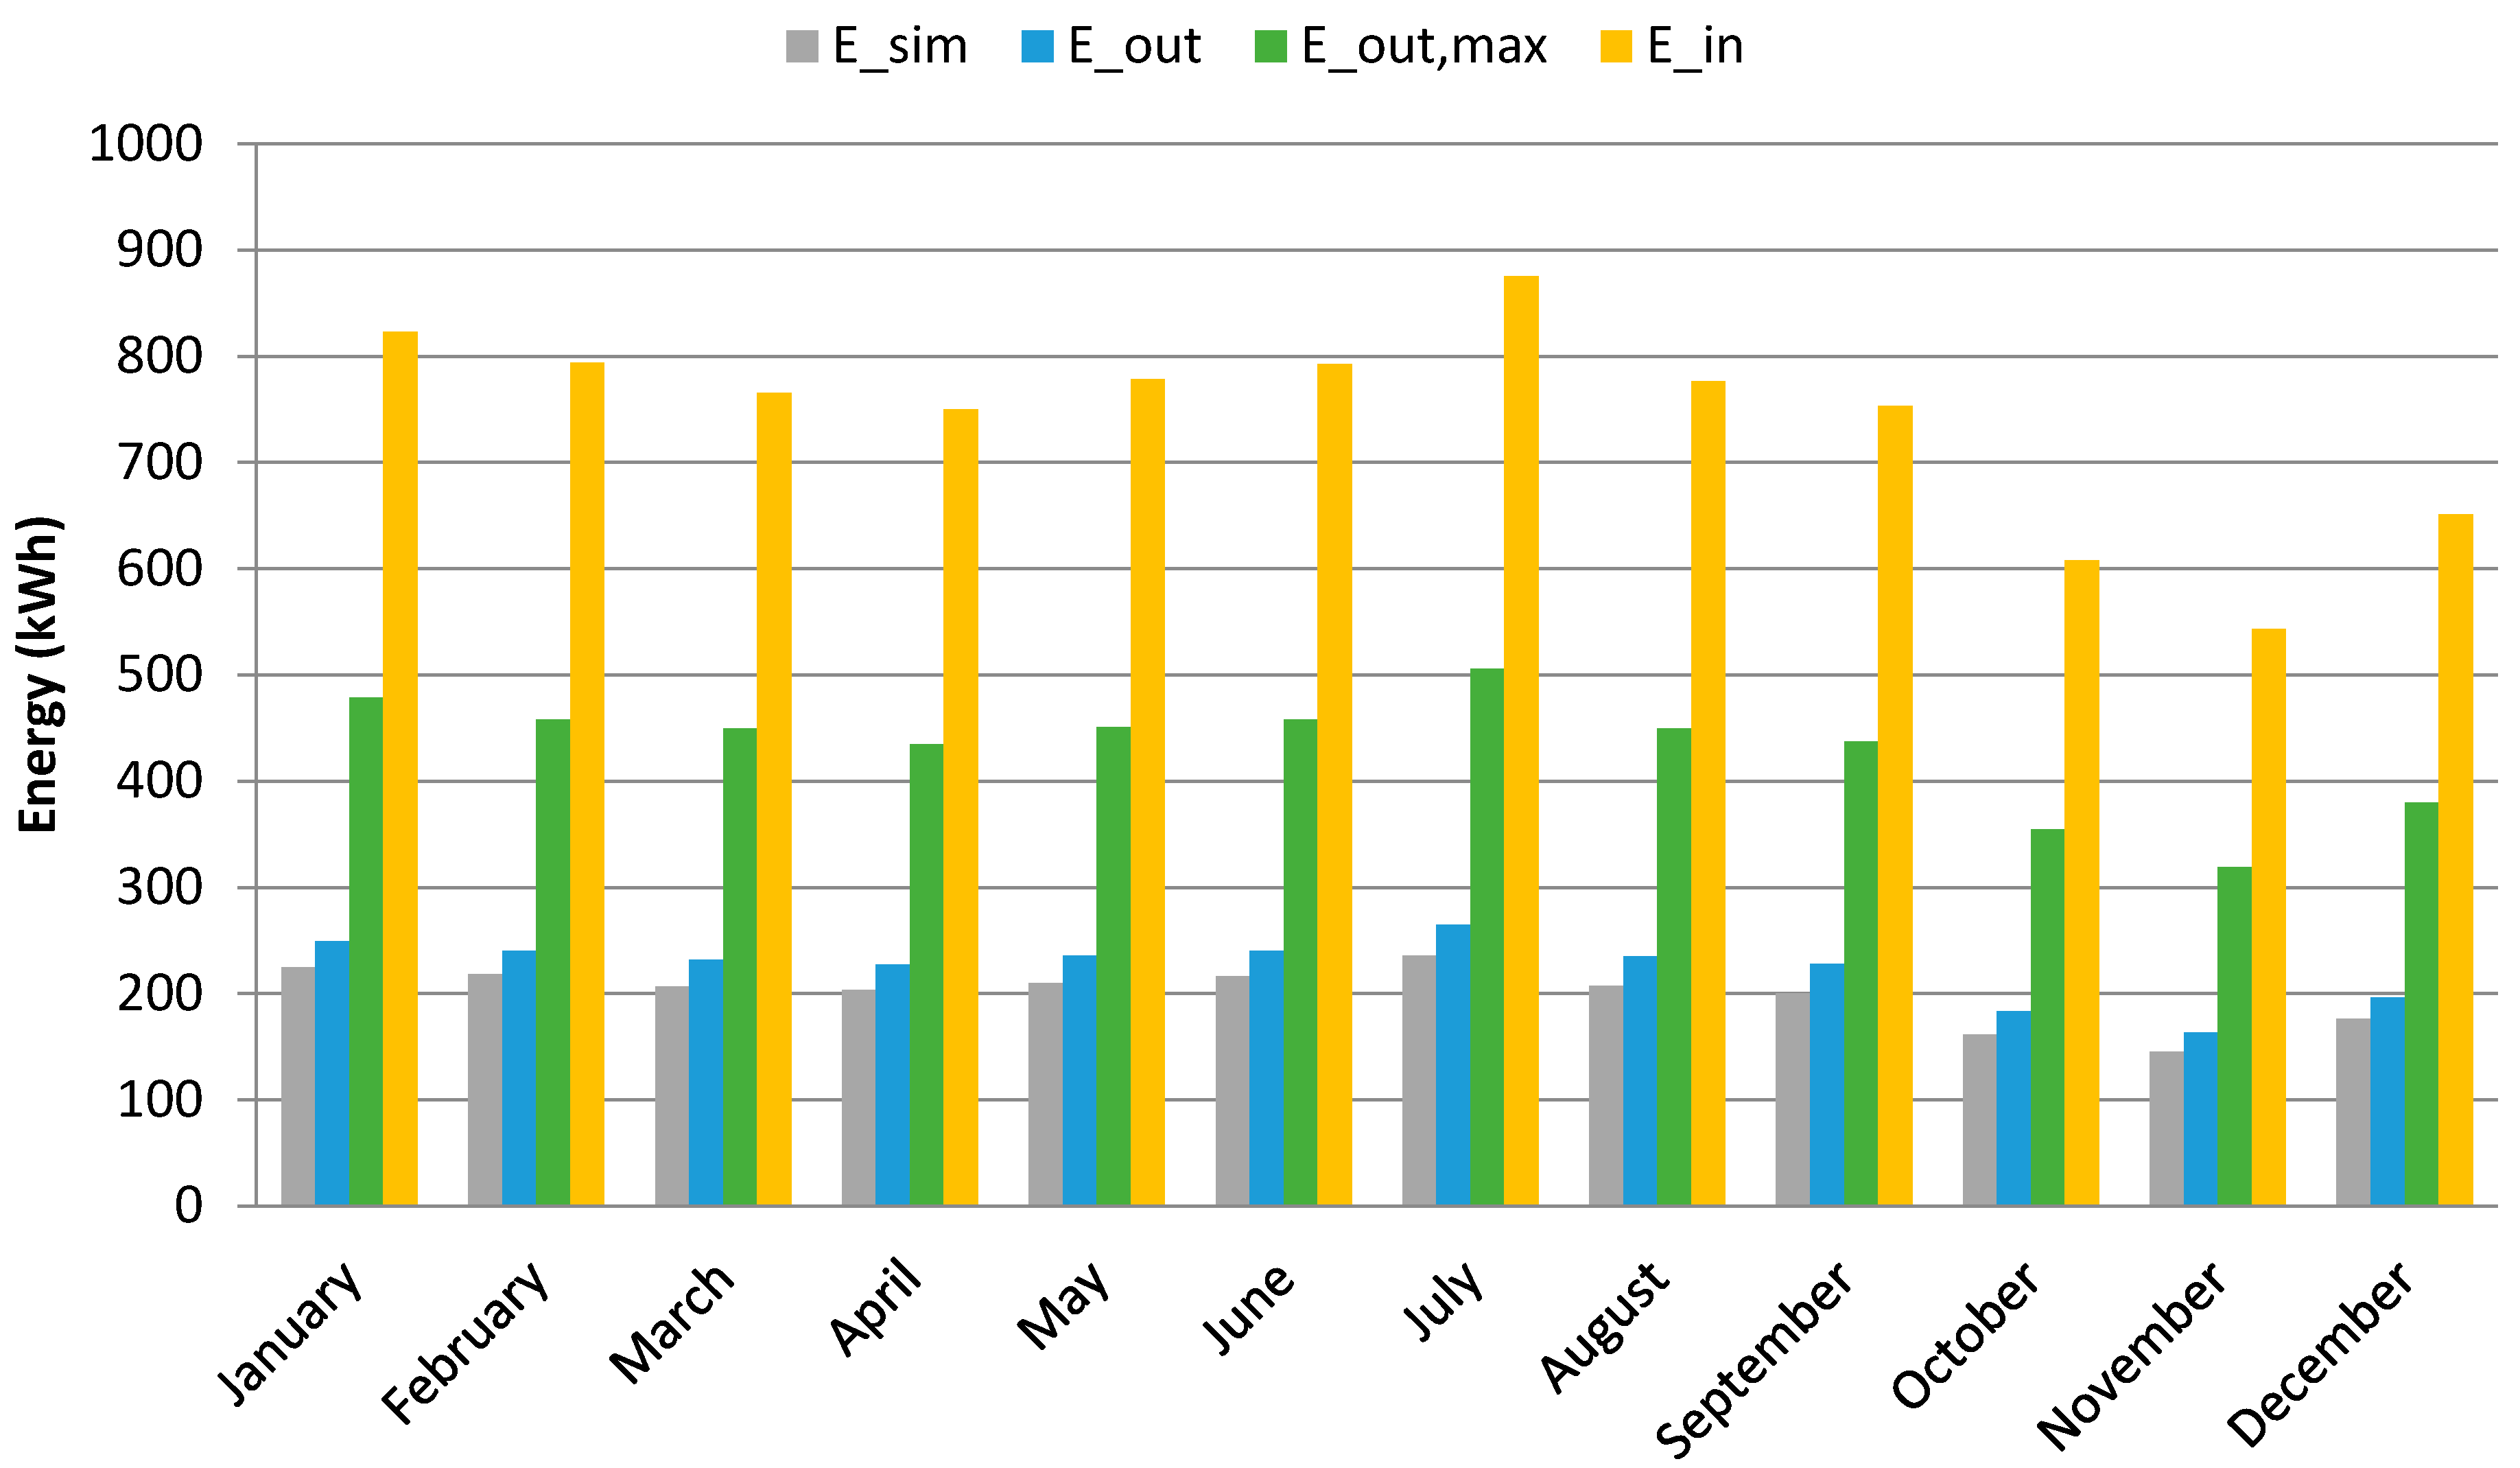
4. Results and Discussion

Figure 5 shows the results of the hourly power Pout at C p = 0.305 over the year based on the wind speed depicted in Figure 1. It can be noticed that the maximum power output of 5000 W was not achieved due to too low wind speeds at the turbine height of 10 m.
A detailed visualization of the hourly wind speeds in February and the corresponding power output is presented in Figure 6. The maximum wind speed was 12.7 m/s on 15 February leading to a power output of 4340 W. In addition, the daily cycles of wind speed and, hence, power become visible.
Figure 7 first shows the energy that can be harvested in each month of the year based on the simulations using TRNSYS for the typical meteorological year, denoted E s i m . The months of January and July have the highest expected energy yields, 225 kWh and 237 kWh, respectively. Since those months are located in winter and summer, this indicates that it is promising to harvest energy in Gaza throughout the year. For the whole year, the total expected energy amounts to 2406 kWh from one turbine at 10 m height for the typical meteorological year.
Figure 7 also depicts the expected monthly energy E i n , E o u t , m a x , and E o u t at C p = 0.305 according to the power in Equations (2), (3), and (5), respectively. Not surprisingly, E i n has the highest value since it describes the kinetic energy of the wind arriving at the turbine. It can be seen that the kinetic energy is lowest in the months October to December, which also leads to the lowest power outputs in these months. The maximum amount that can be harvested theoretically, E o u t , m a x , corresponds to 59.3% of E i n . Given the efficiency of our turbine to be C p = 0.305 , only 51.4% of E o u t , m a x can be achieved with our turbine, leading to a power output E o u t of 2695 kWh for the entire year. This shows that there is only a slight difference between the results from the TRNSYS simulations and the calculations based on Equation (3).
For a more detailed perspective, the hourly power output and wind speeds on the 1st of February are shown in Figure 8. On this day of the typical meteorological year, the peak wind speed is 6.9 m/s at 7:00 PM (19.00) and leads to expected powers of 2280 W, 1350 W, 696 W, and 610 W for P i n , P o u t , m a x , P o u t , and P s i m , respectively. It is confirmed that the simulation results lie very close to the theoretical results of the actual power produced with the wind turbine type (WTT 5000S) with an overall turbine efficiency of C p = 0.305 .
Figure 9 shows the different expected powers with respect to wind speed. Generally, an increase of the wind speed leads to an increase of the power output. The available power P i n increases continuously, whereas P s i m , P o u t , m a x , and P o u t are bounded by the turbine capacity.
All the results mentioned before were based on wind speeds of the typical meteorological year measured at a height of 10 m above ground. If a wind turbine is installed on top of a roof, however, much larger heights can be achieved. To study the potential of increasing height, the wind speeds are extrapolated to different heights according to Equation (6).
Figure 10 depicts the expected wind speeds at a height of 70 m for the month of February and the corresponding power output. Compared to Figure 6, the maximum wind speed has now increased to 16.77 m/s, which leads to the maximum power output of 5000 W.
Figure 11 shows the resulting monthly expectations for E o u t at heights of 20 m, 30 m, 50 m, and 70 m above the ground. According to this, the same turbine can achieve a much higher energy output for higher heights. Compared to the energy at a height of 10 m, the yearly energy output increases by 35% for a height of 20 m, by 60% for 30 m, and 97% for 50 m. At a height of 70 m, the expected yearly energy output corresponds to 6055 kWh, which corresponds to a surplus of 125% compared to a height of 10 m. It should be noted that the installation of a wind turbine on the roof of a residential building requires a careful analysis of safety issues. These safety issues, however, will be manageable considering the use of a small wind turbine with a weight of around 74 kg. Compared with the costs of a turbine and its installation at a higher height of about $9000 USD in total, the yearly yield of 6055 kWh at 70 m brings in more than 9% of the initial costs per year assuming a price of $0.14 USD/kWh according to [27].
To put these results in perspective, we compare them with the potential of solar energy production in Gaza. According to the PVWatts Calculator, an annual photovoltaic energy output of 7196 kWh can be expected from a comparable 5 kW photovoltaic system in a nearby region with similar conditions like Gaza. Hence, the harvested annual energy of the considered small wind turbine at a height of 10 m corresponds to 37% of the solar energy or even 84% at a height of 70 m above ground. Figure 12 depicts the monthly comparison between the wind energy output at 70 m and the photovoltaic output. Whereas the solar output outperforms the wind turbine’s output in the summer months, the harvested wind energy is higher in the winter months December to February. Hence, a combination of wind and solar energy has a great potential to stabilize the decentralized energy production in Gaza.
Finally, we want to compare the potential of wind and solar energy with the average electricity consumption of a household in Gaza. According to a household energy survey conducted by the Palestinian Central Bureau of Statistics for January 2015 [28], the average electricity consumption in the Gaza Strip in January 2015 amounts to 265 kWh per household (with on average 5.7 persons). Based on our calculations for a typical meteorological year, the expected output of a wind turbine amounts to 558 kWh in January, which corresponds to the consumption of 2.1 households. The expected output of a photovoltaic system in January is 433 kWh, which would be sufficient for 1.6 households. Hence, a combination of one wind turbine and one photovoltaic system could energize 3.7 households. This number can be increased by installing more or larger turbines or photovoltaic systems on the roof of a residential building. For a high density of turbines, however, shadowing effects would have to be considered [29].

5. Conclusions

In this paper, we have conducted a feasibility study for wind energy production with small turbines in Gaza. With the turbine used in this study installed at a height of 10 m above ground, around 2406 kWh (TRANSYS simulation) or 2695 kWh (own calculations) of wind energy can be harvested per year. At higher altitudes between 20 m and 70 m above ground, an increase of the total harvested energy between 34% and 118% can be expected, but safety issues have to be considered then. The harvested energy of the considered small wind turbine at a height of 10 m corresponds to 37% of an equivalent 5 kW photovoltaic system or even 84% at a height of 70 m above ground. Moreover, it was shown that the harvested wind energy could compensate the weakness in the harvested photovoltaic energy in the winter months. One wind turbine and one comparable photovoltaic system together could provide enough energy for 3.7 households. This is a promising result for a region where people seek to reach energy self-sufficient buildings due to the severe electricity shortage in the local grid.
Given the small size of the wind turbine and the large number of flat roofs in Gaza, a high number of turbines could be used to complement solar energy and to lead to a more reliable and environment-friendly energy supply. There are challenges coming from the import restrictions on Gaza, but this might be solved by local manufacturing of these turbines. Our future work will focus on studying the effect of height in practice through measurements. This research will open the door for finding better solutions to harvest the wind energy in Gaza, which is not exploited so far.

Acknowledgments

Financial support from the joint German-Palestinian research project POWERUS (PALGER2015-34-025) funded by BMBF and MoEHE and from the German Research Foundation are gratefully acknowledged.

Author Contributions

Mohamed Elnaggar created the main structure for the paper, collected the wind data, wrote the draft paper, and contributed to the tools selection for data analysis. Matthias Ritter analyzed the data, confirmed the validity, worked on the comparison with a solar PV system, and reorganized the paper to include the effect of height. Ezzaldeen Edwan incorporated the comparison criteria with a PV system, revised the paper, and contributed in orienting the paper in its comparative study.

Conflicts of Interest

The authors declare no conflict of interest. The founding sponsors had no role in the design of the study; in the collection, analyses, or interpretation of data; in the writing of the manuscript, and in the decision to publish the results.

References

  1. Renewable Energy Policy Network for the 21st Century; Renewables Global Status Report: Paris, France, 2007.
  2. Renewable Energy Policy Network for the 21st Century; Renewables Global Status Report: Paris, France, 2017.
  3. Hamed, T.A.; Flamm, H.; Azraq, M. Renewable energy in the Palestinian Territories: Opportunities and challenges. Renew. Sustain. Energy Rev. 2012, 16, 1082–1088. [Google Scholar] [CrossRef]
  4. Shabbaneh, R.; Hasan, A. Wind energy potential in Palestine. Renew. Energy 1997, 11, 479–483. [Google Scholar] [CrossRef]
  5. Weinberger, S. Powerless in Gaza. IEEE Spectr. 2009, 46, 36–41. [Google Scholar] [CrossRef]
  6. United Nations Country Team in the occupied Palestinian territory. Gaza—Ten years later. Available online: https://unsco.unmissions.org/new-un-report-documents-legacy-10-years-isolation-and-crisis-gaza (accessed on 19 July 2017).
  7. Alaydi, J.Y. A survey on the assessment of wind energy potential in Gaza Strip. Wind Eng. 2010, 34, 531–541. [Google Scholar] [CrossRef]
  8. Alaydi, J.Y. A parametric study of solar and wind energy in Gaza strip. Int. J. Sci. Eng. Res. 2013, 4, 140–147. [Google Scholar]
  9. De Meij, A.; Vinuesa, J.-F.; Maupas, V.; Waddle, J.; Price, I.; Yaseen, B.; Ismail, A. Wind energy resource mapping of Palestine. Renew. Sustain. Energy Rev. 2016, 56, 551–562. [Google Scholar] [CrossRef]
  10. Abu-Zarifa, A. Design of a Stand-Alone Power Wind Turbine Optimized for Low Wind Speed in Gaza. Int. J. Energy Eng. 2014, 4, 89–93. [Google Scholar]
  11. Meteonorm. Handbook Part I: Software, version 7.2; Meteotest: Bern, Switzerland, 2017. [Google Scholar]
  12. NREL. Wind Turbine Components. Available online: http://windeis.anl.gov/guide/basics/turbine.html (accessed on 19 July 2017).
  13. Watson, D.E. Wind Turbine Power Coefficient (Cp). Available online: http://www.ftexploring.com/wind-energy/wind-power-coefficient.htm (accessed on 19 July 2017).
  14. Ritter, M.; Shen, Z.W.; López Cabrera, B.; Odening, M.; Deckert, L. Designing an index for assessing wind energy potential. Renew. Energy 2015, 83, 416–424. [Google Scholar] [CrossRef]
  15. Krusche, N.; Peralta, C.; Chang, C.Y.; Stoevesandt, B. Wind Power Energy in Southern Brazil: Evaluation using a mesoscale meteorological model. Energy Procedia 2015, 76, 164–168. [Google Scholar] [CrossRef]
  16. Hau, E.; von Renouard, H. Wind Turbines: Fundamentals, Technologies, Application, Economics; Springer: Berlin, Germany, 2003. [Google Scholar]
  17. Manwell, J.F.; McGowan, J.G.; Rogers, A.L. Wind Energy Explained: Theory, Design and Application; Wiley & Sons Ltd.: Chichester, UK, 2012. [Google Scholar]
  18. Betz, A. Introduction to the Theory of Flow Machines; Pergamon Press: Oxford, UK, 1966. [Google Scholar]
  19. Wind Turbine Trade. Datenblatt 09/2015 WTT 5000S (smal) W Windturbine. Available online: http://www.wtt-wind.de/app/download/5796982333/Datenblatt+09-2015+2-3S-3-5S-5+kw.pdf (accessed on 19 July 2017).
  20. Klein, S. A Transient System Simulation Program (TRNSYS 17) Manual; Thermal Energy System Specialists: Madison, WI, USA, 2010. [Google Scholar]
  21. Janusevicius, K.; Streckiene, G.; Miseviciute, V. Simulation and analysis of small-scale solar adsorption cooling system for cold climate. Int. J. Environ. Sci. Dev. 2015, 6, 54. [Google Scholar] [CrossRef]
  22. Crawley, D.B.; Hand, J.W.; Kummert, M.L.; Griffith, B.T. Contrasting the capabilities of building energy performance simulation programs. Build. Environ. 2008, 43, 661–673. [Google Scholar] [CrossRef] [Green Version]
  23. A TRaNsient System Simulation Program. User’s Manual Solar Energy Laboratory, TRNSYS 16; Solar Energy Laboratory, University of Wisconsin-Madison: Madison, WI, USA, 2004. [Google Scholar]
  24. Brown, B.G.; Katz, R.W.; Murphy, A.H. Time-Series Models to Simulate and Forecast Wind-Speed and Wind Power. J. Clim. Appl. Meteorol. 1984, 23, 1184–1195. [Google Scholar] [CrossRef]
  25. Stull, R.B. An Introduction to Boundary Layer Meteorology; Springer Science & Business Media: Berlin, Germany, 1988. [Google Scholar]
  26. Gunturu, U.B.; Schlosser, C.A. Characterization of wind power resource in the United States. Atmos. Chem. Phys. 2012, 12, 9687–9702. [Google Scholar] [CrossRef] [Green Version]
  27. Regional Center for Renewable Energy and Energy Efficiency (RCREEE). Latest Electricity Price Schemes in RCREEE Member States. Available online: http://www.rcreee.org/sites/default/files/rs_latest_-electricity_-prices_schemes_in_rcreee_-ms_6-2013_en.pdf (accessed on 19 July 2017).
  28. Palestinian Central Bureau of Statistics. Household Energy Survey January, 2015: Main Results. Available online: http://www.pcbs.gov.ps/Downloads/book2134.pdf (accessed on 19 July 2017).
  29. Ritter, M.; Pieralli, S.; Odening, M. Neighborhood Effects in Wind Farm Performance: A Regression Approach. Energies 2017, 10, 365. [Google Scholar] [CrossRef]
Figure 1. Histogram of wind speeds and the fitted Weibull distribution function (red) for the typical meteorological year.
Energies 10 01229 g001
Figure 2. Wind rose for the typical meteorological year.
Energies 10 01229 g002
Figure 3. Monthly average wind speed in a typical meteorological year.
Energies 10 01229 g003
Figure 4. System model designed using TRNSYS [23].
Energies 10 01229 g004
Figure 5. Hourly distribution of power output for the typical meteorological year.
Energies 10 01229 g005
Figure 6. Hourly wind speed and corresponding power output in February for the typical meteorological year.
Energies 10 01229 g006
Figure 7. Harvested energy for each month of the year.
Energies 10 01229 g007
Figure 8. Hourly power output and wind speed on the 1st of February.
Energies 10 01229 g008
Figure 9. The relationship of power output with wind speed.
Energies 10 01229 g009
Figure 10. Hourly wind speed at height 70 m and corresponding power output in February.
Energies 10 01229 g010
Figure 11. Expected energy output at different heights.
Energies 10 01229 g011
Figure 12. Expected energy output for a wind turbine at 70 m height and a comparable photovoltaic system.
Energies 10 01229 g012
Table 1. Wind turbine specification.
Wind Turbine TypeWTT 5000S (Small)
Blade diameter 3.8 m
Rated speed 450 rpm
Power at 12.5 m/s3800 W
Power at 15.0 m/s5000 W
Start wind speed2.5 m/s
Total efficiency30.5%
Total weight of the systemapprox. 74 kg
Table 2. Explanation of TRNSYS model components following [23].
NameComponent typeDescription
Weather dataType109-TMY2Weather Data Reading and Processing.Typical Meteorological Year (TMY) data
Wind turbineType90Wind Energy Conversion System (WECS). Power versus wind speed data are read in a file. The impact of air density changes and wind speed increase with height are modeled.
Online Plotteronline_T65Output/Online Plotter/Online Plotter With File.
PrinterType25a and Type25b/Daily and Total resultsIt can print with a time step that is different from the simulation time step.

