Article

Investigation of Chinese Herbal Decoctions with Enzymatic Hydrolysis and Sequential Fermentation as Potential Nutrient Supplements

1
Bio-Agriculture Institute of Shaanxi Province, Shaanxi Academy of Sciences, Xi’an 710043, China
2
Key Laboratory of Animal Genetics, Breeding and Reproduction of Shaanxi Province, College of Animal Science and Technology, Northwest A&F University, Yangling 712100, China
*
Author to whom correspondence should be addressed.
Appl. Sci. 2023, 13(4), 2154; https://doi.org/10.3390/app13042154
Submission received: 12 January 2023 / Revised: 2 February 2023 / Accepted: 4 February 2023 / Published: 7 February 2023
(This article belongs to the Topic Applied Sciences in Functional Foods - 2nd Volume)

Abstract

:
Chinese herbal medicine has attracted increasing attention due to its therapeutic effects. It demands increasing understanding of the processing methods and the generated changes to control quality and offer better final products. In this study, extraction differences were compared among direct plant extracts (DE), standard decoction (SD), spontaneous fermentation (SF) and inoculated sequential fermentation (IF). Results showed that the extraction with the transformation of probiotics positively contributed to the release of functional compounds from Chinese herbs. It provided the strongest antioxidant capacity and the best amino acid profile. The flavor and the compositions of the herbal decoctions were further characterized. Distinctive volatile differences were found, indicating that the different treatments profoundly altered the spectrum of volatile components. The most aromatic changes were in the IF group, which corresponded with the greatest number of upregulated and the lowest number of downregulated differential compounds. Beneficial intestinal microbiota with voluntary intake of herbal tea suggested a possible positive metabolism shift in the healthy host. In conclusion, the combination of enzymatic hydrolysis and sequential fermentation provided better extraction efficiency than direct plant extraction and traditional herbal decoction. It may enable a broader utilization of traditional Chinese herbs as potential nutrient supplements, such as antibiotic alternatives in animal husbandry.

1. Introduction

The misuse and overuse of antibiotics in animal husbandry and their resulting release into the environment have gained increasing attention due to their serious health and social consequences [1]. As the largest producer and user of antibiotics, China started to ban antibiotics in animal feed in 2020. Due to their pharmaceutical and biodegradable value, traditional Chinese herbs (TCM) can be used as potential antibiotic alternatives and nutrient supplements in animal production. Medicinal food plants, as an essential part of the TCM, are well recognized, and have been long before the popularization of functional food and nutraceuticals [2]. They can easily be integrated into daily feeding regimens to enhance animal health, answering the urgent need for effective alternatives to antibiotics in animal feeds. The use of herbal crude powder, herbal extracts, herbal polysaccharides, herbal feed additives, herbal residue treatment, etc., are the common approaches to herbal application [3,4,5]. However, the direct addition of ultrafine herbal powder to animal feed can lead to an unpleasant taste and limited nutritional absorption. The herbal powder may even be toxic [6]. According to Fu [7], the median oral lethal dose of the powder and decoction of Asari Radix et Rhizoma was 4.8 g/kg and 240 g/kg for mice, respectively. On the other hand, the herbal decoction is generally considered safe. It enhances feed palatability, increases medicinal efficiency, and reduces toxicity [3,8]. Works to prove the efficacy of using Chinese herbs have been undertaken in many animal trials [9,10]. Positive effects include improved animal growth performance, as well as increased animal immune systems and intestinal health [8,9]. Interestingly, the synergistic effects of herbal mixture could exert higher efficiency than a single herb application, even though the molecular mechanism is not clear [11]. Bioactive compounds from herbs are categorized into flavonoids, saponins, polysaccharides, etc.
Modern fermentation of TCM mediated by probiotics enriches bioactive compounds, improves herbal efficacies, prevents contamination, etc. [12]. Isolation of functional compounds from herbs is usually performed through extraction in water and/or ethanol. Hydrophilic compounds, mostly water-soluble polysaccharides, are present in the water extract, while hydrophobic compounds (flavonoids, terpenoids, saponins, etc.) are present in ethanol/methanol extract [13]. On the one hand, herbal decoctions, infusions, and beverages are gaining popularity [14,15], on the other hand, regulation of herbal decoctions and their consumption is limited. Therefore, it demands increased understanding of the processing methods in producing the herbal decoctions [16].
Chemical changes and the flavor characteristics are of importance for herbal efficacy, palatability, and acceptance. Ultra-performance liquid chromatography coupled with mass spectrometry (UPLC-MS/MS) is often used to identify and quantify the components of herbal medicine [17]. Considering that gas chromatographic columns coupled with ion mobility spectrometry (IMS) provides higher separation ability, faster response, better sensitivity, simpler sample treatment, and more efficiency, gas chromatography (GC)- IMS is suitable for establishing the volatile fingerprints of complex herbal samples [18]. Analysis results are displayed in color contour plots for easier visualization. Together with UPLC-MS/MS, comprehensive information of the herbal decoctions is possible to gain, from compositional and aromatic aspects.
Like other fermented products, the herbal products used for animals also require information on product quality and functionality. Different methods of herbal processing and extraction could bring about various compositions of substances [19,20]. To our knowledge, there are not many works focused on studying the dual effect of enzymatic and sequential fermentation pretreatments on dietary herbal complexes. An initial evaluation of enzymatic treatment and sequential fermentation in dietary herbs is needed before the practice of herbal nutrient supplements in animal farming. For this reason, we compared and evaluated the functional properties of Chinese herbal decoctions made from different processing methods (e.g., DE, SD, SF, and IF).

2. Materials and Methods

2.1. Herbal Materials

The dried crude herbs used in this study were provided by a local registered pharmaceutical company in Shaanxi province for quality reasons. The elaborate formula optimized from a Chinese patent (register number CN100366280C) included homology of medicine and food materials such as green tea (Camellia sinensis), kudzu root (Pueraria lobata), yam (Dioscorea polystachya Turcz.), hawthorn (Crataegus oxyacantha L.), Juhua (Chrysanthemum morifolium Ramat.), mulberry leaf (Morus alba L.), corn (Zea mays L.) whisker, liquorice (Glycyrrhiza glabra L.), Polygonatum sibiricum Red., cassia seed (Cassia obtusifolia L.), wolfberry (Lycium barbarum L.), bitter gourd (Momordica charantia), honeysuckle (Lonicera caerulea L.), and lotus leaf (Nelumbo nucifera Gaertn). Their medicinal effects are recorded in the Chinese Pharmacopoeia (2020 edition). Fine powders were made by an herbal grinder (particle size ca. 1.0 mm) at an equal weight ratio.

2.2. Preparation of Herbal Decoctions

For a realistic practice [21], the standard decoction was prepared by covering the herbs with fresh drinking water in a ceramic pot (volume ratio = 1:2), bringing to a boil over high heat, then reducing heat to medium and continuing to boil the herbs for approximately 30 min. The resulting liquid is strained and set aside as the first dose. Then, the previously cooked herbs are covered again with water (2:1), boiled, and the strained liquid is added to the first dose. The final decoction was filtered through a 45-μm pore size filter.

2.3. Sample Preparation

The dual effects of enzymatic treatment and sequential fermentation on dietary herbs were compared by setting up four groups (Table 1): direct plant extraction (group #1), standard decoction (group #2), spontaneous fermentation (group #3), and sequential inoculated fermentation (group #4).
In group #1, direct plant extraction was based on aqueous ethanol. The air-dried powder mixture (1 kg) was firstly soaked with 90% ethanol (10 L). Then, the remaining residue was decocted twice with water for 30 min each, as it was prepared in the standard decoction.
In group #2, mixed herb powders (1 kg) were soaked in water (volume ratio = 1:4) mixed with enzymes for 2 h at pH 5, 45 °C. The enzymes were cellulase 2 g/L (w/v) (enzyme activity > 15,000 u/g), pectinase 2 g/L (w/v) (enzyme activity > 10,000 u/g), and amylase 2 g/L (w/v) (enzyme activity > 10,000 u/g). After filtration, a 1 L decoction volume was prepared using the standard decoction method.
In group #3, the first step was performed with the same enzymatic pretreatment as described in group #2, then the mixture was set aside to undergo spontaneous fermentation for 27 days at 18–20 °C. After fermentation, the final samples were prepared in standard decoction, condensed into 1 L.
For inoculated fermentation (group #4), herb powders (1 kg) first underwent the same enzymatic pretreatment and decoction as the standard decoction, same as described in group #2. Then a filtration step was taken to dispose herbal residue. Herbal solutions without residue were used as the culture medium for fermentation with the addition of 2% brown sugar and 2% cane sugar. The starter culture for each fermentation step was with, in inoculation order, 1 × 10⁷ colony forming units/mL each of yeast, acetic, and lactic acid bacteria for a total process time of 27 days at 30 °C for yeast (6 days) and 37 °C for bacteria (6 days for acetic bacteria and 15 days for lactic acid bacteria). The culture was sterilized at 115 °C for 15 min in between the two fermentation stages. After fermentation, the final samples were sterilized, condensed into 1 L, and kept at 4 °C until analysis. Fermentation flasks were autoclaved and the preparation room was fumigated with ozone for sanitary reasons before use.

2.4. Strains and Culture Conditions

The strain and culture information for yeast, acetic bacteria, and Lactobacillus bacteria was the same as reported earlier [22]. In brief, a three-step fermentation was carried out with Saccharomyces cerevisiae Hansen (GIM2.137, Guangdong Microbial Culture Collection Center, Guangdong City, China), Acetobacter pasteurianus (BNCC335801, BeNa Culture Collection, Beijing, China), and a mixture of Lactobacillus acidophilus, Lactobacillus plantarum, and Lactobacillus paracasei (VEGE 011 LY0 and 100 DCU, DANISCO).

2.5. In Vitro Antioxidative Assays

The antioxidant activities were characterized using a DPPH free radical scavenging assay, hydroxy radical (•OH) assay, superoxide dismutase (SOD) activity measurement, and total phenolic (TP) content determination, the same as described earlier [22].
The DPPH scavenging activities were measured as follows: 2.0 mL of 0.04 mg/L fresh DPPH ethanolic solution (Shanghai Macklin Ltd., China) was added to a mixture of 1 mL sample, 1 mL double distilled water (ddH2O), and incubated for 30 min in dark. The absorbance of the mixture was measured at 517 nm and blanked with the control. The control was carried out with water or ethanol instead of the tested sample and methanol instead of DPPH was used as blank. The radical scavenging ability was shown as % inhibition per 0.1 mL using the formula: Inhibition% = (control absorbance − sample absorbance)/control absorbance × 100.
Scavenging potential of •OH procedure: The 3.0 mL reaction mixture contained 1.0 mL of 1.5 mM FeSO4, 0.7 mL of 6 mM hydrogen peroxide, 0.3 mL of 20 mM sodium salicylate (Lingfeng, Shanghai), and 0.3 mL of the sample. After incubation for 1 h at 37 °C, the absorbance of the hydroxylated salicylate complex was measured at 510 nm. The •OH quenching activity (E%) was calculated using the equation: E (%) = [Ax − (Ay − Az)] ÷ Ax × 100, where Ax is the control absorbance of ddH2O (without sample), Ay is the absorbance in the presence of sample, and Az is the absorbance without sodium salicylate.
SOD activity was measured according to national guidelines in China (GB/T5009.171-2003) using the pyrogallol autoxidation method, monitored spectrophotometrically at 325 nm. Inhibition of pyrogallol reduction to 50% of maximal is defined as 1 U of SOD activity, and enzyme activity was expressed in units per mL of sample.
The TP content was measured using the Folin–Ciocalteu method. Gallic acid (Tanmo, Quality Inspection Ltd. Beijing, China) was used as the reference compound to calibrate the TP content. The standard curve was constructed using gallic acid in 95% ethanol at various concentrations. The Folin–Ciocalteu reaction included 0.1 mL sample, 0.9 mL ddH2O, and 2 mL Folin–Ciocalteu reagent. After 3 min, 2 mL of 10% (w/v) Na2CO3 was added into the reaction mixture and incubated for 1 h at 25 °C. The absorbance of the mixture was measured at 760 nm against distilled water on a UV spectrophotometer. The TP content was expressed as μg/mL gallic acid equivalents.

2.6. Analysis of Volatile Compounds

Volatile components and flavor fingerprints from samples with different treatments (in triplicates) were determined by HS-GC-IMS (FlavourSpec®, Dortmund, Germany). The sample (2 mL) was transferred to a 20 mL headspace vial and incubated at 60 °C for 15 min. The operating conditions are shown in Table 2. E1 (drift gas, nitrogen, 99.999% purity) was kept at 150 mL/min, E2 (carrier gas) was adjusted to 2 mL/min for 2 min while recording the data, 2 mL/min for 2 min, and increased to 100 mL/min until the first sample reading was over (20 min). The chromatographic data were analyzed using Laboratory Analytical Viewer with the dynamic principal component analysis plug-ins, gallery plot analysis, and GC×IMS Library Search. Peak height (intensity), retention time, and drift time are the three key parameters to allocate volatile compounds in the spectra. The red vertical line shows the position of the reactive ion peak, which is used to normalize the drift time of volatile compounds. Dots on the dark blue background represent the identified volatile compounds in the sample. The compound’s concentration is linked to the brightness of the dots.

2.7. Examination of Total Flavonoids, Saponins, and Crude Polysaccharides

According to general analytical methods of total flavonoids in beverages (Chinese national guideline, GB/T 12143-2008), a sample comprising 0.5 mL was mixed with 1.5 mL of 95% ethanol and 0.1 mL of 1 M NaNO2. After incubation for 5 min, an additional 0.5 mL of 0.3 mol/L aluminum chloride (AlCl3) and 4 mL of 1 mol/L sodium hydroxide solution (NaOH) were added and allowed to react for 15 min, after which the absorbance was measured at 510 nm. The total flavonoid concentration was calculated using a standard curve based on authentic rutin (purity ≥ 98%, Nanjing Jingzhu Biotechnology Co., Ltd., Nanjing City, China).
Determination of saponins performed was according to the Chinese national guideline T/AHFIA 004-2018. A sample comprising 5 mL was filled to a volume of 50 mL with 70% ethanol (v/v) and placed at 60 °C for 4 h or until died out. The residue was then neutralized with 0.4 mL 5% vanillin/glacial acetic acid (w/v) and 1.6 mL 72% perchloric acid. The mixture was transferred to a 10 mL colorimetric tube and heated for 20 min at 70 °C in a water bath, cooled on ice for 2 min, and combined with 5 mL glacial acetic acid before measuring the absorbance at 545 nm. The saponin content was calculated using a standard curve based on authentic ginsenoside Re (purity ≥ 98%, Shanghai Yuanye Biological Technology Co., Ltd., Shanghai Ctiy, China).
For the measurement of crude polysaccharides, samples comprising 5 mL were mixed with 20 mL of 95% (v/v) ethanol, vigorously stirred, and ultrasonically extracted for 30 min. The precipitate was collected after centrifugation at 5000× g for 10 min and then washed with 10 mL 95% (v/v) ethanol. The obtained precipitate was re-dissolved in 50 mL of distilled water and extracted in a boiling water bath for 2 h. The supernatant was collected after removing the precipitate and transferred to a 100 mL volumetric flask. The precipitate was washed twice with water and the washing liquid was transferred to the same 100 mL volumetric flask. Then, 1 mL liquid out of this 100 mL constant volume was diluted to 20 mL and the absorbance was measured at 490 nm. The content of crude polysaccharides was calculated according to the standard curve using the formula Y = 2.2607X − 0.0051, R2 = 0.999.

2.8. Measurement of Amino Acids

Each sample (10 mL) pre-mixed with methanol (1 mL) was subjected to ultrasound for 3 min, statically incubated for 5 min, and then centrifuged at 13,200× g for 15 min at 4 °C. The supernatant was diluted ten times and 100 μL of the dilution was further mixed with 100 μL of IS solution (100 ppb) for amino acids.
Amino acids were measured using an Acquity UPLC system equipped with AB 4000 mass spectrometer (Waters, Milford, MA, USA). The basic equipment setting was the same as described in a previous publication [23]. The separation procedure was performed with some modifications. The mobile phase consisted of water/methanol (90:10) with 0.1% (v/v) formic acid (eluent A) and water/methanol (50:50) with 0.1% (v/v) formic acid (eluent B). The gradient elution started with 10% B for 0 min; ramped to 30% of B within the next 6.5 min; ramped to 100% of B in 7 min; kept at 100% of B until 8 min and dropped to 10% B at 8.5 min at a flow rate of 0.3 mL/min; followed by a final hold at 10% of B until 12.5 min. MS detection performed was with the ion source voltage at 5.5 kV, 500 °C.

2.9. Untargeted Metabonomic Analysis

Herbal decoctions from the four treatments were subjected to the UHPLC-MS analysis. A Vanquish UHPLC System (Thermo Fisher Scientific, Waltham, MA, USA) and an ACQUITY UPLC® HSS T3 (150 × 2.1 mm, 1.8 μm) (Waters, Milford, MA, USA) were used. For LC-ESI (+)-MS analysis, the mobile phases consisted of (B2) 0.1% formic acid in acetonitrile (v/v) and (A2) 0.1% formic acid in water (v/v). Separation was conducted under the following gradient: 0~1 min, 2% B2; 1~9 min, 2%~50% B2; 9~12 min, 50%~98% B2; 12~13.5 min, 98% B2; 13.5~14 min, 98%~2% B2; 14~20 min, 2% B2. For LC-ESI (-)-MS analysis, the analytes were carried out with (B3) acetonitrile and (A3) ammonium formate (5 mM).
Mass spectrometric detection of metabolites was performed on a Q Exactive Focus (Thermo Fisher Scientific, Waltham, MA, USA) with an ESI ion source. Simultaneous MS1 and MS/MS (Full MS-ddMS2 mode, data-dependent MS/MS) acquisition was used. The parameters were as follows: sheath gas pressure, 30 arb; aux gas flow, 10 arb; spray voltage, 3.50 kV and −2.50 kV for ESI (+) and ESI (−), respectively; capillary temperature, 325 °C; MS1 range, m/z 100–1000; MS1 resolving power, 70,000 FWHM; number of data-dependent scans per cycle, 3; MS/MS resolving power, 17,500 FWHM; normalized collision energy, 30 eV.

2.10. Animals and Treatments

Five-week-old male C57BL/6 mice were purchased from the Laboratory Animal Center of Xi’an Jiaotong University. The animals were housed in cages at a controlled temperature of 23 ± 3 °C with a 12/12-h light/dark cycle and with free access to food and water (protocol code DK2021036, 2021). After 7 days acclimatization, 20 rats were randomly grouped into two treatment groups (n = 10): the regular control group (RC) and the regular group with herbal tea (Rh). Feces samples were collected and saved for the gut microbiota analysis. A gavage administration with feeding needle was replaced by voluntary intake of herbal tea in this study. Herbal tea was mixed in a 3:1 ratio of water and herbal decoction (from group #4), then the sugar and sour ratio was adjusted close to 23:1 using rare sugar D-psicose (purity 99%) and mogroside V (purity 50%) for a better acceptance and the minimum interfere of the metabolism in mice. The final usage of D-psicose and mogroside V was 2% (wt/wt) and 3% (wt/wt), respectively.

2.11. Gut Microbiota Analysis

Genomic DNA was extracted using Tiangen stool DNA kit (Beijing, China). Sequencing work was performed using the Illumina NovaSeq platform according to the standard procedure. The microbial 16S rRNA gene was amplified with a front primer (ACTCCTACGGGAGGCAGCA) and a reverse primer (GGACTACHVGGGTWTCTAAT). Technical support was provided by BioNovoGene (Suzhou, China). Sequences were analyzed using QIIME2 (version 2019.4) and visualized using R or Python.

2.12. Statistical Analysis

All data were analyzed using Prism 8.0 software (GraphPad, CA, USA) and expressed as the mean ± standard deviation (SD). Differences with p-values ≤ 0.05 were considered statistically significant (* p < 0.05, ** p < 0.01).

3. Results

3.1. Determination of Functional Components

As dietary supplements, edible medicinal plants are usually used in the form of decoctions. We envisioned that multistep fermentation would lead to the joint extraction of both hydrophilic and hydrophobic compounds. The content of functional components (flavonoids, saponins, crude polysaccharides) in herbal broth from the four different treatments is shown in Table 3.
Simple direct plant extraction (group #1) was found to be not so effective, with lowest yields of flavonoids (0.56 ± 0.12 g/L), saponins (5.50 ± 0.70%), and crude polysaccharides (0.93 ± 0.10 g/L). Bioactive compounds were enriched the most after enzymatic hydrolysis in group #2, up to 7 times compared to group #1. Group #2 and #4 gave similar yields in this experiment. The extraction step with the transformation of probiotics in group #4 contributed positively to the release of functional compounds, while spontaneous fermentation (group #3) led to a loss of flavonoids, saponins, and polysaccharides, as evidenced by a comparison of samples from groups #2, #3, and #4. These differences may result from additional compounds brought about by the probiotics transformation from herbal decoctions, or the synergistic contribution of phytochemicals in the herbal extracts [24] other than from the herbal residues. As we compare the difference of various herbal decoctions, further isolation and purification of any antioxidant compounds would not to be necessary here. Maceration with enzymes for 2 h was sufficient to provide a good extraction yield of herbal powders.

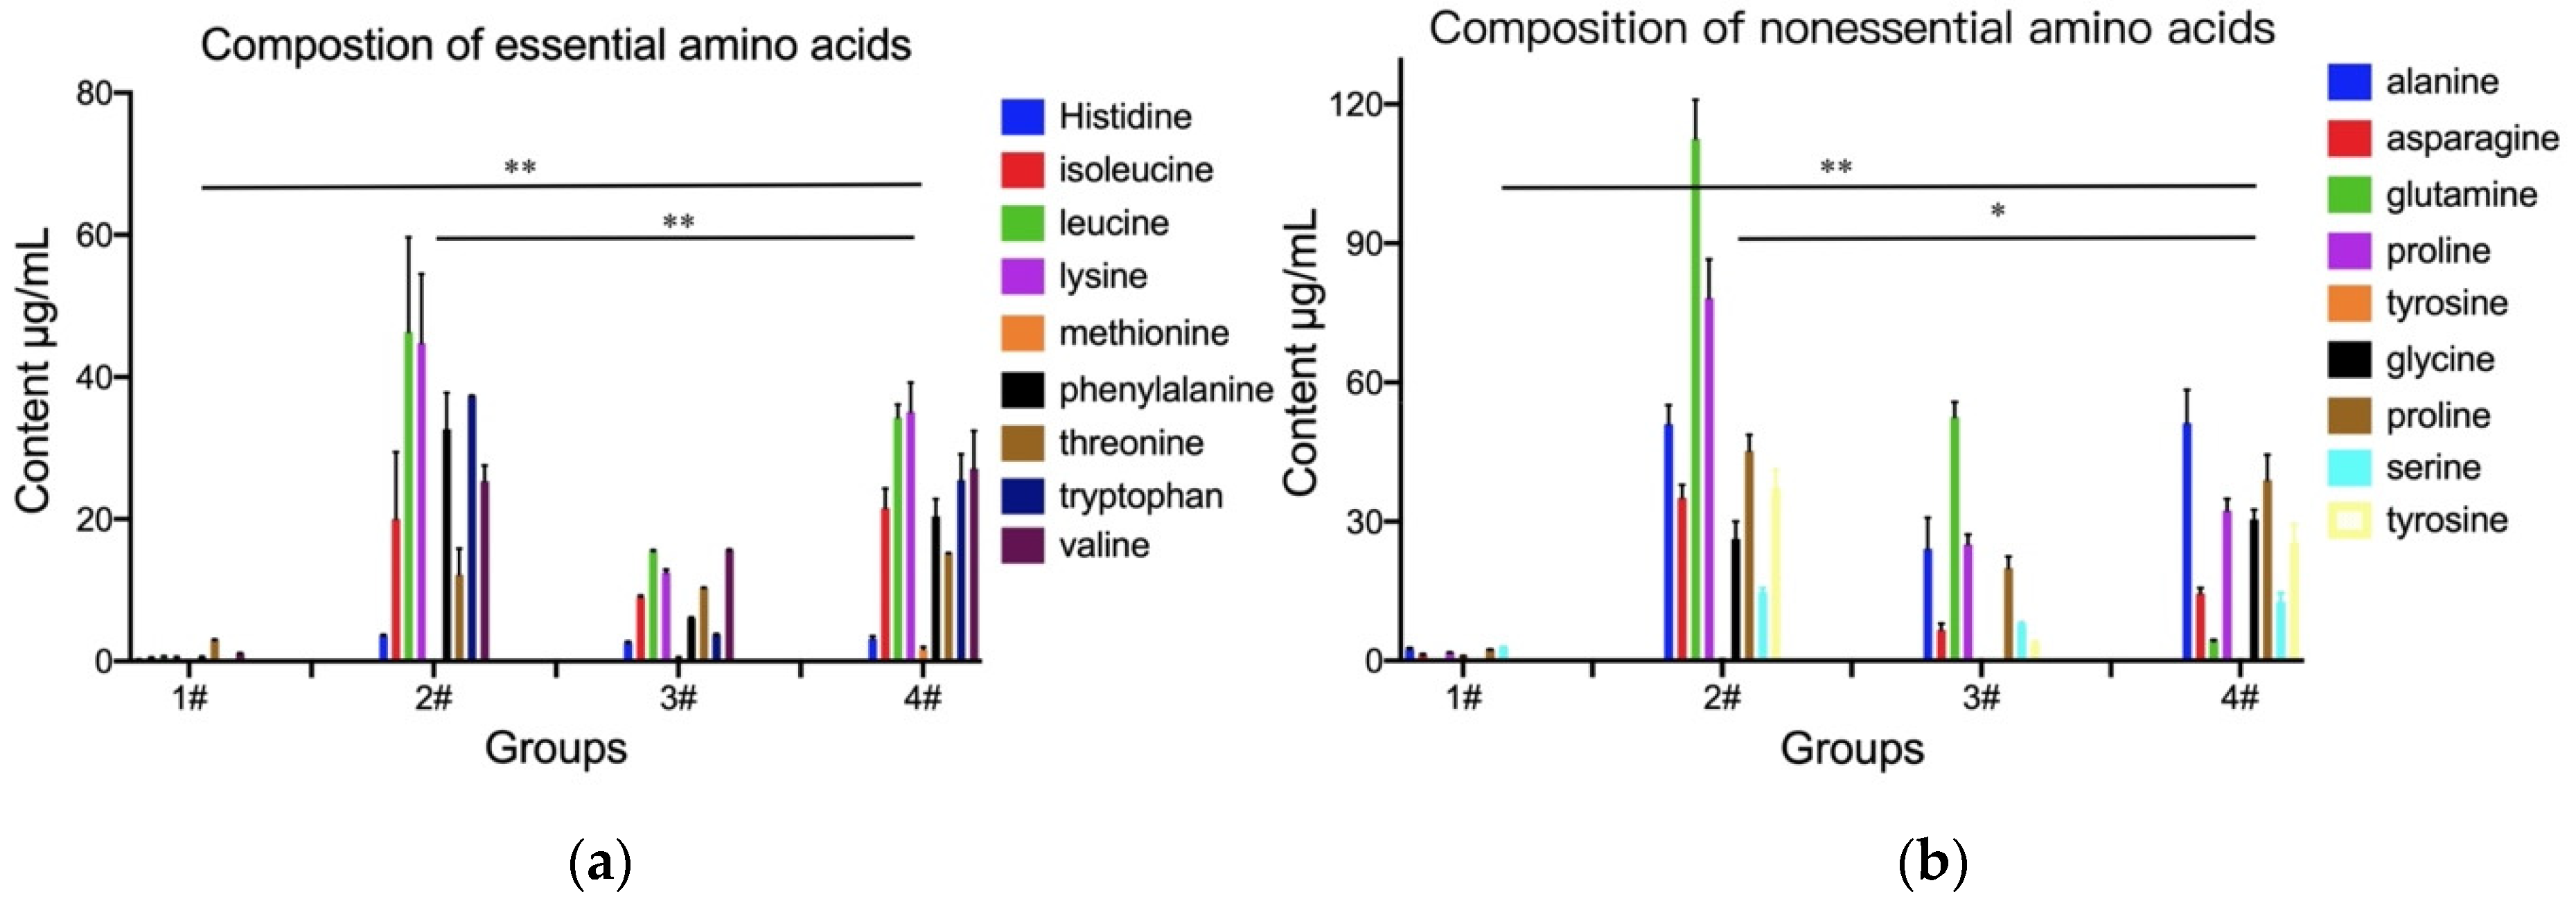
3.2. Determination of Amino Acids

Many herbs are rich in essential amino acids and can be used as an alternative source of amino acids in animal feed supply [25]. An ideal combination of essential and non-essential amino acids caters to different animal varieties at their corresponding growth stages. The complete amino acid profile of the herbal samples from different treatments is reported in Figure 1.
The total concentration of essential amino acids differed significantly between all treatments (p < 0.01). Groups #2 and #4 had a richer essential amino acid profile than the other two groups. Group #1 had the fewest essential amino acids, reaching only 6.47 ± 0.51 μg/mL. Group #2 showed the highest content of essential amino acids (222.33 ± 43.47 μg/mL). Group #3, with autochthonous microorganisms (75.86 ± 1.27 μg/mL), and group #4, with inoculated fermentation (184.01 ± 20.71 μg/mL), showed a reduction in essential amino acids compared to group #2. This is not surprising since free amino acids act as substrates for microorganism growth and can also be converted into aroma compounds by lactic acid bacteria [26]. Compositionally, the main essential amino acids in group #2 were leucine, lysine, tryptophan, phenylalanine, and valine. The main amino acids in group #4, from highest to lowest content, were lysine, leucine, valine, tryptophan, isoleucine, phenylalanine, histidine, and methionine.
The total concentration of non-essential amino acids was 11.35 ± 0.71 μg/mL in group #1, 400.60± 35.57 μg/mL in group #2, 140.06 ± 16.66 μg/mL in group #3, and 210.06 ± 24.39 μg/mL in group #4 (p < 0.01). The amount of asparagine in group #2 was 112.57 ± 8.40 μg/mL, 26.68 times higher than in group #4, in which it was only 4.22 ± 0.21 μg/mL. In addition to asparagine, glutamate (78.23 ± 8.30 μg/mL), alanine (51.00 ± 4.10 μg/mL), and proline (45.29 ± 3.40 μg/mL) were the top three most abundant non-essential amino acids in group #2. The same order of abundant non-essential amino acids was found in group #3, but at lower concentrations. In group #4, the top three non-essential amino acids were alanine (51.25 ± 7.20 μg/mL), proline (38.97 ± 5.40 μg/mL), and glutamate (32.38 ± 2.50 μg/mL).
The amino acid requirements for different farm animals are not identical. Lysine, threonine, and methionine are generally considered to be the key limiting amino acids for the postprandial muscle protein synthesis response [25]. Methionine was not detected in group #2, but it was detectable in group #4. The ratios of essential to total amino acids in this study were 0.36 (group #1), 0.36 (group #2), 0.35 (group #3), and 0.47 (group #4). The ratios of essential to non-essential amino acids were 0.57 (group #1), 0.55 (group #2), 0.54 (group #3), and 0.88 (group #4). The ratio of essential to non-essential amino acids (0.88) and essential to total amino acids (0.47) was highest in group #4. It is also higher than the FAO/WHO standard [9,27]. The optimal ratio of essential to non-essential amino acids is approximately 1.0 in feeds [28]. Based on the compositional analysis, group #4 was the best among the four treatments. These results indicate that group #4 has good potential for use as a feed additive. Given the cost, safety, and environmental aspects, microbial transformation is an ecologically sound strategy that deserves further study.

3.3. Determination of Flavor Profiles and Herbal Compositions from Different Treatments

Volatile Gallery Plot and the Herbal Compositions of Samples with Enzymatic Hydrolysis
HS-GC-IMS was used to acquire sample information with different processing methods. Selected regions in the gallery plot of Figure 2 represent highly concentrated components in either of the samples after enzymatic hydrolysis. Different treatments of decocting (#2), SF with residue (#3), and IF without residue (#4) generated different volatile compounds. It is proved that different fermentation modes have distinctive volatile profiles depending on the microorganisms involved [29]. Three sample groups of #2, #3, and #4 were well spread on the principal component analysis which accounted for 48% (PC2) and 51% (PC1) of the cumulative variances. Samples from SF with residue (#3) delivered a higher degree of deviation than the other two groups.
Fifteen volatile compounds in group #2, twenty-seven volatile compounds in group #3, and twenty volatile compounds in group #4 appeared in the topographic plot. These compounds were further categorized in groups in Figure 3a. The relative content of volatile compounds in group #2 was mostly assigned to aldehydes (58.53% of the total) and ketones (22.30% of the total). Under the influence of microorganisms, aldehydes and ketones in the unfermented decoction (group #2) were reduced to form esters and alcohols in groups #3 and #4. There was a higher number of aldehydes in group #3 than in group #4. In addition to enzyme oxidation, in Strecker degradation (heat during decoction) and microbial metabolism, aldehydes come partially from amino acids [30]. This corresponded to the amino acid analysis, in which group #3 had lower concentrations of amino acids than group #4. Higher ketone concentrations were observed in groups #2 and #4, suggesting a higher degree of oxidation of fatty acids in both treatments due to heating and fermentation [31]. Compounds such as furan and pyrazine, which are the result of Maillard reactions and Strecker degradation in the heating process [32], were also found in this study.
Herbal compositions were identified by UHPLC-Q-TOF/MS. There were 115 compounds upregulated and 241 downregulated when comparing group #3 to group #2; 226 compounds were upregulated and 169 were downregulated when comparing group #4 to group #2. With different fermentation strategies in group #3 and group #4, 277 compounds were upregulated and 80 downregulated. These differential compounds were visualized in the volcano plots (p < 0.05, FC > 1.2 and VIP > 1, Figure 4).
Volatiles and Differential Compounds from Direct Plant Extraction and Probiotic Fermentation
Distinctive differences in volatile compounds were found in groups #1 and #4, indicating that the different treatments profoundly altered the spectrum of volatile components (Figure 5). Fifteen volatile compounds, mostly aldehydes, increased noticeably in group #1. Forty-one volatile compounds in group #4 increased significantly. As shown in Figure 3b, the relative content of volatile compounds in group #1 was mostly attributed to aldehydes (45.24% of the total) and ketones (39.35% of the total). This profile was shifted to relatively high proportions of aldehydes (32.34%), alcohols (19.29%), ketones (17.42%), and esters (22.93%) in group #4 after sequential probiotic fermentation. Lactobacillus species were reported to catalyze the esterification of short-chain fatty acids with diverse alcohols [26]. Esters and alcohols positively influence product quality and palatability, whereas aldehydes and ketones give an acrid flavor and reduce product quality [33]. Therefore, we assume group #4 would offer a better acceptance based on volatile metabolites.
Compositionally, there were 556 differential compounds from group #1 (control group) and #4 (p < 0.05, FC > 1.2 and VIP > 1). Among these, 530 compounds were identified to be upregulated and 26 were downregulated (Figure 4). The top 5 screened metabolites with the most log 2 (fold change) were lubiprostone, taurocholic acid, penta porphyrin I, deoxycorticosterone acetate, and 4-hydroxyisophthalic acid. Lubiprostone is reported for treating functional constipation [34], taurocholic acid for immunoregulation [35], penta porphyrin I for being an indicator of metal exposure [36], deoxycorticosterone acetate for inducing diastolic dysfunction [37], and 4-hydroxyisophthalic acid for good antioxidant potential [38]. Assessment of these metabolites as dietary inputs will be explored in our follow-up work on host metabolism.

3.4. Antioxidant Capacities of Different Herbal Treatments

The antioxidant capacity of Chinese herbs is fundamental to their efficacy, and, therefore, utilization. Some workers compared the most common medicinal plants according to their antioxidant capacities and total phenolic contents [39]. In this study, joint use of enzymes and sequential transformation of probiotics (group #4) gave the strongest antioxidant capacity (Figure 6) in terms of SOD activity, DPPH radical, and hydroxyl radical scavenging activities, and total phenolic content (p < 0.01). Meanwhile, there was no significant difference among groups #1, #2, and #3. Like the result for functional components, group #1 presents the minimum values in terms of all four antioxidants among different herbal decoctions. Group #3 showed higher antioxidative potential than groups #1 and #2, but with lower contents of functional components than group #2. This result indicted that fermentation could bring better antioxidant properties to the herbal decoction. Probiotic fermentation has better performance than spontaneous fermentation with endogenous microorganisms.
The increased antioxidant activity of group #4 could correspond to a high content of phenolics, flavonoids, saponins, and polysaccharides in the herbal decoction. The enrichment of phenolic contents and elevated antioxidant capacities is due to mixed probiotic fermentation by Lactobacillus strains [40]. Other than that, biotransformation with lactic acid bacteria may also bring new properties through the fermentation process [41,42]. In practical uses, antioxidant capacity varies in different herbal formulations [43].

3.5. Gut Microbiota Analysis

Bioactive compounds from herbal tea such as polyphenols and polysaccharides could be utilized by gut microbiota without breaking down in the digestion process. To compare gut microbiota between healthy subjects (RC) and healthy subjects with voluntary daily herbal intake (Rh), a pilot study was carried out using herbal tea made from the herbal decoction that underwent inoculated fermentation (IF, group #4). It possessed the best performance from above evaluations. The top 5 phyla and top 20 genera with high relative abundance based on the selection criteria LDA > 2, p < 0.05 are shown in Figure 7.
At the phylum level (Figure 7a), the relative abundance of major microbiota in RC were Bacteroides (30.88%) and Firmicutes (59.58%). With the herbal intake, it brought more Bacteroides (40.99%) and fewer Firmicutes (50.00%). The Firmicutes to Bacteroidetes (F/B) ratio was 1.93 in the RC group and reduced to 1.22 in the Rh group. The F/B ratio is frequently considered as a relevant marker of intestinal health or dysbiosis [44]. Actinobacteria decreased from 5.20% in the RC group to 3.99% in the Rh group. As Firmicutes absorb more calories from food than Bacteroidetes, a reduced F/B ratio in the Rh group indicated a beneficial effect of herbal tea intake. Bacteroidetes could promote health through breaking down brown fat in the system [45]. The majority Firmicutes and Bacteroidetes, together with the minority Actinobacteria, maintain gut homeostasis at the taxonomic level [46]. Elevated proportions of Proteobacteria (4.37%) in the Rh group, compared with that in the RC group (1.49%), suggested a greater involvement at the genetic level, since low abundant Proteobacteria tend to keep gut function healthy through variable genes [47].
At the genus level (Figure 7b), the Rh group showed decreased relative abundance in the seven genera of Atopostipes, Bifidobacterium, Lactobacillus, Sporosarcina, Akkermansia, Prevotella, and Coprococcus, compared to that of the RC group. Research has proven that Atopostipes, Sporosarcina [48], Akkermansia [49], Bifidobacterium [50], Lactobacillus [51], Prevotella [52], and Coprococcus [53] are all beneficial for enhancing gut health. Three genera of Allobaculum, Jeotgalicoccus, and Turicibacter in the Rh group showed the most elevated relative abundance. Allobaculum produces short-chain fatty acids of lactic and butyric acids, which offers a protection for the intestinal barrier [54]. The genera of both Jeotgalicoccus and Turicibacter were associated with fatty acid degradation in the host [55,56]. Based on these alterations in the gut microbiota, the influence of fermented herbal decoction on the host metabolism is interesting and needs to be further investigated.

4. Conclusions

In this study, we compared and evaluated the functional properties of the Chinese herbal decoctions made from different processing methods (e.g., DE, SD, SF, and IF.). Results demonstrated that the combination of enzymatic hydrolysis and sequential fermentation improves the final product quality. It provided a good extraction yield, the best amino acids profile, and the strongest antioxidative potential. It also generated an enriched flavor with an elevated number of esters and alcohols. The largest number of upregulated compounds and the least number of downregulated compounds was found in IF compared to DE, indicating a profound alteration brought about by probiotics. The health-promoting effect of herbal tea made from IF on the gut microbiota was encouraging. Given these advantages, this method is promising in the herbal production of functional nutrient additives such as feed supplements, or herbal residue recycling.

Author Contributions

Conceptualization, S.H. and Y.W.; methodology, H.Z.; data analysis, S.H.; writing—review and editing, S.H. and Y.W.; project administration, S.H.; funding acquisition, S.H. All authors have read and agreed to the published version of the manuscript.

Funding

This research was funded by Science and Technology Program of Shaanxi Academy of Sciences, grant number 2020k-34 and 2021k-11.

Institutional Review Board Statement

Rodent studies were approved by the Ethics Committee of Northwest A&F University (protocol code DK2021036, 2021).

Informed Consent Statement

Not applicable.

Data Availability Statement

Further information and requests for resources and reagents should be directed to and will be fulfilled by Shanshan Han ([email protected]).

Acknowledgments

We thank Weichang Liu from Xi’an JiangShangao Food Co., Ltd. for his kind donations of herbal materials used for experiments. We also thank BioNovoGene (Suzhou, China) for their technical support.

Conflicts of Interest

The authors declare no conflict of interest.

References

  1. Wang, X.-Y.; Zhang, H.; Chen, L.; Shan, L.-H.; Fan, G.-W.; Gao, X.-M. Liquorice, A Unique “Guide Drug” of Traditional Chinese Medicine: A Review of Its Role in Drug Interactions. J. Ethnopharmacol. 2013, 15, 781–790. [Google Scholar] [CrossRef]
  2. Qiao, M.; Ying, G.-G.; Singer, A.; Zhu, Y.-G. Review of antibiotic resistance in China and its environment. Environ. Int. 2018, 110, 160–172. [Google Scholar] [CrossRef] [PubMed]
  3. Liu, G.-X.; Xu, F.; Shang, M.-Y.; Wang, X.; Cai, S.-Q. The Relative Content and Distribution of Absorbed Volatile Organic Compounds in Rats Administered Asari Radix et Rhizoma Are Different between Powder- and Decoction-Treated Groups. Molecules 2020, 25, 4441. [Google Scholar] [CrossRef] [PubMed]
  4. Zeng, P.; Li, J.; Chen, Y.; Zhang, L. The structures and biological functions of polysaccharides from traditional Chinese herbs. Prog. Mol. Biol. Transl. Sci. 2019, 163, 423–444. [Google Scholar] [CrossRef]
  5. Gong, J.; Yin, F.; Hou, Y.; Yin, Y. Review: Chinese herbs as alternatives to antibiotics in feed for swine and poultry production: Potential and challenges in application. Can. J. Anim. Sci. 2014, 94, 223–241. [Google Scholar] [CrossRef]
  6. Huang, C.; Li, Z.-X.; Wu, Y.; Huang, Z.-Y.; Hu, Y.; Gao, J. Treatment and bioresources utilization of traditional Chinese medicinal herb residues: Recent technological advances and industrial prospect. J. Environ. Manag. 2021, 299, 113607. [Google Scholar] [CrossRef]
  7. Fu, Y.-Q.; Wei, X.-Z.; Wang, Y.; Wang, H.; Lou, Z.-H. The acute toxicity appraises of the Asarum Heterotropoides fr. schmidt var. Mandshuricum (Maxim.) kitag, Asarum Sieboldii Miq. and Asarum Sieboldii Miq. var. seoulense nakai. Asia Pac. Tradit. Med. 2010, 6, 23–25. Available online: https://en.cnki.com.cn/Article_en/CJFDTOTAL-YTCT201012008.htm (accessed on 11 January 2023).
  8. Su, J.; Zhu, Q.; Zhao, Y.; Han, L.; Yin, Y.; Blachier, F.; Wang, Z.; Kong, X. Dietary Supplementation With Chinese Herbal Residues or Their Fermented Products Modifies the Colonic Microbiota, Bacterial Metabolites, and Expression of Genes Related to Colon Barrier Function in Weaned Piglets. Front. Microbiol. 2018, 9, 3181. [Google Scholar] [CrossRef]
  9. Lin, Z.; Ye, L.; Li, Z.; Huang, X.; Lu, Z.; Yang, Y.; Xing, H.; Bai, J.; Ying, Z. Chinese herb feed additives improved the growth performance, meat quality, and nutrient digestibility parameters of pigs. Anim. Model. Exp. Med. 2020, 3, 47–54. [Google Scholar] [CrossRef]
  10. Chen, G.; Li, Z.; Liu, S.; Tang, T.; Chen, Q.; Yan, Z.; Peng, J.; Yang, Z.; Zhang, G.; Liu, Y.; et al. Fermented Chinese Herbal Medicine Promoted Growth Performance, Intestinal Health, and Regulated Bacterial Microbiota of Weaned Piglets. Animals 2023, 13, 476. [Google Scholar] [CrossRef]
  11. Li, Y.; Sun, T.; Hong, Y.; Qiao, T.; Wang, Y.; Li, W.; Tang, S.; Yang, X.; Li, J.; Li, X.; et al. Mixture of Five Fermented Herbs (Zhihuasi Tk) Alters the Intestinal Microbiota and Promotes the Growth Performance in Piglets. Front. Microbiol. 2021, 12, 725196. [Google Scholar] [CrossRef] [PubMed]
  12. Li, L.; Wang, L.; Fan, W.; Jiang, Y.; Zhang, C.; Li, J.; Peng, W.; Wu, C. The Application of Fermentation Technology in Traditional Chinese Medicine: A Review. Am. J. Chin. Med. 2020, 48, 899–921. [Google Scholar] [CrossRef] [PubMed]
  13. Martel, J.; Ko, Y.-F.; Ojcius, D.M.; Lu, C.-C.; Chang, C.-J.; Lin, C.-S.; Lai, H.-C.; Young, J.D. Immunomodulatory Properties of Plants and Mushrooms. Trends Pharmacol. Sci. 2017, 38, 967–981. [Google Scholar] [CrossRef]
  14. Maleš, I.; Pedisić, S.; Zorić, Z.; Elez-Garofulić, I.; Repajić, M.; You, L.; Vladimir-Knežević, S.; Butorac, D.; Dragović-Uzelac, V. The medicinal and aromatic plants as ingredients in functional beverage production. J. Funct. Foods 2022, 96, 105210. [Google Scholar] [CrossRef]
  15. Etheridge, C.J.; Derbyshire, E. Herbal infusions and health: A review of findings from human studies, mechanisms and future research directions. Food Sci. Nutr. 2020, 50, 969–985. [Google Scholar] [CrossRef]
  16. Thakkar, S.; Anklam, E.; Xu, A.; Ulberth, F.; Li, J.; Li, B.; Hugas, M.; Sarma, N.; Crerar, S.; Swift, S.; et al. Regulatory landscape of dietary supplements and herbal medicines from a global perspective. Regul. Toxicol. Pharmacol. 2020, 114, 104647. [Google Scholar] [CrossRef]
  17. Lin, B.; Guo, S.; Hong, X.; Jiang, X.; Li, H.; Li, J.; Guo, L.; Li, M.; Chen, J.; Huang, B.; et al. Profiling of the Compounds in the Chinese herbal Formula Li Chang Decoction by UPLC-QTOF/MS. Evid.-Based Complement. Altern. Med. 2022, 2022, 1–22. [Google Scholar] [CrossRef]
  18. Wang, S.; Chen, H.; Sun, B. Recent progress in food flavor analysis using gas chromatography–ion mobility spectrometry (GC–IMS). Food Chem. 2020, 315, 126158. [Google Scholar] [CrossRef]
  19. Azmin, S.N.H.M.; Manan, Z.A.; Alwi, S.R.W.; Chua, L.S.; Mustaffa, A.A.; Yunus, N.A. Herbal Processing and Extraction Technologies. Sep. Purif. Rev. 2016, 45, 305–320. [Google Scholar] [CrossRef]
  20. Wu, X.; Wang, S.; Lu, J.; Jing, Y.; Li, M.; Cao, J.; Bian, B.; Hu, C. Seeing the unseen of Chinese herbal medicine processing (Paozhi): Advances in new perspectives. Chin. Med. 2018, 13, 4. [Google Scholar] [CrossRef]
  21. Sun, Y.-J.; Rukeya, J.; Tao, W.-Y.; Sun, P.-L.; Ye, X.-Q. Bioactive compounds and antioxidant activity of wolfberry infusion. Sci. Rep. 2017, 7, 40605. [Google Scholar] [CrossRef] [PubMed] [Green Version]
  22. Han, S.; Zhang, H.; Yin, H.; Zhang, Q. Characteristics of Inoculated Multi-Stage Apple Fermentation Over Spontaneous Fermentation for the Production of Traditional Functional Beverage Jiaosu: Antioxidant, Antibacterial Activities and Metabolic Changes. Curr. Res. Nutr. Food Sci. J. 2021, 9, 606–617. [Google Scholar] [CrossRef]
  23. Peng, L.-X.; Zou, L.; Tan, M.-L.; Deng, Y.-Y.; Yan, J.; Yan, Z.-Y.; Zhao, G. Free amino acids, fatty acids and phenolic compounds in Tartary buckwheat of different hull colour. Czech J. Food Sci. 2017, 35, 214–222. [Google Scholar] [CrossRef]
  24. Liu, R.-H. Health benefits of fruit and vegetables are from additive and synergistic combinations of phytochemicals. Am. J. Clin. Nutr. 2003, 78, 517S–520S. [Google Scholar] [CrossRef] [PubMed]
  25. Gorissen, S.H.M.; Crombag, J.J.R.; Senden, J.M.G.; Waterval, W.A.H.; Bierau, J.; Verdijk, L.B.; van Loon, L.J.C. Protein content and amino acid composition of commercially available plant-based protein isolates. Amino Acids 2018, 50, 1685–1695. [Google Scholar] [CrossRef]
  26. Yang, J.; Jiang, C.; Bao, R.; Liu, M.; Lv, J.; Yang, Z.; Xu, W.; Liang, H.; Ji, C.; Li, S.; et al. Effects of flavourzyme addition on physicochemical properties, volatile compound components and microbial community succession of Suanzhayu. Int. J. Food Microbiol. 2020, 334, 108839. [Google Scholar] [CrossRef]
  27. FAO/WHO. Protein and Amino Acid Requirements in Human Nutrition. In Report of A Joint WHO/FAO/UNU Expert Consultation; WHO Technical Report Series No. 935; World Health Organization: Geneva, Switzerland, 2007. [Google Scholar]
  28. Lenis, N.P.; Van Diepen, H.T.M.; Bikker, P.; Jongbloed, A.W.; Van Der Meulen, J. Effect of the ratio between essential and nonessential amino acids in the diet on utilization of nitrogen and amino acids by growing pigs. J. Anim. Sci. 1999, 77, 1777–1787. [Google Scholar] [CrossRef]
  29. Park, M.K.; Kim, Y.-S. Distinctive Formation of Volatile Compounds in Fermented Rice Inoculated by Different Molds, Yeasts, and Lactic Acid Bacteria. Molecules 2019, 24, 2123. [Google Scholar] [CrossRef]
  30. Zeng, X.; Xia, W.; Jiang, Q.; Xu, Y.; Fan, J. Contribution of Mixed Starter Cultures to Flavor Profile of Suanyu—A Traditional Chinese Low-Salt Fermented Whole Fish. J. Food Process. Preserv. 2017, 41, e13131. [Google Scholar] [CrossRef]
  31. Zhang, L.; Mi, S.; Liu, R.-B.; Sang, Y.-X.; Wang, X.-H. Evaluation of Volatile Compounds during the Fermentation Process of Yogurts by Streptococcus thermophilus Based on Odor Activity Value and Heat Map Analysis. Int. J. Anal. Chem. 2020, 2020, 1–10. [Google Scholar] [CrossRef]
  32. Giri, A.; Osako, K.; Ohshima, T. Identification and characterisation of headspace volatiles of fish miso, a Japanese fish meat based fermented paste, with special emphasis on effect of fish species and meat washing. Food Chem. 2010, 120, 621–631. [Google Scholar] [CrossRef]
  33. Li, Y.; Zhang, L.; Wang, W. Formation of Aldehyde and Ketone Compounds during Production and Storage of Milk Powder. Molecules 2012, 17, 9900–9911. [Google Scholar] [CrossRef] [PubMed]
  34. Kang, D.-W.; DiBaise, J.K.; Ilhan, Z.E.; Crowell, M.D.; Rideout, J.R.; Caporaso, J.G.; Rittmann, B.E.; Krajmalnik-Brown, R. Gut microbial and short-chain fatty acid profiles in adults with chronic constipation before and after treatment with lubiprostone. Anaerobe 2015, 33, 33–41. [Google Scholar] [CrossRef] [PubMed]
  35. Wang, C.; Li, L.; Guan, H.; Tong, S.; Liu, M.; Liu, C.; Zhang, Z.; Du, C.; Li, P. Effects of taurocholic acid on immunoregulation in mice. Int. Immunopharmacol. 2013, 15, 217–222. [Google Scholar] [CrossRef] [PubMed]
  36. de Andrade, V.L.; Mateus, M.L.; Aschner, M.; Dos Santos, A.M. Assessment of Occupational Exposures to Multiple Metals with Urinary Porphyrin Profiles. J. Integr. OMICS 2018, 8, 216. [Google Scholar] [CrossRef] [PubMed]
  37. De Almeida, P.W.M.; Melo, M.B.; Lima, R.D.F.; Gavioli, M.; Santiago, N.M.; Greco, L.; Jesus, I.C.; Nocchi, E.; Parreira, A.; Alves, M.N.; et al. Beneficial Effects of Angiotensin-(1–7) Against Deoxycorticosterone Acetate–Induced Diastolic Dysfunction Occur Independently of Changes in Blood Pressure. Hypertension 2015, 66, 389–395. [Google Scholar] [CrossRef] [PubMed]
  38. Zarei, M.; Shivanandappa, T.; Zarei, M. Natural bioactive 4-Hydroxyisophthalic acid (4-HIPA) exhibited antiproliferative potential by upregulating apoptotic markers in in vitro and in vivo cancer models. Mol. Biol. Rep. 2020, 47, 5343–5353. [Google Scholar] [CrossRef]
  39. Li, S.; Li, S.-K.; Gan, R.-Y.; Song, F.-L.; Kuang, L.; Li, H.-B. Antioxidant capacities and total phenolic contents of infusions from 223 medicinal plants. Ind. Crop. Prod. 2013, 51, 289–298. [Google Scholar] [CrossRef]
  40. Liao, W.; Shen, J.; Manickam, S.; Li, S.; Tao, Y.; Li, D.; Liu, D.; Han, Y. Investigation of blueberry juice fermentation by mixed probiotic strains: Regression modeling, machine learning optimization and comparison with fermentation by single strain in the phenolic and volatile profiles. Food Chem. 2023, 405, 134982. [Google Scholar] [CrossRef]
  41. Zheng, H.; Du, Q.; Yin, J.; Gao, Y. A narrative review on the main chemical constituents and bioactivity of Camellia nitidissima Chi. Longhua Chin. Med. 2022, 5, 1–17. [Google Scholar] [CrossRef]
  42. Son, C.-G.; Lee, S.-K.; Choi, I.-K.; Jang, E.-S.; Bang, K.-J. Herbal Transformation by Fermentation. J. Acupunct. Meridian Stud. 2020, 13, 167–168. [Google Scholar] [CrossRef]
  43. Pan, Y.; Li, H.; Chen, X.; Fan, Y.; Zhang, B.; Liu, R.; Deng, Z.-Y. Antioxidant interactions between hydrophilic and lipophilic phytochemicals are influenced by their ratios and total concentrations. Food Biosci. 2021, 45, 101465. [Google Scholar] [CrossRef]
  44. Magne, F.; Gotteland, M.; Gauthier, L.; Zazueta, A.; Pesoa, S.; Navarrete, P.; Balamurugan, R. The Firmicutes/Bacteroidetes Ratio: A Relevant Marker of Gut Dysbiosis in Obese Patients? Nutrients 2020, 12, 1474. [Google Scholar] [CrossRef] [PubMed]
  45. Yoshida, N.; Yamashita, T.; Osone, T.; Hosooka, T.; Shinohara, M.; Kitahama, S.; Sasaki, K.; Sasaki, D.; Yoneshiro, T.; Suzuki, T.; et al. Bacteroides spp. promotes branched-chain amino acid catabolism in brown fat and inhibits obesity. Iscience 2021, 24, 103342. [Google Scholar] [CrossRef]
  46. Binda, C.; Lopetuso, L.R.; Rizzatti, G.; Gibiino, G.; Cennamo, V.; Gasbarrini, A. Actinobacteria: A relevant minority for the maintenance of gut homeostasis. Dig. Liver Dis. 2018, 50, 421–428. [Google Scholar] [CrossRef]
  47. Bradley, P.H.; Pollard, K.S. Proteobacteria explain significant functional variability in the human gut microbiome. Microbiome 2017, 5, 36. [Google Scholar] [CrossRef] [PubMed]
  48. Xu, Y.; Zhang, Z.; Wang, B.; He, X.; Tang, J.; Peng, W.; Zhou, J.; Wang, Y. Flammulinavelutipes Polysaccharides Modulate Gut Microbiota and Alleviate Carbon Tetrachloride-Induced Hepatic Oxidative Injury in Mice. Front. Microbiol. 2022, 13, 847653. [Google Scholar] [CrossRef] [PubMed]
  49. Xu, Y.; Wang, N.; Tan, H.-Y.; Li, S.; Zhang, C.; Feng, Y. Function of Akkermansia muciniphila in Obesity: Interactions With Lipid Metabolism, Immune Response and Gut Systems. Front. Microbiol. 2020, 11, 219. [Google Scholar] [CrossRef]
  50. Derrien, M.; Turroni, F.; Ventura, M.; van Sinderen, D. Insights into endogenous Bifidobacterium species in the human gut microbiota during adulthood. Trends Microbiol. 2022, 30, 940–947. [Google Scholar] [CrossRef]
  51. Dempsey, E.; Corr, S.C. Lactobacillus spp. for Gastrointestinal Health: Current and Future Perspectives. Front. Immunol. 2022, 13, 840245. [Google Scholar] [CrossRef]
  52. Yeoh, Y.K.; Sun, Y.; Ip, L.Y.T.; Wang, L.; Chan, F.K.L.; Miao, Y.; Ng, S.C. Prevotella species in the human gut is primarily comprised of Prevotella copri, Prevotella stercorea and related lineages. Sci. Rep. 2022, 12, 9055. [Google Scholar] [CrossRef] [PubMed]
  53. Wang, Z.; Usyk, M.; Vázquez-Baeza, Y.; Chen, G.-C.; Isasi, C.R.; Williams-Nguyen, J.S.; Hua, S.; McDonald, D.; Thyagarajan, B.; Daviglus, M.L.; et al. Microbial co-occurrence complicates associations of gut microbiome with US immigration, dietary intake and obesity. Genome Biol. 2021, 22, 336. [Google Scholar] [CrossRef] [PubMed]
  54. Ma, Q.; Li, Y.; Wang, J.; Li, P.; Duan, Y.; Dai, H.; An, Y.; Cheng, L.; Wang, T.; Wang, C.; et al. Investigation of gut microbiome changes in type 1 diabetic mellitus rats based on high-throughput sequencing. Biomed. Pharmacother. 2020, 124, 109873. [Google Scholar] [CrossRef] [PubMed]
  55. Fang, B.; Xu, H.; Liu, Y.; Qi, F.; Zhang, W.; Chen, H.; Wang, C.; Wang, Y.; Yang, W.; Li, S. Mutagenesis and redox partners analysis of the P450 fatty acid decarboxylase OleTJE. Sci. Rep. 2017, 7, 44258. [Google Scholar] [CrossRef]
  56. Lynch, J.B.; Gonzalez, E.L.; Choy, K.; Faull, K.F.; Jewell, T.; Arellano, A.; Liang, J.; Yu, K.B.; Paramo, J.; Hsiao, E.Y. Turicibacter Modifies Host Bile Acids and Lipids in A Strain-Specific Manner. BioRxiv 2022, 27, 497673. [Google Scholar] [CrossRef]
Figure 1. Compositions of essential (a) and nonessential amino acids (b) in the four treatment groups. **, p < 0.01, *, p < 0.05.
Applsci 13 02154 g001
Figure 2. HS-GC-IMS topographic plots (top panel) and gallery plot fingerprints (bottom panel) of volatile flavor compounds in samples from groups #2, #3, and #4. Top panel in left to right and bottom panel in top-down order.
Applsci 13 02154 g002
Figure 3. Comparative analysis of the relative contents (%) of volatile compounds in herbal broth subjected to enzymatic hydrolysis and fermentation. (a) Effect of enzymatic hydrolysis and fermentation; (b) Comparison of direct plant extraction and probiotic fermentation.
Applsci 13 02154 g003
Figure 4. Volcano plots of differential compounds from four groups. The red dots indicate significantly upregulated compounds, and the blue dots represent significantly downregulated compounds. (a) Group #2 vs. group #3; (b) group #2 vs. group #4; (c) group #3 vs. group #4; (d) group #1 vs. group #4.
Applsci 13 02154 g004aApplsci 13 02154 g004b
Figure 5. HS-GC-IMS topographic plots (top panel) and gallery plot fingerprints (bottom panel) of volatile flavor compounds in samples from group #1 and group #4. Top panel in left to right and bottom panel in top-down order.
Applsci 13 02154 g005
Figure 6. Antioxidative profiles of herbal broths from all four treatments. The data represent the means ± SD (n = 3). **, p < 0.01.
Applsci 13 02154 g006
Figure 7. Comparison of the gut microbiota by the relative abundances at the phylum (a) and genus level (b).
Applsci 13 02154 g007
Table 1. Experimental setup and corresponded treatments.
Treatment (Group ID)Extraction ProcedureFinal Concentration
Direct extraction (DE, #1)Ethanol maceration, then hot water decoction1 kg/L
Standard decoction (SD, #2)Water maceration with enzymes, then hot water decoction1 kg/L
Spontaneous fermentation (SF, #3)Water maceration with enzymes, then ferment with endogenous microorganisms, hot water decoction1 kg/L
Inoculated fermentation
(IF, #4)
Water maceration with enzymes, hot water decoction, filtration to separate herbal residue, herbal solution ferment with probiotic inoculums1 kg/L
Table 2. Operating conditions of the HS-GC-IMS system.
HS-GC-IMS UnitParameters
Analysis time (sample reading)20 min
Chromatographic Column TypeMXT-5, 15 m × 0.53 mm × 1 μm
Column temperature60 °C
Drift gas/carrier gasN2 (99.999% purity)
IMS temperature45 °C
Sample injection volume200 μL
Incubation time15 min
Incubation temperature60 °C
Temperature of the injection syringe65 °C
Rotary incubation speed500 rpm
Table 3. Contents of functional components in herbal broth from the four different treatments.
Sample IDFlavonoids (g/kg)Saponins Re (%)Crude Polysaccharide (g/L)
#10.56 ± 0.125.50 ± 0.700.93 ± 0.10
#24.27 ± 0.33 **39.02 ± 2.19 **6.54 ± 0.34 **
#31.77 ± 0.18 **1.61 ± 0.21 **3.91 ± 0.11 **
#44.07 ± 1.05 **25.30 ± 2.26 **7.50 ± 0.85 **
Note: The data represent the means ± SD (n = 3); ** p < 0.01.
Disclaimer/Publisher’s Note: The statements, opinions and data contained in all publications are solely those of the individual author(s) and contributor(s) and not of MDPI and/or the editor(s). MDPI and/or the editor(s) disclaim responsibility for any injury to people or property resulting from any ideas, methods, instructions or products referred to in the content.

