
Investigating Parents’ Attitudes towards the Use of Child Restraint Systems by Comparing Non-Users and User Parents

 ,
,  ,
, 

Abstract
1. Introduction
2. Health Belief Model
- (1).
- Perceived benefits of preventive action focuses on how people look for ways to stay healthy, prevent disease, or recover from it. Such practices lead to useful approaches to sensitivity prevention, and the decision to manifest such behaviors is based on weighing the benefits and drawbacks of the behavior. This refers to the perception of the benefits of using a CRS. For example, if using a child safety seat, it is not necessary to carry the child while in the car, and if using a child safety seat, it will be comfortable to take care of children in the car [22].
- (2).
- Health motivation refers to the emotional state that is stimulated by health-related matters, such as levels of attention, care, attitudes, and health values. For the use of a CRS, this would refer to giving weight to the road crashes that affect children’s safety (for example, getting in a road accident being the worst) or to the view that children’s health is the most important, and giving importance to the safety of your child/children when driving [7,18].
- (3).
- Perceived susceptibility refers to individuals’ direct beliefs regarding their own behavior. They believe or forecast that their disease avoidance measures are related to their chance of developing a disease or having some level of health difficulty. The perceived susceptibility to a disease is widely regarded as the most important factor influencing people’s attitudes toward good health. Regarding use of a CRS, with parents’ confidence in driving, a crash would not occur; as a result, there is no need to use a CRS. The question items are as follows: “I think a child safety seat is not needed when driving to nearby places”; “I have many years of driving experience”; “I can avoid crashes”; or “I think that a child safety seat is not quite important for experienced drivers” [9,23].
- (4).
- Perceived severity of disease refers to people’s beliefs about their ability to evaluate the severity of diseases or health problems. Furthermore, the causes of disabilities, death, difficulties, time-consuming cures, complicated diseases, or effects on social life are factors in determining perceived severity. However, the perceived susceptibility to disease correlates with the perceived severity of disease, allowing people to recognize and avoid the perceived threat of disease. From the CRS users’ viewpoint, it means that the impact of crashes will affect children. The question items are as follows: “In case of an accident where a child/children is/are not in child safety seats, it will affect the feelings of people I know, such as parents and elder relatives”; “In case of an accident where a child/children is/are not in a car safety seat, it may lead to deaths or disabilities as well as long-term treatment” [24].
- (5).
- Perceived barriers to preventive action refers to individuals’ beliefs in the possible obstacles that may influence their behavior. These beliefs are linked to negative health outcomes, such as healthcare expense and disease. As a result, they believe that the presence of numerous problems and obstacles will cause difficulty regarding their behavioral changes. Their perception of barriers to using a CRS refers to the difficulty of use and the cost of a CRS. The question items are as follows: “I think child safety seats are more expensive than their values or benefits”; “I think a good quality child safety seat is too costly for me to afford”; and “Installing a safety seat in a car is a hassle for me” [22,25].
- (6).
- Cue to action refers to the events that encourage an individual’s required behavior. These cues can be internal and external factors. This is the stimulus needed to trigger the decision-making process to accept a recommended health action. To reflect the aims of this study (development of guidelines for promotion and publicity), the questions focus on only the external factors; therefore, the questionnaires are based on promotion [14]. For example, from a hospital perspective, “Hospitals should provide child car seats for sale/rent/loan to the mother after giving birth,” and from the parents’ and surrounding peoples’ perspective, “A close friend thinks I should use a CRS when travelling” [15].
- (7).
- Modifying factors refer to those factors that have an indirect impact on health behavior through recognition and practice (demographic variables such as age, income, occupation, and educational level, as well as sociopsychological factors, such as health motivation, might influence an individual’s decision to use a CSS). However, the researchers did not analyze the mentioned factors due to their existence in multiple studies, such as that by Techakamonsuk [19].
3. Materials and Methods
3.1. Questionnaire Design
3.2. Data Collection
3.3. Methods
3.3.1. Exploratory Factor Analysis (EFA)
3.3.2. Confirmatory Factor Analysis (CFA)
3.3.3. Invariance Analysis of CFA and Model Specification
3.3.4. Structural Equation Modeling (SEM)
3.3.5. Incremental Fit Indices
4. Results
4.1. Descriptive Statistics
4.2. EFA Result
4.3. CFA and Invariance Measurement Results
4.4. SEM Results
5. Discussion
5.1. Measurement Models
5.1.1. Perceived Benefits (PB)
5.1.2. Health Motivation (HM)
5.1.3. Cues of Action (CA)
5.1.4. Perceived Susceptibility (PSU)
5.1.5. Perceived Severity (PSE)
5.1.6. Perceived Barriers (PBA)
5.2. Structural Models
6. Conclusions and Implementation
7. Limitations and Further Research
Author Contributions
Funding
Institutional Review Board Statement
Informed Consent Statement
Data Availability Statement
Conflicts of Interest
References
- Chaudhry, A.; Sanaullah, I.; Malik, B.Z.; Klair, A.A. An investigation of awareness, perceptions, and usage of child car seats in Pakistan. J. Transp. Health 2019, 13, 247–258. [Google Scholar] [CrossRef]
- Road Safety Thailand. E-Report System. Available online: https://www.disaster.go.th/th/home/ (accessed on 10 June 2022).
- Ramli, R.; Mohd Yunus, S.S. Malaysian Child Restraint Issues: A Brief Narrative Review. Int. J. Environ. Res. Public Health 2020, 17, 1922. [Google Scholar] [CrossRef]
- Petridou, E.; Skalkidou, A.; Lescohier, I.; Trichopoulos, D. Car restraints and seating position for prevention of motor vehicle injuries in Greece. Arch. Dis. Child. 1998, 78, 335. [Google Scholar] [CrossRef]
- World Health Organization. Global Status Report on Road Safety 2018; World Health Organization: Geneva, Switzerland, 2018. [Google Scholar]
- Pan, S.; Du, W.; Jiang, F.; Bilston, L.E.; Brown, J.; Shen, X. Exploring child car passenger safety practices in China: Experience from a parental survey in Shanghai. Inj. Prev. 2012, 18, 133–137. [Google Scholar] [CrossRef]
- Liu, X.; Yang, J.; Chen, X.; Li, L. Knowledge, Attitudes and Behaviors on Child Passenger Safety among Expectant Mothers and Parents of Newborns: A Qualitative and Quantitative Approach. PLoS ONE 2016, 11, e0146121. [Google Scholar] [CrossRef]
- Liu, X.; Yang, J.; Cheng, F.; Li, L. Newborn parent based intervention to increase child safety seat use. Int. J. Environ. Res. Public Health 2016, 13, 777. [Google Scholar] [CrossRef]
- Muir, C.; O’Hern, S.; Oxley, J.; Devlin, A.; Koppel, S.; Charlton, J. Parental role in children’s road safety experiences. Transp. Res. Part F 2017, 46, 195–204. [Google Scholar] [CrossRef]
- Champahom, T.; Jomnonkwao, S.; Satiennam, T.; Suesat, N.; Ratanavaraha, V. Modeling of safety helmet use intention among students in urban and rural Thailand based on the theory of planned behavior and Locus of Control. Soc. Sci. J. 2020, 57, 508–529. [Google Scholar] [CrossRef]
- Nambulee, W.; Jomnonkwao, S.; Siridhara, S.; Ratanavaraha, V. Modelling of seat belt use intention for intercity buses based on health belief model. Transp. A 2019, 15, 944–962. [Google Scholar] [CrossRef]
- Jomnonkwao, S.; Watthanaklang, D.; Sangphong, O.; Champahom, T.; Laddawan, N.; Uttra, S.; Ratanavaraha, V. A Comparison of Motorcycle Helmet Wearing Intention and Behavior between Urban and Rural Areas. Sustainability 2020, 12, 8395. [Google Scholar] [CrossRef]
- Bryant-Stephens, T.; Garcia-Espana, J.F.; Winston, F.K. Boosting restraint norms: A community-delivered campaign to promote booster seat use. Traffic Inj. Prev. 2013, 14, 578–583. [Google Scholar] [CrossRef]
- Jarahi, L.; Karbakhsh, M.; Rashidian, A. Parental willingness to pay for child safety seats in Mashad, Iran. BMC Public Health 2011, 11, 281. [Google Scholar] [CrossRef]
- Tan, R.M.R.; Dong, C.; Shen, G.Q.; Feng, J.X.Y.; Piragasam, R.; Tyebally, A.; Chong, S.-L. Parental knowledge and beliefs on the use of child car restraints in Singapore: A qualitative study. Singap. Med. J. 2019, 61, 102–107. [Google Scholar] [CrossRef]
- Charlton, J.; Koppel, S.; Fitzharris, M.; Congiu, M.; Fildes, B. Factors That Influence Children’s Booster Seat Use; Motor Accidents Authority, Monash University Accident Research Centre: Clayton, Australia, 2006. [Google Scholar]
- Chen, X.; Yang, J.; Peek-Asa, C.; McGehee, D.V.; Li, L. Parents’ knowledge, attitude, and use of child restraints, Shantou, China. Am. J. Prev. Med. 2014, 46, 85–88. [Google Scholar] [CrossRef]
- Elhalik, M.; El-Atawi, K.; Mahfouz, R. Assessment of mother’s knowledge on importance and need for Child Car Safety Seat in UAE. J. Ped. Neo. Care 2018, 8, 226–230. [Google Scholar]
- Techakamonsuk, P. Study of Using Child Safety Seat: Case Study of Thailand. Available online: http://164.115.27.97/digital/files/original/b63a15d4372c7f5e503eccf0a922b8d3.pdf (accessed on 2 May 2020).
- Rosenstock, I.M. Historical Origins of the Health Belief Model. Health Educ. Monog. 1974, 2, 328–335. [Google Scholar] [CrossRef]
- Maiman, L.A.; Becker, M.H. The Health Belief Model: Origins and Correlates in Psychological Theory*. Health Educ. Behav. 1974, 2, 336–353. [Google Scholar] [CrossRef]
- Mora, K.; Rive, G. Barriers to Child Restraint Use in New Zealand; Opus International Consultants Ltd.: Fredericton, NB, Canada, 2012. Available online: https://www.nzta.govt.nz/assets/resources/barriers-to-child-restraint-use-in-nz/docs/barriers-to-child-restraint-use-in-nz.pdf (accessed on 2 May 2020).
- Thornton, J.D.; Deb, A.; Murray, P.J.; Kelly, K.M. Car Seat Safety: Typologies of Protective Health and Safety Behaviors for Mothers in West Virginia. Matern. Child Health J. 2017, 21, 326–334. [Google Scholar] [CrossRef]
- Kakefuda, I.; Yamanaka, T.; Stallones, L.; Motomura, Y.; Nishida, Y. Child restraint seat use behavior and attitude among Japanese mothers. Accid. Anal. Prev. 2008, 40, 1234–1243. [Google Scholar] [CrossRef]
- Soori, H.; Ainy, E.; Bazargan-Hejazi, S. Opportunities, threats and barriers to enacting mandatory child car restraint laws in Iran. Inj. Cont. Safety Prom. 2015, 22, 314–319. [Google Scholar] [CrossRef]
- Champahom, T.; Jomnonkwao, S.; Nambulee, W.; Klungboonkrong, P.; Karoonsoontawong, A.; Ratanavaraha, V. Analyzing transport mode choice for aging society in Thailand. Eng. App. Sci. Res. 2020, 47, 383–392. [Google Scholar]
- Francis, J.; LaFond, R.; Per, M.O.; Schipper, K. Costs of Equity and Earnings Attributes. Account. Rev. 2004, 79, 967–1010. [Google Scholar] [CrossRef]
- Bromfield, N.; Mahmoud, M. An exploratory investigation of child safety seat use among citizens of the United Arab Emirates. J. Transp. Saf. Secu. 2016, 9, 130–148. [Google Scholar] [CrossRef]
- Kline, R.B. Principles and Practice of Structural Equation Modeling; Guilford Publications: New York, NY, USA, 2015. [Google Scholar]
- Mat Daud, K.A.; Khidzir, N.Z.; Ismail, A.R.; Abdullah, F.A. Validity and reliability of instrument to measure social media skills among small and medium entrepreneurs at Pengkalan Datu River. Inter. J. Deve. Sust. 2018, 7, 1026–1037. [Google Scholar]
- Hair, J.F., Jr.; Black, W.C.; Babin, B.J.; Anderson, R.E. Multivariate Data Analysis: Global Edition, 7th ed.; Pearson: New York, NY, USA, 2010. [Google Scholar]
- Chonsalasin, D.; Jomnonkwao, S.; Ratanavaraha, V. Measurement model of passengers’ expectations of airport service quality. Int. J. Transp. Sci. Tech. 2021, 10, 342–352. [Google Scholar] [CrossRef]
- Kyriazos, T.A. Applied psychometrics: Sample size and sample power considerations in factor analysis (EFA, CFA) and SEM in general. Psychology 2018, 9, 2207. [Google Scholar] [CrossRef]
- Kosfeld, R.; Lauridsen, J. Factor analysis regression. Stat. Pap. 2006, 49, 653–667. [Google Scholar] [CrossRef]
- Watthanaklang, D.; Ratanavaraha, V.; Chatpattananan, V.; Jomnonkwao, S. Measuring the motivation to ride bicycles for tourism through a comparison of tourist attractions. Transp. Policy 2016, 52, 153–163. [Google Scholar] [CrossRef]
- Wisutwattanasak, P.; Jomnonkwao, S.; Se, C.; Ratanavaraha, V. Influence of Psychological Perspectives and Demographics on Drivers’ Valuation of Road Accidents: A Combination of Confirmatory Factor Analysis and Preference Heterogeneity Model. Behav. Sci. 2022, 12, 336. [Google Scholar] [PubMed]
- Maydeu-Olivares, A.; Shi, D. Effect Sizes of Model Misfit in Structural Equation Models. Methodology 2017, 13, 23–30. [Google Scholar] [CrossRef]
- Feng, X.; Liu, M.; Huo, X.; Ma, W. What Motivates Farmers’ Adaptation to Climate Change? The Case of Apple Farmers of Shaanxi in China. Sustainability 2017, 9, 519. [Google Scholar] [CrossRef]
- Allen, J.; Muñoz, J.C.; de Dios Ortúzar, J. Understanding public transport satisfaction: Using Maslow’s hierarchy of (transit) needs. Transp. Policy 2019, 81, 75–94. [Google Scholar] [CrossRef]
- Allen, J.; Eboli, L.; Forciniti, C.; Mazzulla, G.; de Dios Ortúzar, J. The role of critical incidents and involvement in transit satisfaction and loyalty. Transp. Policy 2019, 75, 57–69. [Google Scholar] [CrossRef]
- Li, H.; Liu, Y.; Peng, K. Characterizing the relationship between road infrastructure and local economy using structural equation modeling. Transp. Policy 2018, 61, 17–25. [Google Scholar] [CrossRef]
- Ni, A.; Zhang, C.; Hu, Y.; Lu, W.; Li, H. Influence mechanism of the corporate image on passenger satisfaction with public transport in China. Transp. Policy 2020, 94, 54–65. [Google Scholar] [CrossRef]
- Meredith, W. Measurement invariance, factor analysis and factorial invariance. Psychometrika 1993, 58, 525–543. [Google Scholar] [CrossRef]
- Jomnonkwao, S.; Ratanavaraha, V.; Khampirat, B.; Meeyai, S.; Watthanaklang, D. Factors influencing customer loyalty to educational tour buses and measurement invariance across urban and rural zones. Transp. A 2015, 11, 659–685. [Google Scholar] [CrossRef]
- Gielen, A.C.; McDonald, E.M. Using the PRECEDE-PROCEED planning model to apply health behavior theories. Health Behav. Health Educ. 2002, 3, 409–436. [Google Scholar]
- Immekus, J.C. Multigroup CFA and alignment approaches for testing measurement invariance and factor score estimation: Illustration with the schoolwork-related anxiety survey across countries and gender. Methodology 2021, 17, 22–38. [Google Scholar] [CrossRef]
- Chonsalasin, D.; Jomnonkwao, S.; Chanpariyavatevong, K.; Laphrom, W.; Ratanavaraha, V. Modeling of airline passenger loyalty: A comparison of leisure and business travelers. Res. Transp. Bus. Manag. 2022, 43, 100735. [Google Scholar] [CrossRef]
- Hair, J.; Black, B.; Babin, B.; Anderson, R. Multivariate Data Analysis, 7th ed.; Upper Saddle River; Pearson Prentice Hall: New York, NY, USA, 2010. [Google Scholar]
- Chonsalasin, D.; Jomnonkwao, S.; Ratanavaraha, V. Key Determinants of Airline Loyalty Modeling in Thailand. Sustainability 2020, 12, 4165. [Google Scholar] [CrossRef]
- Jomnonkwao, S.; Uttra, S.; Ratanavaraha, V. Analysis of a driving behavior measurement model using a modified driver behavior questionnaire encompassing texting, social media use, and drug and alcohol consumption. Transp. Res. Interdis. Perspect. 2021, 9, 100302. [Google Scholar] [CrossRef]
- Barbaranelli, C.; Petitta, L.; Probst, T.M. Does safety climate predict safety performance in Italy and the USA? Cross-cultural validation of a theoretical model of safety climate. Accid. Anal. Prev. 2015, 77, 35–44. [Google Scholar] [CrossRef]
- Hu, L.T.; Bentler, P.M. Cutoff criteria for fit indexes in covariance structure analysis: Conventional criteria versus new alternatives. Struct. Equ. Model. A Multidiscip. J. 1999, 6, 1–55. [Google Scholar] [CrossRef]
- Ratanavaraha, V.; Jomnonkwao, S. Model of user’ expectations of drivers of sightseeing buses: Confirmatory factor analysis. Transp. Policy 2014, 36, 253–262. [Google Scholar] [CrossRef]
- Sum, S.; Jomnonkwao, S.; Champahom, T.; Beeharry, R.; Ratanavaraha, V. Measuring the city bus service quality based on users’ perceptions: City bus service in Phnom Penh, Cambodia. Eng. Appl. Sci. Res. 2020, 47, 47–55. [Google Scholar]
- Muthen, L.K.; Muthen, B.O. Mplus User’s Guide, 7th ed.; Muthén & Muthén: Los Angeles, CA, USA, 2012. [Google Scholar]
- Tahtali, Y. Use of factor scores in multiple regression analysis for estimation of body weight by certain body measurements in Romanov Lambs. PeerJ 2019, 7, e7434. [Google Scholar] [CrossRef]
- Keskin, S.; Daskiran, I.; Kor, A. Factor Analysis Scores in a Multiple Linear Regression Model for the Prediction of Carcass Weight in Akkeci Kids. J. Appl. Anim. Res. 2007, 31, 201–204. [Google Scholar] [CrossRef]
- Tehseen, S.; Ramayah, T.; Sajilan, S. Testing and Controlling for Common Method Variance: A Review of Available Methods. J. Manag. Sci. 2017, 4, 142–168. [Google Scholar] [CrossRef]
- Tavakol, M.; Dennick, R. Making sense of Cronbach’s alpha (in eng). Int. J. Med. Educ. 2011, 2, 53–55. [Google Scholar] [CrossRef]
- Taber, K.S. The Use of Cronbach’s Alpha When Developing and Reporting Research Instruments in Science Education. Res. Sci. Educ. 2018, 48, 1273–1296. [Google Scholar] [CrossRef]
- Cerit, A.G. Maritime Transport as an Area of Competitive Advantage in International Marketing. Int. J. Marit. Econ. 2000, 2, 49–67. [Google Scholar] [CrossRef]
- Lu, C.-S. Strategic groups in Taiwanese liner shipping. Marit. Policy Manag. 1999, 26, 1–26. [Google Scholar] [CrossRef]
- Champahom, T.; Jomnonkwao, S.; Karoonsoontawong, A.; Hantanong, N.; Beeharry, R.; Ratanavaraha, V. Modeling user perception of bus service quality: A case study in Mauritius. Songklanakarin J. Sci. Technol. 2020, 42, 660–670. [Google Scholar]
- Ibrahim, A.N.H.; Borhan, M.N.; Mhd Yunin, N.A. Getting Young Drivers to Buckle Up: Exploring the Factors Influencing Seat Belt Use by Young Drivers in Malaysia. Sustainability 2020, 13, 162. [Google Scholar] [CrossRef]
- Rozental, A.; Kottorp, A.; Boettcher, J.; Andersson, G.; Carlbring, P. Negative Effects of Psychological Treatments: An Exploratory Factor Analysis of the Negative Effects Questionnaire for Monitoring and Reporting Adverse and Unwanted Events. PLoS ONE 2016, 11, e0157503. [Google Scholar] [CrossRef] [PubMed]
- Brown, T.A. Confirmatory Factor Analysis for Applied Research; Guilford Publications: New York, NY, USA, 2015. [Google Scholar]
- Ross, T.P.; Ross, L.T.; Rahman, A.; Cataldo, S. The bicycle helmet attitudes scale: Using the health belief model to predict helmet use among undergraduates, (in eng). J. Am. Coll. Health 2010, 59, 29–36. [Google Scholar] [CrossRef]
- Simpson, E.M.; Moll, E.K.; Kassam-Adams, N.; Miller, G.J.; Winston, F.K. Barriers to booster seat use and strategies to increase their use, (in eng). Pediatrics 2002, 110, 729–736. [Google Scholar] [CrossRef]
- Ali, M.; Haidar, N.; Ali, M.M.; Maryam, A. Determinants of Seat Belt Use Among Drivers in Sabzevar, Iran: A Comparison of Theory of Planned Behavior and Health Belief Model. Traffic Inj. Prev. 2011, 12, 104–109. [Google Scholar] [CrossRef]
- Cai, W.; Lei, L.; Zhou, H.; Wang, Y.; Peng, J.; Jin, Y.; Deng, X. Child restraint system use and its associated factors in Shenzhen. Accid. Anal. Prev. 2021, 160, 106321. [Google Scholar] [CrossRef]
- Tessier, K. Effectiveness of hands-on education for correct child restraint use by parents. Accid. Anal. Prev. 2010, 42, 1041–1047. [Google Scholar] [CrossRef] [PubMed]
- Nelson, A.; Modeste, N.N.; Marshak, H.H.; Hopp, J.W. Using the theory of planned behavior to predict infant restraint use in Saudi Arabia. Saudi Med. J. 2014, 35, 959–966. [Google Scholar] [PubMed]
- Uttra, S.; Laddawan, N.; Ratanavaraha, V.; Jomnonkwao, S. Explaining Sex Differences in Motorcyclist Riding Behavior: An Application of Multi-Group Structural Equation Modeling. Int. J. Environ. Res. Public Health 2020, 17, 8797. [Google Scholar] [CrossRef] [PubMed]
- Ang, J.Y.; Lai, J.M.; Hss, A.S.; Ramalingam, P.; Ramasamy, M.; Zainuddin, N.S.; Shaari, H.; Ahmad-Aduan, A.; Sanimi, N.S.; Bahari, N. Awareness, perception and experience on child restraint system (CRS) and its legislation among Malaysian parents with newborns. Traffic Inj. Prev. 2020, 21, 278–282. [Google Scholar] [CrossRef] [PubMed]
- AlAmmar, H.F.; Jahan, S. The Prevalence of Child Restraint System Use and Pattern of Child Transportation in Buraidah City. J. Fam. Med. Pri. Care 2021, 10, 2810–2815. [Google Scholar] [CrossRef]
- McDonald, C.C.; Kennedy, E.; Fleisher, L.; Zonfrillo, M.R. Situational Use of Child Restraint Systems and Carpooling Behaviors in Parents and Caregivers. Int. J. Environ. Res. Public Health 2018, 15, 1788. [Google Scholar] [CrossRef]
- Will, K.E.; Sabo, C.S.; Porter, B.E. Evaluation of the Boost em in the Back Seat Program: Using fear and efficacy to increase booster seat use. Accid. Anal. Prev. 2009, 41, 57–65. [Google Scholar] [CrossRef]
- King, N. BMW Malaysia Launches Infant Carrier Car Seat Subsidy Programme for Low Income Households. Available online: https://www.nst.com.my/cbt/2019/12/544457/bmw-malaysia-launches-infant-carrier-car-seat-subsidy-programme-low-income (accessed on 20 September 2022).
- Jantachote, S. Implementation of laws concerning the compulsory use of child car seats on personal motor vehicles and safety standards for child car seats and isofix systems. Thammasat Bus. Law J. 2017, 7, 1–17. [Google Scholar]
- Weaver, N.L.; Brixey, S.N.; Williams, J.; Nansel, T.R. Promoting correct car seat use in parents of young children: Challenges, recommendations, and implications for health communication. Health Prom. Pract. 2013, 14, 301–307. [Google Scholar] [CrossRef]
- Venkatraman, V.; Richard, C.M.; Magee, K.; Johnson, K. Countermeasures That Work: A Highway Safety Countermeasure Guide for State Highway Safety Offices, 10th ed.; 2020 (Report No. DOT HS 813 097); National Highway Traffic Safety Administration: Washington, DC, USA, 2020. Available online: https://www.nhtsa.gov/sites/nhtsa.gov/files/2021-09/15100_Countermeasures10th_080621_v5_tag.pdf (accessed on 20 September 2022).
- Zaza, S.; Sleet, D.A.; Thompson, R.S.; Sosin, D.M.; Bolen, J.C. Reviews of evidence regarding interventions to increase use of child safety seats. Am. J. Prev. Med. 2001, 21, 31–47. [Google Scholar] [CrossRef]
- Mon, E.E.; Jomnonkwao, S.; Khampirat, B.; Satiennam, T.; Ratanavaraha, V. Estimating the willingness to pay and the value of fatality risk reduction for car drivers in Myanmar. Case Stud. Transp. Policy 2019, 7, 301–309. [Google Scholar] [CrossRef]
- Mon, E.E.; Jomnonkwao, S.; Khampirat, B.; Satiennam, W.; Ratanavaraha, V. Willingness to pay for mortality risk reduction for traffic accidents in Myanmar. Accid. Anal. Prev. 2018, 118, 18–28. [Google Scholar] [CrossRef] [PubMed]


| Literature | Data Collection Area | Child Restraint Type | Aims of the Study | Theory | Method | ||
|---|---|---|---|---|---|---|---|
| CSS | BS | SB | |||||
| Bryant-Stephens et al. [13] | Pennsylvania, USA | ✓ | To evaluate the effectiveness of a theoretically grounded, community-delivered marketing campaign to promote belt-positioning booster seats | Generalized linear model | |||
| Charlton et al. [16] | New South Wales and Victoria, Australia | ✓ | ✓ | To design to gather more knowledge about restraint usage rates, patterns of restraint usage, and ‘appropriateness’ of restraint use by children of the ‘booster seat age’, as well as the attitudes of parents of children in the booster seat age group towards restraint-wearing behavior | T-tests and chi-squares | ||
| Chaudhry et al. [1] | Pakistan | ✓ | To identify problems that influence non-usage among knowledgeable parents, as well as to explore the need and interventions for conducting effective awareness campaigns or educational programs for parents in the country | Spearman correlations and logistic regression analysis | |||
| Chen et al. [17] | Shantou, China | ✓ | ✓ | ✓ | To describe child restraint use and examine the driver’s knowledge of and attitude toward the use of child restraints | Multivariable regression | |
| Techakamonsuk [19] | Thailand | ✓ | To identify the factors supporting effective child safety seat use and to develop effective policies | PRECEDE-PROCEED | Chi-square test | ||
| Elhalik et al. [18] | Dubai, UAE | ✓ | To evaluate maternal awareness and perception on child car safety seat usage | Chi-square and Fisher’s test | |||
| Jarahi et al. [14] | Mashad, Iran | ✓ | To assess parental willingness to pay for child car safety seats in Mashad, Iran | Logistic regression model | |||
| Liu et al. [7] | Shantou, China | ✓ | To investigate the knowledge, attitudes, and intended behaviors about use of child safety seats among parents of newborns and explore expectant mothers’ views and decisions regarding child safety seats use | A qualitative and quantitative (logistics regression) approach | |||
| Liu et al. [8] | Shantou, China | ✓ | To determine the effect of intervention on the improvement of knowledge of child passenger safety and use of CSS among parents with newborns. We hypothesized that parents assigned into the intervention group who received education and free CSS would have greater increases in child passenger safety knowledge and use of CSS, as compared to parents in the education only or control groups | Chi-square tests and logistic regression | |||
| Tan et al. [15] | Singapore | ✓ | To understand parental knowledge, beliefs, and barriers regarding the use of child car restraints (CCRs) | a qualitative study | |||
| Ramli et al. [3] * | Malaysia | ✓ | (1) To determine the prevalence of the use of CRSs in Malaysia, (2) to evaluate injuries related to unrestrained children, and (3) to show the nation’s preparation towards implementation of a child restraint law | ||||
| This study | Thailand | ✓ | ✓ | To understand the attitude of parents toward child safety seat use by comparing parent groups that use and do not use CSS | Health belief model | Measurement of invariance confirmatory factor analysis | |
| Variable | Description | CRS Non-User | CRS User | t-Test for Equality of Means | ||||
|---|---|---|---|---|---|---|---|---|
| Mean | S.D | Mean | S.D | t | df | p-Value | ||
| Perceived Benefits | ||||||||
| PB1 | I think, if using a child restraint system, it is not necessary to carry the child while in the car. | 4.42 | 0.64 | 4.51 | 0.61 | −2.05 | 779.28 | 0.04 |
| PB2 | I think, if using a child restraint system, it will be comfortable to take care of children in the car. | 4.51 | 0.60 | 4.49 | 0.64 | 0.45 | 744.39 | 0.66 |
| PB3 | I think using a child restraint system can reduce crash injury severity. | 4.50 | 0.64 | 4.54 | 0.62 | −1.03 | 773.05 | 0.30 |
| Health motivation | ||||||||
| HM1 | I think being involved in a road crash is the worst. | 3.90 | 0.78 | 3.92 | 0.75 | −0.22 | 775.12 | 0.82 |
| HM2 | I think the health of my child/children is the most important. | 3.93 | 0.75 | 3.89 | 0.77 | 0.70 | 761.55 | 0.48 |
| HM3 | I give great importance to my child/children’s safety when driving. | 3.82 | 0.82 | 3.83 | 0.81 | −0.18 | 771.60 | 0.86 |
| Cue to Action | ||||||||
| CA1 | I think that hospitals should provide child car seats for sale/rent/loan to the mother after giving birth. | 4.46 | 0.67 | 4.47 | 0.70 | −0.26 | 756.90 | 0.80 |
| CA2 | My close friend thinks I should use a child restraint system when I travel. | 3.05 | 0.70 | 3.06 | 0.73 | −0.18 | 754.82 | 0.85 |
| CA3 | I think that the government should promote the use of child restraint systems by supporting the purchases. | 4.76 | 0.50 | 4.78 | 0.47 | −0.49 | 779.88 | 0.62 |
| Perceived Susceptibility | ||||||||
| PSU1 | I think a child restraint system is not needed when driving to nearby places. | 2.83 | 0.70 | 2.74 | 0.68 | 1.69 | 773.22 | 0.09 |
| PSU2 | I have years of driving experience; I can avoid crashes. | 2.87 | 0.74 | 2.82 | 0.73 | 0.89 | 769.82 | 0.38 |
| PSU3 | I think a child restraint system is not quite important for experienced drivers. | 2.73 | 0.71 | 2.70 | 0.75 | 0.47 | 751.31 | 0.64 |
| Perceived Severity | ||||||||
| PSE1 | In case of a crash where a child/children is/are not in a child restraint system, it may affect their education. | 4.00 | 0.74 | 3.94 | 0.74 | 1.25 | 769.33 | 0.21 |
| PSE2 | In case of a crash where a child/children is/are not in a safety seat, it will affect the feelings of people I know, such as parents, elder relatives, etc. | 3.88 | 0.78 | 3.88 | 0.76 | −0.11 | 775.46 | 0.91 |
| PSE3 | In case of a crash where a child/children is/are not in a child restraint system, it may affect their future. | 3.79 | 0.74 | 3.76 | 0.70 | 0.63 | 779.34 | 0.53 |
| Perceived Barriers | ||||||||
| PBA1 | I think child restraint systems are more expensive than the value or benefits they offer. | 4.44 | 0.71 | 4.33 | 0.73 | 2.15 | 760.34 | 0.03 |
| PBA2 | Installing safety seats in a car is a hassle for me. | 3.86 | 1.08 | 3.90 | 0.98 | −0.52 | 798.00 | 0.60 |
| PBA3 | I think a child restraint system of good quality is too costly for me to afford. | 4.42 | 0.68 | 4.38 | 0.72 | 0.82 | 751.55 | 0.41 |
| Characteristic | CRS Non-User | CRS User | |||
|---|---|---|---|---|---|
| Count | % | Count | % | ||
| Gender | Male | 254 | 31.80% | 171 | 21.40% |
| Female | 186 | 23.30% | 189 | 23.60% | |
| Average age (years) mean ± S.D. | 36.18 ± 9.92 | 35.88 ± 9.22 | |||
| Average children age (years) mean ± S.D. | 2.96 ± 1.80 | 2.66 ± 2.02 | |||
| Child relationship | Parent | 300 | 37.50% | 228 | 28.50% |
| Relative | 140 | 17.50% | 132 | 16.50% | |
| Education | Primary school | 41 | 5.10% | 30 | 3.80% |
| Junior high school | 65 | 8.10% | 56 | 7.00% | |
| High school | 65 | 8.10% | 43 | 5.40% | |
| High vocational | 33 | 4.10% | 22 | 2.80% | |
| Bachelor’s degree | 211 | 26.40% | 196 | 24.50% | |
| Master’s degree and higher | 27 | 3.10% | 13 | 1.70% | |
| Occupation | Government officer | 10 | 1.30% | 11 | 1.40% |
| Private sector | 126 | 15.80% | 113 | 14.10% | |
| Private business | 167 | 20.90% | 121 | 15.10% | |
| Agriculturist | 59 | 7.40% | 57 | 7.10% | |
| Student | 18 | 2.30% | 19 | 2.40% | |
| General employee | 60 | 7.50% | 39 | 4.90% | |
| Salary (THB per month) | 10,001–20,000 | 11 | 1.40% | 10 | 1.30% |
| 20,001–30,000 | 114 | 14.30% | 94 | 11.80% | |
| 30,001–40,000 | 71 | 8.90% | 77 | 9.60% | |
| 40,001–50,000 | 77 | 9.60% | 60 | 7.50% | |
| 50,001–60,000 | 63 | 7.90% | 39 | 4.90% | |
| 60,6001–70,000 | 58 | 7.30% | 44 | 5.50% | |
| >70,001 | 46 | 5.80% | 36 | 4.50% | |
| Urbanization | Urban | 206 | 25.80% | 103 | 12.90% |
| Sub-urban | 105 | 13.10% | 145 | 18.10% | |
| Rural | 129 | 16.10% | 112 | 14.00% | |
| Marital status | Married | 204 | 25.50% | 184 | 23.00% |
| Others | 236 | 29.50% | 176 | 22.00% | |
| Frequency of travelling with the child | Less than 1 time | 141 | 17.60% | 124 | 15.50% |
| 1–2 times per week | 114 | 14.30% | 97 | 12.10% | |
| 3–5 times per week | 64 | 8.00% | 60 | 7.50% | |
| Every time of travelling | 121 | 15.10% | 79 | 9.90% | |
| Vehicle type | Pickup | 44 | 5.50% | 32 | 4.00% |
| Four- door pickup | 144 | 18.00% | 132 | 16.50% | |
| Car | 143 | 17.90% | 111 | 13.90% | |
| SUV | 50 | 6.30% | 33 | 4.10% | |
| Pick-up passenger vehicle | 59 | 7.40% | 52 | 6.50% | |
| Province | Bangkok | 89 | 11.10% | 71 | 8.90% |
| Chiang Mai | 88 | 11.00% | 72 | 9.00% | |
| Chonburi | 86 | 10.80% | 74 | 9.30% | |
| Nakhon Ratchasima | 86 | 10.80% | 74 | 9.30% | |
| Songkhla | 91 | 11.40% | 69 | 8.60% | |
| Using CRS | 1 = Never (0%) | 440 | 55.00% | 0 | 0.00% |
| 2 = Occasionally (approximately 25%) | 0 | 0.00% | 6 | 0.75% | |
| 3 = Sometimes (approximately 50%) | 0 | 0.00% | 28 | 3.50% | |
| 4 = Often (approximately 75%) | 0 | 0.00% | 60 | 7.50% | |
| 5 = Always (100%) | 0 | 0.00% | 266 | 33.25% | |
| Observed Variable | Factor | Variance Explained | |||||||
|---|---|---|---|---|---|---|---|---|---|
| Cronbach’s Alpha | 1 | 2 | 3 | 4 | 5 | 6 | Eigenvalues | % of Variance | |
| Perceived Benefits | 0.624 | 4.912 | 27.29 | ||||||
| PB1 | 0.603 | −0.168 | 0.104 | −0.178 | 0.066 | 0.049 | |||
| PB2 | 0.728 | −0.152 | −0.002 | −0.023 | −0.028 | 0.035 | |||
| PB3 | 0.403 | −0.057 | 0.030 | −0.077 | 0.089 | 0.139 | |||
| Health Motivation | 0.816 | 1.711 | 9.507 | ||||||
| HM1 | −0.395 | 0.355 | −0.126 | 0.475 | −0.116 | −0.192 | |||
| HM2 | −0.441 | 0.305 | −0.139 | 0.460 | −0.116 | −0.222 | |||
| HM3 | −0.468 | 0.327 | −0.051 | 0.552 | −0.164 | −0.113 | |||
| Cue to Action | 0.465 | 1.463 | 8.127 | ||||||
| CA1 | 0.045 | −0.052 | 0.087 | −0.019 | 0.238 | 0.533 | |||
| CA2 | 0.171 | −0.117 | 0.084 | −0.102 | 0.297 | 0.356 | |||
| CA3 | 0.222 | −0.174 | 0.034 | −0.145 | 0.065 | 0.463 | |||
| Perceived Susceptibility | 0.562 | 1.22 | 6.78 | ||||||
| PSU1 | 0.058 | −0.041 | 0.561 | −0.014 | 0.057 | 0.007 | |||
| PSU2 | −0.029 | 0.058 | 0.514 | −0.062 | 0.063 | 0.096 | |||
| PSU3 | 0.094 | 0.005 | 0.567 | −0.012 | −0.039 | 0.019 | |||
| Perceived Severity | 0.733 | 0.986 | 5.48 | ||||||
| PSE1 | −0.190 | 0.627 | 0.010 | 0.175 | −0.162 | −0.023 | |||
| PSE2 | −0.154 | 0.659 | −0.001 | 0.097 | −0.097 | −0.277 | |||
| PSE3 | −0.132 | 0.701 | 0.058 | 0.054 | 0.091 | −0.028 | |||
| Perceived Barriers | 0.397 | 0.818 | 4.547 | ||||||
| PBA1 | 0.070 | 0.013 | 0.034 | −0.077 | 0.550 | 0.049 | |||
| PBA2 | 0.157 | −0.409 | 0.096 | −0.269 | 0.433 | 0.240 | |||
| PBA3 | 0.011 | −0.077 | 0.011 | −0.003 | 0.537 | 0.159 | |||
| Description | χ2 | df | χ2/df | CFI | TLI | RMSEA | SRMR | Δχ2 | Δdf | p-Value |
|---|---|---|---|---|---|---|---|---|---|---|
| CFA: Entire sample | ||||||||||
| Model 1 (All observed variables) | 381.445 | 120 | 3.18 | 0.914 | 0.891 | 0.052 | 0.044 | |||
| Model 2 (Remove PSU3) | 361.268 | 104 | 3.47 | 0.912 | 0.885 | 0.056 | 0.045 | |||
| Model 3 (Remove PSE3) | 299.073 | 89 | 3.36 | 0.919 | 0.891 | 0.054 | 0.042 | |||
| Model 4 (Remove PBA3) | 201.378 | 75 | 2.69 | 0.949 | 0.928 | 0.046 | 0.034 | |||
| CFA: Measurement invariance | ||||||||||
| Model A: Factor-loading and intercept-equal groups | 304.496 | 174 | 1.75 | 0.947 | 0.937 | 0.043 | 0.049 | |||
| Model B: Simultaneous | 263.503 | 150 | 1.76 | 0.954 | 0.936 | 0.044 | 0.038 | 40.993 | 24 | 0.017 |
| SEM: HBM individual group | ||||||||||
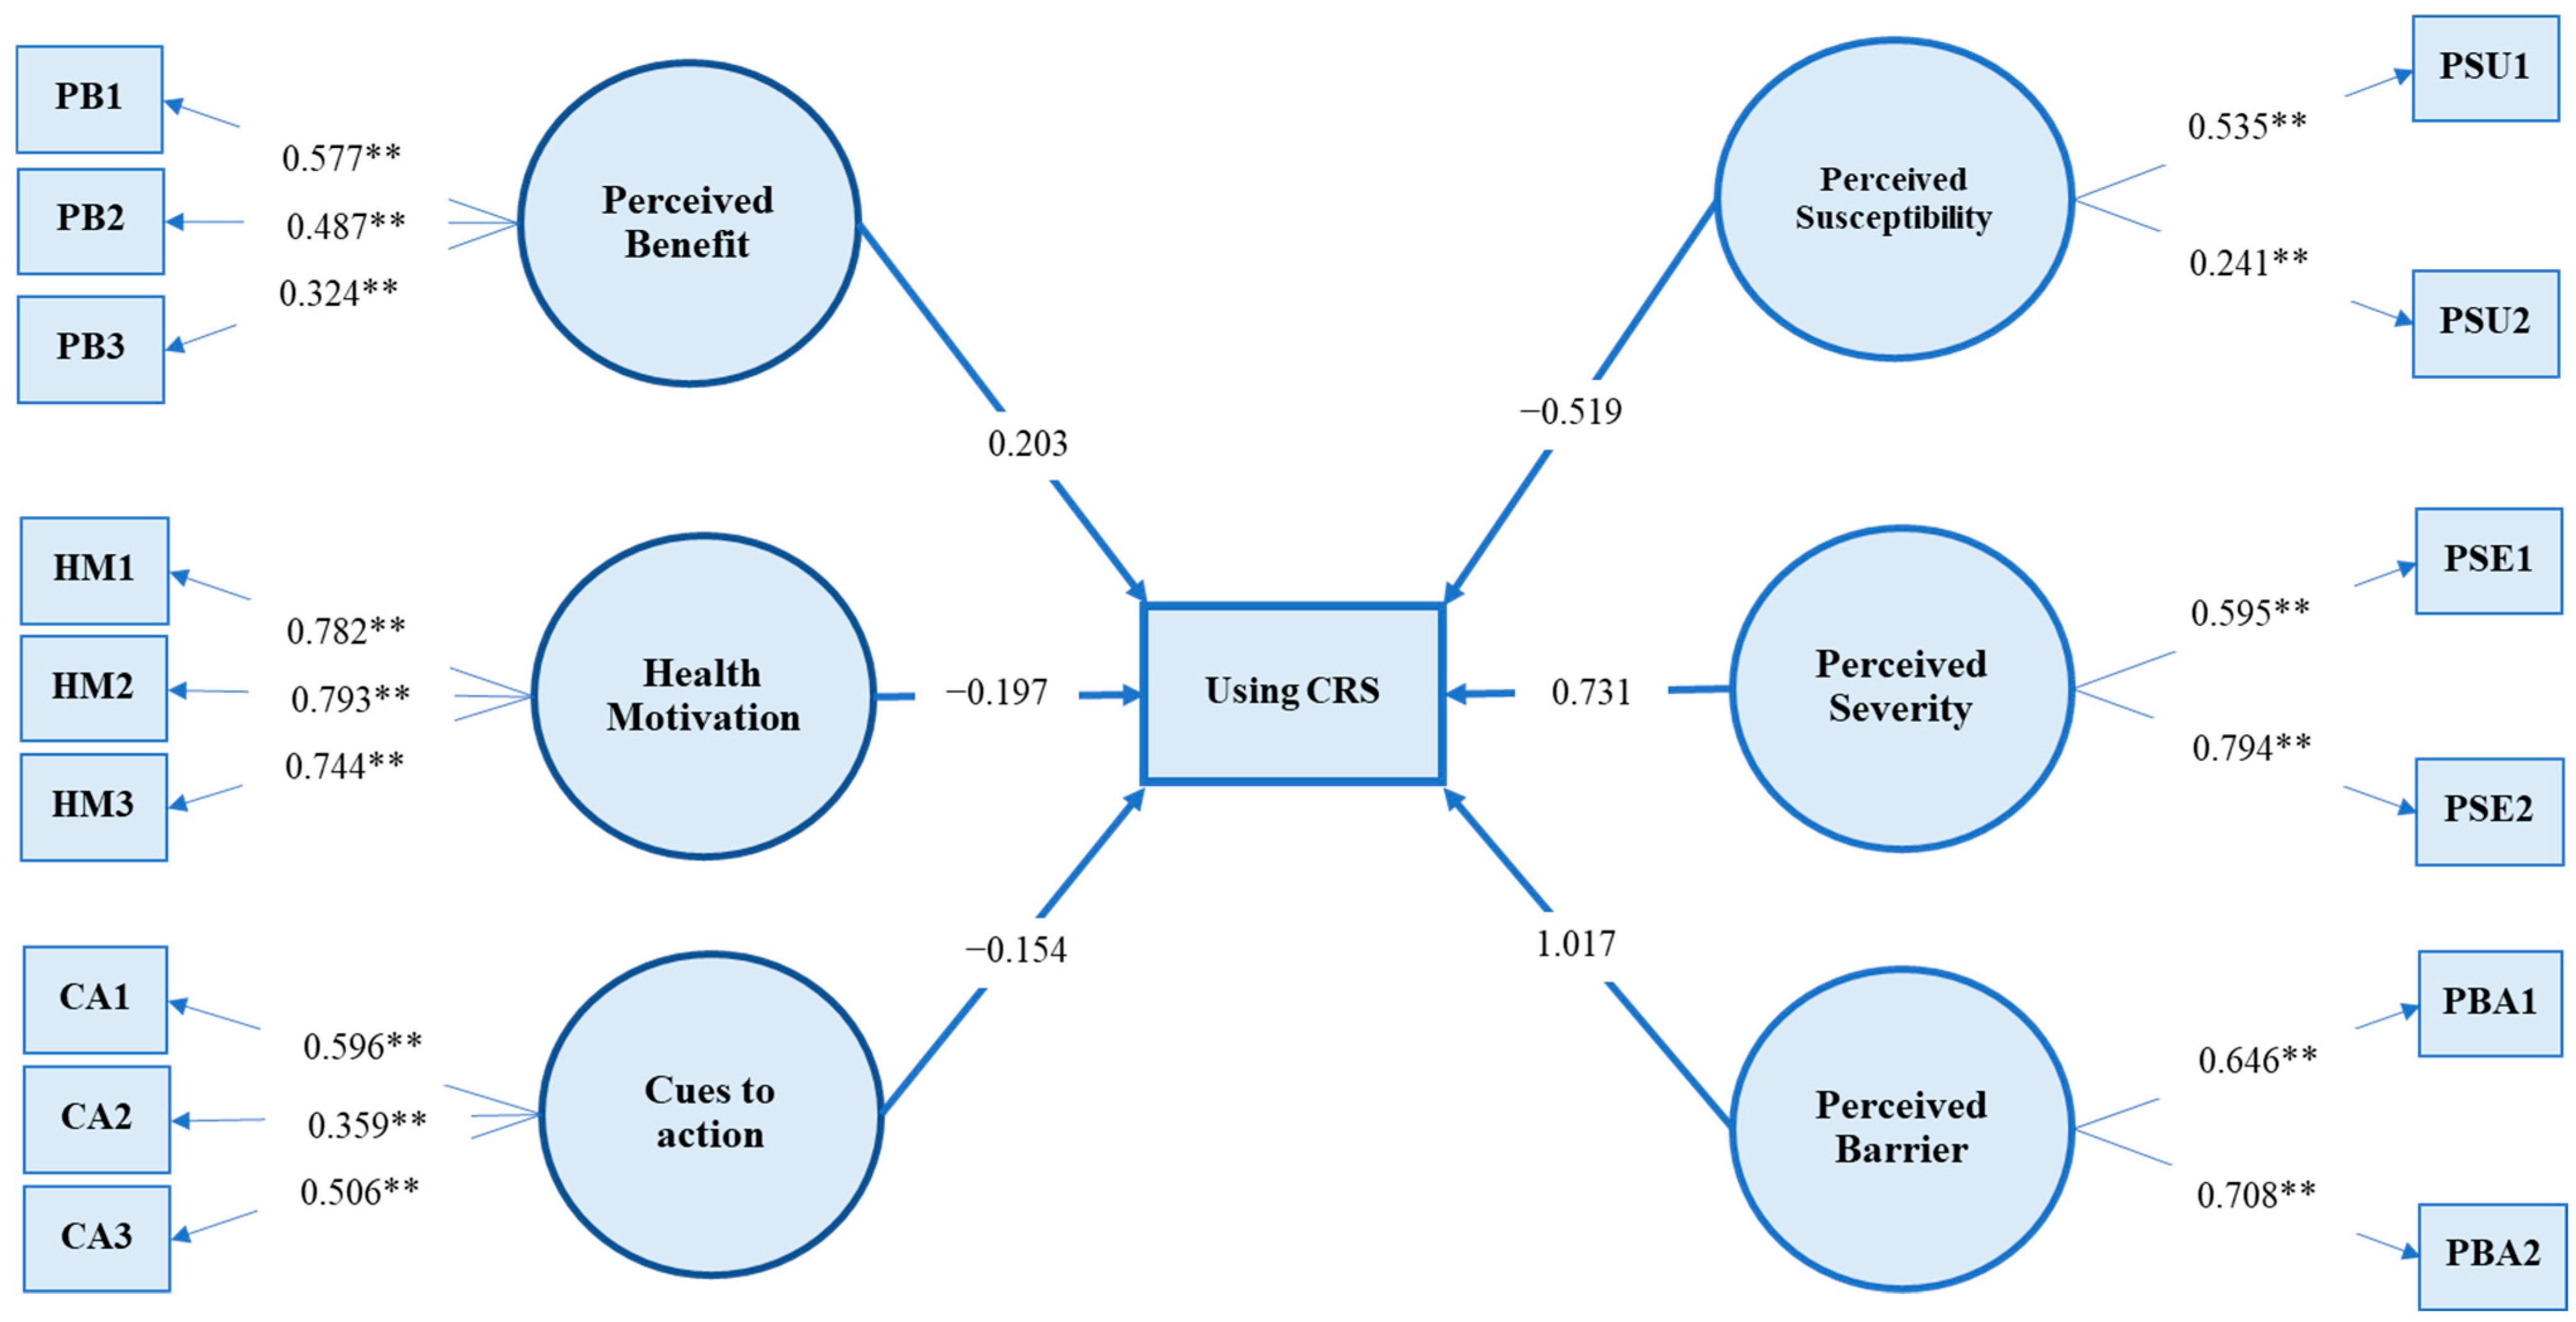
| CRS non-user model | 184.555 | 84 | 2.20 | 0.931 | 0.901 | 0.053 | 0.041 | |||
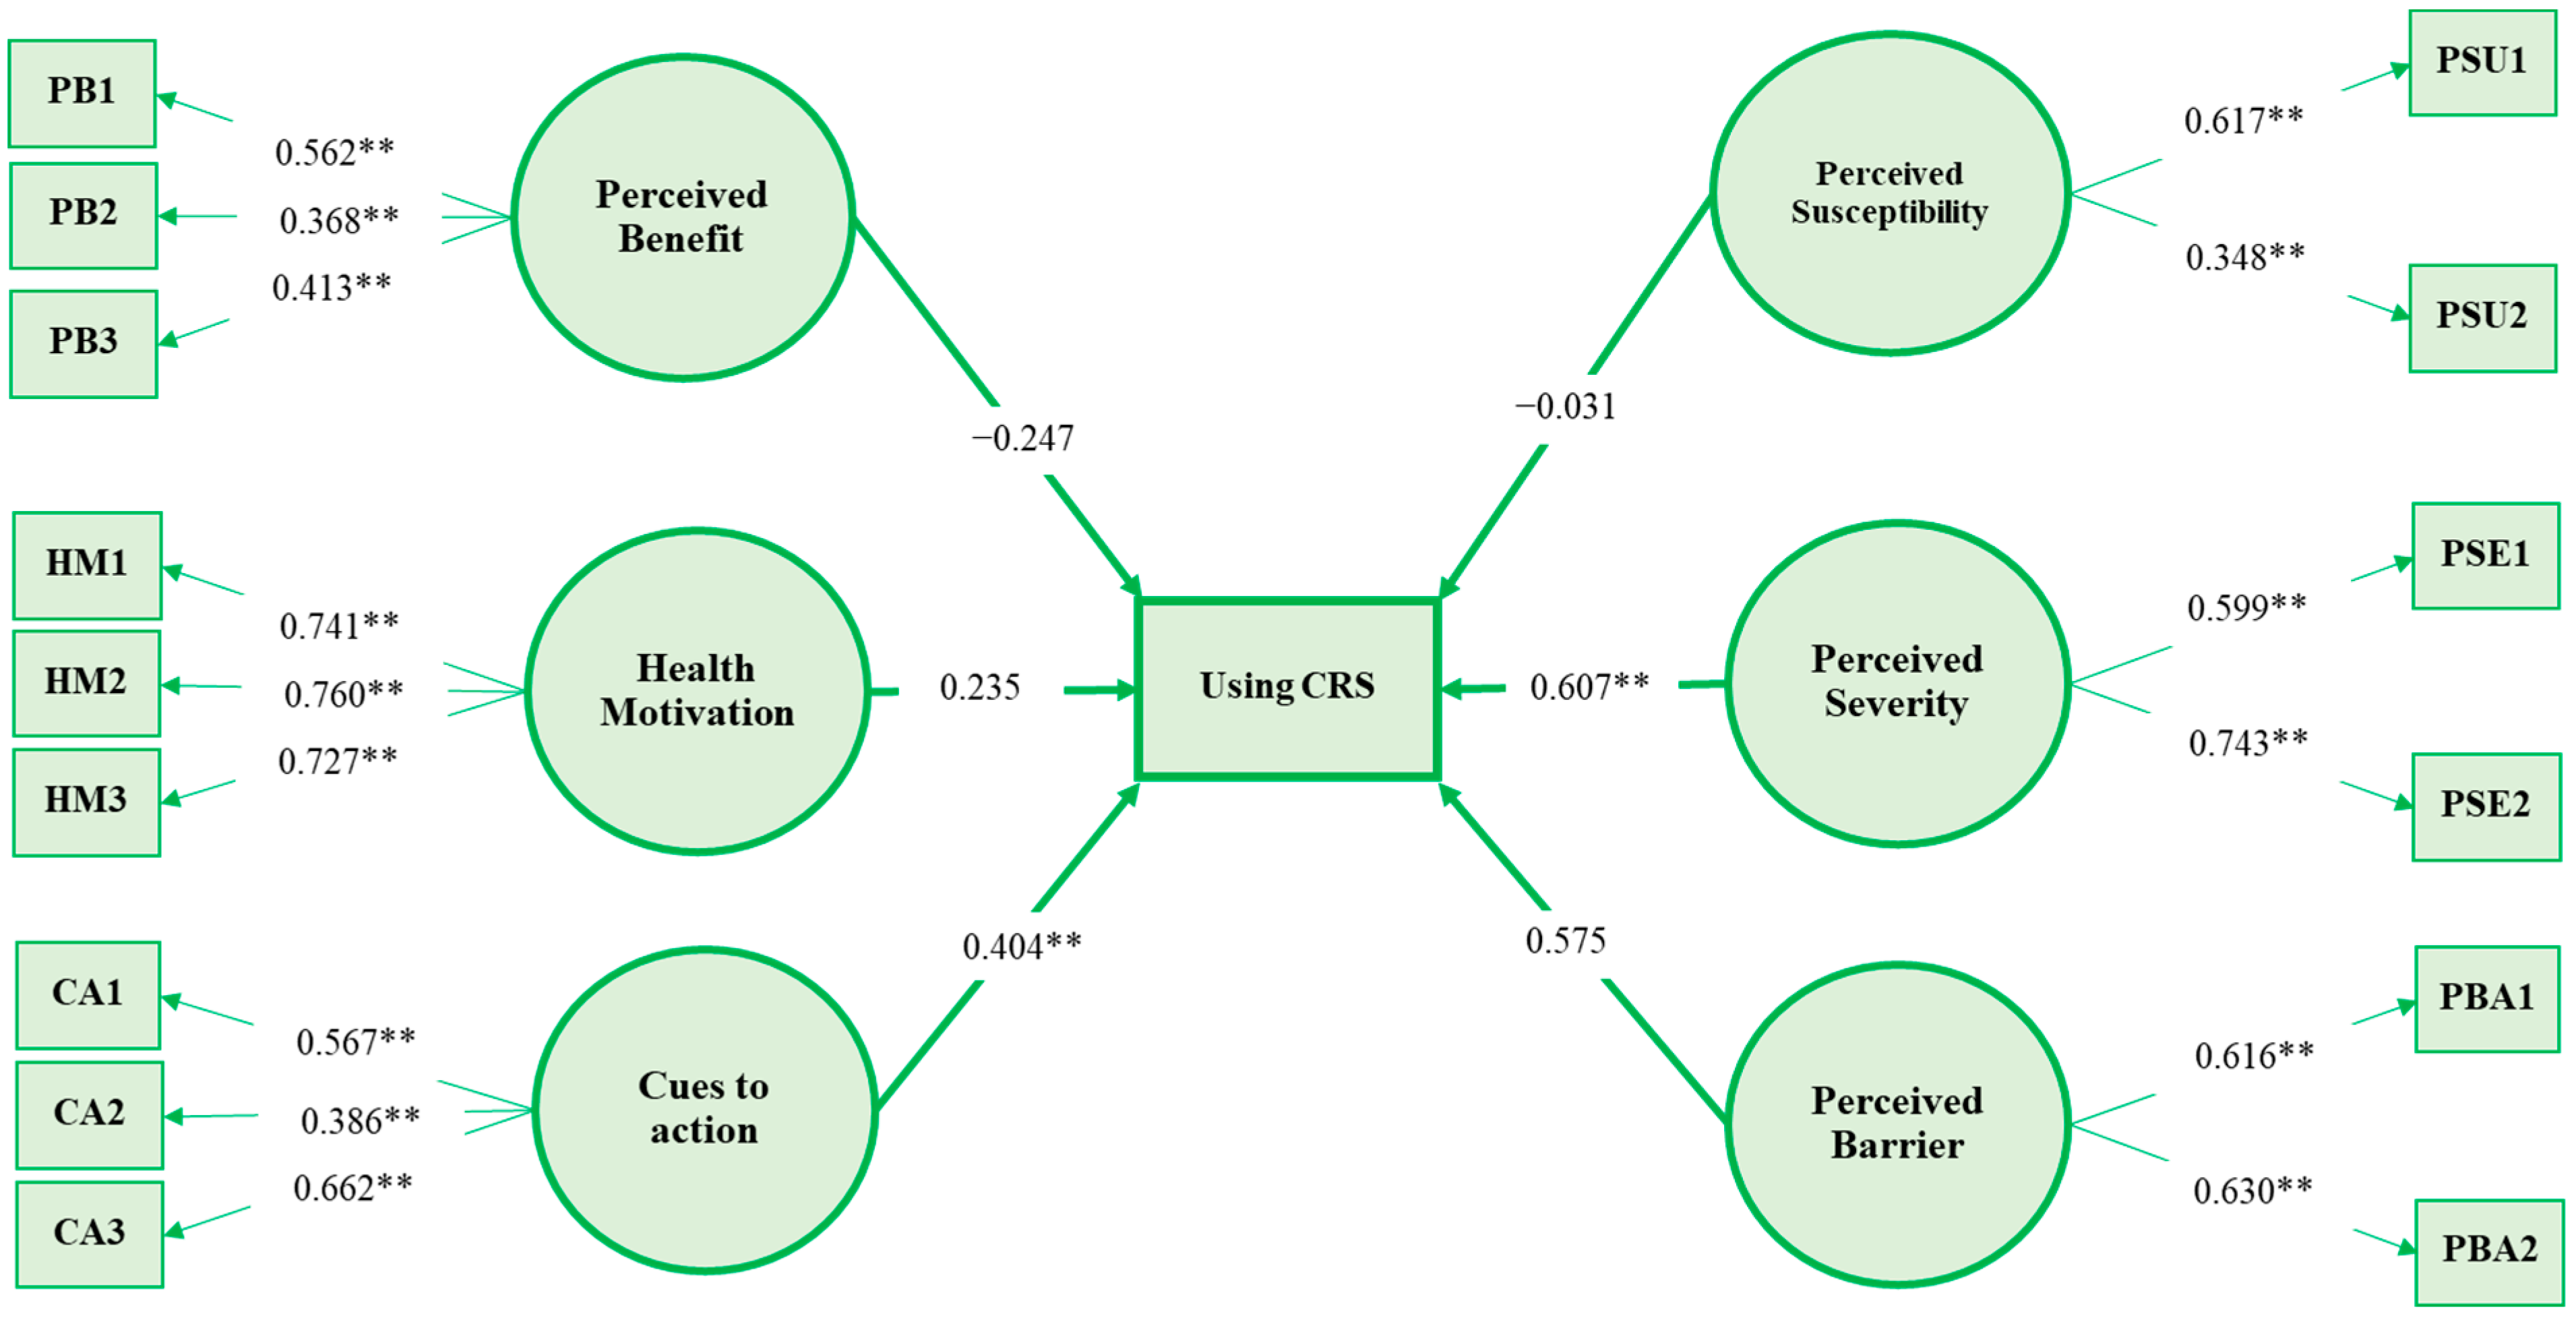
| CRS user model | 166.784 | 84 | 2.99 | 0.933 | 0.904 | 0.052 | 0.042 |
| Variable | CRS Non-User | |||||
|---|---|---|---|---|---|---|
| Estimate | S.D. | t-Stat | p-Value | Lower 5% | Upper 5% | |
| Measurement Model | ||||||
| Perceived Benefits | ||||||
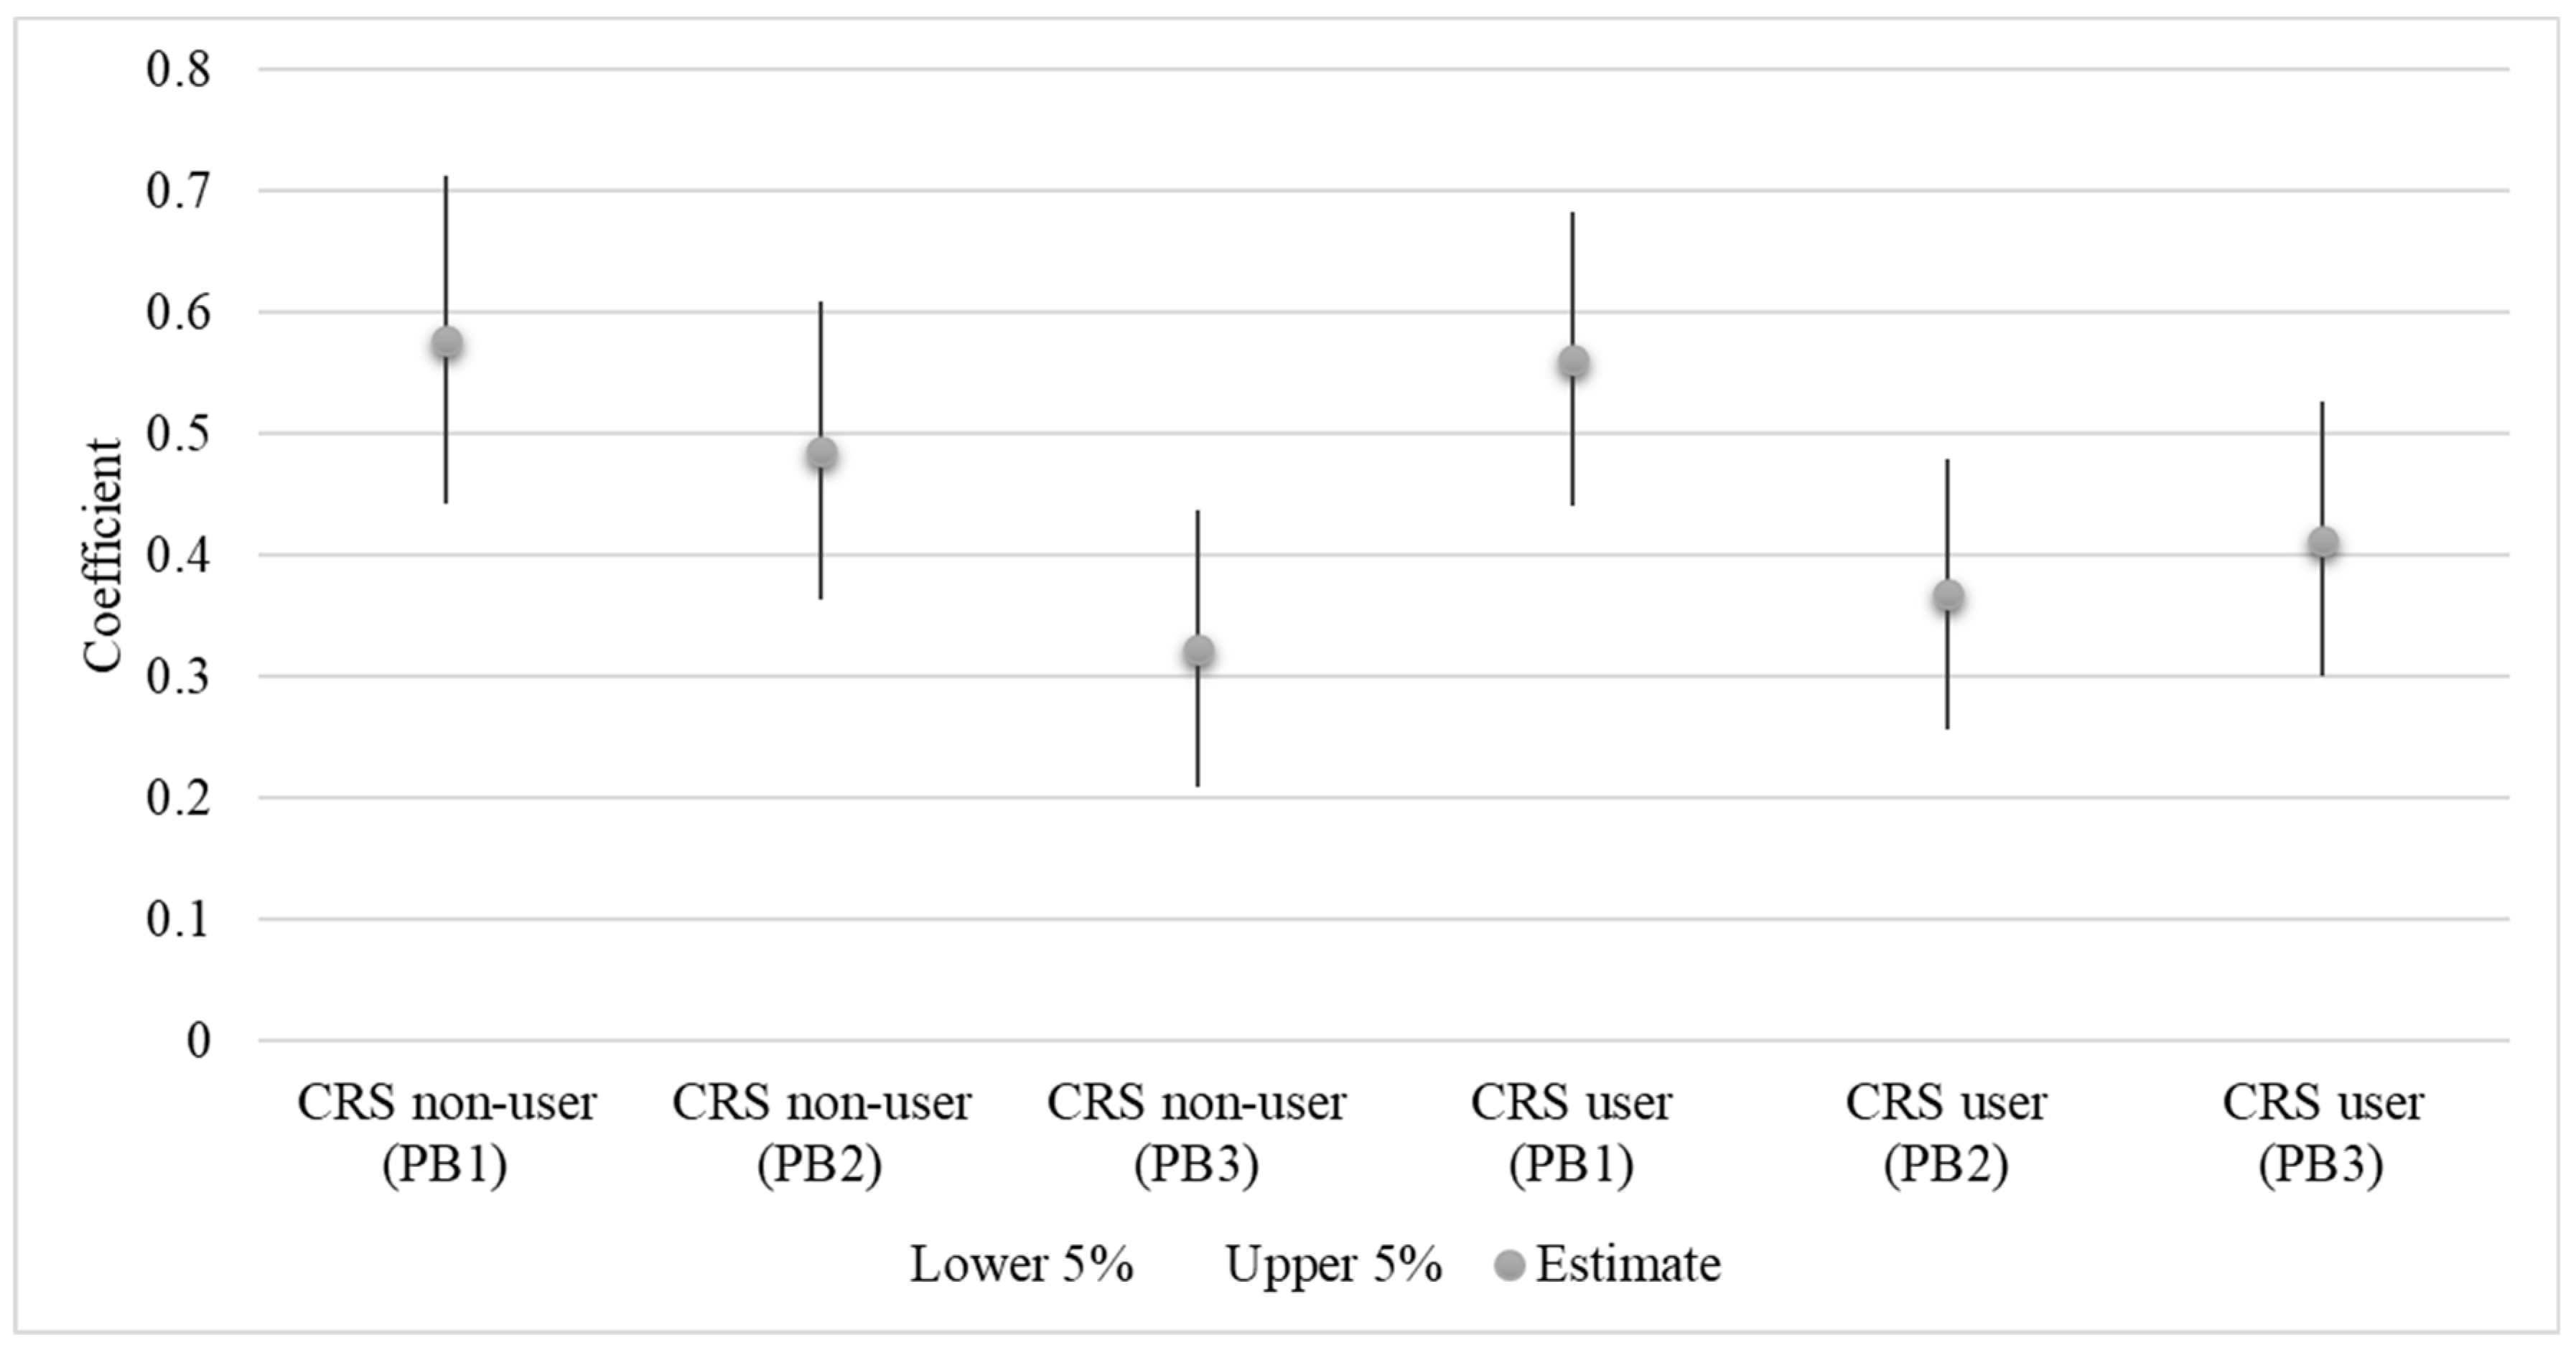
| PB1 | 0.577 ** | 0.082 | 7.011 | <0.000 | 0.442 | 0.712 |
| PB2 | 0.487 ** | 0.074 | 6.541 | <0.000 | 0.364 | 0.609 |
| PB3 | 0.324 ** | 0.069 | 4.689 | <0.000 | 0.210 | 0.437 |
| Health Motivation | ||||||
| HM1 | 0.782 ** | 0.024 | 32.317 | <0.000 | 0.743 | 0.822 |
| HM2 | 0.793 ** | 0.023 | 33.880 | <0.000 | 0.755 | 0.832 |
| HM3 | 0.744 ** | 0.026 | 28.277 | <0.000 | 0.700 | 0.787 |
| Cue to Action | ||||||
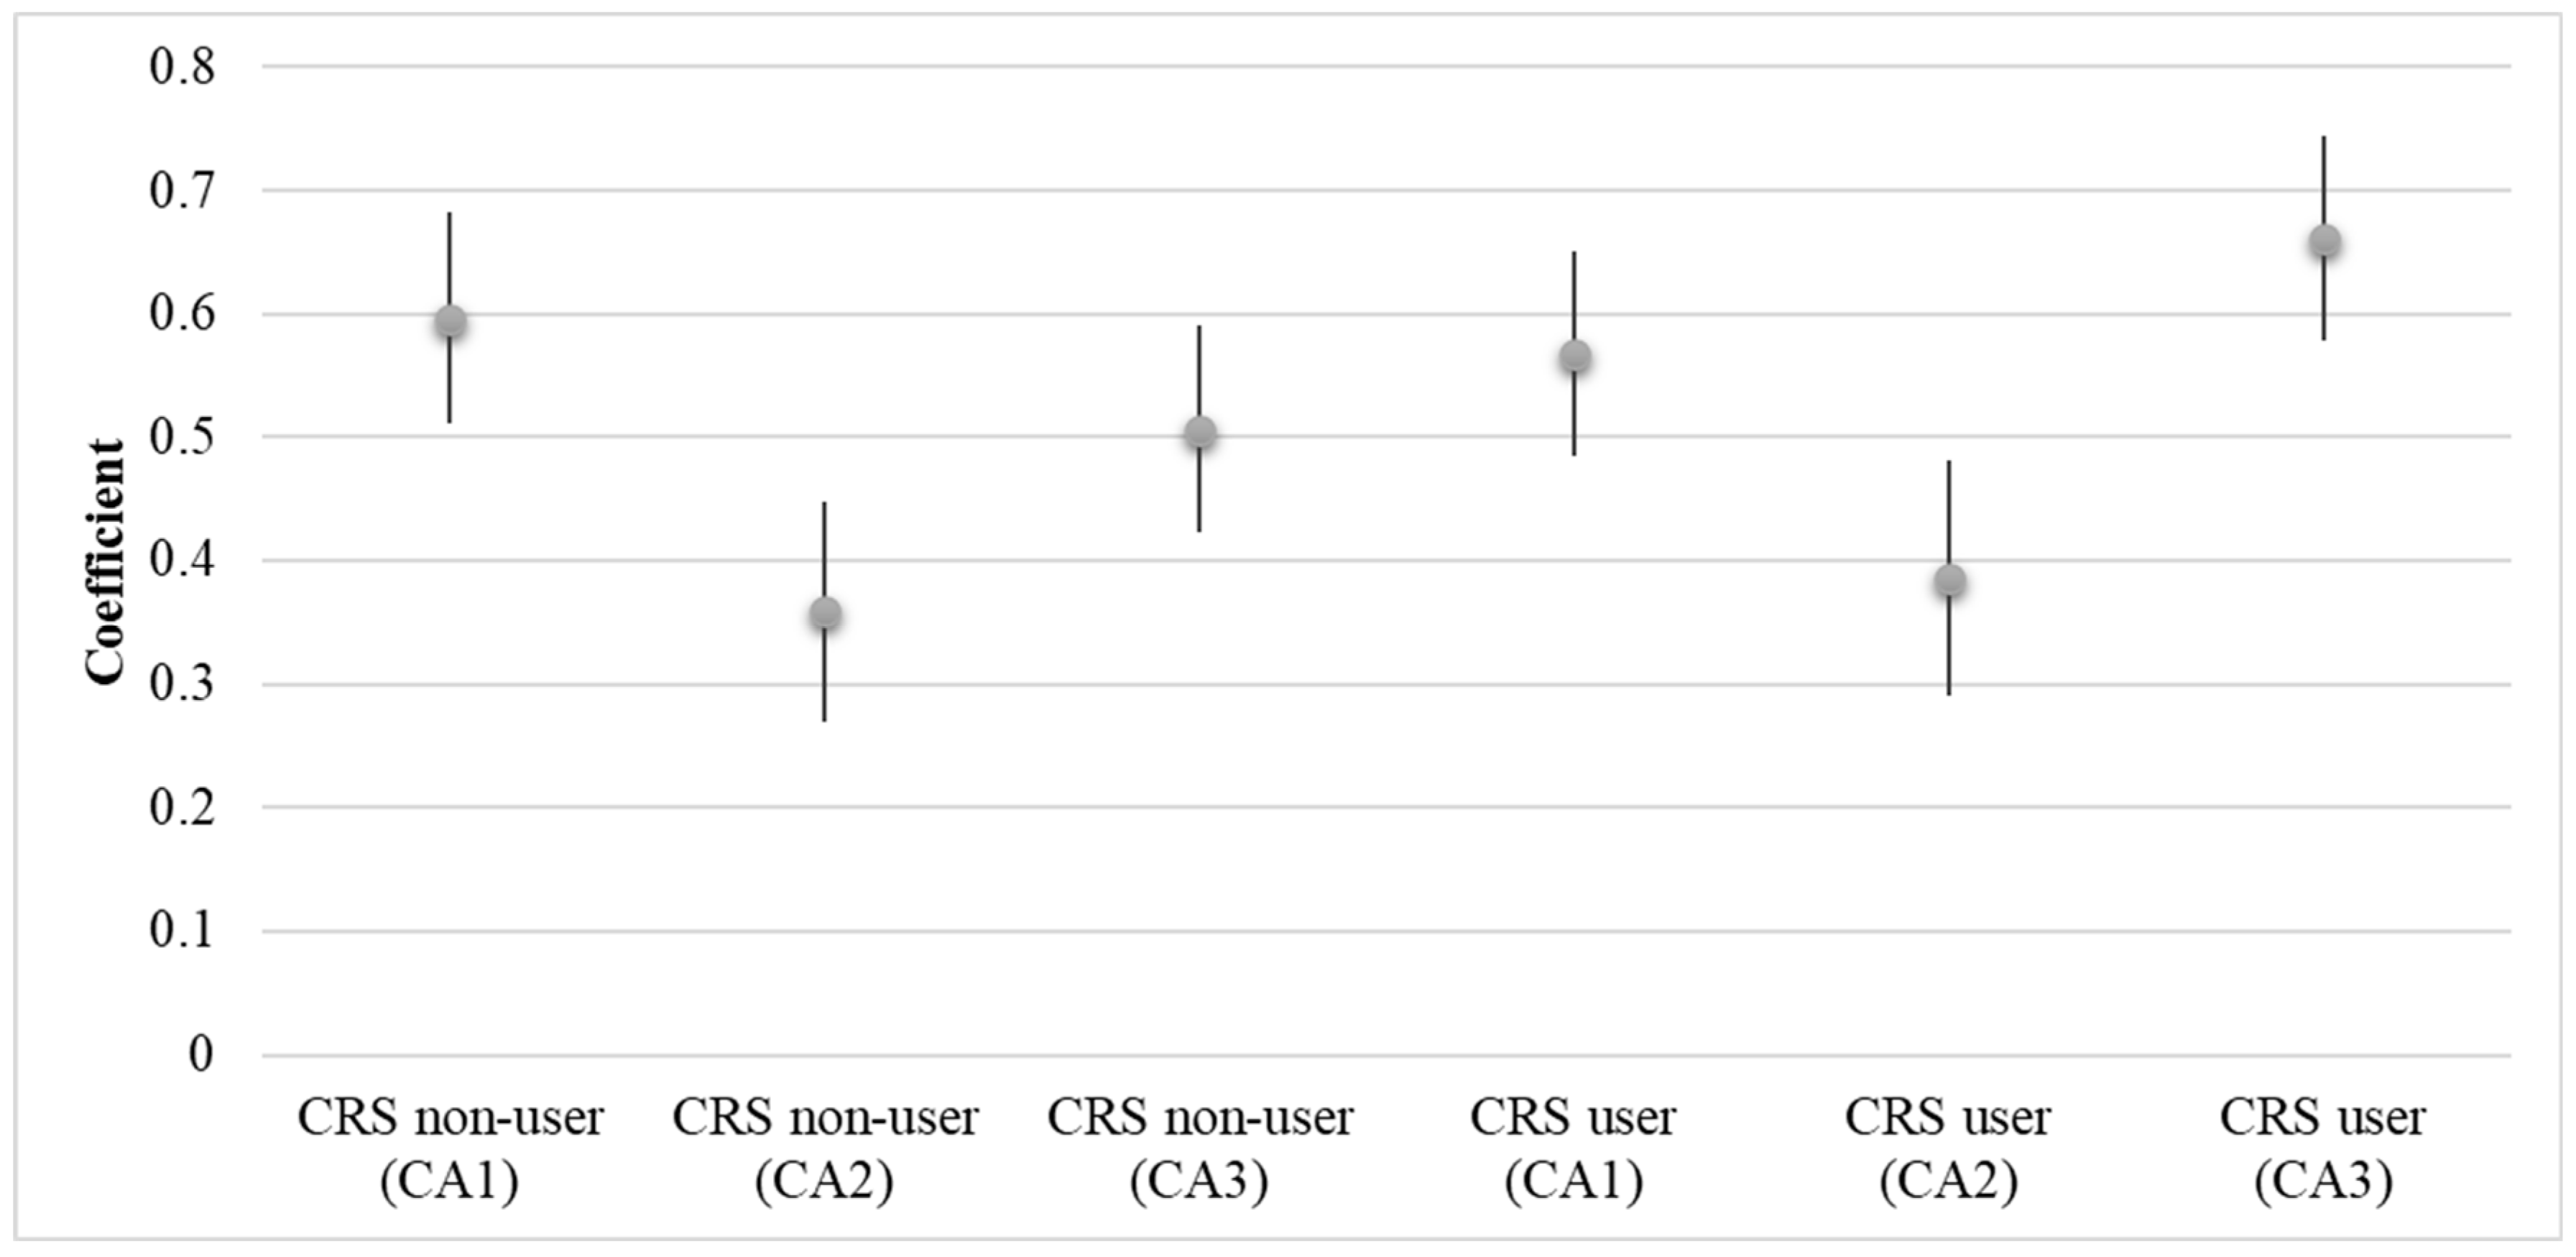
| CA1 | 0.596 ** | 0.052 | 11.476 | <0.000 | 0.511 | 0.682 |
| CA2 | 0.359 ** | 0.054 | 6.640 | <0.000 | 0.270 | 0.448 |
| CA3 | 0.506 ** | 0.051 | 9.909 | <0.000 | 0.422 | 0.590 |
| Perceived Susceptibility | ||||||
| PSU1 | 0.535 ** | 0.107 | 5.014 | <0.000 | 0.360 | 0.711 |
| PSU2 | 0.241 ** | 0.064 | 3.763 | <0.000 | 0.135 | 0.346 |
| Perceived Severity | ||||||
| PSE1 | 0.595 ** | 0.042 | 14.190 | <0.000 | 0.526 | 0.664 |
| PSE2 | 0.794 ** | 0.042 | 18.956 | <0.000 | 0.725 | 0.863 |
| Perceived Barriers | ||||||
| PBA1 | 0.646 ** | 0.038 | 17.124 | <0.000 | 0.584 | 0.708 |
| PBA2 | 0.708 ** | 0.037 | 19.289 | <0.000 | 0.648 | 0.768 |
| Structural Model | ||||||
| PB 🡺 Using CRS | 0.203 | 0.373 | 0.544 | 0.587 | −0.411 | 0.816 |
| HM 🡺 Using CRS | −0.197 | 0.676 | −0.291 | 0.771 | −1.308 | 0.915 |
| CA 🡺 Using CRS | −0.154 | 0.227 | −0.677 | 0.498 | −0.527 | 0.220 |
| PSU 🡺 Using CRS | −0.519 | 2.148 | −0.242 | 0.809 | −4.053 | 3.014 |
| PSE 🡺 Using CRS | 0.731 | 1.521 | 0.481 | 0.631 | −1.770 | 3.232 |
| PBA 🡺 Using CRS | 1.017 | 3.396 | 0.299 | 0.765 | −4.570 | 6.603 |
| Variable | CRS User | |||||
|---|---|---|---|---|---|---|
| Estimate | S.D. | t-Stat | p-Value | Lower 5% | Upper 5% | |
| Measurement Model | ||||||
| Perceived Benefits | ||||||
| PB1 | 0.562 ** | 0.073 | 7.665 | <0.000 | 0.441 | 0.683 |
| PB2 | 0.368 ** | 0.068 | 5.395 | <0.000 | 0.256 | 0.480 |
| PB3 | 0.413 ** | 0.068 | 6.042 | <0.000 | 0.301 | 0.526 |
| Health Motivation | ||||||
| HM1 | 0.741 ** | 0.031 | 24.029 | <0.000 | 0.690 | 0.792 |
| HM2 | 0.760 ** | 0.030 | 25.719 | <0.000 | 0.711 | 0.808 |
| HM3 | 0.727 ** | 0.031 | 23.353 | <0.000 | 0.676 | 0.778 |
| Cue to Action | ||||||
| CA1 | 0.567 ** | 0.050 | 11.264 | <0.000 | 0.484 | 0.650 |
| CA2 | 0.386 ** | 0.058 | 6.696 | <0.000 | 0.291 | 0.481 |
| CA3 | 0.662 ** | 0.050 | 13.209 | <0.000 | 0.579 | 0.744 |
| Perceived Susceptibility | ||||||
| PSU1 | 0.617 ** | 0.081 | 7.580 | <0.000 | 0.483 | 0.751 |
| PSU2 | 0.348 ** | 0.063 | 5.562 | <0.000 | 0.245 | 0.451 |
| Perceived Severity | ||||||
| PSE1 | 0.599 ** | 0.045 | 13.204 | <0.000 | 0.525 | 0.674 |
| PSE2 | 0.743 ** | 0.044 | 16.747 | <0.000 | 0.670 | 0.816 |
| Perceived Barriers | ||||||
| PBA1 | 0.616 ** | 0.044 | 14.136 | <0.000 | 0.545 | 0.688 |
| PBA2 | 0.630 ** | 0.043 | 14.526 | <0.000 | 0.558 | 0.701 |
| Structural Model | ||||||
| PB 🡺 Using CRS | −0.247 | 0.226 | −1.096 | 0.273 | −0.619 | 0.124 |
| HM 🡺 Using CRS | 0.253 | 0.416 | 0.608 | 0.543 | −0.431 | 0.937 |
| CA 🡺 Using CRS | 0.404 ** | 0.184 | 2.196 | 0.028 | 0.101 | 0.707 |
| PSU 🡺 Using CRS | −0.031 | 0.230 | −0.137 | 0.891 | −0.410 | 0.347 |
| PSE 🡺 Using CRS | 0.607 ** | 0.249 | 2.438 | 0.015 | 0.198 | 1.017 |
| PBA 🡺 Using CRS | 0.575 | 0.517 | 1.113 | 0.266 | −0.275 | 1.425 |
Disclaimer/Publisher’s Note: The statements, opinions and data contained in all publications are solely those of the individual author(s) and contributor(s) and not of MDPI and/or the editor(s). MDPI and/or the editor(s) disclaim responsibility for any injury to people or property resulting from any ideas, methods, instructions or products referred to in the content. |
© 2023 by the authors. Licensee MDPI, Basel, Switzerland. This article is an open access article distributed under the terms and conditions of the Creative Commons Attribution (CC BY) license (https://creativecommons.org/licenses/by/4.0/).
Share and Cite
Champahom, T.; Jomnonkwao, S.; Thotongkam, W.; Jongkol, P.; Rodpon, P.; Ratanavaraha, V. Investigating Parents’ Attitudes towards the Use of Child Restraint Systems by Comparing Non-Users and User Parents. Sustainability 2023, 15, 2896. https://doi.org/10.3390/su15042896
Champahom T, Jomnonkwao S, Thotongkam W, Jongkol P, Rodpon P, Ratanavaraha V. Investigating Parents’ Attitudes towards the Use of Child Restraint Systems by Comparing Non-Users and User Parents. Sustainability. 2023; 15(4):2896. https://doi.org/10.3390/su15042896
Chicago/Turabian StyleChampahom, Thanapong, Sajjakaj Jomnonkwao, Woraanong Thotongkam, Pornsiri Jongkol, Porntip Rodpon, and Vatanavongs Ratanavaraha. 2023. "Investigating Parents’ Attitudes towards the Use of Child Restraint Systems by Comparing Non-Users and User Parents" Sustainability 15, no. 4: 2896. https://doi.org/10.3390/su15042896
APA StyleChampahom, T., Jomnonkwao, S., Thotongkam, W., Jongkol, P., Rodpon, P., & Ratanavaraha, V. (2023). Investigating Parents’ Attitudes towards the Use of Child Restraint Systems by Comparing Non-Users and User Parents. Sustainability, 15(4), 2896. https://doi.org/10.3390/su15042896