
Pinostrobin and Tectochrysin Conquer Multidrug-Resistant Cancer Cells via Inhibiting P-Glycoprotein ATPase


Abstract
1. Introduction
2. Results
2.1. Inhibitory Effects of Pinostrobin and Tectochrysin on Efflux Function and Kinetic Mechanisms
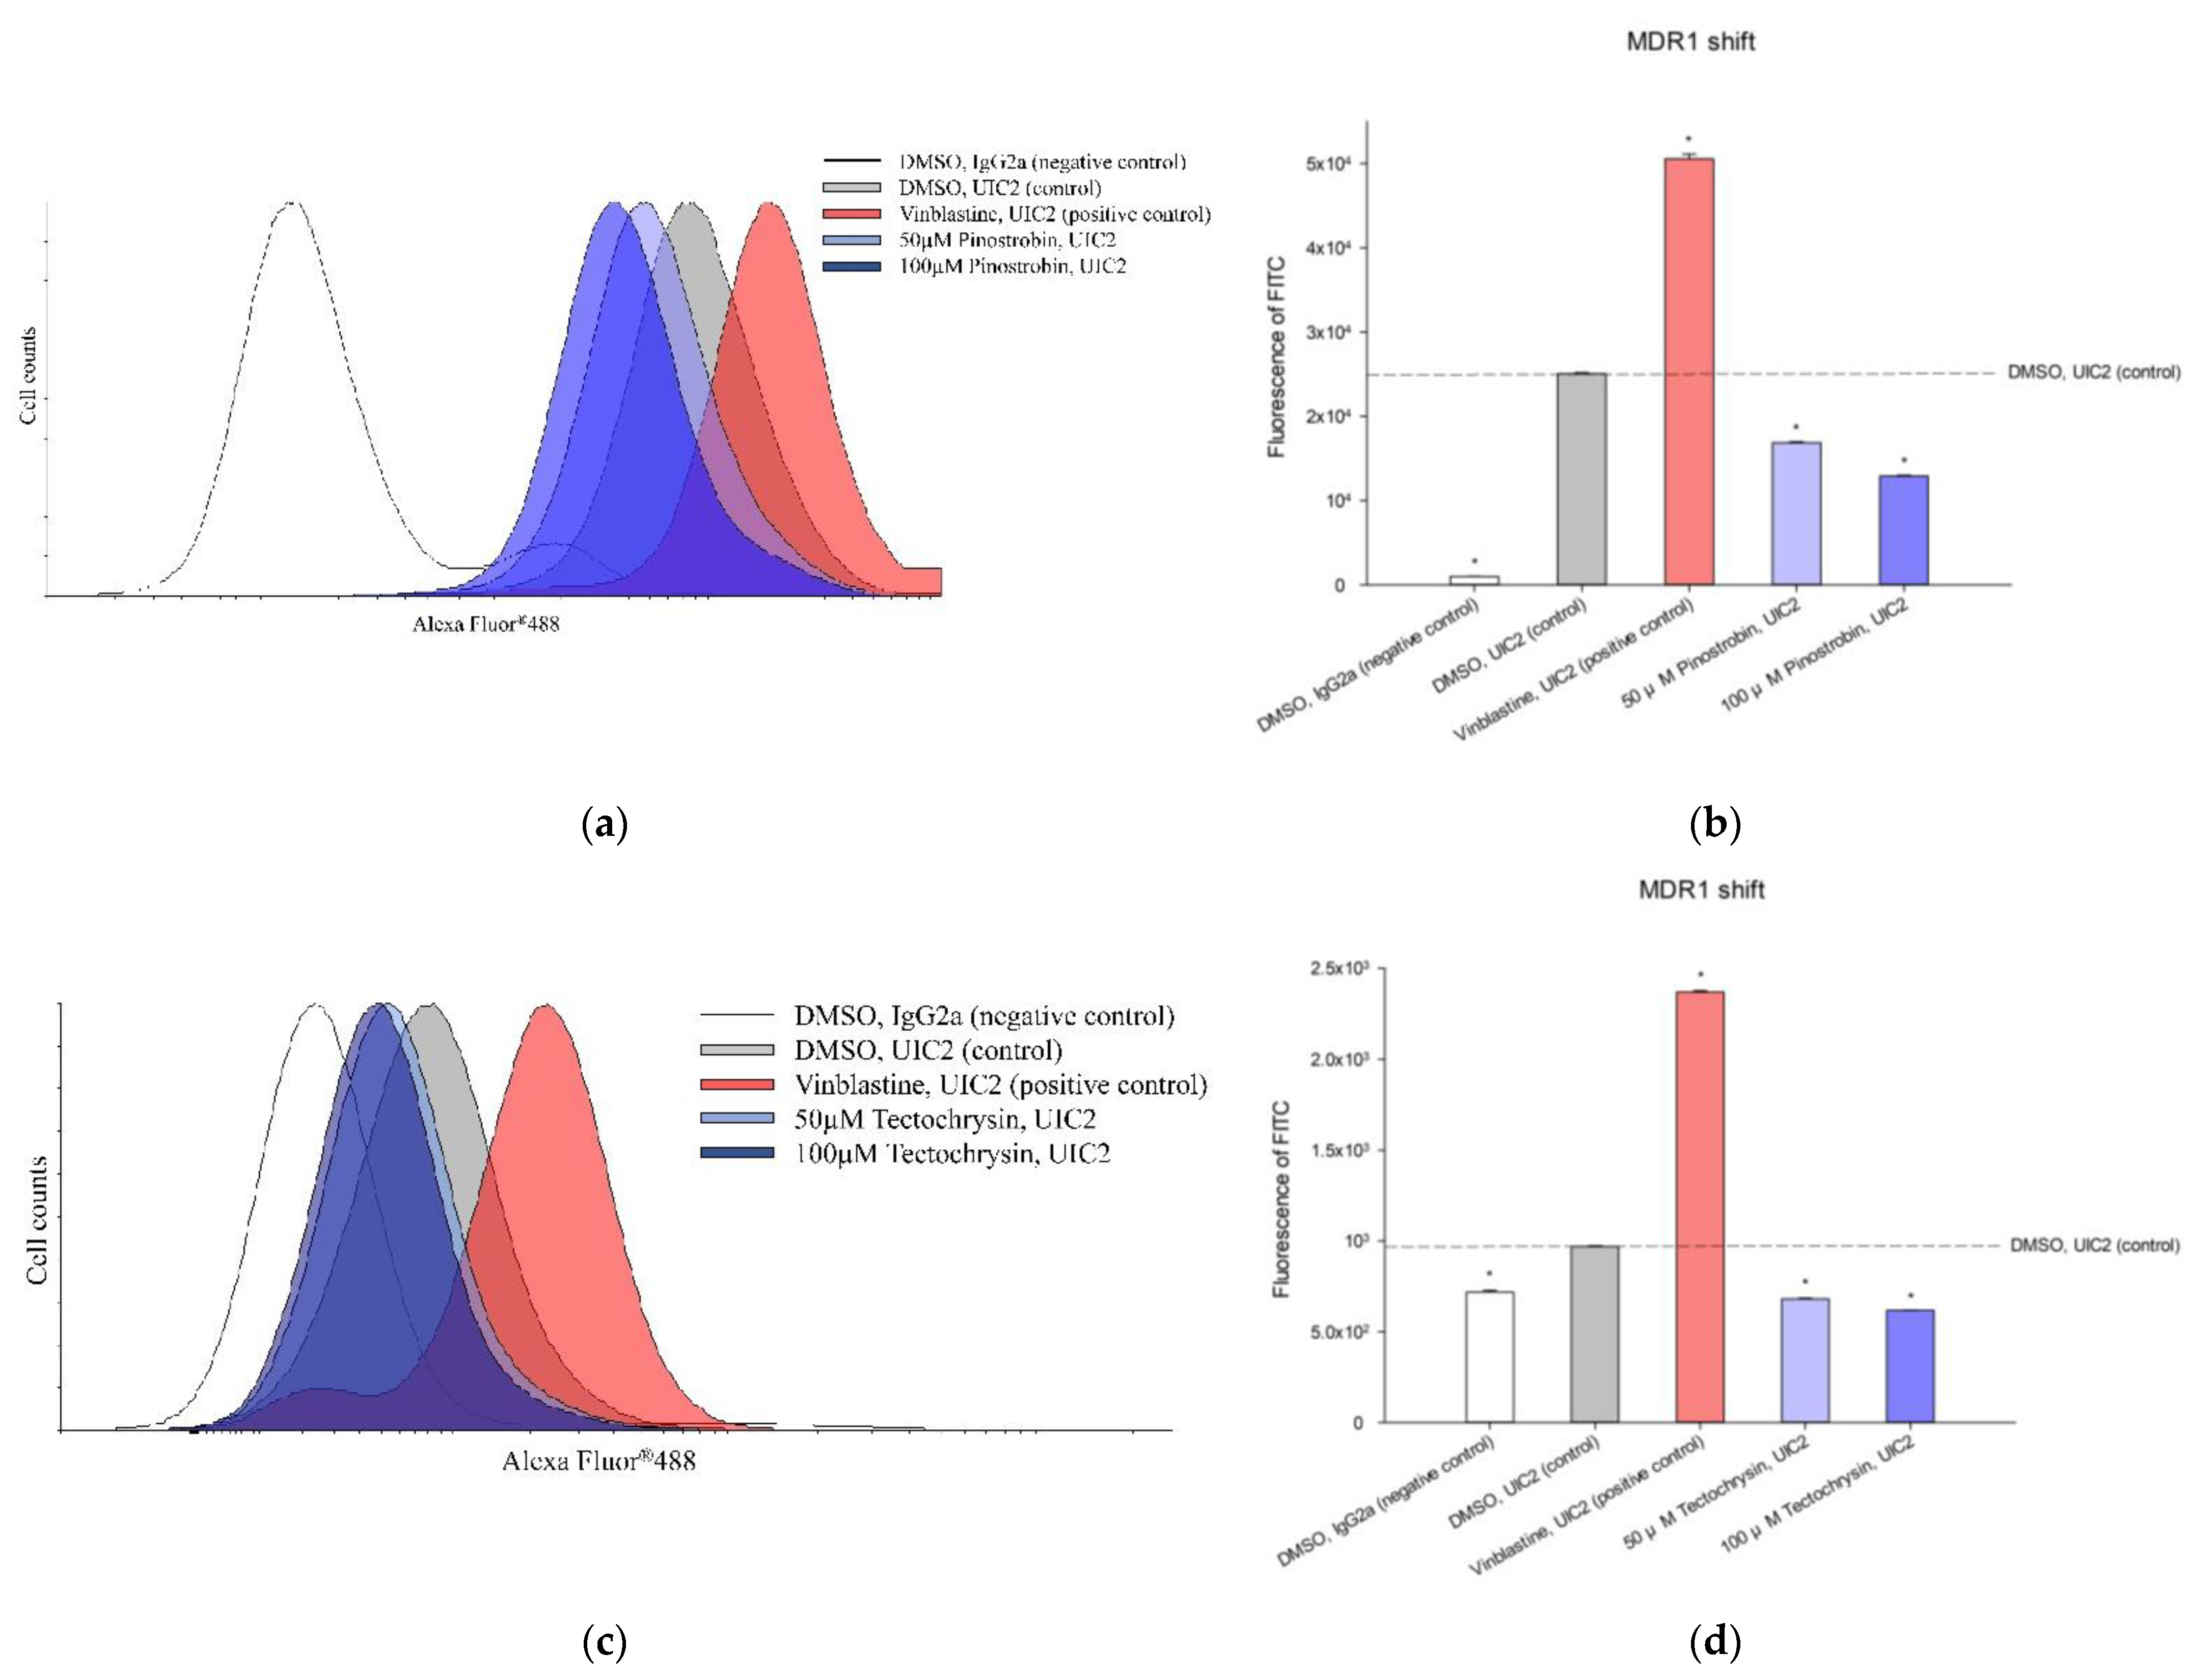
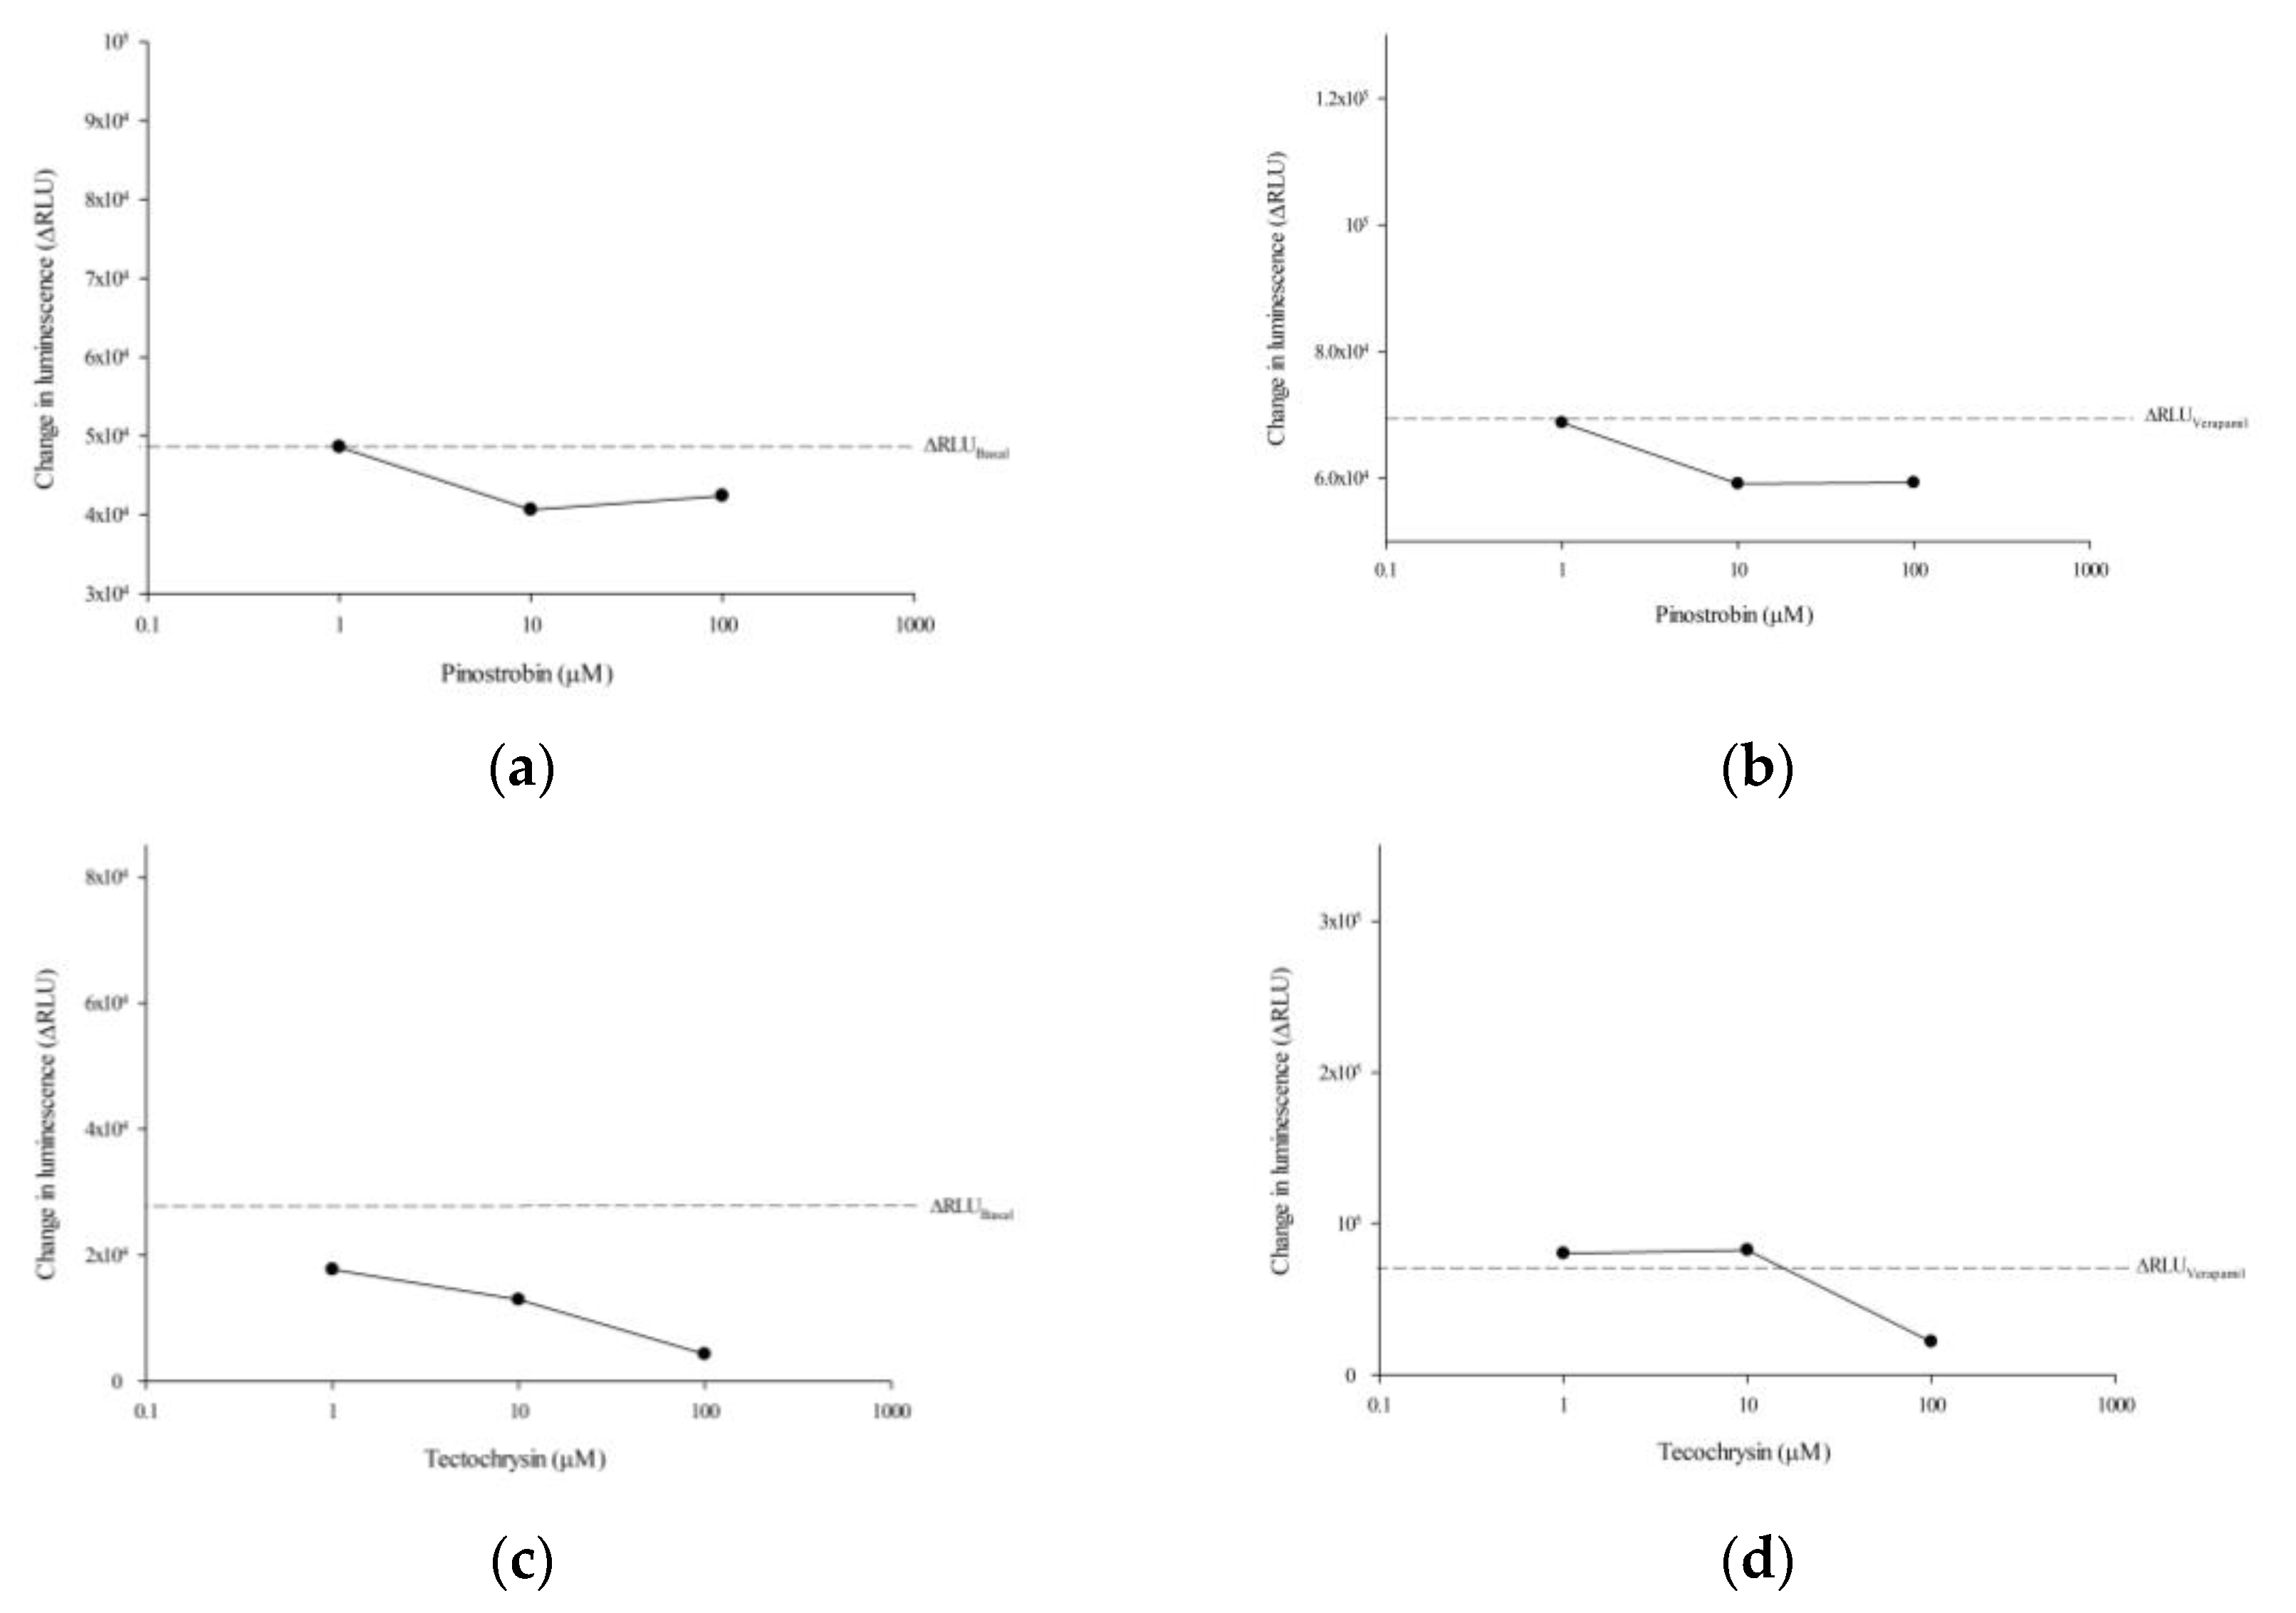
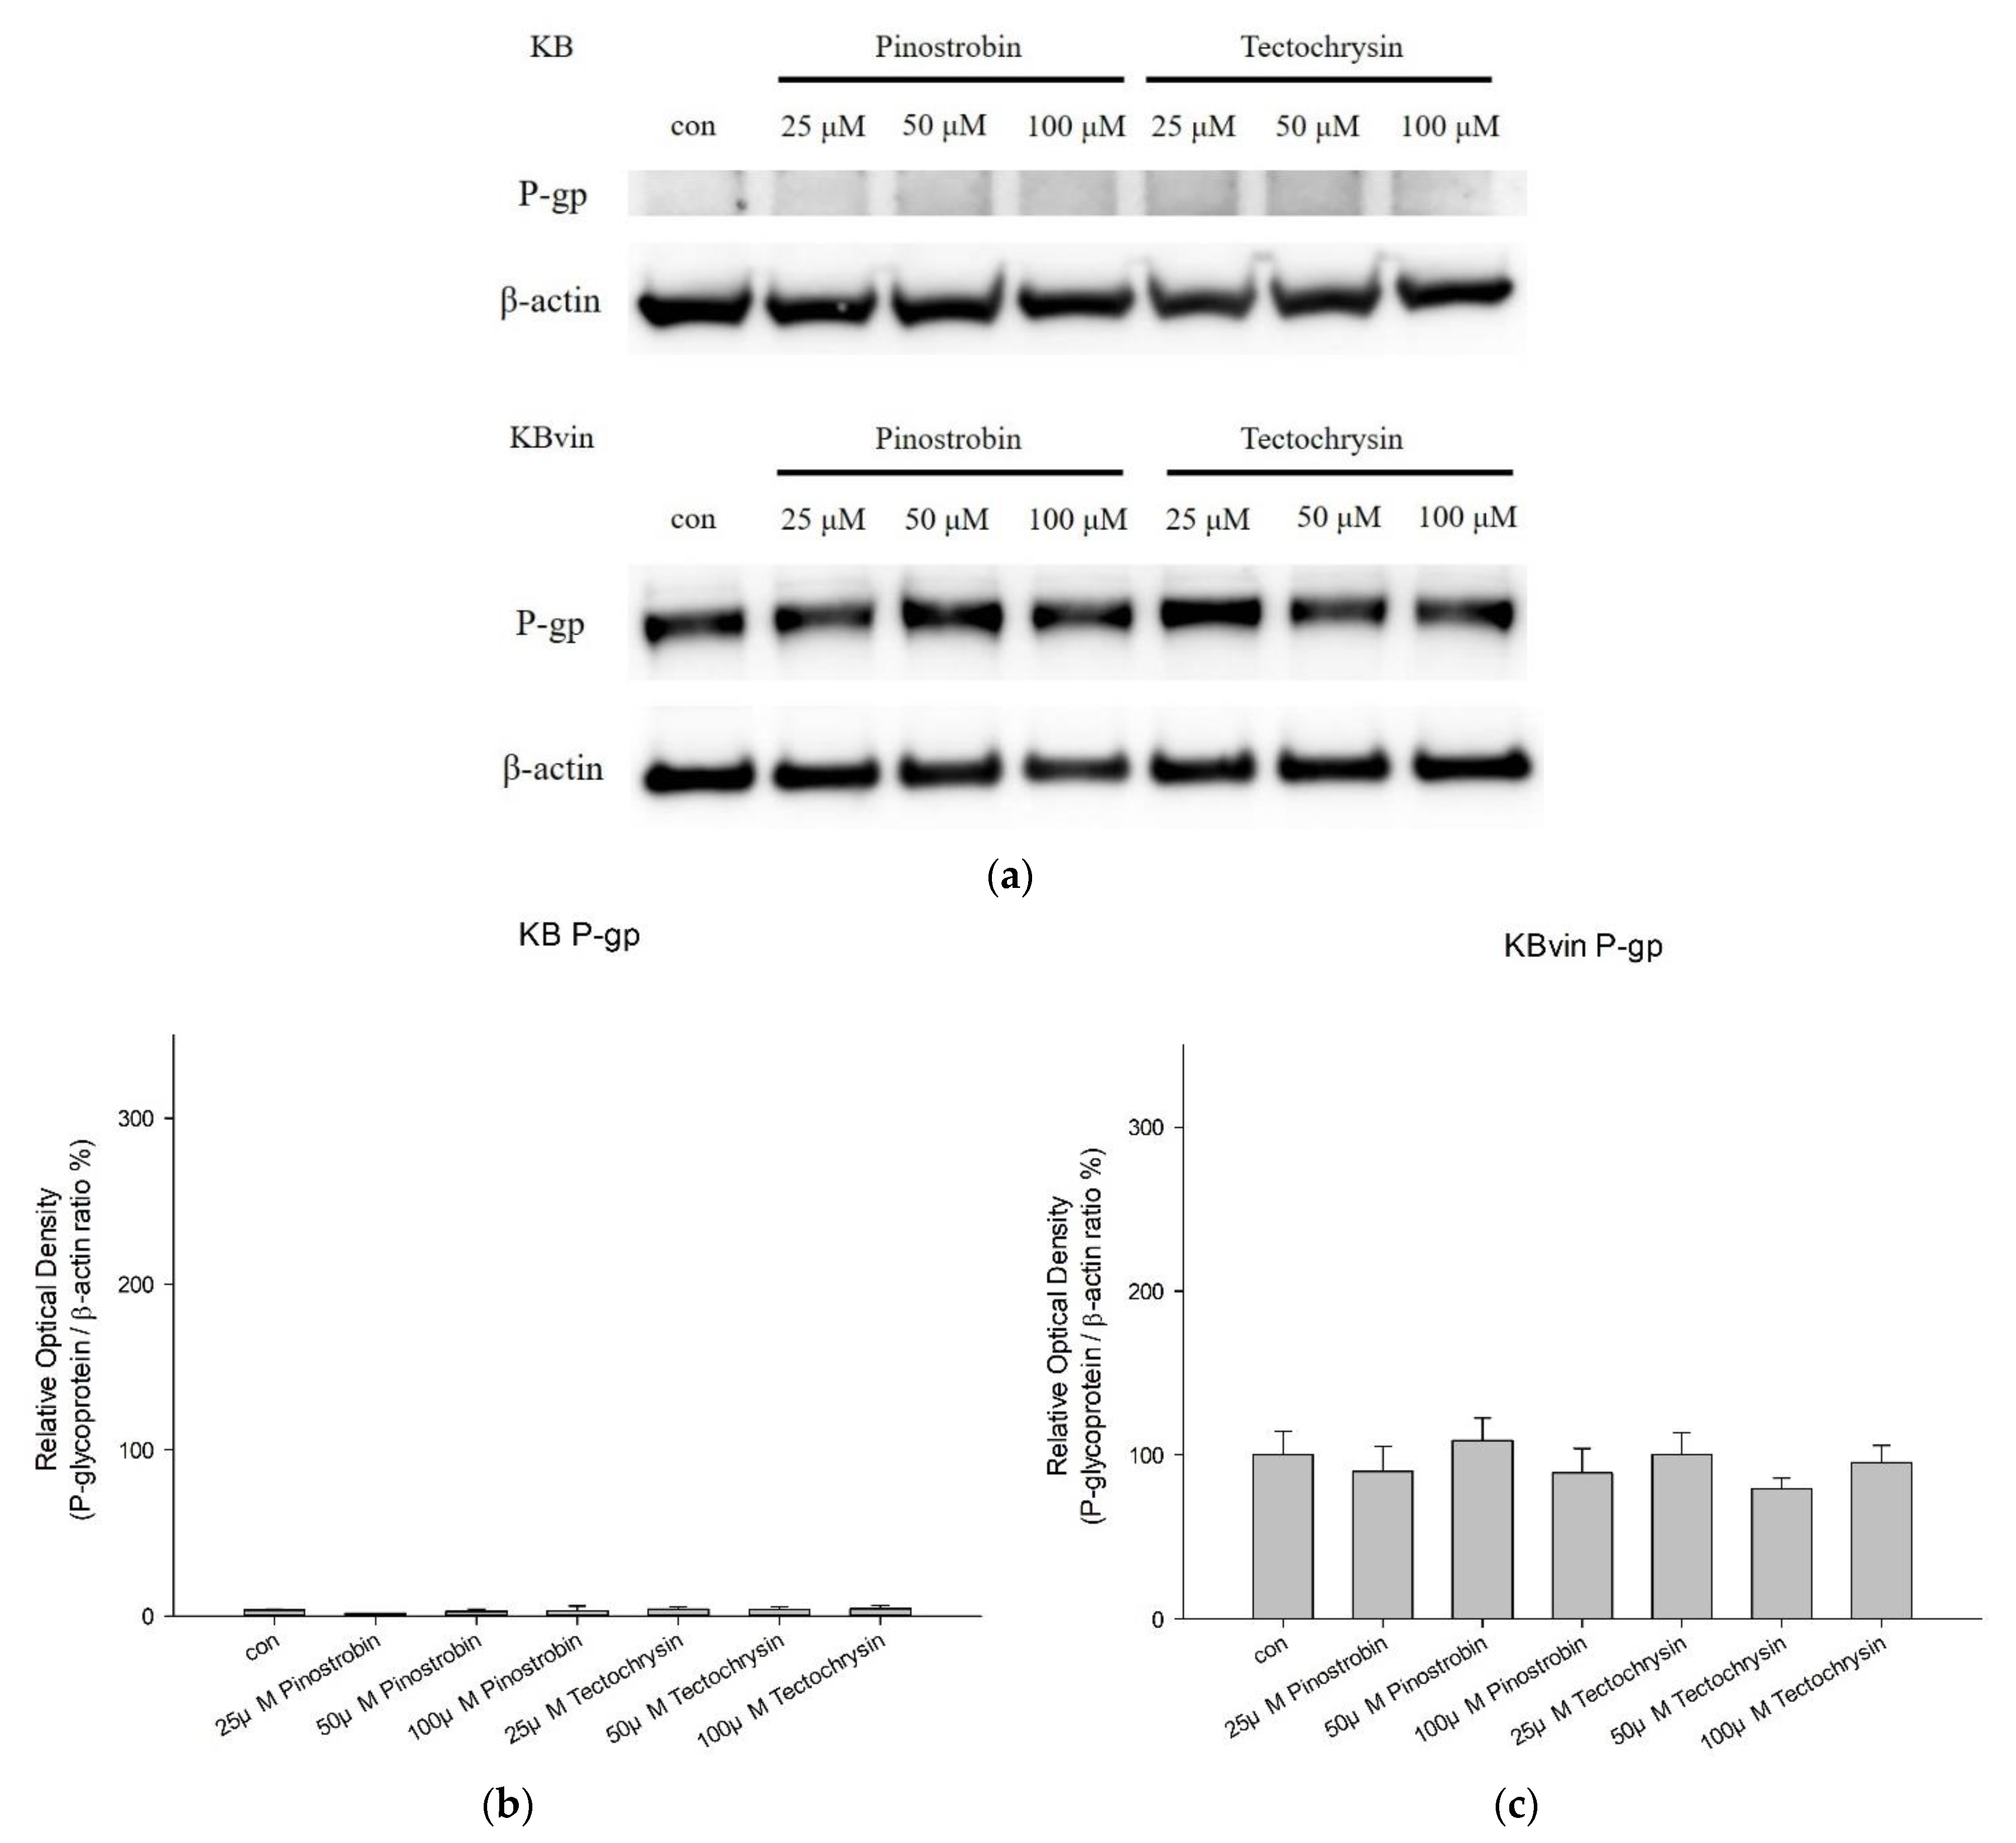
2.2. Effects of Pinostrobin and Tectochrysin on the Conformation, Atpase Activity, and Expression of P-Gp
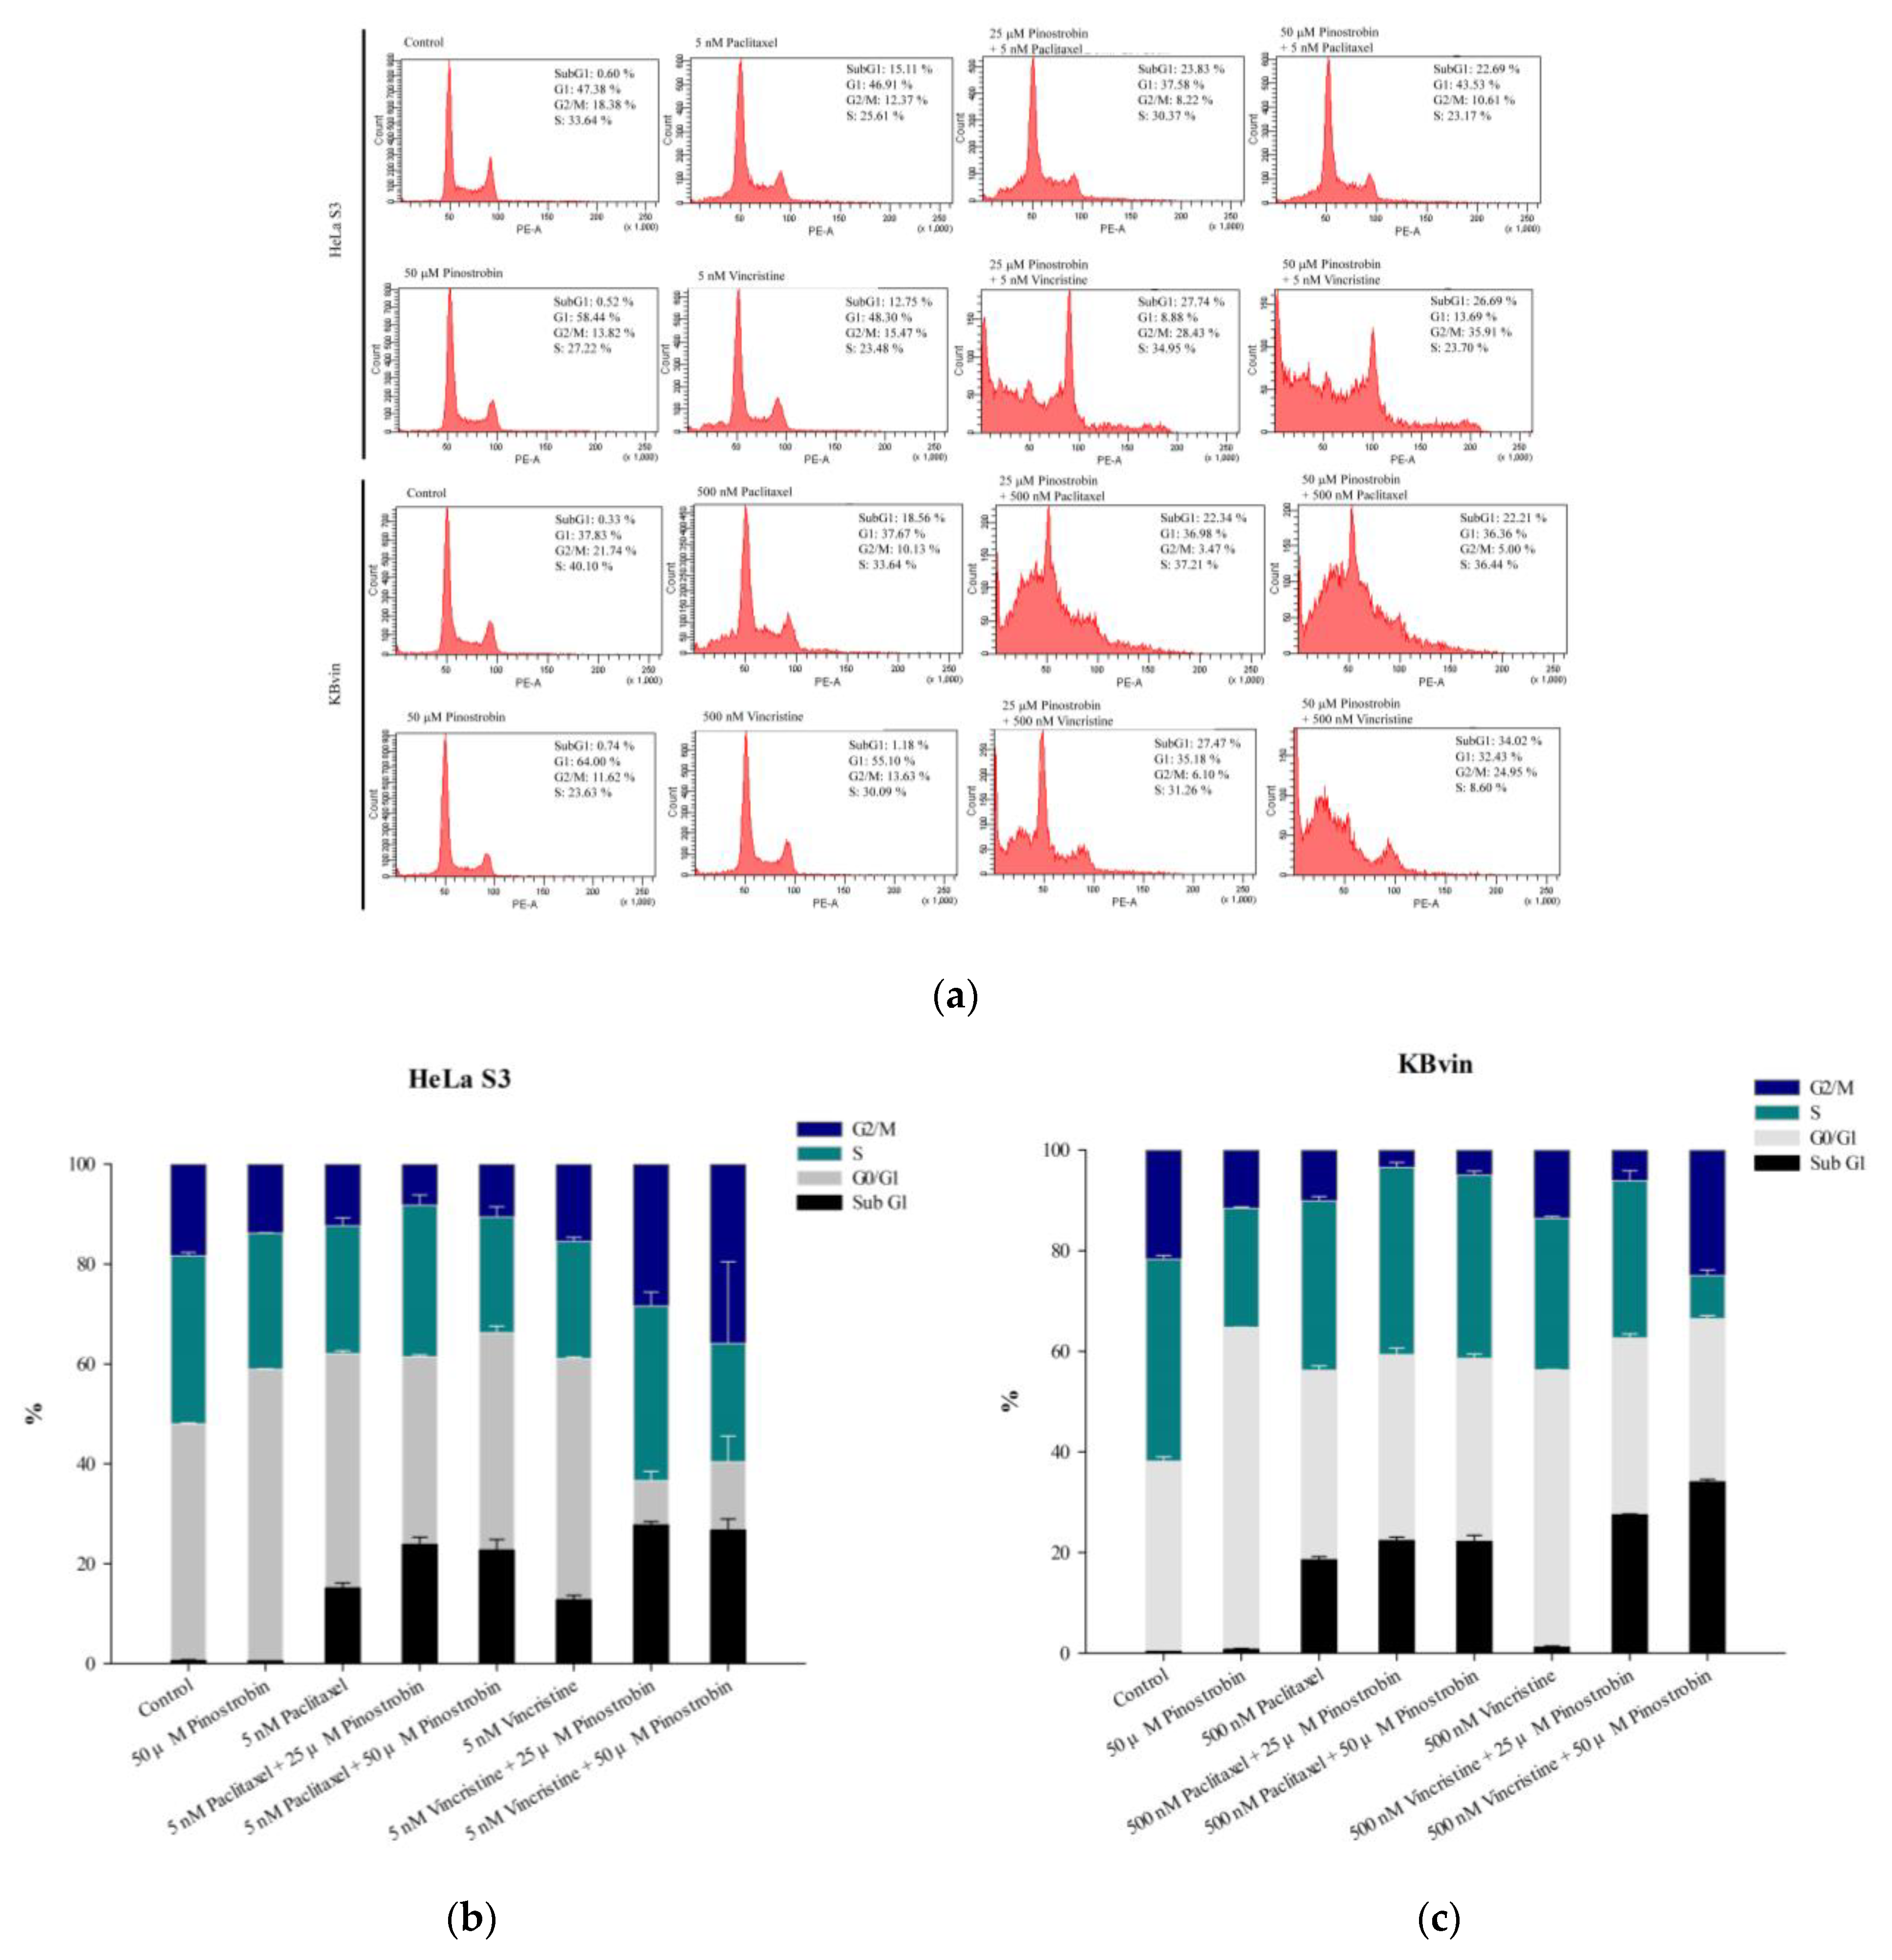
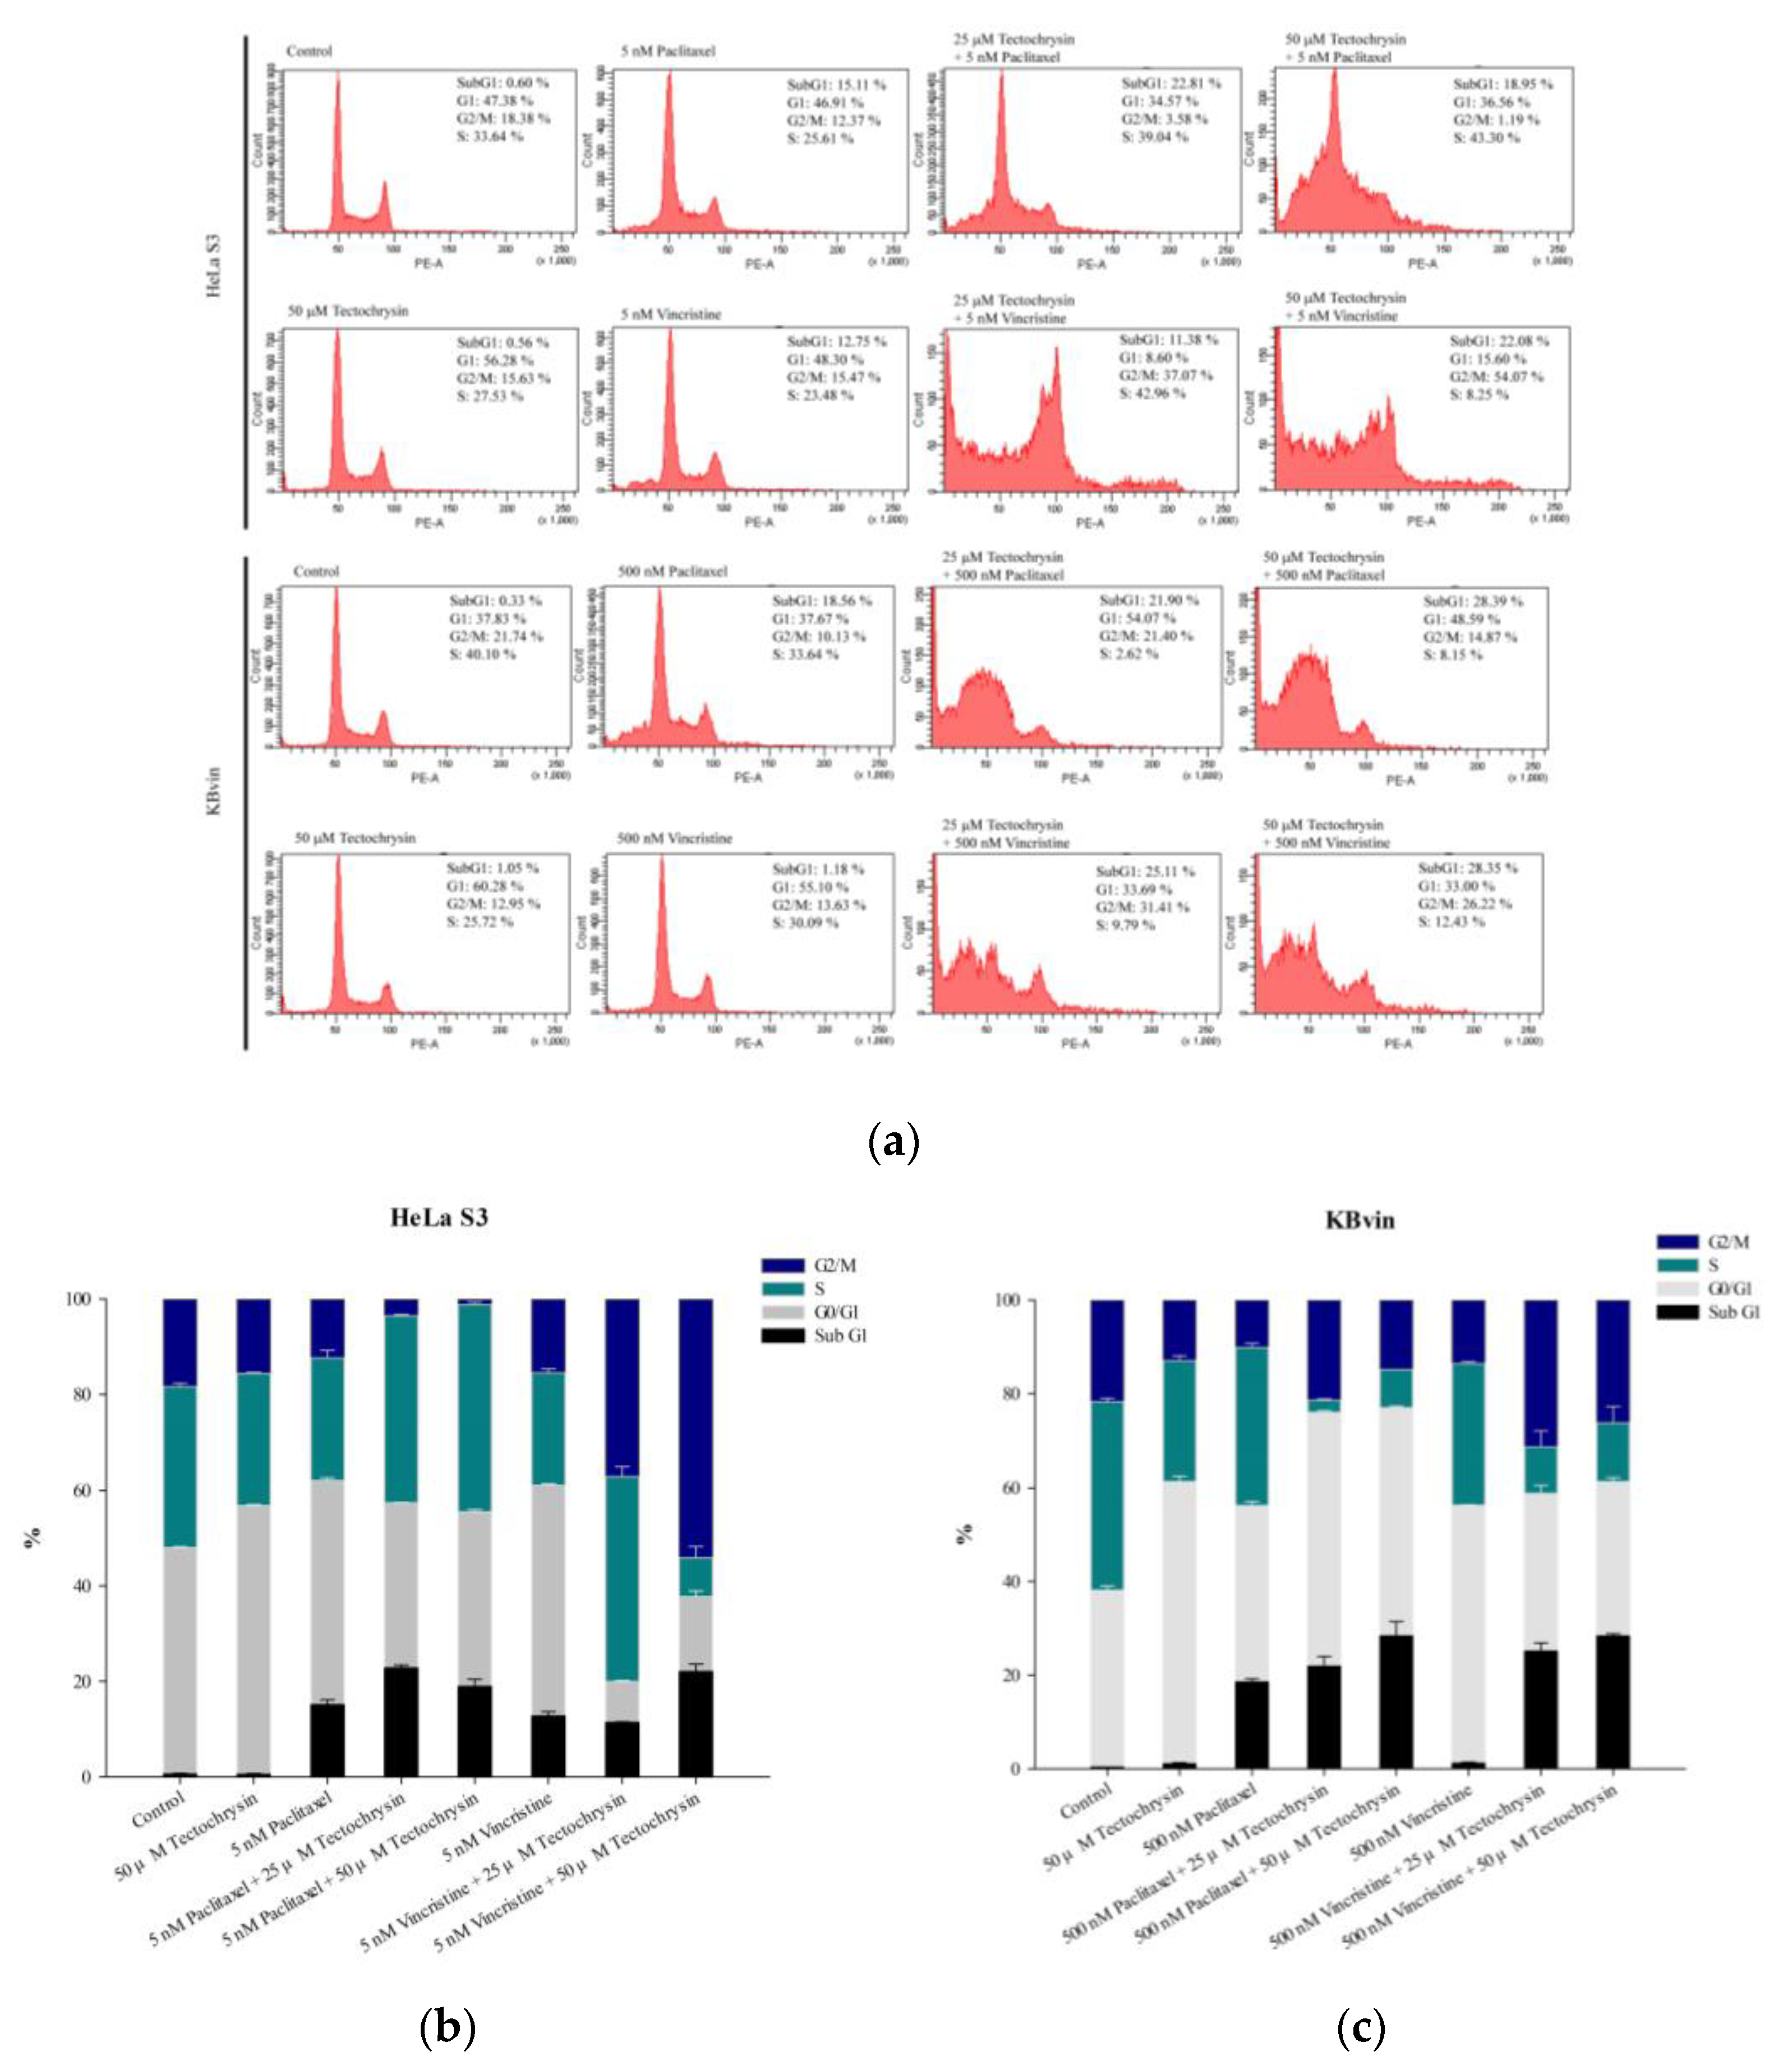
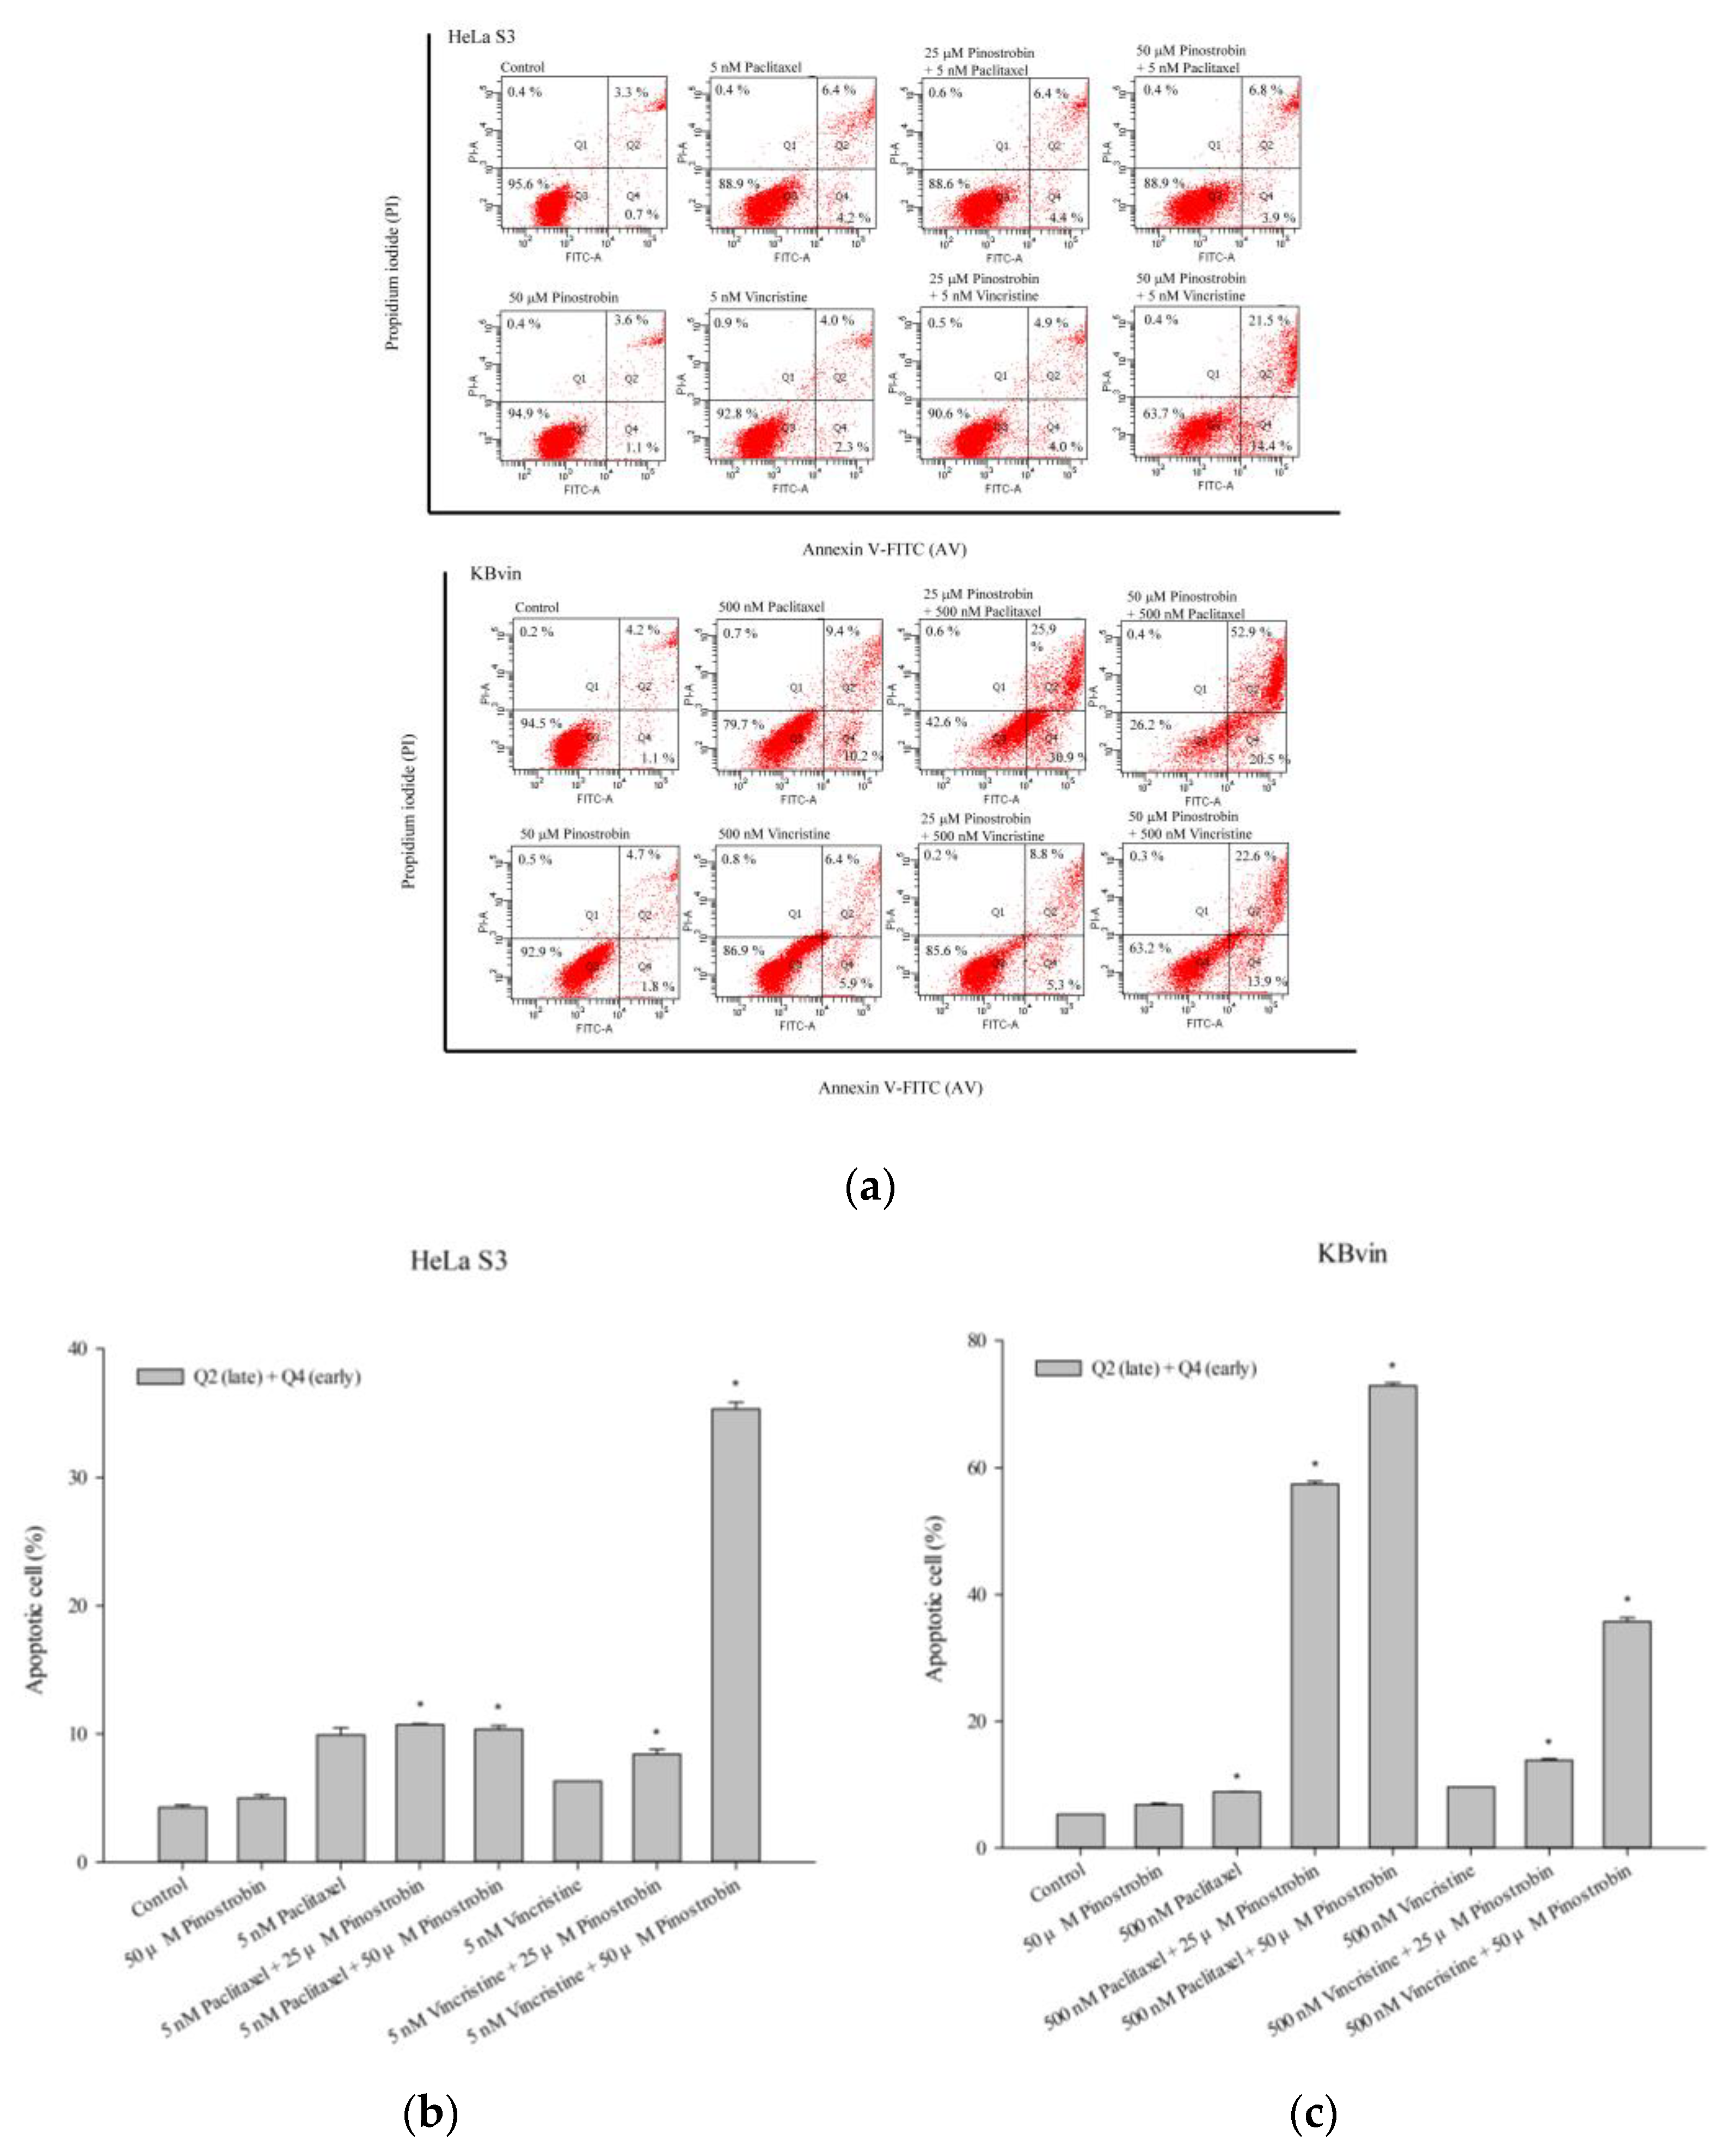
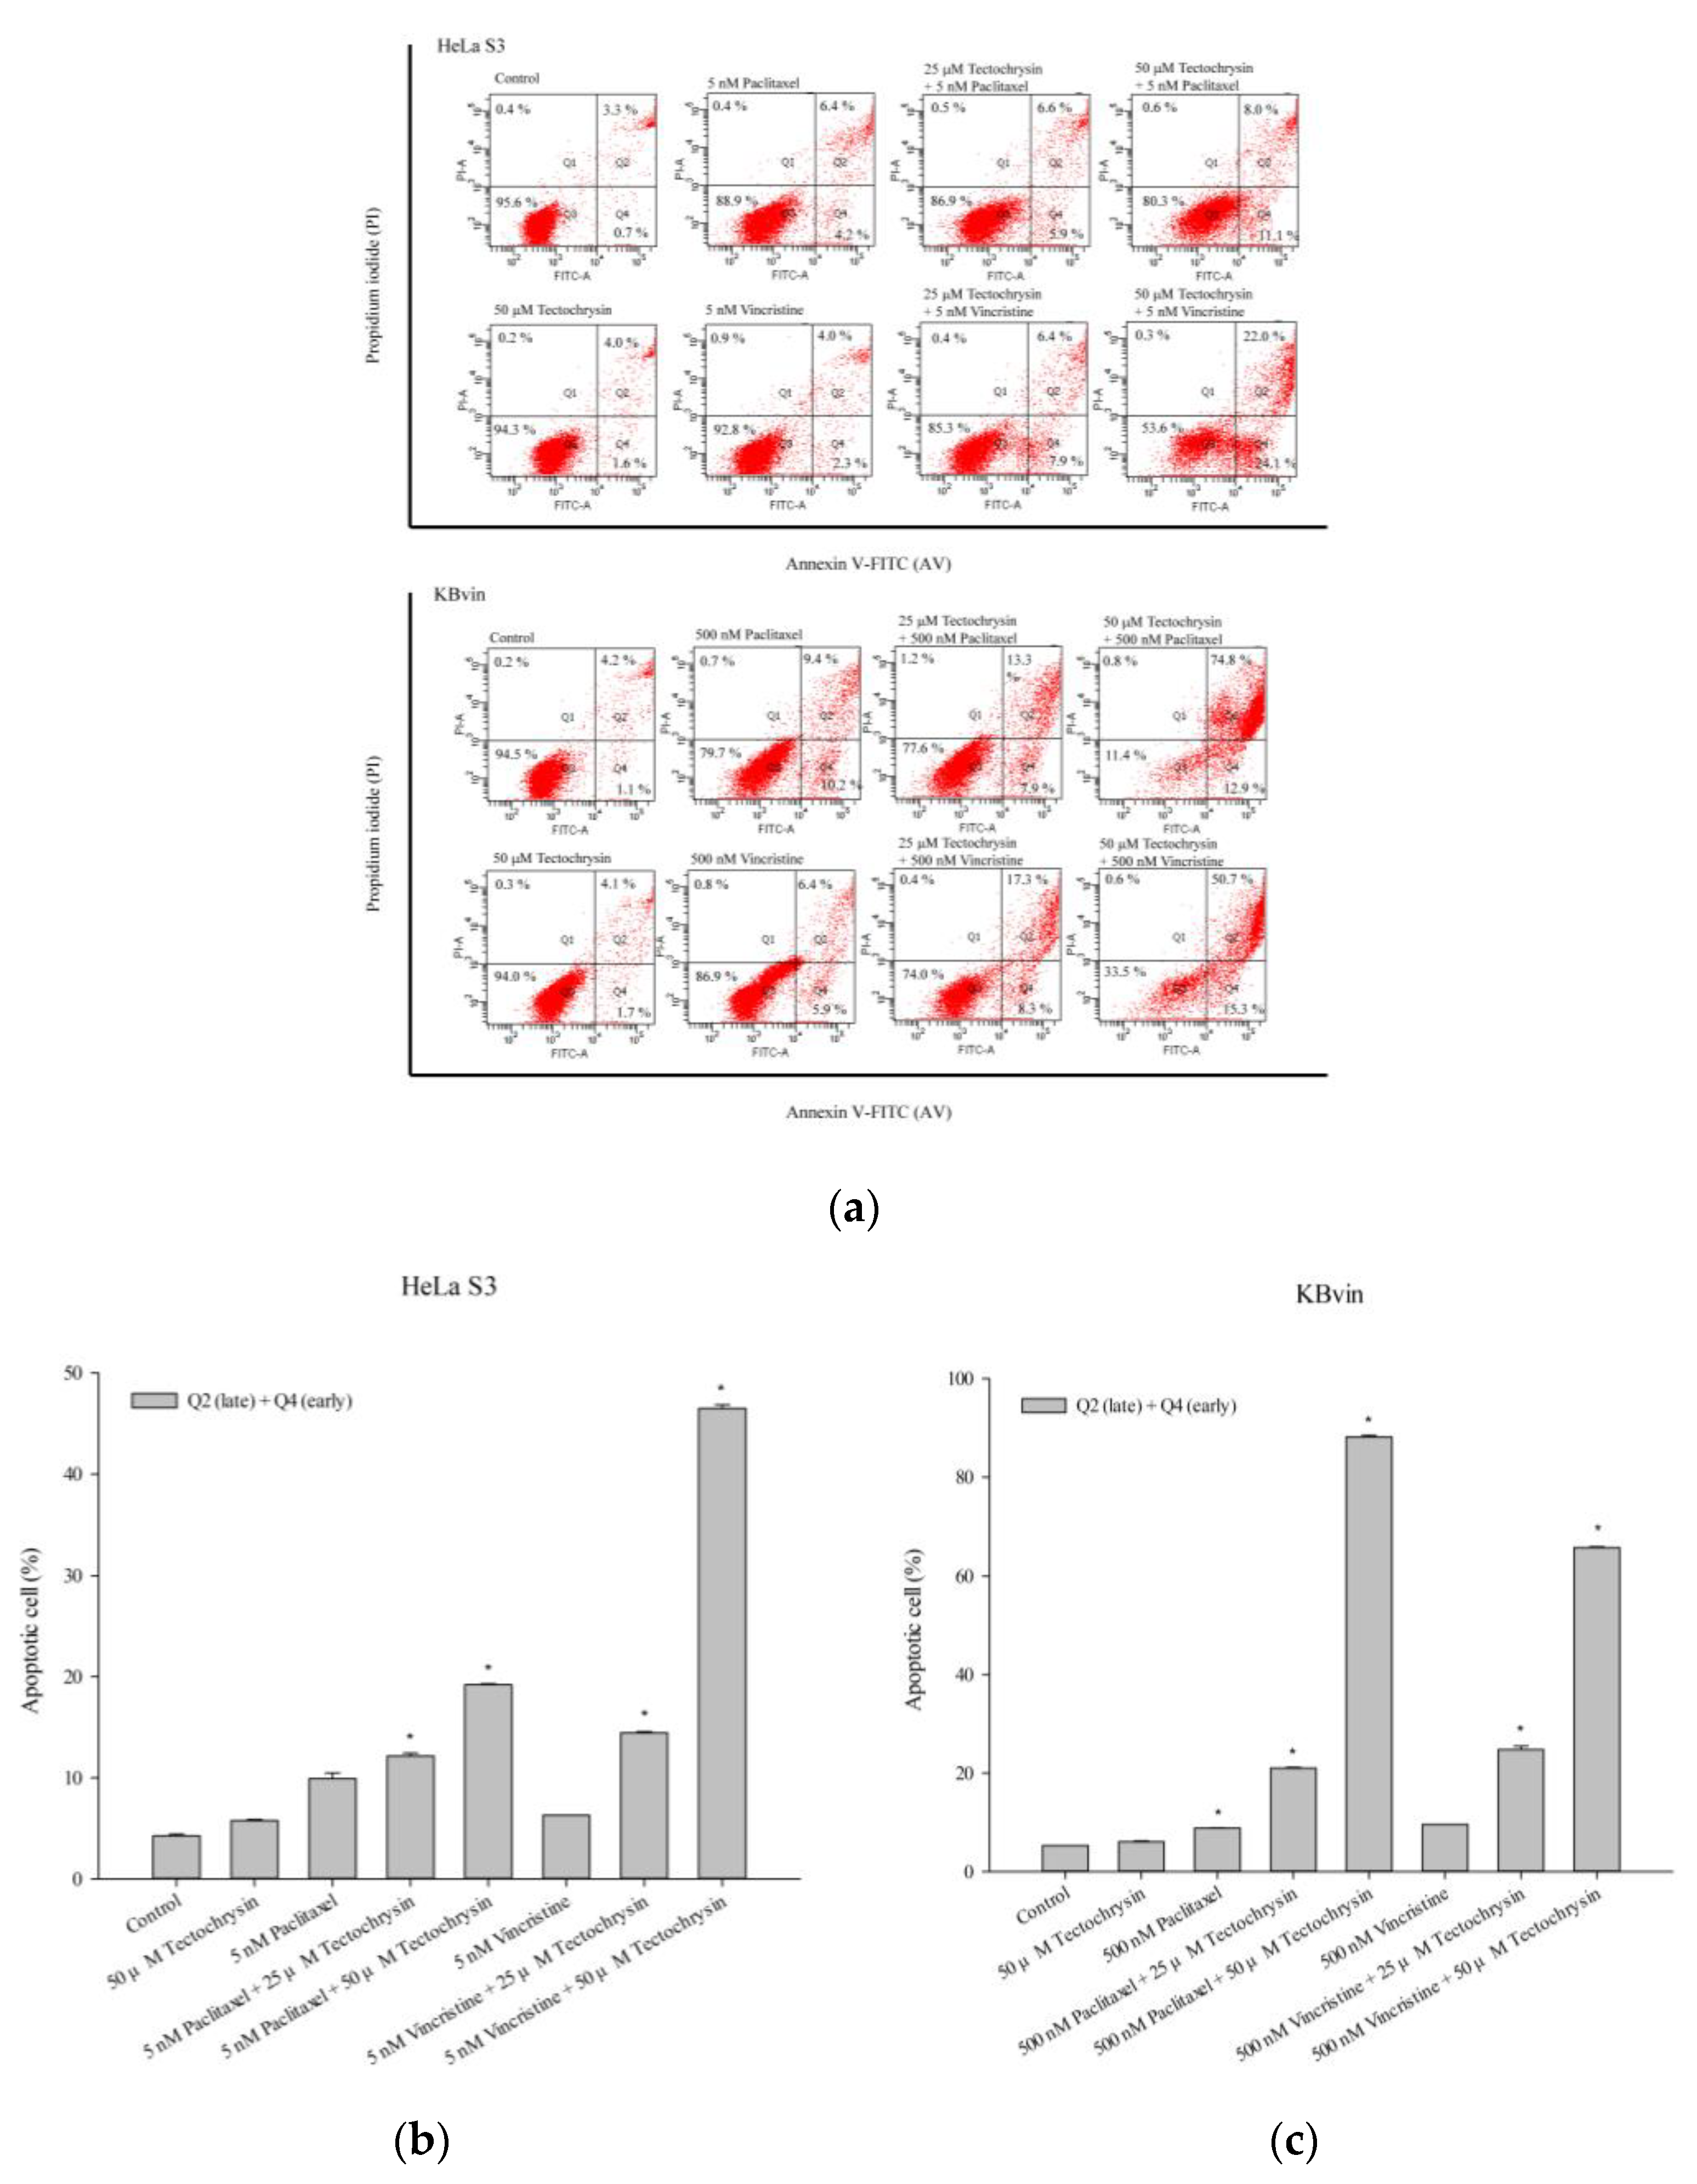
2.3. Potential of Pinostrobin and Tectochrysin for MDR Reversal and Underlying Mechanisms
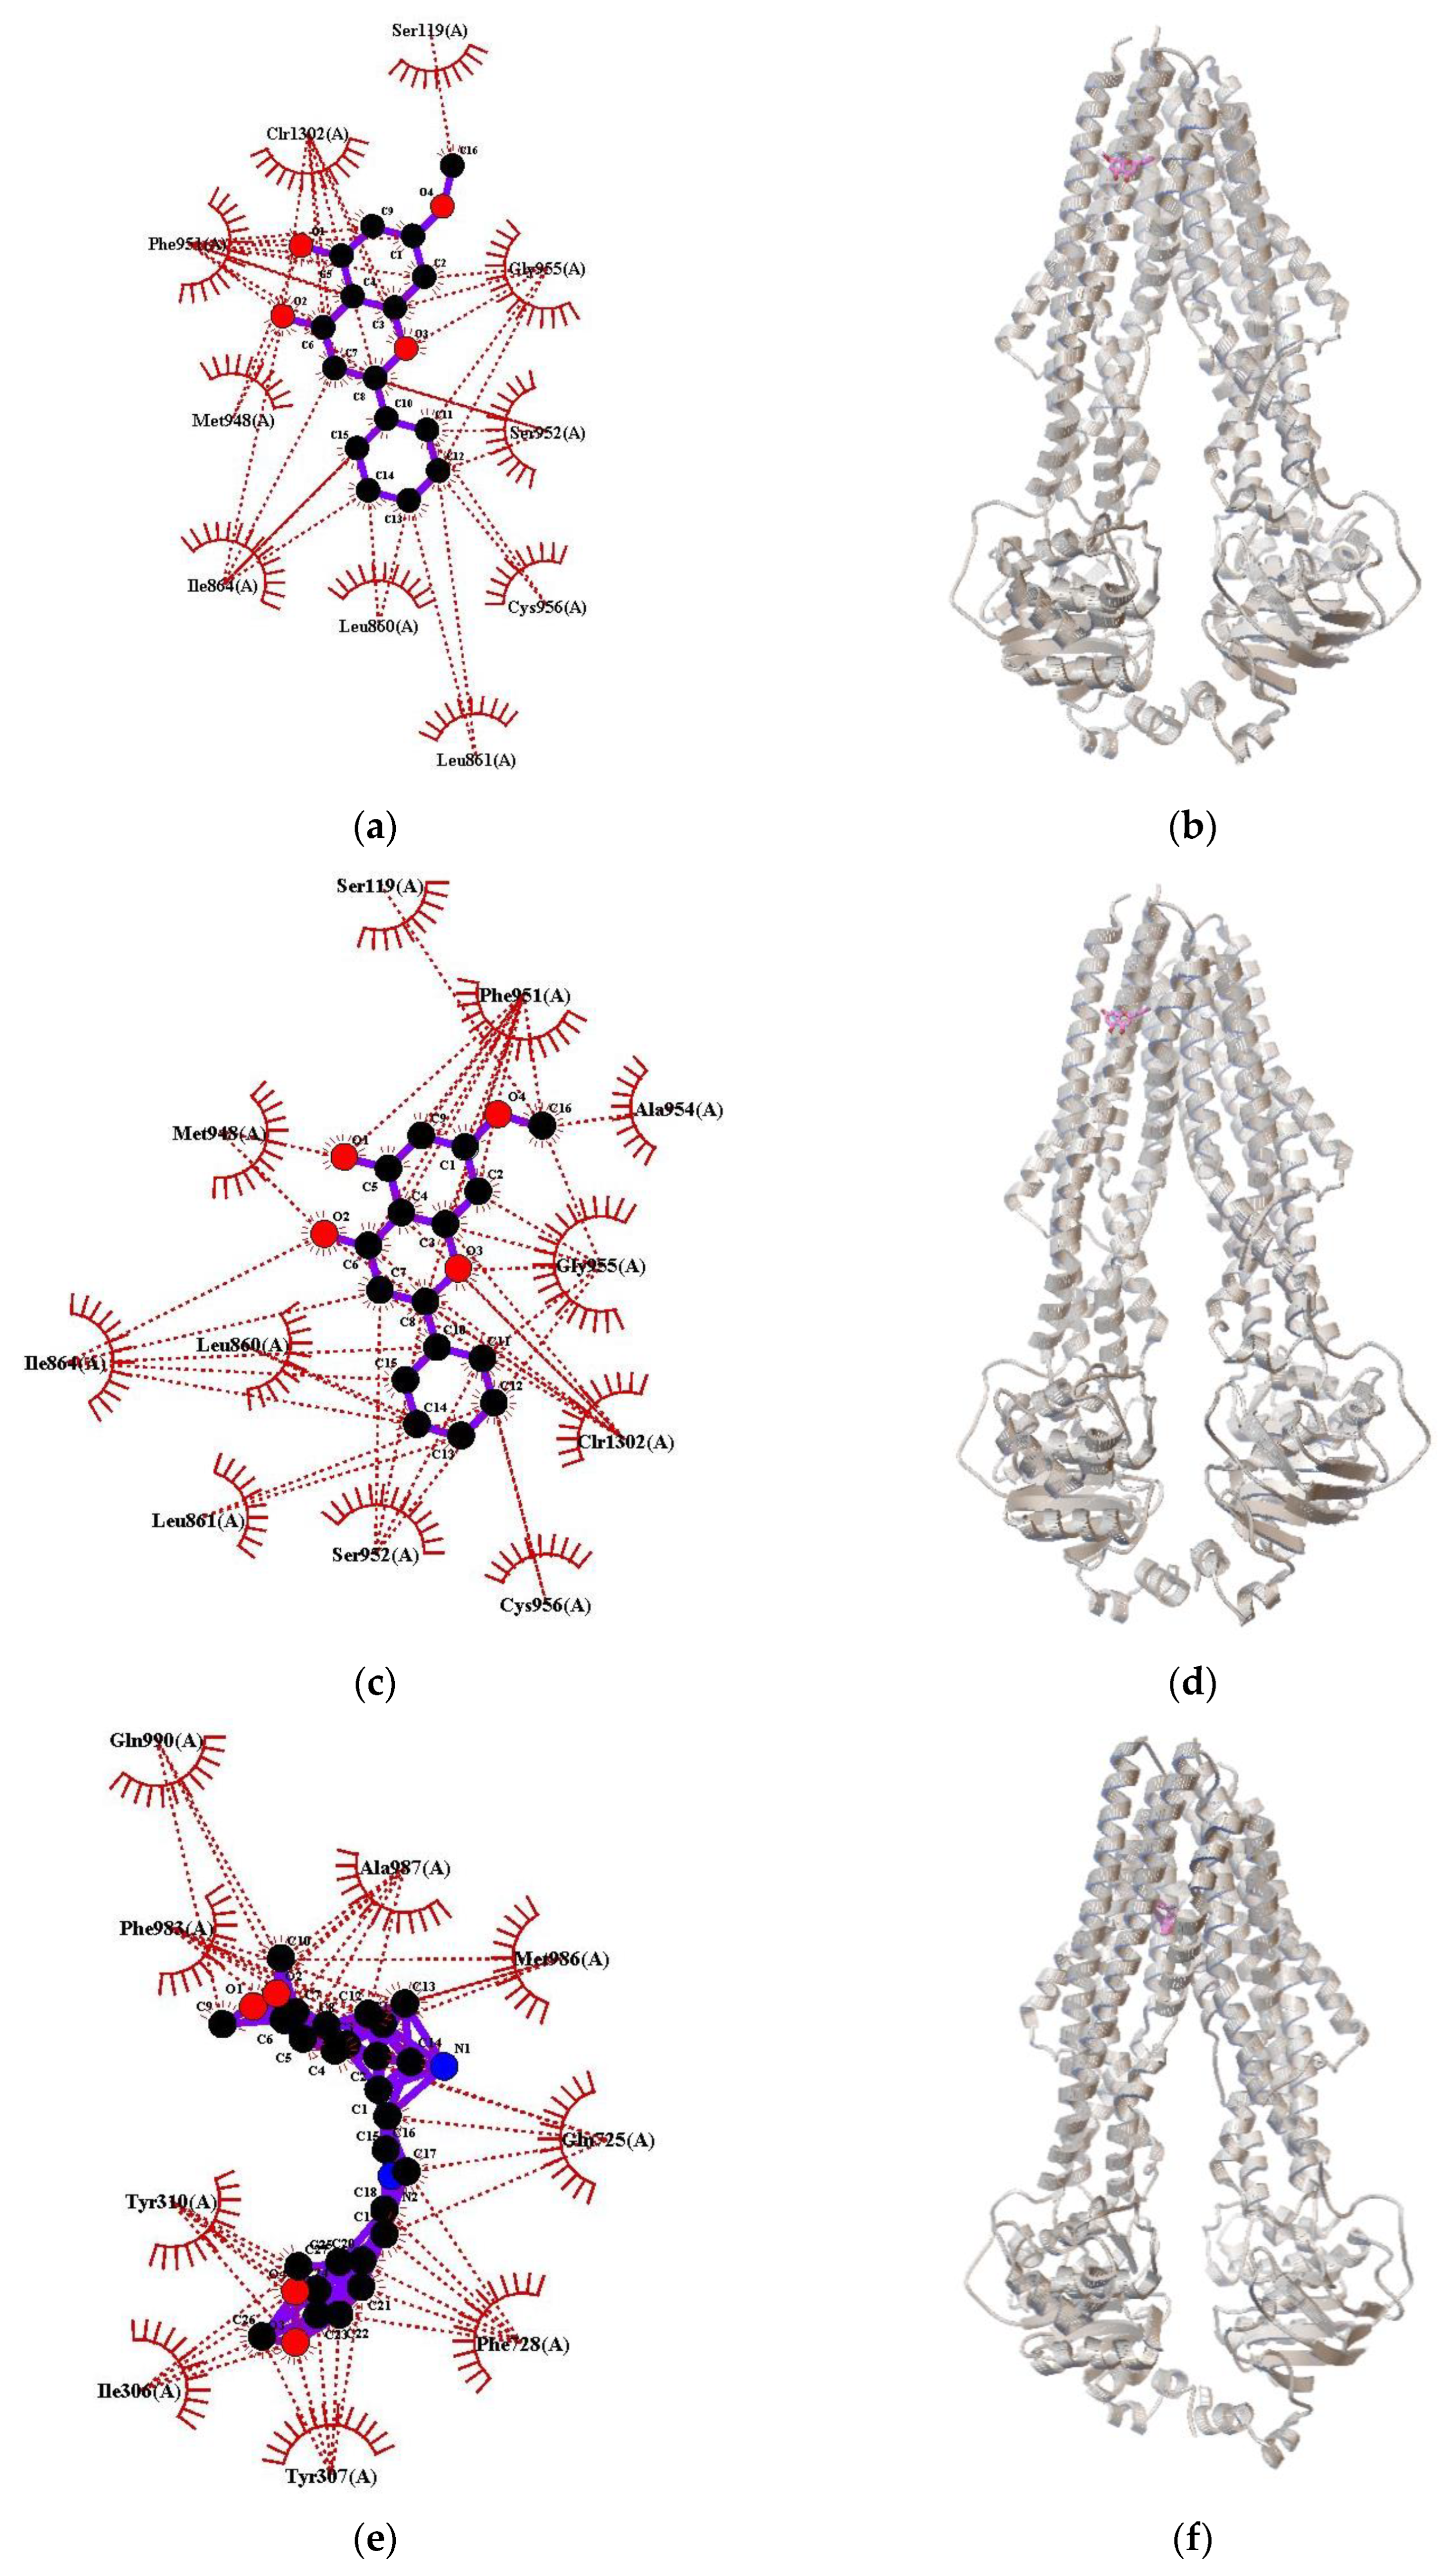
2.4. Molecular Docking of Pinostrobin and Tectochrysin on P-gp
3. Discussion
4. Materials and Methods
4.1. Chemical Compounds and Reagents
4.2. Cell Culture
4.3. Cell Viability Assay and CI Analysis
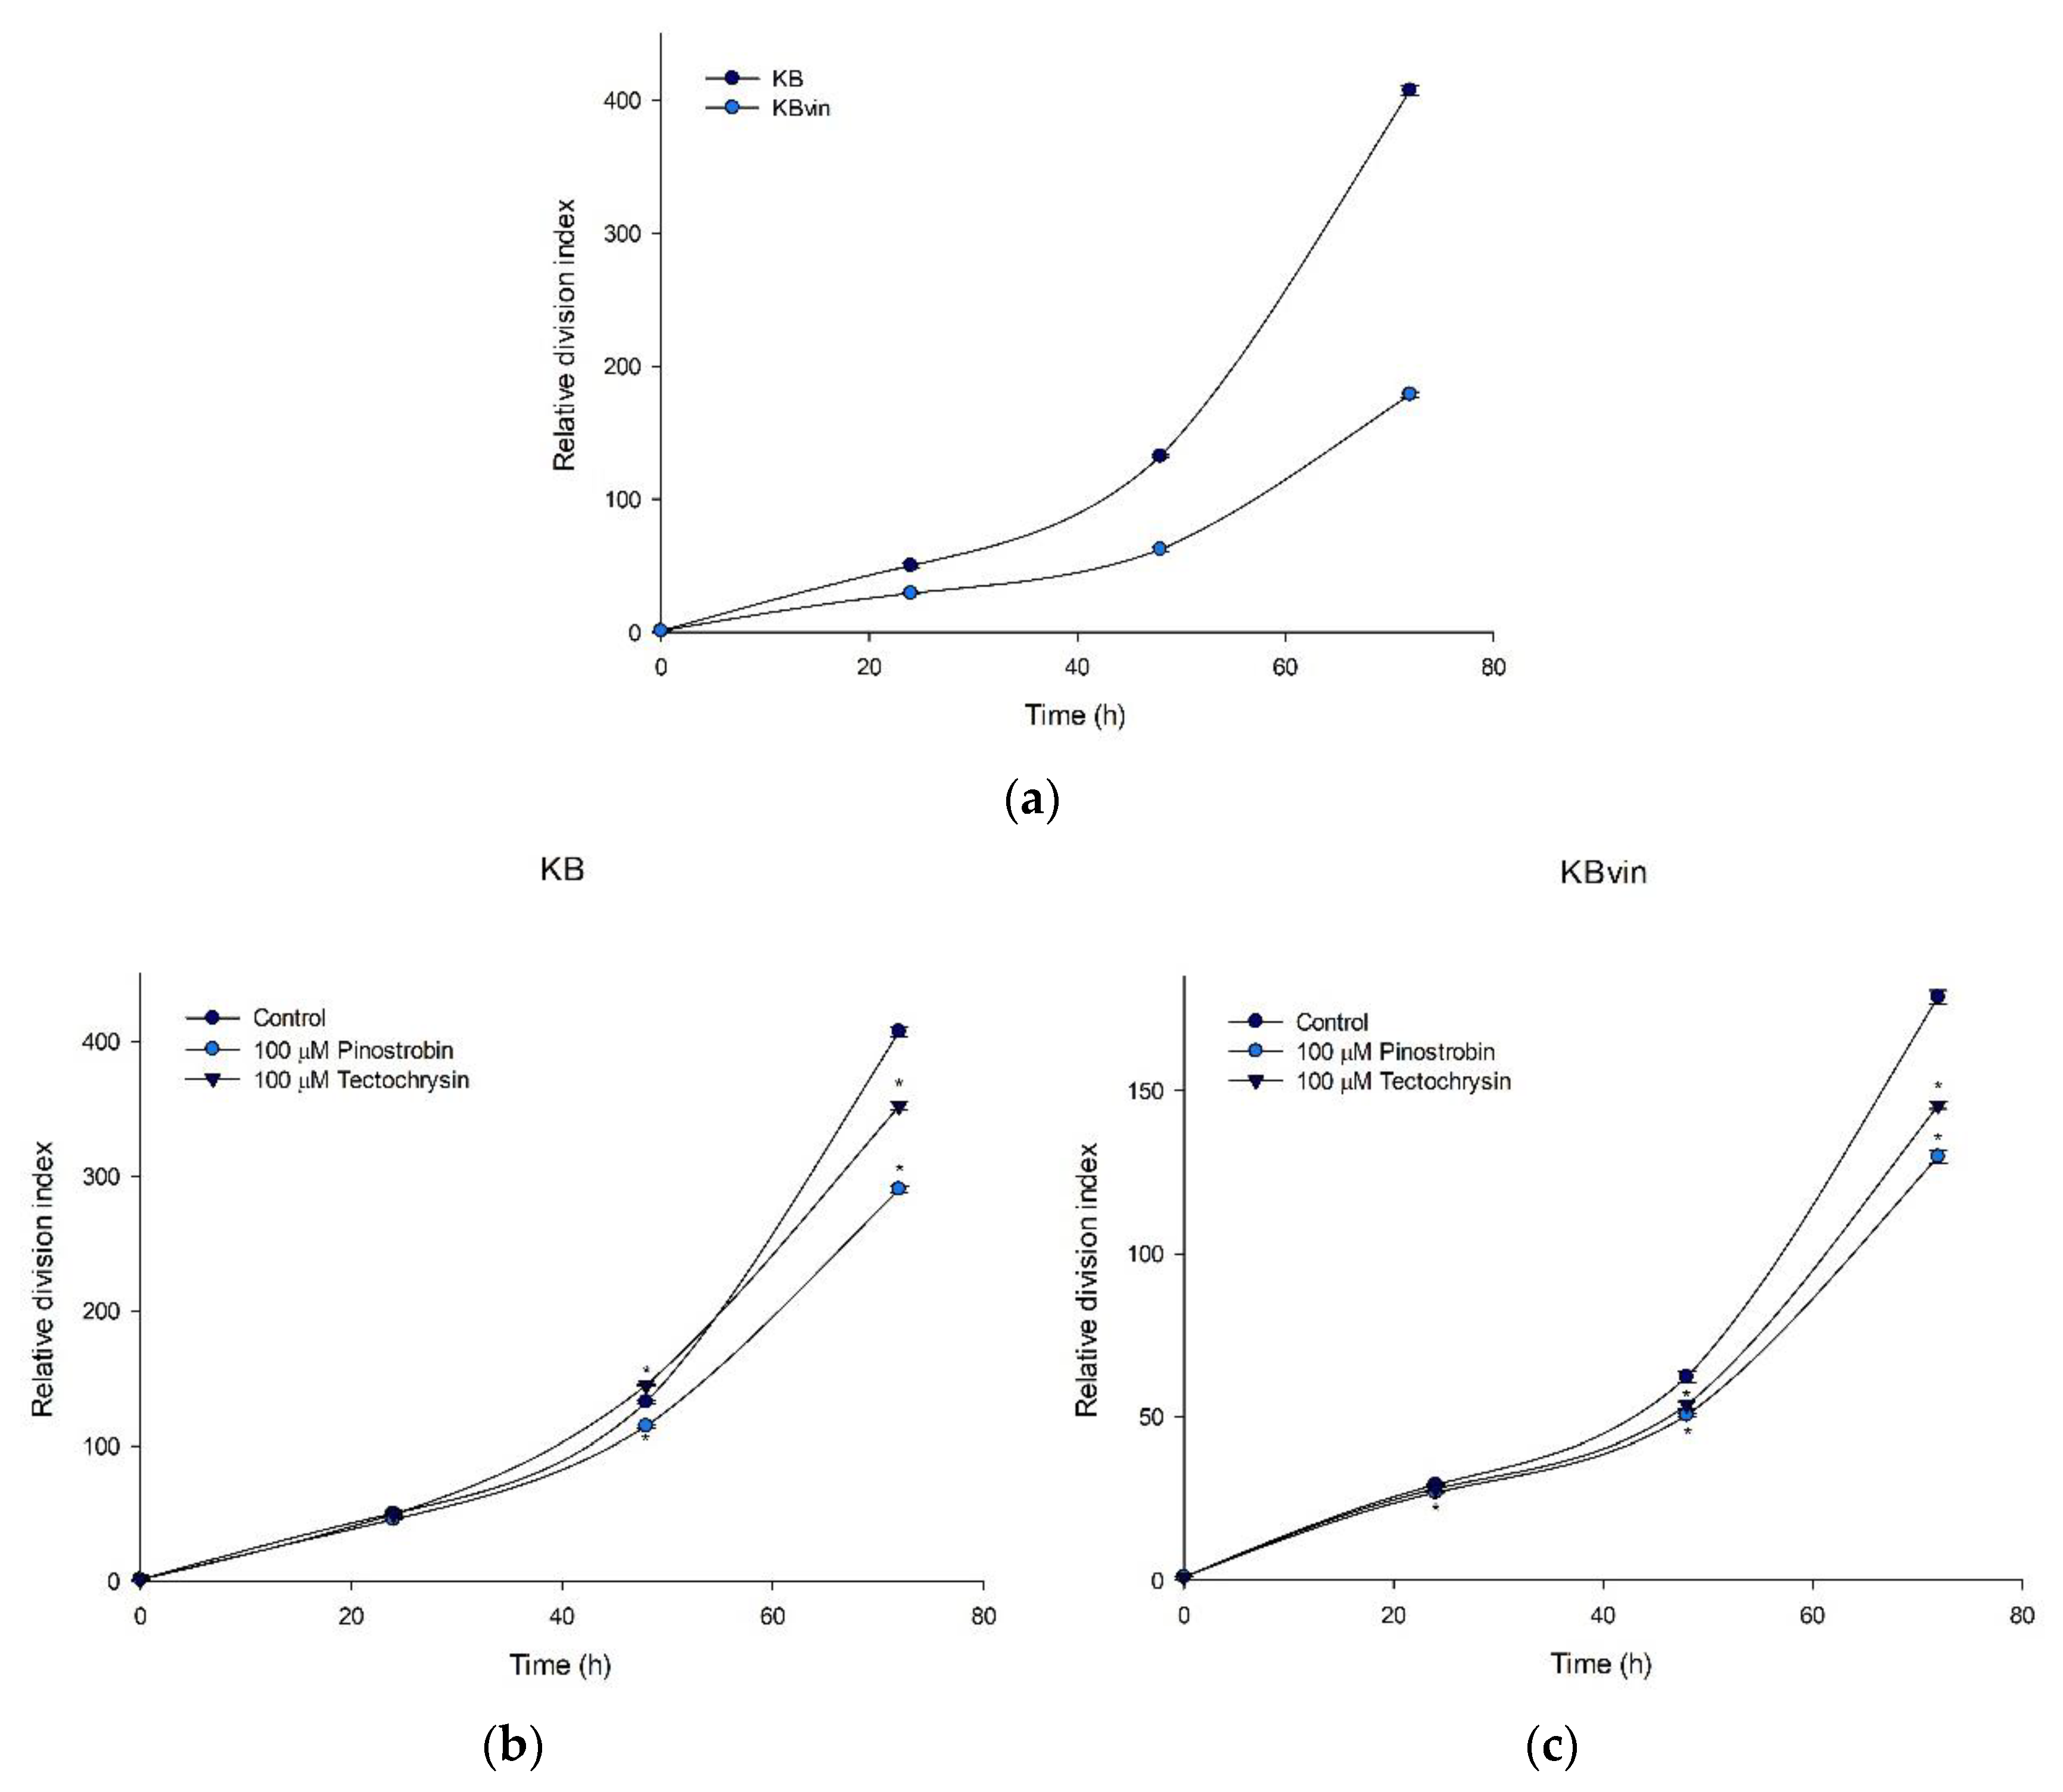
4.4. Cell Proliferation Assay
4.5. Calcein-AM Uptake assay
4.6. Rhodamine 123 and Doxorubicin Efflux Assays
4.7. MDR1 Shift Assay
4.8. P-gp ATPase Activity Assay
4.9. Cell Cycle Analysis
4.10. Apoptosis Assay
4.11. Western Blotting
4.12. Molecular Docking
4.13. Statistical Analysis
Supplementary Materials
Author Contributions
Funding
Institutional Review Board Statement
Informed Consent Statement
Data Availability Statement
Acknowledgments
Conflicts of Interest
References
- Bukowski, K.; Kciuk, M.; Kontek, R. Mechanisms of Multidrug Resistance in Cancer Chemotherapy. Int. J. Mol. Sci. 2020, 21, 3233. [Google Scholar] [CrossRef] [PubMed]
- Binkhathlan, Z.; Lavasanifar, A. P-glycoprotein inhibition as a therapeutic approach for overcoming multidrug resistance in cancer: Current status and future perspectives. Curr. Cancer Drug Targets 2013, 13, 326–346. [Google Scholar] [CrossRef] [PubMed]
- Amawi, H.; Sim, H.M.; Tiwari, A.K.; Ambudkar, S.V.; Shukla, S. ABC Transporter-Mediated Multidrug-Resistant Cancer. Adv. Exp. Med. Biol. 2019, 1141, 549–580. [Google Scholar] [CrossRef] [PubMed]
- Leith, C.P.; Kopecky, K.J.; Chen, I.M.; Eijdems, L.; Slovak, M.L.; McConnell, T.S.; Head, D.R.; Weick, J.; Grever, M.R.; Appelbaum, F.R.; et al. Frequency and clinical significance of the expression of the multidrug resistance proteins MDR1/P-glycoprotein, MRP1, and LRP in acute myeloid leukemia: A Southwest Oncology Group Study. Blood 1999, 94, 1086–1099. [Google Scholar] [PubMed]
- Mechetner, E.; Kyshtoobayeva, A.; Zonis, S.; Kim, H.; Stroup, R.; Garcia, R.; Parker, R.J.; Fruehauf, J.P. Levels of multidrug resistance (MDR1) P-glycoprotein expression by human breast cancer correlate with in vitro resistance to taxol and doxorubicin. Clin. Cancer Res. 1998, 4, 389–398. [Google Scholar]
- Huang, C.Y.; Ju, D.T.; Chang, C.F.; Muralidhar Reddy, P.; Velmurugan, B.K. A review on the effects of current chemotherapy drugs and natural agents in treating non-small cell lung cancer. BioMedicine 2017, 7, 23. [Google Scholar] [CrossRef] [PubMed]
- Tinoush, B.; Shirdel, I.; Wink, M. Phytochemicals: Potential Lead Molecules for MDR Reversal. Front. Pharmacol. 2020, 11, 832. [Google Scholar] [CrossRef]
- Ghaffari, T.; Hong, J.H.; Asnaashari, S.; Farajnia, S.; Delazar, A.; Hamishehkar, H.; Kim, K.H. Natural Phytochemicals Derived from Gymnosperms in the Prevention and Treatment of Cancers. Int. J. Mol. Sci. 2021, 22, 6636. [Google Scholar] [CrossRef]
- Jones, A.A.; Gehler, S. Acacetin and Pinostrobin Inhibit Malignant Breast Epithelial Cell Adhesion and Focal Adhesion Formation to Attenuate Cell Migration. Integr. Cancer 2020, 19, 1534735420918945. [Google Scholar] [CrossRef]
- Kuete, V.; Nkuete, A.H.; Mbaveng, A.T.; Wiench, B.; Wabo, H.K.; Tane, P.; Efferth, T. Cytotoxicity and modes of action of 4′-hydroxy-2′,6′-dimethoxychalcone and other flavonoids toward drug-sensitive and multidrug-resistant cancer cell lines. Phytomed. Int. J. Phytother. Phytopharm. 2014, 21, 1651–1657. [Google Scholar] [CrossRef]
- Patel, N.K.; Jaiswal, G.; Bhutani, K.K. A review on biological sources, chemistry and pharmacological activities of pinostrobin. Nat. Prod. Res. 2016, 30, 2017–2027. [Google Scholar] [CrossRef] [PubMed]
- Park, M.H.; Hong, J.E.; Park, E.S.; Yoon, H.S.; Seo, D.W.; Hyun, B.K.; Han, S.B.; Ham, Y.W.; Hwang, B.Y.; Hong, J.T. Anticancer effect of tectochrysin in colon cancer cell via suppression of NF-kappaB activity and enhancement of death receptor expression. Mol. Cancer 2015, 14, 124. [Google Scholar] [CrossRef]
- He, B.; Xu, F.; Yan, T.; Xiao, F.; Wu, B.; Wang, Y.; Bi, K.; Jia, Y. Tectochrysin from Alpinia Oxyphylla Miq. alleviates Aβ(1-42) induced learning and memory impairments in mice. Eur. J. Pharm. 2019, 842, 365–372. [Google Scholar] [CrossRef] [PubMed]
- Park, M.H.; Hong, J.E.; Hwang, C.J.; Choi, M.; Choi, J.S.; An, Y.J.; Son, D.J.; Hong, J.T. Synergistic inhibitory effect of cetuximab and tectochrysin on human colon cancer cell growth via inhibition of EGFR signal. Arch. Pharm. Res. 2016, 39, 721–729. [Google Scholar] [CrossRef] [PubMed]
- Ahmed-Belkacem, A.; Pozza, A.; Muñoz-Martínez, F.; Bates, S.E.; Castanys, S.; Gamarro, F.; Di Pietro, A.; Pérez-Victoria, J.M. Flavonoid structure-activity studies identify 6-prenylchrysin and tectochrysin as potent and specific inhibitors of breast cancer resistance protein ABCG2. Cancer Res. 2005, 65, 4852–4860. [Google Scholar] [CrossRef]
- Mohana, S.; Ganesan, M.; Agilan, B.; Karthikeyan, R.; Srithar, G.; Beaulah Mary, R.; Ananthakrishnan, D.; Velmurugan, D.; Rajendra Prasad, N.; Ambudkar, S.V. Screening dietary flavonoids for the reversal of P-glycoprotein-mediated multidrug resistance in cancer. Mol. Biosyst. 2016, 12, 2458–2470. [Google Scholar] [CrossRef]
- Li, W.; Zhang, H.; Assaraf, Y.G.; Zhao, K.; Xu, X.; Xie, J.; Yang, D.H.; Chen, Z.S. Overcoming ABC transporter-mediated multidrug resistance: Molecular mechanisms and novel therapeutic drug strategies. Drug Resist. Update 2016, 27, 14–29. [Google Scholar] [CrossRef]
- Robey, R.W.; Pluchino, K.M.; Hall, M.D.; Fojo, A.T.; Bates, S.E.; Gottesman, M.M. Revisiting the role of ABC transporters in multidrug-resistant cancer. Nat. Rev. Cancer 2018, 18, 452–464. [Google Scholar] [CrossRef]
- Lai, J.I.; Tseng, Y.J.; Chen, M.H.; Huang, C.F.; Chang, P.M. Clinical Perspective of FDA Approved Drugs With P-Glycoprotein Inhibition Activities for Potential Cancer Therapeutics. Front. Oncol. 2020, 10, 561936. [Google Scholar] [CrossRef]
- Pajic, M.; Iyer, J.K.; Kersbergen, A.; van der Burg, E.; Nygren, A.O.; Jonkers, J.; Borst, P.; Rottenberg, S. Moderate increase in Mdr1a/1b expression causes in vivo resistance to doxorubicin in a mouse model for hereditary breast cancer. Cancer Res. 2009, 69, 6396–6404. [Google Scholar] [CrossRef] [PubMed]
- Kumar, A.; Jaitak, V. Natural products as multidrug resistance modulators in cancer. Eur. J. Med. Chem. 2019, 176, 268–291. [Google Scholar] [CrossRef] [PubMed]
- Imai, Y.; Tsukahara, S.; Asada, S.; Sugimoto, Y. Phytoestrogens/flavonoids reverse breast cancer resistance protein/ABCG2-mediated multidrug resistance. Cancer Res. 2004, 64, 4346–4352. [Google Scholar] [CrossRef] [PubMed]
- Chang, H.Y.; Pan, K.L.; Ma, F.C.; Jiao, X.Y.; Zhu, H.F.; Liu, J.H.; Huang, Y.; Cao, Y.H. The study on reversing mechanism of multidrug resistance of K562/A02 cell line by curcumin and erythromycin. Zhonghua Xue Ye Xue Za Zhi = Zhonghua Xueyexue Zazhi 2006, 27, 254–258. [Google Scholar] [PubMed]
- Ganta, S.; Amiji, M. Coadministration of Paclitaxel and curcumin in nanoemulsion formulations to overcome multidrug resistance in tumor cells. Mol. Pharm. 2009, 6, 928–939. [Google Scholar] [CrossRef] [PubMed]
- Lei, Y.; Tan, J.; Wink, M.; Ma, Y.; Li, N.; Su, G. An isoquinoline alkaloid from the Chinese herbal plant Corydalis yanhusuo W.T. Wang inhibits P-glycoprotein and multidrug resistance-associate protein 1. Food Chem. 2013, 136, 1117–1121. [Google Scholar] [CrossRef]
- Ferreira, R.J.; Ferreira, M.J.; dos Santos, D.J. Molecular docking characterizes substrate-binding sites and efflux modulation mechanisms within P-glycoprotein. J. Chem. Inf. Model 2013, 53, 1747–1760. [Google Scholar] [CrossRef]
- Abdelfatah, S.; Böckers, M.; Asensio, M.; Kadioglu, O.; Klinger, A.; Fleischer, E.; Efferth, T. Isopetasin and S-isopetasin as novel P-glycoprotein inhibitors against multidrug-resistant cancer cells. Phytomed. Int. J. Phytother. Phytopharm. 2021, 86, 153196. [Google Scholar] [CrossRef] [PubMed]
- Borst, P. Looking back at multidrug resistance (MDR) research and ten mistakes to be avoided when writing about ABC transporters in MDR. FEBS Lett. 2020, 594, 4001–4011. [Google Scholar] [CrossRef]
- Teng, Y.N.; Sheu, M.J.; Hsieh, Y.W.; Wang, R.Y.; Chiang, Y.C.; Hung, C.C. β-carotene reverses multidrug resistant cancer cells by selectively modulating human P-glycoprotein function. Phytomed. Int. J. Phytother. Phytopharm. 2016, 23, 316–323. [Google Scholar] [CrossRef]
- Chou, T.C. Drug combination studies and their synergy quantification using the Chou-Talalay method. Cancer Res. 2010, 70, 440–446. [Google Scholar] [CrossRef]
- Georgiou, M.; Ntavelou, P.; Stokes, W.; Roy, R.; Maher, G.J.; Stoilova, T.; Choo, J.; Rakhit, C.P.; Martins, M.; Ajuh, P.; et al. ATR and CDK4/6 inhibition target the growth of methotrexate-resistant choriocarcinoma. Oncogene 2022, 41, 2540–2554. [Google Scholar] [CrossRef] [PubMed]
- Nosol, K.; Romane, K.; Irobalieva, R.N.; Alam, A.; Kowal, J.; Fujita, N.; Locher, K.P. Cryo-EM structures reveal distinct mechanisms of inhibition of the human multidrug transporter ABCB1. Proc. Natl. Acad. Sci. USA 2020, 117, 26245–26253. [Google Scholar] [CrossRef] [PubMed]


| Nonlinear Kinetic Parameters | ||
| Vm (pmol/mg Protein/10 min) | Km (μM) | |
| Nonlinear regression | ||
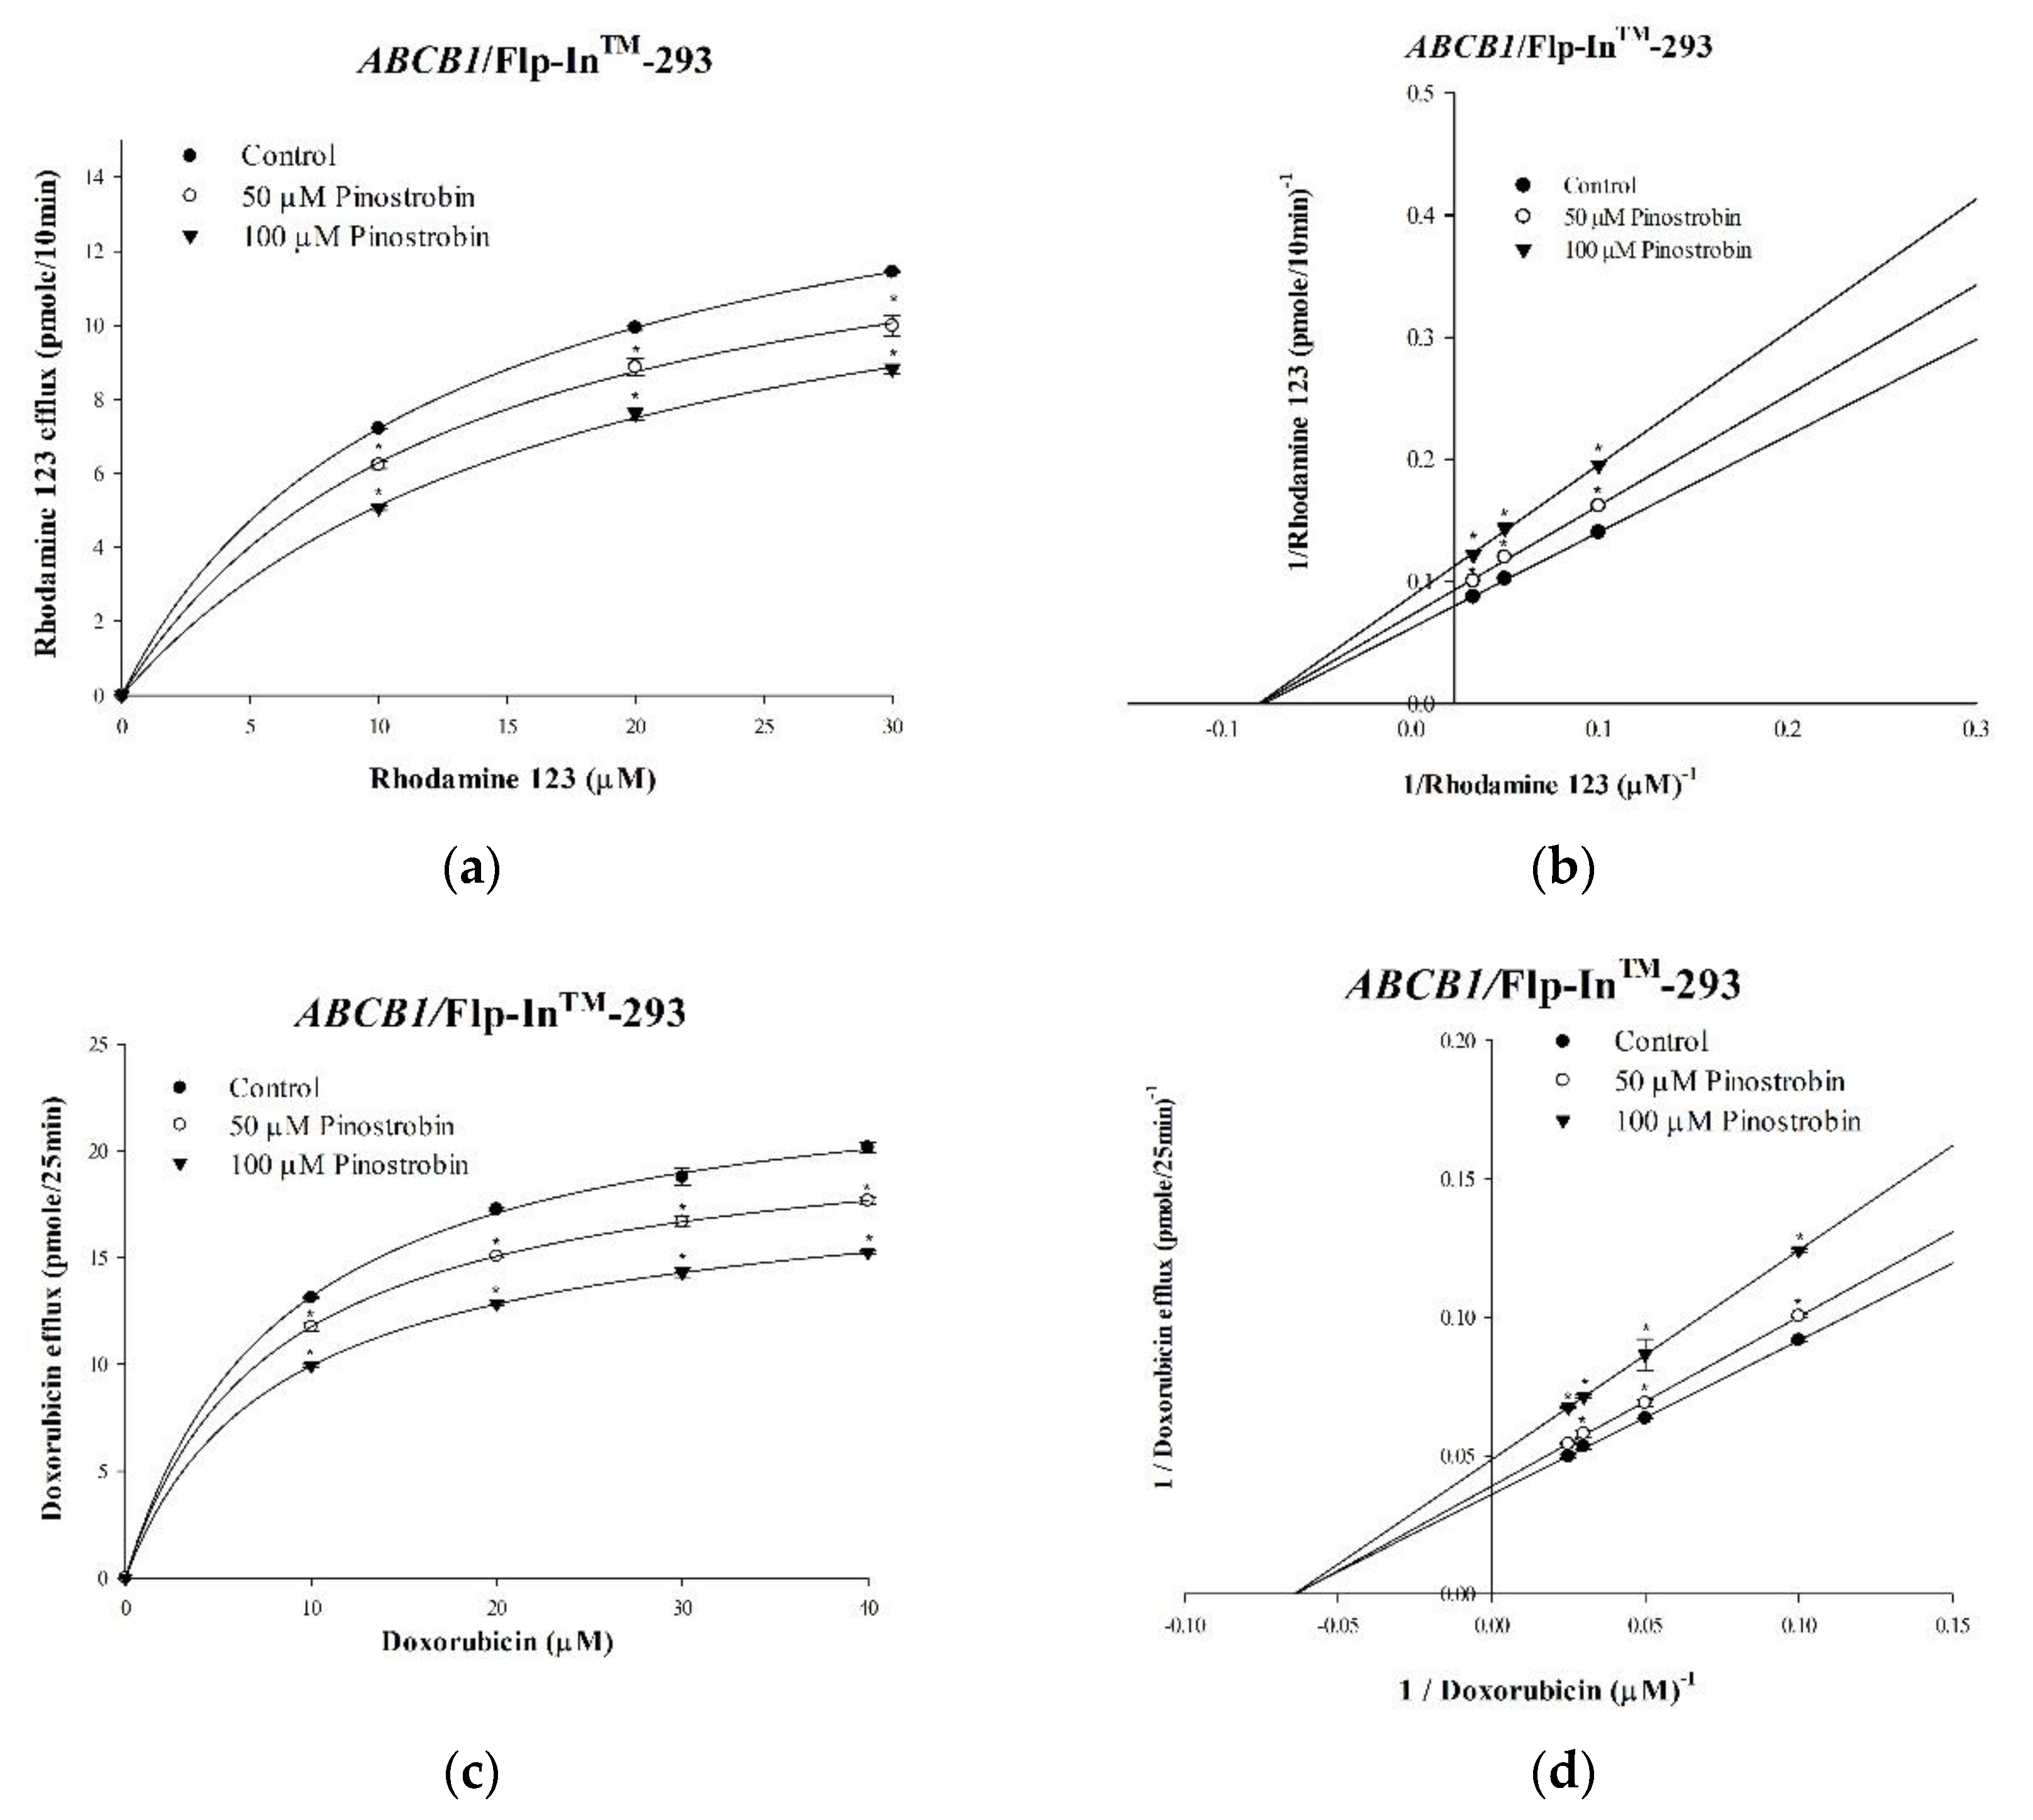
| Rhodamine 123 only | 16.27 ± 0.43 | 12.86 ± 0.78 |
| +50 μM Pinostrobin | 13.77 ± 0.29 * | 12.22 ± 0.50 |
| +100 μM Pinostrobin | 11.45 ± 0.15 * | 12.42 ± 0.24 |
| Vm (pmol/mg Protein/25 min) | Km (μM) | |
| Nonlinear regression | ||
| Doxorubicin only | 1.80 ± 0.06 | 0.06 ± 0.004 |
| +50 μM Pinostrobin | 1.63 ± 0.01 * | 0.06 ± 0.002 |
| +100 μM Pinostrobin | 1.32 ± 0.01 * | 0.06 ± 0.002 |
| Nonlinear Kinetic Parameters | ||
| Vm (pmol/mg Protein/10 min) | Km (μM) | |
| Nonlinear regression | ||
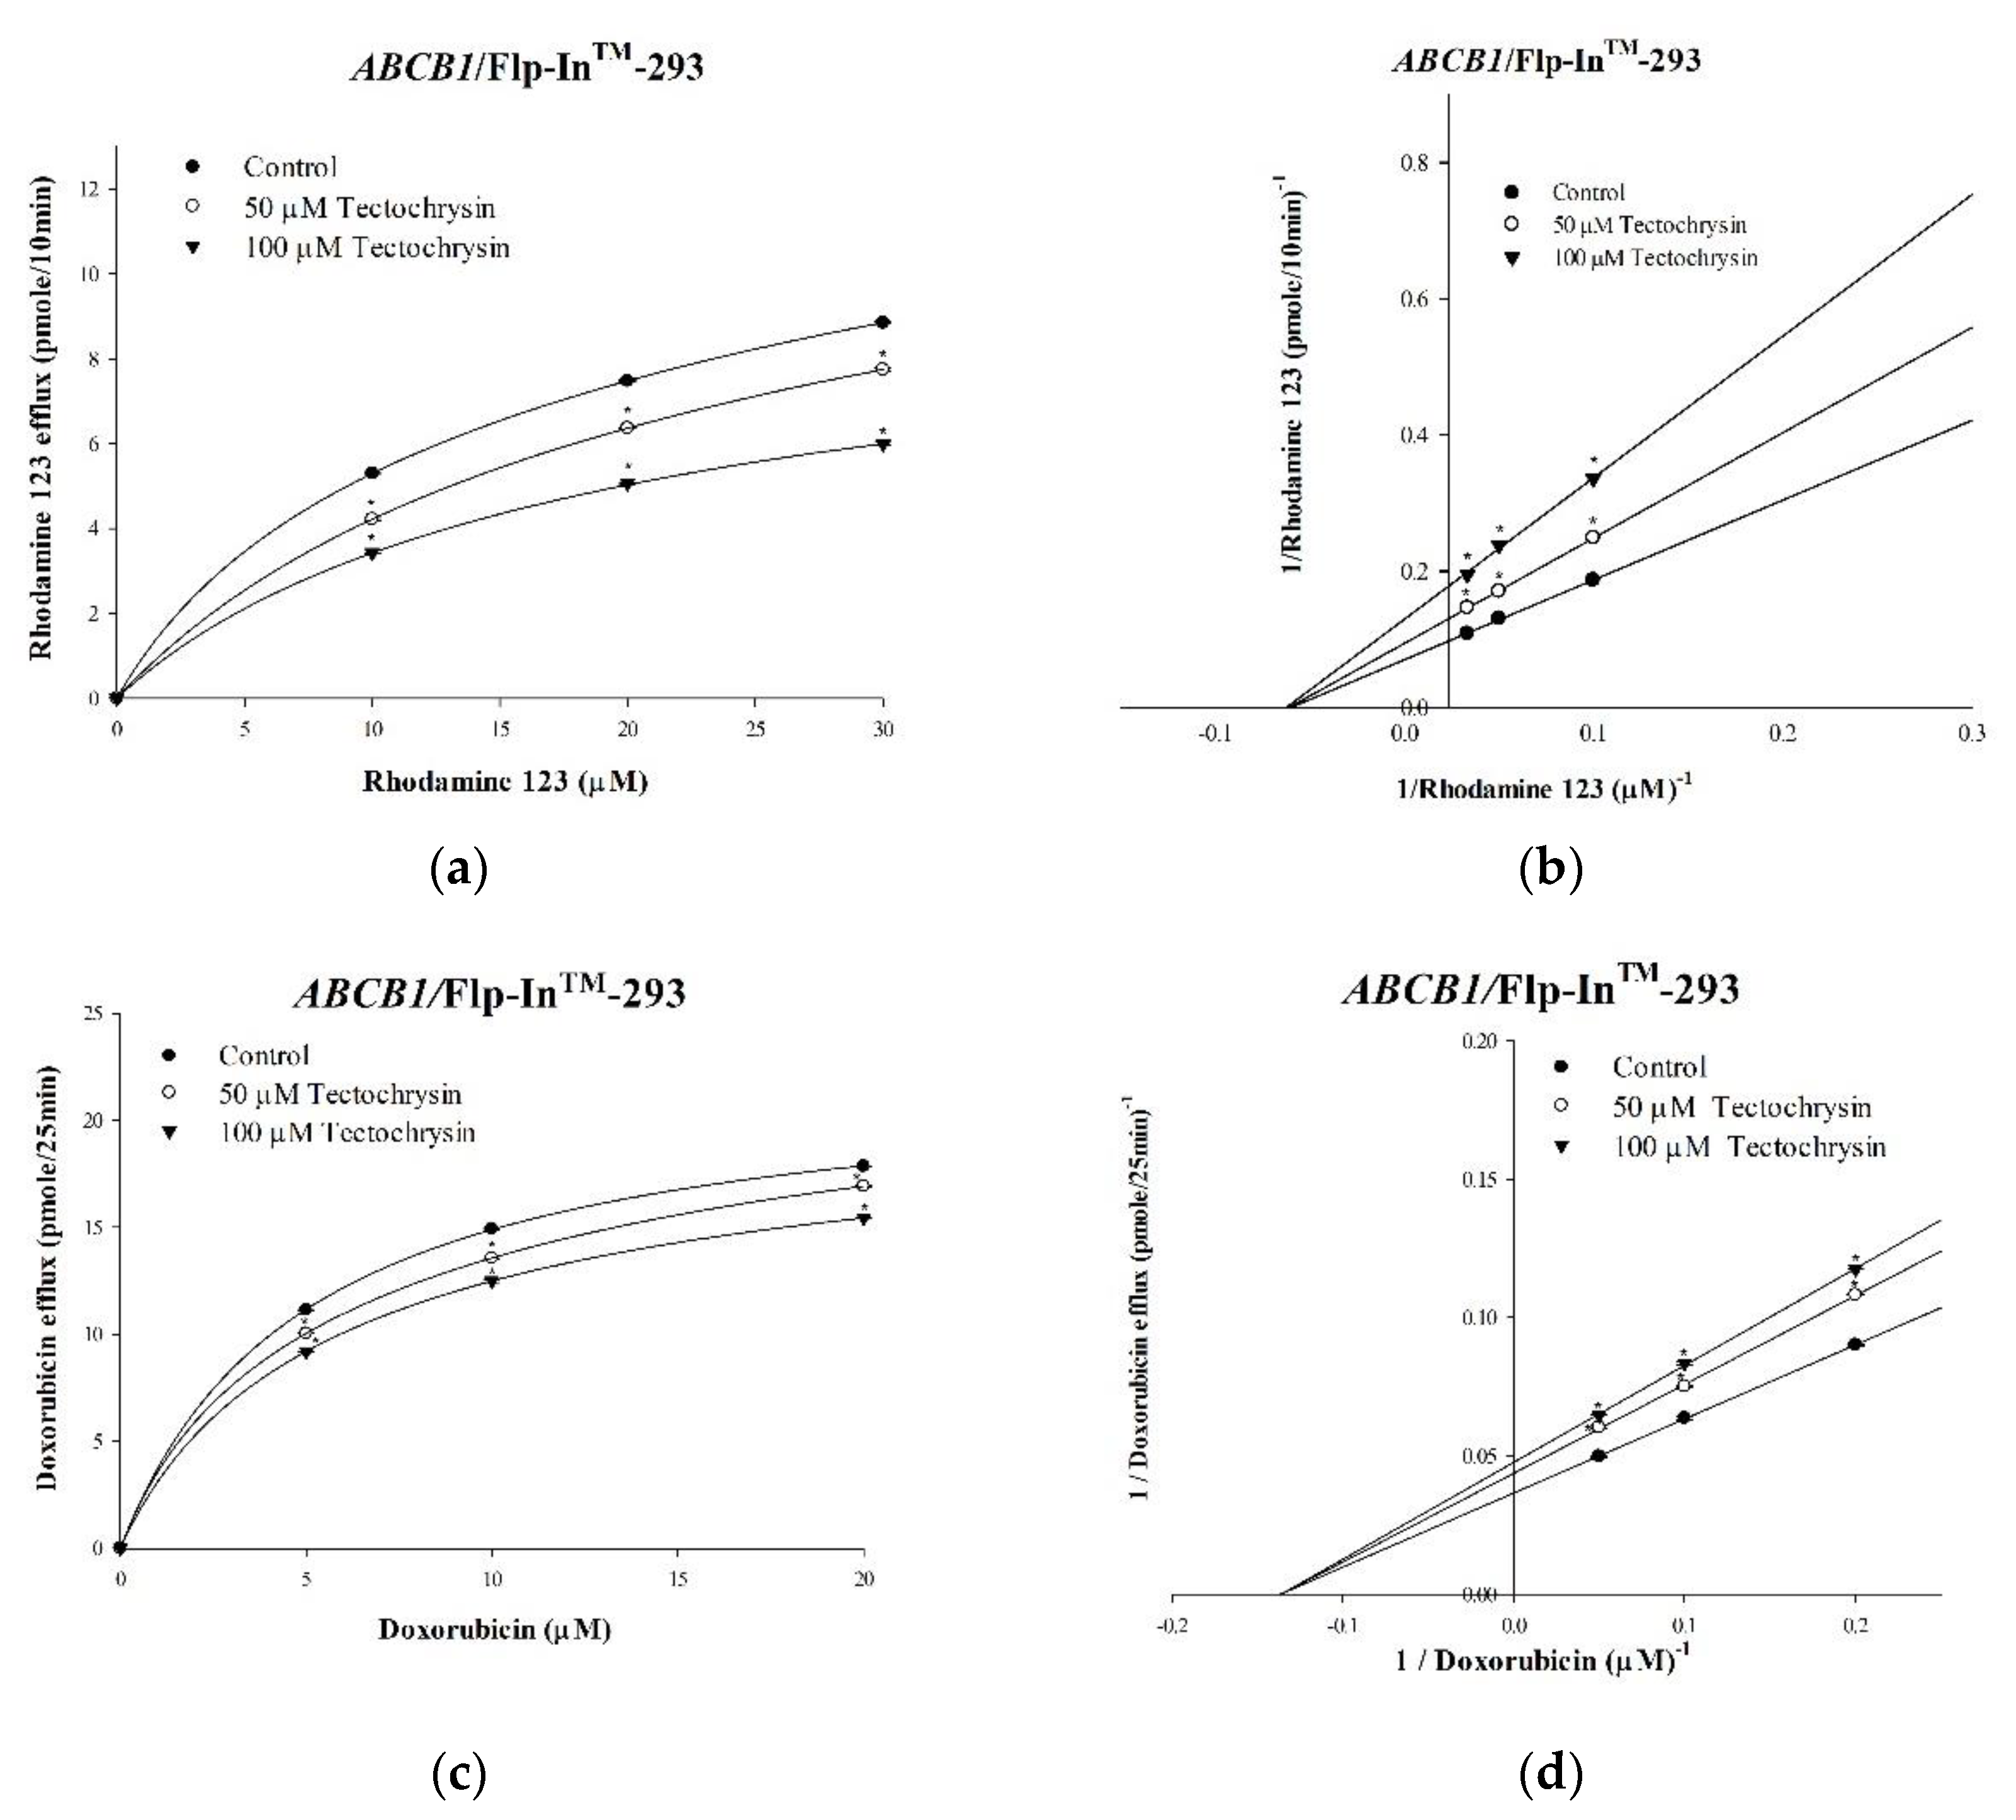
| Rhodamine 123 only | 14.8 ± 0.57 | 17.33 ± 0.70 |
| +50 μM Tectochrysin | 10.64 ± 0.15 * | 16.45 ± 0.47 |
| +100 μM Tectochrysin | 7.72 ± 0.11 * | 16.04 ± 0.53 |
| Vm (pmol/mg Protein/25 min) | Km (μM) | |
| Nonlinear regression | ||
| Doxorubicin only | 3.74 ± 0.04 | 0.14 ± 0.002 |
| +50 μM Tectochrysin | 3.12 ± 0.04 * | 0.14 ± 0.004 |
| +100 μM Tectochrysin | 2.85 ± 0.004 * | 0.14 ± 0.001 |
| Cell Lines | IC50 (μM) ± SE | |
|---|---|---|
| Pinostrobin | Tectochrysin | |
| Flp-In™-293 | 666.64 ± 7.01 | 281.58 ± 1.84 |
| ABCB1/Flp-In™-293 | 510.53 ± 4.85 | 242.17 ± 2.67 |
| HeLa S3 | 530.05 ± 12.37 | 207.37 ± 2.88 |
| KBvin | 623.59 ± 68.65 | 229.87 ± 2.05 |
| Treatment | HeLa S3 (Drug Sensitive) | KBvin (Resistant) | ||
|---|---|---|---|---|
| IC50 (nM) ± SE | RF | IC50 (nM) ± SE | RF | |
| Vincristine | 6.30 ± 0.07 | 2860.66 ± 24.65 | ||
| +50 μM Pinostrobin | 2.78 ± 0.03 * | 2.27 | 332.24 ± 5.60 * | 8.61 |
| +100 μM Pinostrobin | 0.95 ± 0.01 * | 6.63 | 252.03 ± 4.42 * | 11.35 |
| +50 μM Tectochrysin | 4.01 ± 0.03 * | 1.57 | 382.19 ± 17.63 * | 7.48 |
| +100 μM Tectochrysin | 2.38 ± 0.07 * | 2.65 | 149.66 ± 20.86 * | 19.11 |
| Paclitaxel | 10.36 ± 0.30 | 1178.73 ± 28.45 | ||
| +50 μM Pinostrobin | 7.11 ± 0.04 * | 1.46 | 217.94 ± 7.68 * | 5.41 |
| +100 μM Pinostrobin | 5.90 ± 0.10 * | 1.76 | 73.84 ± 1.16 * | 15.96 |
| +50 μM Tectochrysin | 8.74 ± 0.24 * | 1.19 | 202.09 ± 15.78 * | 5.83 |
| +100 μM Tectochrysin | 5.34 ± 0.09 | 1.94 | 60.23 ± 0.13 * | 19.57 |
| Docetaxel | 5.29 ± 0.07 | 267.33 ± 13.27 | ||
| +50 μM Pinostrobin | 2.17 ± 0.10 * | 2.44 | 18.90 ± 0.63 * | 14.14 |
| +100 μM Pinostrobin | 0.64 ± 0.02 * | 8.27 | 113.97 ± 0.69 * | 19.13 |
| +50 μM Tectochrysin | 3.29 ± 0.14 | 1.61 | 8.85 ± 0.41 * | 30.20 |
| +100 μM Tectochrysin | 0.61 ± 0.02 * | 8.64 | 3.25 ± 0.13 * | 82.26 |
| Treatment | Flp-In™-293 Cell (Parental) | ABCB1/Flp-In™-293 Cell (Resistant) | ||
|---|---|---|---|---|
| IC50 (nM) ± SE | RF | IC50 (nM) ± SE | RF | |
| Vincristine | 7.62 ± 0.11 | 855.97 ± 11.91 | ||
| +50 μM Pinostrobin | 1.09 ± 0.05 * | 6.99 | 98.93 ± 1.40 * | 8.65 |
| +100 μM Pinostrobin | 0.78 ± 0.02 * | 9.79 | 60.21 ± 0.98 * | 14.22 |
| +50 μM Tectochrysin | 3.95 ± 0.03 * | 1.93 | 91.71 ± 1.70 * | 9.33 |
| +100 μM Tectochrysin | 3.01 ± 0.12 * | 2.53 | 62.94 ± 0.67 * | 13.60 |
| Paclitaxel | 12.98 ± 1.72 | 850.14 ± 19.34 | ||
| +50 μM Pinostrobin | 6.87 ± 0.12 | 1.89 | 231.67 ± 10.05 * | 3.67 |
| +100 μM Pinostrobin | 5.69 ± 0.07 | 2.28 | 41.70 ± 1.76 * | 20.39 |
| +50 μM Tectochrysin | 7.86 ± 0.14 | 1.65 | 90.79 ± 1.91 * | 9.36 |
| +100 μM Tectochrysin | 7.32 ± 0.17 | 1.77 | 68.59 ± 1.57 * | 12.39 |
| Docetaxel | 6.92 ± 0.12 | 140.86 ± 11.60 | ||
| +50 μM Pinostrobin | 5.15 ± 0.17 * | 1.34 | 22.47 ± 1.00 * | 6.27 |
| +100 μM Pinostrobin | 1.40 ± 0.14 * | 4.95 | 3.96 ± 0.24 * | 35.61 |
| +50 μM Tectochrysin | 5.61 ± 0.34 * | 1.23 | 6.83 ± 0.11 * | 20.64 |
| +100 μM Tectochrysin | 3.39 ± 0.30 * | 2.04 | 5.35 ± 0.08 * | 26.32 |
| Pinostrobin | [Vincristine] | Fraction Affected (Fa) | Combination Index (CI) | Drug Interaction Description |
|---|---|---|---|---|
| 50 μM | 1000 nM | 0.098 | 0.132 | Strong synergism |
| 100 nM | 0.630 | 0.228 | Strong synergism | |
| 100 μM | 1000 nM | 0.049 | 0.092 | Very Strong Synergism |
| 100 nM | 0.599 | 0.355 | Synergism | |
| Pinostrobin | [Paclitaxel] | Fraction affected (Fa) | Combination index (CI) | Drug interaction description |
| 50 μM | 100 nM | 0.574 | 0.217 | Strong synergism |
| 10 nM | 0.740 | 0.336 | Synergism | |
| 100 μM | 100 nM | 0.432 | 0181 | Strong synergism |
| 10 nM | 0.51 | 0.405 | Synergism | |
| Pinostrobin | [Docetaxel] | Fraction affected (Fa) | Combination index (CI) | Drug interaction description |
| 50 μM | 100 nM | 0.026 | 0.093 | Very Strong Synergism |
| 10 nM | 0.540 | 0.197 | Strong synergism | |
| 100 μM | 100 nM | 0.300 | 0.523 | Synergism |
| 10 nM | 0.505 | 0.275 | Strong synergism |
| Tectochrysin | [Vincristine] | Fraction Affected (Fa) | Combination Index (CI) | Drug Interaction Description |
|---|---|---|---|---|
| 50 μM | 1000 nM | 0.126 | 0.215 | Strong synergism |
| 100 nM | 0.684 | 0.389 | Synergism | |
| 100 μM | 1000 nM | 0.046 | 0.160 | Strong synergism |
| 100 nM | 0.578 | 0.560 | Synergism | |
| Tectochrysin | [Paclitaxel] | Fraction affected (Fa) | Combination index (CI) | Drug interaction description |
| 50 μM | 100 nM | 0.594 | 0.357 | Synergism |
| 10 nM | 0.895 | 0.839 | Moderate synergism | |
| 100 μM | 100 nM | 0.292 | 0.277 | Strong synergism |
| 10 nM | 0.763 | 0.859 | Strong synergism | |
| Tectochrysin | [Docetaxel] | Fraction affected (Fa) | Combination index (CI) | Drug interaction description |
| 50 μM | 100 nM | 0.008 | 0.061 | Very Strong Synergism |
| 10 nM | 0.483 | 0.277 | Strong synergism | |
| 100 μM | 100 nM | 0.001 | 0.023 | Very Strong Synergism |
| 10 nM | 0.125 | 0.169 | Strong synergism |
| Lowest Binding Energy (kcal/mol) | Mean Binding Energy (kcal/mol) | predKi | Td | CR | Number of Runs in 1st Cluster | Amino Acids Involved in Interactions | Amino Acids Involved in H-Bonds | |
|---|---|---|---|---|---|---|---|---|
| Pinostrobin | −8.26 | −8.07 | 882.38 nM | 2 | 11 | 10 | Clr1302, Cys956, Gly955, Ile864, Leu860, Leu861, Met948, Phe951, Ser119, Ser952 | None |
| Tectochrysin | −8.17 | −7.98 | 1.03 μM | 2 | 7 | 9 | Ala954, Clr1302, Cys956, Gly955, Ile864, Leu860, Leu861, Met948, Phe951, Ser119, Ser952 | None |
| Verapamil | −5.57 | −3.21 | 82.19 μM | 17 | 29 | 4 | Ala987, Gln725, Gln990, Ile306, Met986, Phe728, Phe983, Tyr307, Tyr310 | None |
Disclaimer/Publisher’s Note: The statements, opinions and data contained in all publications are solely those of the individual author(s) and contributor(s) and not of MDPI and/or the editor(s). MDPI and/or the editor(s) disclaim responsibility for any injury to people or property resulting from any ideas, methods, instructions or products referred to in the content. |
© 2023 by the authors. Licensee MDPI, Basel, Switzerland. This article is an open access article distributed under the terms and conditions of the Creative Commons Attribution (CC BY) license (https://creativecommons.org/licenses/by/4.0/).
Share and Cite
Wu, I.-T.; Kuo, C.-Y.; Su, C.-H.; Lan, Y.-H.; Hung, C.-C. Pinostrobin and Tectochrysin Conquer Multidrug-Resistant Cancer Cells via Inhibiting P-Glycoprotein ATPase. Pharmaceuticals 2023, 16, 205. https://doi.org/10.3390/ph16020205
Wu I-T, Kuo C-Y, Su C-H, Lan Y-H, Hung C-C. Pinostrobin and Tectochrysin Conquer Multidrug-Resistant Cancer Cells via Inhibiting P-Glycoprotein ATPase. Pharmaceuticals. 2023; 16(2):205. https://doi.org/10.3390/ph16020205
Chicago/Turabian StyleWu, I-Ting, Chan-Yen Kuo, Ching-Hui Su, Yu-Hsuan Lan, and Chin-Chuan Hung. 2023. "Pinostrobin and Tectochrysin Conquer Multidrug-Resistant Cancer Cells via Inhibiting P-Glycoprotein ATPase" Pharmaceuticals 16, no. 2: 205. https://doi.org/10.3390/ph16020205
APA StyleWu, I.-T., Kuo, C.-Y., Su, C.-H., Lan, Y.-H., & Hung, C.-C. (2023). Pinostrobin and Tectochrysin Conquer Multidrug-Resistant Cancer Cells via Inhibiting P-Glycoprotein ATPase. Pharmaceuticals, 16(2), 205. https://doi.org/10.3390/ph16020205