Abstract
Micromarks were formed in bulk natural IaAB-type diamond laser-inscribed by 515 nm 0.3 ps femtosecond laser pulses focused by a 0.25 NA micro-objective at variable pulse energies in sub-picosecond visible-range laser regimes. These micromarks were characterized at room temperature (25 °C) by stationary 3D confocal photoluminescence (PL) microspectroscopy at 405 nm and 532 nm excitation wavelengths. The acquired PL spectra exhibit the increasing pulse-energy-dependent yield in the range of 550–750 nm (NV0, NV− centers) at the expense of the simultaneous reciprocal reduction in the blue–green (490–570 nm, H-band centers) PL yield. The detailed analysis indicates low-energy intensity rise for H-band centers as an intermediate product of vacancy-mediated dissociation of B1 and B2 centers, with H4 centers converting to H3 and NV centers at higher pulse energies, while the laser exposure effect demonstrates the same trend. These results will help solve the problem of direct laser writing technology, which is associated with the writing of micromarks in bulk natural diamond, and promising three-dimensional micro-electrooptical and photonic devices in physics and electronics.
1. Introduction
Natural diamonds are cut and produced in a variety of shapes, sizes, and geometries to suit a wide consumer base. Their rising demand and greater value compared to other gems have culminated in the invention of track-and-trace procedures to avoid counterfeiting and to improve sustainability by modern photoluminescent QR-code technologies [1,2,3]. Laser-based micro-processing has allowed the precise production of various microstructures, not only at the surface but also in the bulk of different transparent materials including the diamonds [4,5,6,7,8]. However, many basic physical questions concerning the appearance and growth of diamonds still require deeper investigation. One of the primary challenges is the huge variety of diamond types, which implies dramatically different initial distribution of nitrogen impurities. This feature of diamond processing complicates prediction of the results of laser irradiation and makes it difficult to create a universal marking technology. The wide range of examination methods (optical, IR, Raman, and ESR) complicates quantitative characterization of impurities due to nitrogen’s ability to be in many aggregation forms. Additionally, nitrogen can be combined with defects (substitutional atoms, vacancies, and clusters) in a variety of optical centers, which changes the absorption band of the whole crystal [9].
Another problem during laser irradiation is the photochemical changes induced directly in the nitrogen centers and related dissociation or activation processes [8,10]. The solution to such a problem is detailed initial characterization of the naturally present low- and highly aggregated nitrogen centers and their comprehensive post-irradiation 3D-scanning photoluminescence spectral analysis [10,11,12,13,14].
In this research, we report on PL studies on pulse energy- and exposure-dependent transformation of highly aggregated nitrogen centers into low-aggregated nitrogen centers in the bulk of natural IaAB-type diamond photoexcited by sub-picosecond visible-range laser pulses.
2. Materials and Methods
The experimental sample was a colorless natural high-nitrogen IaAB-type octahedral diamond crystal (r = 2.3 mm) possessing the average impurity concentrations of [A(2N)] ~ 175 ppm, [B1(4NV)] ~ s360 ppm, and [B2] (platelets) = 8.34/1365 cm−1 (Figure 1a) characterized by spectrometer Vertex V-70 (Bruker, Billerica, MA, USA) and optical transmission spectroscopy (SF–2000, OKB Spektr, Saint Petersburg, Russia), which indicates its high visible range (400–650 nm) absorption (Figure 1b). These spectral observations are supported by room-temperature (25 °C) 3D-scanning confocal Raman/PL microspectroscopy (inVia InSpect, Renishaw, UK) of the initial diamond and laser-induced photoluminescent micromarks at 405 nm and 532 nm laser excitation (Confotec MR350, SOL instruments, Minsk, Belarus) (Figure 1c). In the first case, PL spectra acquired with 405 nm laser excitation include several sharp peaks (N3 with ZPL at 415 nm, a 1332 cm−1 Raman signal of the diamond lattice at 428 nm, and some 1755 cm−1 peaks apparently caused by ion implantation during the growth process [15]), and a broad band in the range from 450 to 550 nm. This band includes centers N3a (ZPL at 460 nm), N3b (ZPL at 540 nm) [15,16] based on N3 center and the complex of nitrogen aggregations of H4(4N2V) and H3(2NV) centers (ZPL at 496 nm and 503 nm, accordingly) [15,17]. In the second case, the characteristic Raman (573 nm), an NV° band with its ZPL at 575 nm, and an NV− band with its ZPL at 637 nm are excited by the 532 nm laser [15,18].
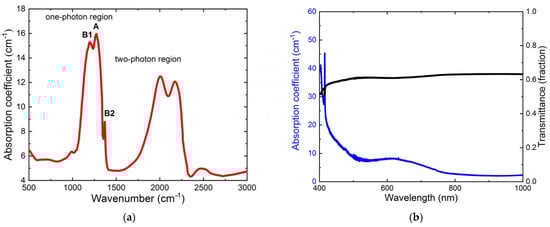
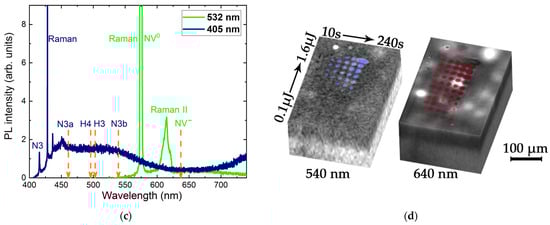
Figure 1.
(a) Spectral characterization of the initial diamond sample: FT-IR spectrum (spectral assignment after); (b) visible transmission spectrum; (c) PL spectra at 405 nm and 532 nm laser excitation; (d) 3D-confocal image of micromarks array in PL spectra of the diamond (540 nm and 640 nm).
Laser exposure was performed using a Satsuma laser workstation (Amplitude Systemes, Paris, France), described elsewhere [13,14], in a number of patterns by a series of 515 nm, 300 fs pulses, focused by a 0.25 NA micro-objective into the diamond at depth z ~ 125 µm. The repetition rate was 100 kHz and exposure varied for 10, 30, 60, 120, and 240 s. Pulse energy changed in micromark-making regimes (0.1–1.6 µJ) (Figure 1d).
3. Results
3.1. PL Spectra at 532 nm Laser Photoexcitation
During diamond scanning, the contribution of the microscope confocal parameter takes place, which appears in a change in Raman signal intensity while going deeper into the sample (Figure 2a). To neglect it, the intensity of the entire spectrum at a specific depth was corrected depending on the peak intensity of the Raman line at that depth, which results in a straight Raman line (“corrected” in Figure 2a) in the bulk of the diamond. Thus, the Raman line served as the internal standard and allowed us to compare the obtained spectra from all depths. Separate normalization was carried out for both 405 nm and 532 nm laser excitation.
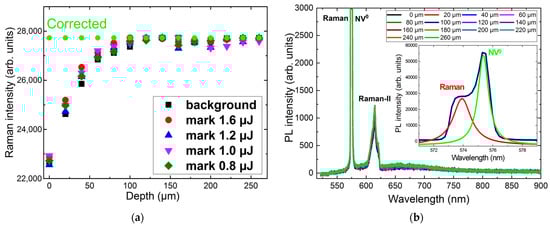
Figure 2.
(a) Raman line intensity dependence on depth z (µm) for different incident 0.3 ps laser pulse energies (µJ); (b) 532 nm excitation PL spectra of unexposed diamond at different depths inside the sample.
The obtained spectra indicate a weak structureless composition of NV0 and NV− bands (Figure 2b) with their almost constant intensity, regardless of the probing depth of 0–260 µm inside the sample.
Figure 3 shows that NV− ZPL appears only in the PL spectra of the micromarks (even for low energy (Figure 3b)) but not for the background (Figure 2b) despite the fact that NV0 appears in both cases. These may indicate some lability of vacancies and possible ionization of the NV center to NV0 ones (Figure 2b and Figure 3a,b).
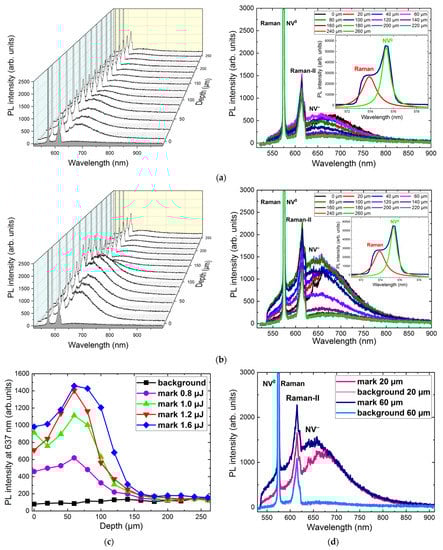
Figure 3.
The 532 nm excitation PL spectra at different depths inside the sample for different pulse energies: 0.8 µJ (a), 1.6 µJ; (b) (spectral assignment after; grey color indicates initial spectra of the diamond, τ = 0.3 ps, exposure for 240 s (24M pulses)); (c) intensity at NV− band (~637 nm) versus depth; (d) 532 nm PL spectra of the background (initial diamond) and micromarks (irradiated diamond) at different depths (20 and 60 µm) (irradiation: 240 s exposure time (24M pulses), 0.3 ps, laser pulse energy—1.6 µJ; spectral assignment after).
Photoluminescence excited by 532 nm is mostly concentrated in a small subsurface area (0–150 µm, that can be named the “mark-zone”) without changing the remaining bulk. The transformation of NV centers in that zone with different energies of irradiation (Figure 3a,b) show that two characteristic levels are formed, – 20 µm and 60 µm, which are caused by small (subsurface) and high (depth) contribution (Figure 3d). Additionally, in Figure 3d, we can see a wide NV band, 650–690 nm (that goes after NV− ZPL and reaches its maximum at 660 nm) [15,16,17,18,19]. Figure 4 shows the intensity of this band with different energies of irradiation at different depths. It can be seen that the near-surface area (<100 µm) is modified significantly, whereas the remaining diamond (z > 160 µm) stays almost unmodified. Micromarks formed with high-energy processes (more than 1 µJ) have almost constant brightness in all “mark-zones”, which indicates saturation of the NV formation process.
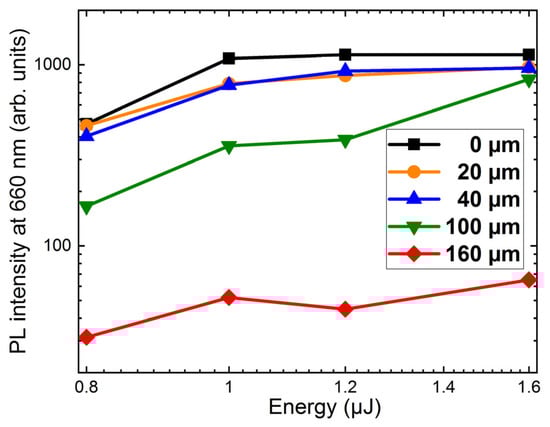
Figure 4.
Peak intensity of NV band at 660 nm at different depths versus incident 0.3 ps laser pulse energy.
3.2. PL Spectra at 405 nm Photoexcitation
PL with blue excitation (405 nm) was used to expand the spectral range and to study the other optical centers. Confocal correction was also performed (Figure 5).
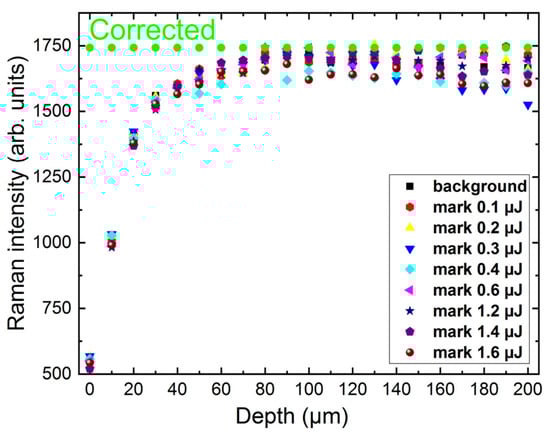
Figure 5.
Dependence on depth z (µm) for different incident pulse energies at Raman ~ 428 nm.
Unlike the previous case, blue excitation of PL indicates dramatic spatial and spectral variation of the PL yield of unmodified diamond (Figure 6a), which is caused by the spatial variation in the optical-center distribution inside the diamond [20,21,22,23,24,25].
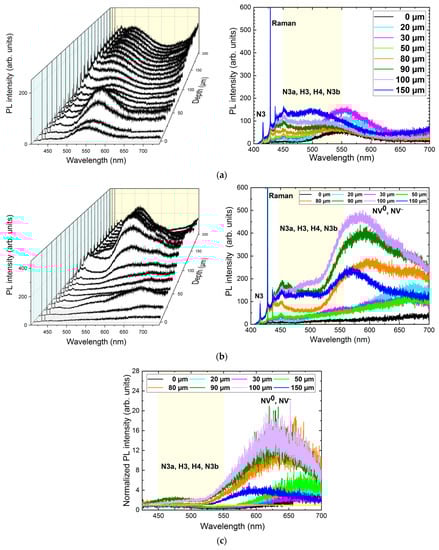
Figure 6.
The 405 nm excitation PL spectra of the background (a); micromarks (b); their normalized intensity (c) at different depths inside the sample (irradiation: 240 s exposure time (24M pulses), 0.3 ps, laser pulse energy—1.6 µJ; spectral assignment after).
Irradiation of the diamond also changes this distribution (Figure 6) and shows a layer with an increased number of H3, H4, N3a, N3b, NV0, and NV− nitrogen centers [15,16,17,18,19] at some depth under the diamond surface (80–100 µm) where the focal plane was. The different distribution of absorbed energy is due to different absorption mechanisms. In the subsurface layer, weak multi-photon absorption takes place (Figure 7a), whereas the closer to the center of the focal spot, the higher the absorption becomes (Figure 7b–f).
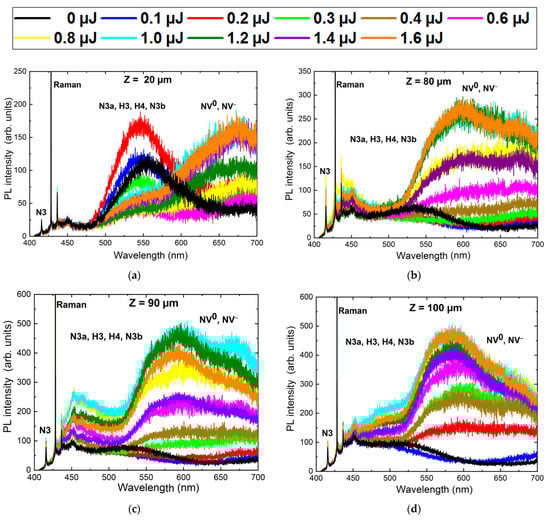
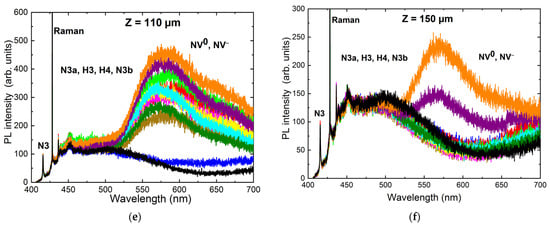
Figure 7.
The 405 nm PL spectra of the micromarks at the 20 µm (a), 80 µm (b), 90 µm (c), 100 µm (d), 110 µm (e), and 150 µm (f) depths for 240 s exposure time (24M pulses) and the different incident 0.3 ps laser pulse energies (µJ).
Low energies of irradiation weakly influence the NV band but, as energy rises to 1.6 µJ, its concentration grows at any depth. At the PL spectrum, a wide H-band can be seen; this is located at 450–600 nm and can be formed by simultaneous contribution of many optical centers (H4–496 nm, H3–503 nm, N3a–461 nm, N3b–540 nm) [15,16,17,18,19,20,22,23,24,25].
N3a and N3b centers are produced not from the initial N3 that remains stable (as can be seen in Figure 8) but from the B2 center [15,16]. The N3b center does not have a sharp maximum and should be considered together with H3 and H4.
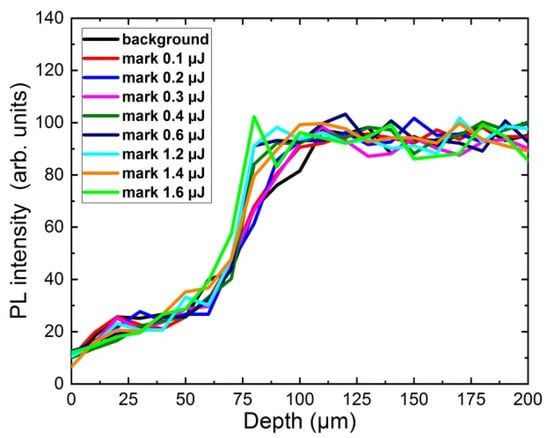
Figure 8.
Dependence on depth z (µm) for different incident pulse energies at N3 ~ 415 nm center.
At higher energies, two bands—one-for the H-band (max at 550 nm) and the second for the NV band (max at 660 nm)—are joined into the common one located near the focal plane (Figure 7b–e).
In general, a comparison between 532 nm and 405 nm excitations helps to understand the dynamics of the involved optical centers. There are four main PL maximums which show the impact of specific optical centers: 475, 525, 580, and 650 nm.
As can be seen in Figure 9a,b, these maximums are located at some depth in the bulk and elongate differently depending on energy. A rise in PL intensity in optical centers (caused by laser irradiation) becomes a micromark. Geometrically, the area where the PL intensity exceeds the background level is written as the micromark (Figure 9c).
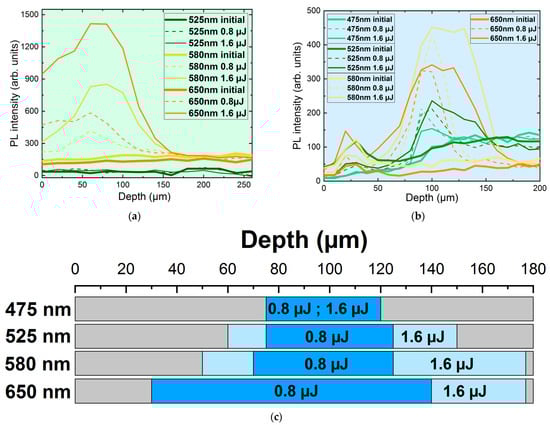
Figure 9.
The 532 nm peak intensity at 525, 580, and 650 nm (a) and 405 nm peak intensity at 475, 525, 580, and 650 nm (b) at different depths versus incident 0.3 ps laser pulse energy; (c) the dimensions of micromarks at different energies.
Their dimensions are as follows:
- A maximum at 475 nm is mainly influenced by N3a center, with a 405 nm excitation micromark appearing at 75 µm and ending up at ~120 µm both for 0.8 and 1.6 µJ;
- At 525 nm (which is mainly influenced by H4 and H3 and secondly by N3a), the micromark for 1.6 µJ starts from 60 µm and ends at 150 µm and, for 0.8 µJ, starts from 75 µm and ends at 125 µm;
- A maximum of 580 nm (which is mainly influenced by N3b and NV0 and secondly by N3a, H4, and H3) can be seen in the 405 nm excitation. At 405 nm, the micromark for 1.6 µJ starts from 50 µm and ends at 177 µm and, for 0.8 µJ, starts at 70 µm and ends at 125 µm;
- The 650 nm maximum (which is mainly influenced by NV− and secondly by N3a, H4, H3, N3b, and NV0) can be seen both for 405 nm. The micromark starts at 30 µm for both 0.8 and 1.6 µJ and ends at 140 µm for 0.8 µJ and at 177 µm for 1.6 µJ.
Some dependencies can be seen from Figure 9c. The smaller the number of optical centers involved in maximum formation, the smaller its dimension. Additionally, it can be seen that smaller energies form micromarks closer to the focal plane, and with energy growth, the micromark grows more in depth than to the surface.
Figure 10 shows up maximum PL intensity in the micromark. It can be seen that a rise of energy slightly changes the brightness of the micromark, which stays almost linear with minor deviations (Figure 10a). In contrast, a change in exposure greatly increases micromark brightness (Figure 10b). A threshold can be seen at ≈ 60 s with the saturation plateau after it (at 120–240 s).
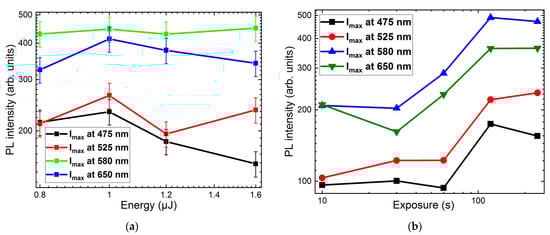
Figure 10.
(a) Peak intensity in the micromark at different energies and (b) maximum of PL intensity spectra acquired in the micromark at 475, 525, 580 and 650 nm at different laser exposures (405 nm, 1–24 M pulses, pulse energy—1.6 µJ).
4. Discussion
While the 532 nm PL studies exhibit just a general rise in NV centers in the micromarks, 405 nm PL spectral acquisition indicates much more complex structural transformations of nitrogen centers, involving N3a, H3, H4, and N3b ones.
The micromarks appear to be spectrally contrasted in PL spectra at the 405 nm laser excitation due to ultrashort-pulse laser-induced microstructural modification in the diamond and consist of two levels: subsurface layer (caused by two-photon absorption) and deep layer (caused by maximum intensity in the focal plane) [26,27]. These levels have different energy absorbances, which results in different chemical processes. A lower absorbed energy causes a decrease in H3 and H4 with mutual rise in the NV band (vacancy-driven detachment). Closer to the focal plane in the bulk of the diamond, high-energy processes result in common PL intensity rise (high-energy dissociation and vacancy-driven nitrogen detachment) [28,29,30,31].
Modifications of the present A, N3, B1, and B2 centers could be assigned to the following low-energy aggregative, high-energy dissociative, and vacancy-driven splitting transformations (1)–(3).
Low-energy aggregation
High-energy dissociation
Vacancy-driven nitrogen detachment
Here, according to our experimental data in Section 3.2, low-energy fs-laser irradiation promotes the dissociation of nitrogen centers until H3 and H4 [22]. The consumption of N3 centers for interaction with the B2 centers results in red-shifted PL spectral appearances of N3a (ZPL at 461 nm) and of N3b (ZPL at 540 nm) [15,16]. Simultaneously, N3a centers appear at higher concentrations in these conditions due to an enhanced yield of N3 centers, both free and interacting with B2 centers. However, their “after-transformation” concentration remains stable due to high-productive aggregation of “A+NV” that fully compensates N3 dissociation.
The spectral structure of the phonon-assisted band of the N3a center is very similar to that of the N3 center [15,16,18,19]. The N3b center observed in natural diamonds containing the N3 and B2 centers and this center is tentatively attributed to the N3 centers localized in the proximity of the B2 aggregates, where the diamond bandgap becomes narrower, shifting the energy of the bottom of the conduction band below the N3 excited state. Thus, the N3b transition occurs between the N3 center ground state and the bottom of the conduction band [15,16,19]. The consumption of N3 centers for N3a and N3b is compensated for by N3 generation caused by A-center aggregation with NV.
In addition, at higher fs-laser pulse energies, similarly to high-temperature treatment (>2300 °C [15,16,23]), some parallel processes can occur: first, generation of H3 and H4 proceeds cooperatively with generation of NV, N3a, and N3b; second, H4 dissociation also occurs (H4 → 2H3; H4 → N3 + NV).
5. Conclusions
In conclusion, multi-shot 0.3 ps, 515 nm laser inscription inside the bulk of natural IaAB-type diamond with pulses focused by 0.25 NA micro-objective at the 125-micron depth, allowed us to form a bulk array of photoluminescent micromarks at variable laser exposures and pulse energies. Their length and brightness can be controlled with irradiation parameters. In addition, these micromarks were characterized by stationary 3D confocal photoluminescence (PL) microspectroscopy at 405 and 532 nm excitation wavelengths. The micromarks appear to be spectrally contrasted in PL spectra at the 405 nm laser excitation due to ultrashort-pulse laser-induced structural modification in the diamond, occurring in fs-laser pulse energy-dependent conditions. At low fs-laser pulse energies, the dissociation of nitrogen centers occurs until H3 and H4; also, N3a centers appear at higher concentrations at these conditions due to an enhanced yield of N3 centers, both free and interacting with B2 centers. However, at higher fs-laser pulse energies, some parallel processes can occur: first, generation of H3 and H4 proceeds cooperatively with generation of NV, N3a, and N3b; second, H4 dissociation also occurs (H4 → 2H3; H4 → N3 + NV). Despite consumption of N3 to produce N3a and N3b centers, its concentration in the micromark remains constant, which means that some reactions of N3 production are also involved.
The identified ultrashort-pulse laser exposure regimes and anticipated underlying laser-induced structural transformations in the natural diamond open up new technological opportunities in diamond photonics and micromachining.
Author Contributions
Conceptualization, G.K.; Data curation, E.R. and R.K.; Formal analysis, N.R. and J.C.; Funding acquisition, S.K.; Investigation, E.K., P.D. and R.K.; Methodology, G.K. and R.K.; Project administration, S.K.; Resources, G.K.; Software, E.K. and J.C.; Supervision, S.K. and E.R.; Validation, P.D.; Visualization, E.K., A.K. and N.R.; Writing—original draft, E.K. and E.R.; Writing—review and editing, E.R., S.K. and G.K. All authors have read and agreed to the published version of the manuscript.
Funding
This research was funded by Russian Science Foundation, grant number 21-79-30063.
Institutional Review Board Statement
Not applicable.
Informed Consent Statement
Not applicable.
Data Availability Statement
The data supporting the reported results can be obtained from the authors.
Acknowledgments
The authors acknowledge useful discussions with Victor Vins. The experimental samples were provided by Geology Faculty of Moscow State University (G.K.).
Conflicts of Interest
The authors declare no conflict of interest.
References
- Chen, Y.C.; Salter, P.S.; Knauer, S.; Weng, L.; Frangeskou, A.C.; Stephen, C.J.; Ishmael, S.N.; Dolan, P.R.; Jonson, S.; Green, B.L.; et al. Laser writing of coherent colour centres in diamond. Nat. Photonics 2017, 11, 77–80. [Google Scholar] [CrossRef]
- Bharadwaj, V.; Jedrkiewicz, O.; Hadden, J.P.; Sotillo, B.; Vazquez, M.R.; Dentella, P.; Fernandezm, T.T.; Chiappini, A.; Giakoumaki, A.N.; Le Phu, T.; et al. Femtosecond laser written photonic and microfluidic circuits in diamond. J. Phys. Photonics 2019, 1, 022001. [Google Scholar] [CrossRef]
- Sotillo, B.; Bharadwaj, V.; Hadden, J.P.; Sakakura, M.; Chiappini, A.; Fernandez, T.T.; Longhi, S.; Jedrkiewicz, O.; Shimotsuma, Y.; Criante, L.; et al. Diamond photonics platform enabled by femtosecond laser writing. Sci. Rep. 2016, 6, 35566. [Google Scholar] [CrossRef] [PubMed]
- Dischler, B. Handbook of Spectral Lines in Diamond; Springer: Berlin, Germany, 2012. [Google Scholar]
- Behrens, H.; Janecke, J.; Schopper, H.; Landolt, H.H.; Bornstein, R. Landolt-Bornstein: Numerical Data and Functional Relationships in Science and Technology; Springer: Berlin, Germany, 1969. [Google Scholar]
- Ionin, A.A.; Kudryashov, S.I.; Smirnov, N.A.; Danilov, P.A.; Levchenko, A.O. Method for Creating and Detecting an Optically Permeable Image Inside a Diamond. U.S. Patent US20210316401A1, 14 October 2021. [Google Scholar]
- Sotillo, B.; Bharadwaj, V.; Hadden, J.P.; Rampini, S.; Chiappini, A.; Fernandez, T.T.; Armellini, C.; Serpengüzel, A.; Ferrari, M.; Barclay, P.E.; et al. Visible to infrared diamond photonics enabled by focused femtosecond laser pulses. Micromachines 2017, 8, 60. [Google Scholar] [CrossRef]
- Chen, Y.C.; Griffiths, B.; Weng, L.; Nicley, S.S.; Ishmael, S.N.; Lekhai, Y.; Johnson, S.; Stephen, C.J.; Green, B.L.; Morley, G.W.; et al. Laser writing of individual nitrogen-vacancy defects in diamond with near-unity yield. Optica 2019, 6, 662–667. [Google Scholar] [CrossRef]
- Hayes, W.; Stoneham, A.M. Defects and Defect Processes in Nonmetallic Solids; Dover: New York, NY, USA, 1985. [Google Scholar]
- Kudryashov, S.I.; Khmelnitskii, R.A.; Danilov, P.A.; Smirnov, N.A.; Levchenko, A.O.; Kovalchuk, O.E.; Uspenskaya, M.V.; Oleynichuk, E.A.; Kovalev, M.S. Broadband and fine-structured luminescence in diamond facilitated by femtosecond laser driven electron impact and injection of “vacancy-interstitial” pairs. Opt. Lett. 2021, 46, 1438–1441. [Google Scholar] [CrossRef]
- Yurgens, V.; Zuber, J.A.; Flågan, S.; De Luca, M.; Shields, B.J.; Zardo, I.; Maletinsky, P.; Warburton, R.J.; Jakubczyk, T. Low-charge-noise nitrogen-vacancy centers in diamond created using laser writing with a solid-immersion lens. ACS Photonics 2021, 8, 1726–1734. [Google Scholar] [CrossRef]
- Kurita, T.; Shimotsuma, Y.; Fujiwara, M.; Fujie, M.; Mizuochi, N.; Shimizu, M.; Miura, K. Direct writing of high-density nitrogen-vacancy centers inside diamond by femtosecond laser irradiation. Appl. Phys. Lett. 2021, 118, 214001. [Google Scholar] [CrossRef]
- Kudryashov, S.I.; Danilov, P.A.; Sdvizhenskii, P.A.; Lednev, V.N.; Chen, J.; Ostrikov, S.A.; Kuzmin, E.V.; Kovalev, M.S.; Levchenko, A.O. Transformations of the Spectrum of an Optical Phonon Excited in Raman Scattering in the Bulk of Diamond by Ultrashort Laser Pulses with a Variable Duration. JETP Lett. 2022, 115, 251–255. [Google Scholar] [CrossRef]
- Kudryashov, S.; Danilov, P.; Smirnov, N.; Levchenko, A.; Kovalev, M.; Gulina, Y.; Kovalchuk, O.; Ionin, A. Femtosecond-laser-excited luminescence of the A-band in natural diamond and its thermal control. Opt. Mater. Express 2021, 11, 2505–2513. [Google Scholar] [CrossRef]
- Zaitsev, A.M. Optical Properties of Diamond: A Data Handbook; Springer Science & Business Media: Berlin/Heidelberg, Germany, 2013. [Google Scholar]
- Sobolev, E.V.; Eliseev, A.P. Thermostimulated luminescence and phosphorescence of natural diamonds at low temperatures. Zhurnal Strukturnoi Khimii 1976, 17, 933–935. [Google Scholar] [CrossRef]
- Field, J.E. (Ed.) The Properties of Natural and Synthetic Diamond; Academic Press: London, UK, 1992. [Google Scholar]
- Dobrinets, I.A.; Vins, V.G.; Zaitsev, A.M. HPHT-Treated Diamonds. Diamonds Forever; Springer: Berlin/Heidelberg, Germany, 2013. [Google Scholar]
- Bokii, G.B.; Bezrukov, G.N.; Klyuev, Y.A.; Naletov, A.M.; Nepsha, V.I. Natural and Synthetic Diamonds; Nauka: Moscow, Russia, 1986. (In Russian) [Google Scholar]
- Collins, A.T. The characterisation of point defects in diamond by luminescence spectroscopy. Diam. Relat. Mater. 1992, 1, 457–469. [Google Scholar] [CrossRef]
- Gheeraert, E.; Deneuville, A.; Bonnot, A.M.; Abello, L. Defects and stress analysis of the Raman spectrum of diamond films. Diam. Relat. Mater. 1992, 1, 525–528. [Google Scholar] [CrossRef]
- Collins, A.T. Excited states of the H3 vibronic centre in diamond. J. Phys. C Solid State Phys. 1983, 16, 6691. [Google Scholar] [CrossRef]
- Collins, A.T.; Connor, A.; Ly, C.-H.; Shareef, A.; Spear, P.M. High-temperature annealing of optical centers in type-I diamond. J. Appl. Phys. 2005, 97, 083517. [Google Scholar] [CrossRef]
- Ju, Z.; Lin, J.; Shen, S.; Wu, B.; Wu, E. Preparations and applications of single color centers in diamond. Adv. Phys. 2021, 6, 1858721. [Google Scholar] [CrossRef]
- Kempkes, M.; Zier, T.; Singer, K.; Garcia, M.E. Ultrafast nonthermal NV center formation in diamond. Carbon 2021, 174, 524–530. [Google Scholar] [CrossRef]
- Kozák, M.; Trojánek, F.; Malý, P. Large prolongation of free-exciton photoluminescence decay in diamond by two-photon excitation. Opt. Lett. 2012, 37, 2049–2051. [Google Scholar] [CrossRef]
- Collins, A.T. Vacancy enhanced aggregation of nitrogen in diamond. J. Phys. C Solid State Phys. 1980, 13, 2641–2650. [Google Scholar] [CrossRef]
- Danilov, P.; Kuzmin, E.; Rimskaya, E.; Chen, J.; Khmelnitskii, R.; Kirichenko, A.; Rodionov, N.; Kudryashov, S. Up/Down-Scaling Photoluminescent Micromarks Written in Diamond by Ultrashort Laser Pulses: Optical Photoluminescent and Structural Raman Imaging. Micromachines 2022, 13, 1883. [Google Scholar] [CrossRef]
- Kudryashov, S.I.; Vins, V.G.; Danilov, P.A.; Kuzmin, E.V.; Muratov, A.V.; Kriulina, G.Y.; Chen, J.; Kirichenko, A.N.; Gulina, Y.S.; Ostrikov, S.A.; et al. Permanent optical bleaching in HPHT-diamond via aggregation of C-and NV-centers excited by visible-range femtosecond laser pulses. Carbon 2023, 201, 399–407. [Google Scholar] [CrossRef]
- Thonke, K.; Schliesing, R.; Teofilov, N.; Zacharias, H.; Sauer, R.; Zaitsev, A.M.; Kanda, H.; Anthony, T.R. Electron–hole drops in synthetic diamond. Diam. Relat. Mater. 2000, 9, 428–431. [Google Scholar] [CrossRef]
- Kudryashov, S.; Stsepuro, N.; Danilov, P.; Smirnov, N.; Levchenko, A.; Kovalev, M. Cumulative defocusing of sub-MHz-rate femtosecond-laser pulses in bulk diamond envisioned by transient A-band photoluminescence. Opt. Mater. Express. 2021, 11, 2234–2241. [Google Scholar] [CrossRef]
Disclaimer/Publisher’s Note: The statements, opinions and data contained in all publications are solely those of the individual author(s) and contributor(s) and not of MDPI and/or the editor(s). MDPI and/or the editor(s) disclaim responsibility for any injury to people or property resulting from any ideas, methods, instructions or products referred to in the content. |
© 2023 by the authors. Licensee MDPI, Basel, Switzerland. This article is an open access article distributed under the terms and conditions of the Creative Commons Attribution (CC BY) license (https://creativecommons.org/licenses/by/4.0/).